




Abstract
Against the backdrop of implementing the national carbon peaking and carbon neutrality strategy, this study proposes a standardized evaluation system for building low (zero) carbon industrial parks, which encompasses principles of construction, evaluation methods, indicators system, data collection, indicators calculation, evaluation results, and implementation steps. This proposal follows a deep understanding on the challenges facing industrial parks, such as trade barriers and discrepancies in technical standards, as well as opportunities under the context of high-quality development. Through quantitative analysis on the layout and distribution characteristics of government-approved industrial parks, it figures out the status quo of industrial parks in the development zone. Moreover, a case study of an economic development zone in the southeastern coastal area is made to validate the evaluation. Finally, this paper gives suggestions on the dynamic adjustment of indicators of the evaluation system and the collection of full-sample data.
Introduction
Due to the severe reality of global climate change, the low-carbon economy has become an inevitable choice for world’s economic development. Low-carbon economic zones, therefore, play a crucial role as their construction influences regional even national low-carbon efforts.1,2 In recent years, the research on low-carbon (zero) carbon industrial parks is increasing gradually, involving many aspects. For example, Sang et al. studied the integrated energy system optimization and risk resilience of near-zero carbon parks under the background of carbon tax, and proposed two low-carbon energy transition roadmaps based on natural gas and electricity, providing important references for energy system optimization. 3 Wang et al. developed an industrial park carbon data management platform based on digital twin technology, which supports efficient energy conservation and carbon reduction decisions through real-time collection of energy consumption data and significantly improves the transparency of carbon data. 4 Luo et al. carried out multi-objective optimization of the building envelope structure of office park, comprehensively considering energy consumption, thermal comfort, hidden carbon and economy, providing an important reference for low-carbon optimization at the building level. 5 Fang et al. designed the energy storage scenario of the zero-carbon big data industrial park from the perspective of load-storage collaboration of the source network, analyzed the corresponding business model, and provided practical guidance for the application of energy storage technology. 6 Yao et al. proposed a near-zero carbon park scheduling model based on the synergistic effect of waste treatment and carbon capture gas power plants, and verified the effectiveness of the model in improving system economy and renewable energy absorption capacity through simulation analysis. 7 Yu et al. conducted classification and case study on the pilot low-carbon industrial parks in China, proposed classification methods of 3H, 3L and hybrid industrial parks, and analyzed different types of low-carbon development paths. 8 Jiang et al studied the impact of material energy on low-carbon transformation of agricultural and rural industrial parks. 9 He et al studied the design of park-level energy systems with near-zero emissions. 10 Ju et al. studied the new micro-energy grid structure of power supply, heat source and electric dump gas. 11 Lyu et al. developed a land-industry-carbon comprehensive model, analyzed the energy consumption and carbon emission characteristics of industrial parks, and proposed two collaborative carbon peaking paths for industrial parks in China. 12 Huang et al. reviewed the development of China’s eco-industrial park standard system and studied the management mechanism of HJ/T 274-2015 on park environmental issues. 13 Gao et al. have evaluated the eco-efficiency of 18 industrial parks in Central China and analyzed the influencing factors of eco-efficiency. 14 Song and Zhou studied the impact of green industrial policies on industrial pollution emission. 15
To sum up, the existing research has achieved some achievements in the aspects of energy system optimization, data management, building envelope optimization, energy storage technology application, waste treatment and carbon capture synergy in low-carbon (zero) carbon industrial parks, but there are still many shortcomings in the construction and implementation of standardized evaluation system. Therefore, this paper develops a standardized evaluation system for low (zero) carbon industrial parks to evaluate the carbon levels of these parks, guide their construction and management, address problems, enhance the parks competitiveness, all in an effort to facilitate the sustainable development of the regional economy.
Industrial park layout and current development status
Overview
The industrial parks in China are the cluster of enterprises from similar or related industries. This proximity facilitates interaction and collaboration among businesses, makes it easy to form a complete industrial chain, reduces transportation and inventory costs, and enhances the production efficiency across the entire chain. In addition, industrial clusters within the parks can benefit from economies of scale, which lowers the production cost per unit through large-scale manufacturing.
Enterprises in the same park can share infrastructure, public services and technological resources. For instance, technology firms can share laboratories that they cannot afford alone, and test equipment at different time, which makes it possible for them to expand business reach and conduct R&D without the need to invest heavily on fixed assets.
In 2018, the National Development and Reform Commission, along with the Ministry of Science and Technology and four other departments, including the Ministry of Land and Resources, the Ministry of Housing and Urban-Rural Development, the Ministry of Commerce, and the General Administration of Customs, jointly released the Catalogue of Approved Development Zones in China.
4
Based on criteria such as land use, planning and construction, infrastructure, quantity control, industrial cluster, distinctive industrial features, development positioning, regional layout, environmental protection, and safety production, a total of 2543 development zones were approved, among which 552 were national level and 1991, provincial level. The distribution of these development zones accounts for the main characteristics of industrial parks. Figure 1 and Table 1 show the distribution of the approved national and provincial development zones. The distribution of approved national and provincial development zones. Number of approvals issued by the development zone over the years.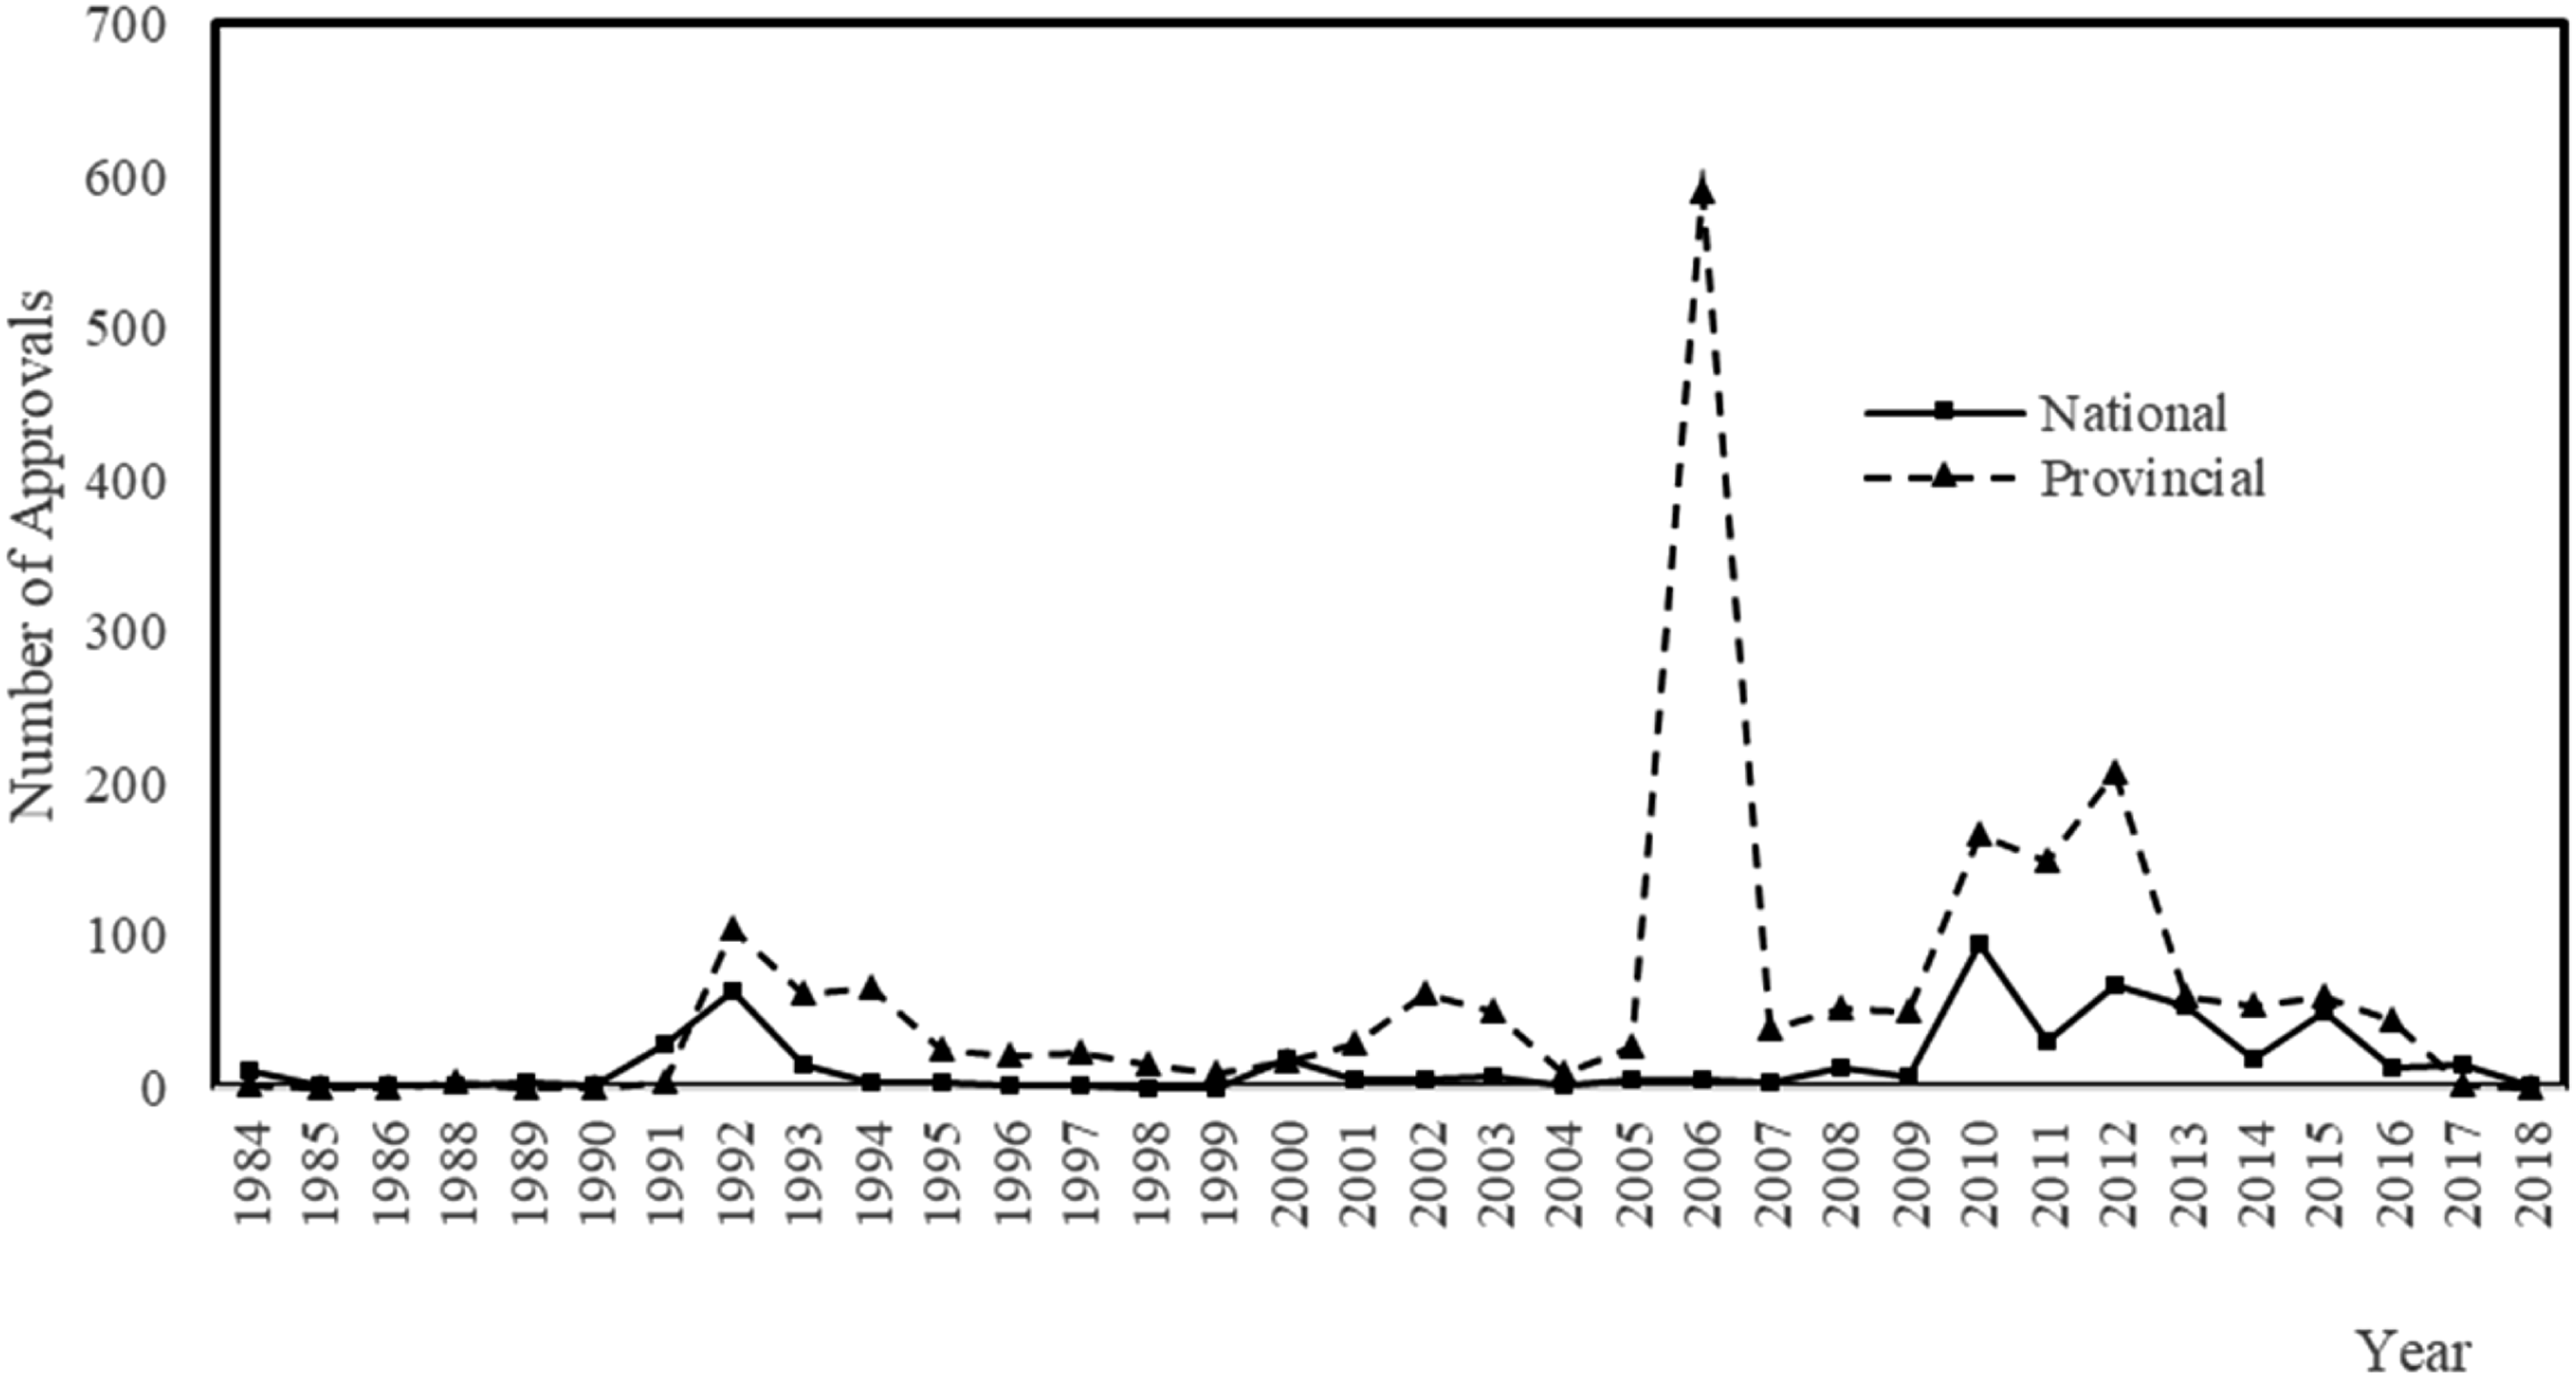
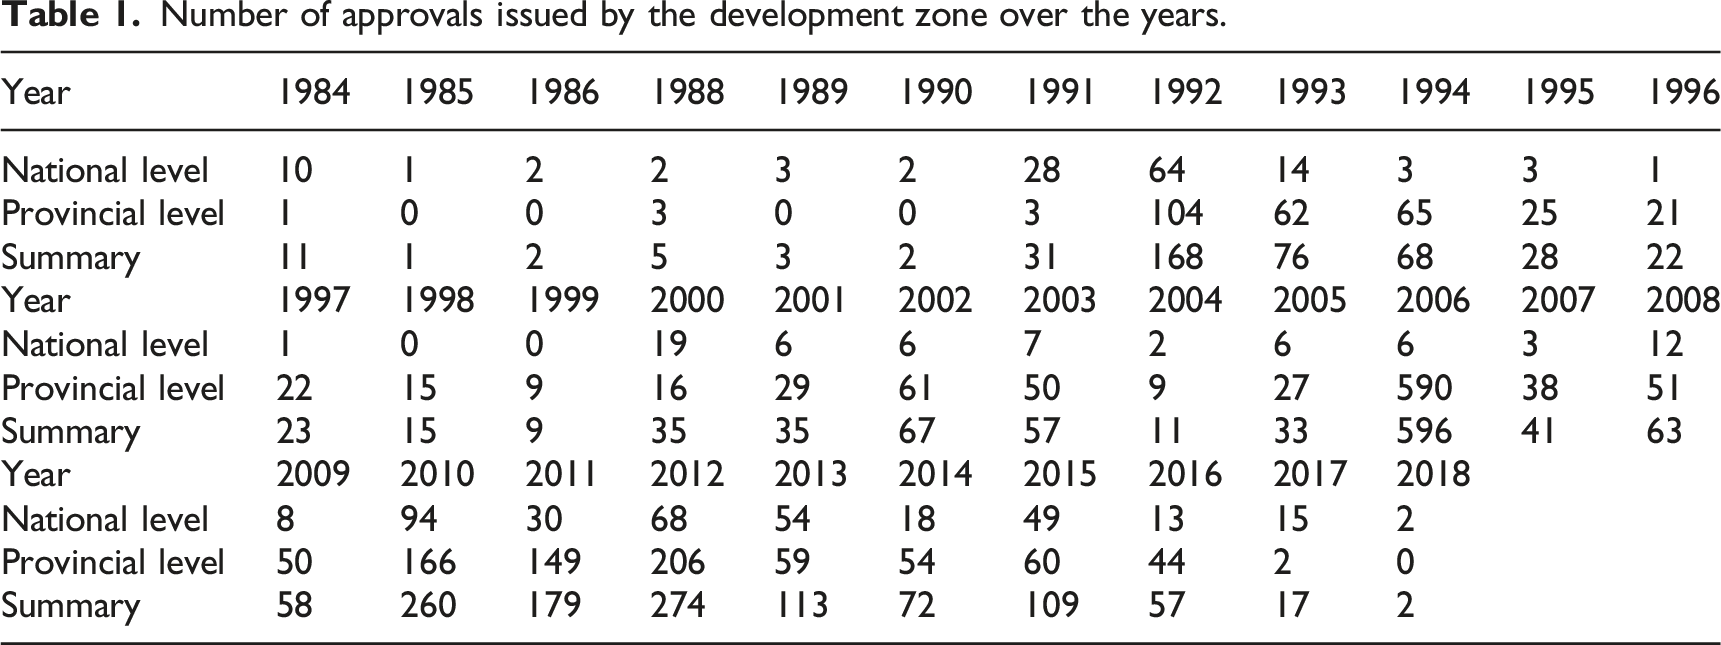
Approval numbers surged in 1992, 2006, and 2010–2013, aligning with national strategies to promote industrial clustering and regional growth.
Distribution characteristics
Statistics of development zones by province.
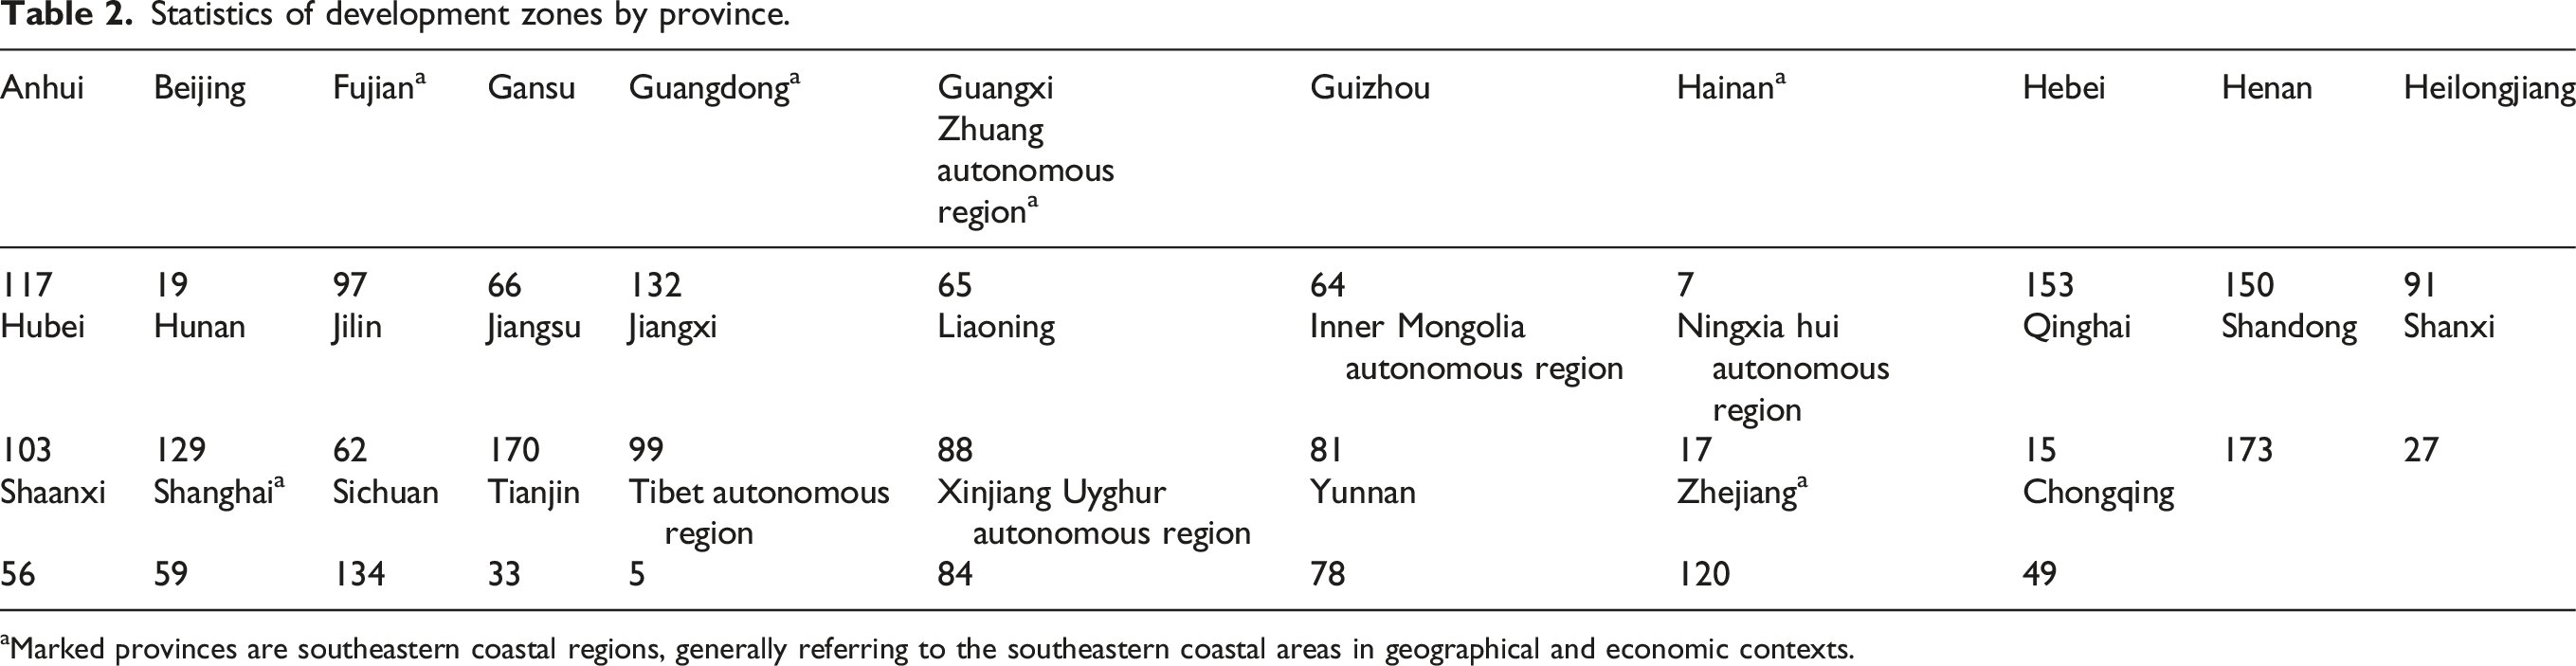
aMarked provinces are southeastern coastal regions, generally referring to the southeastern coastal areas in geographical and economic contexts.
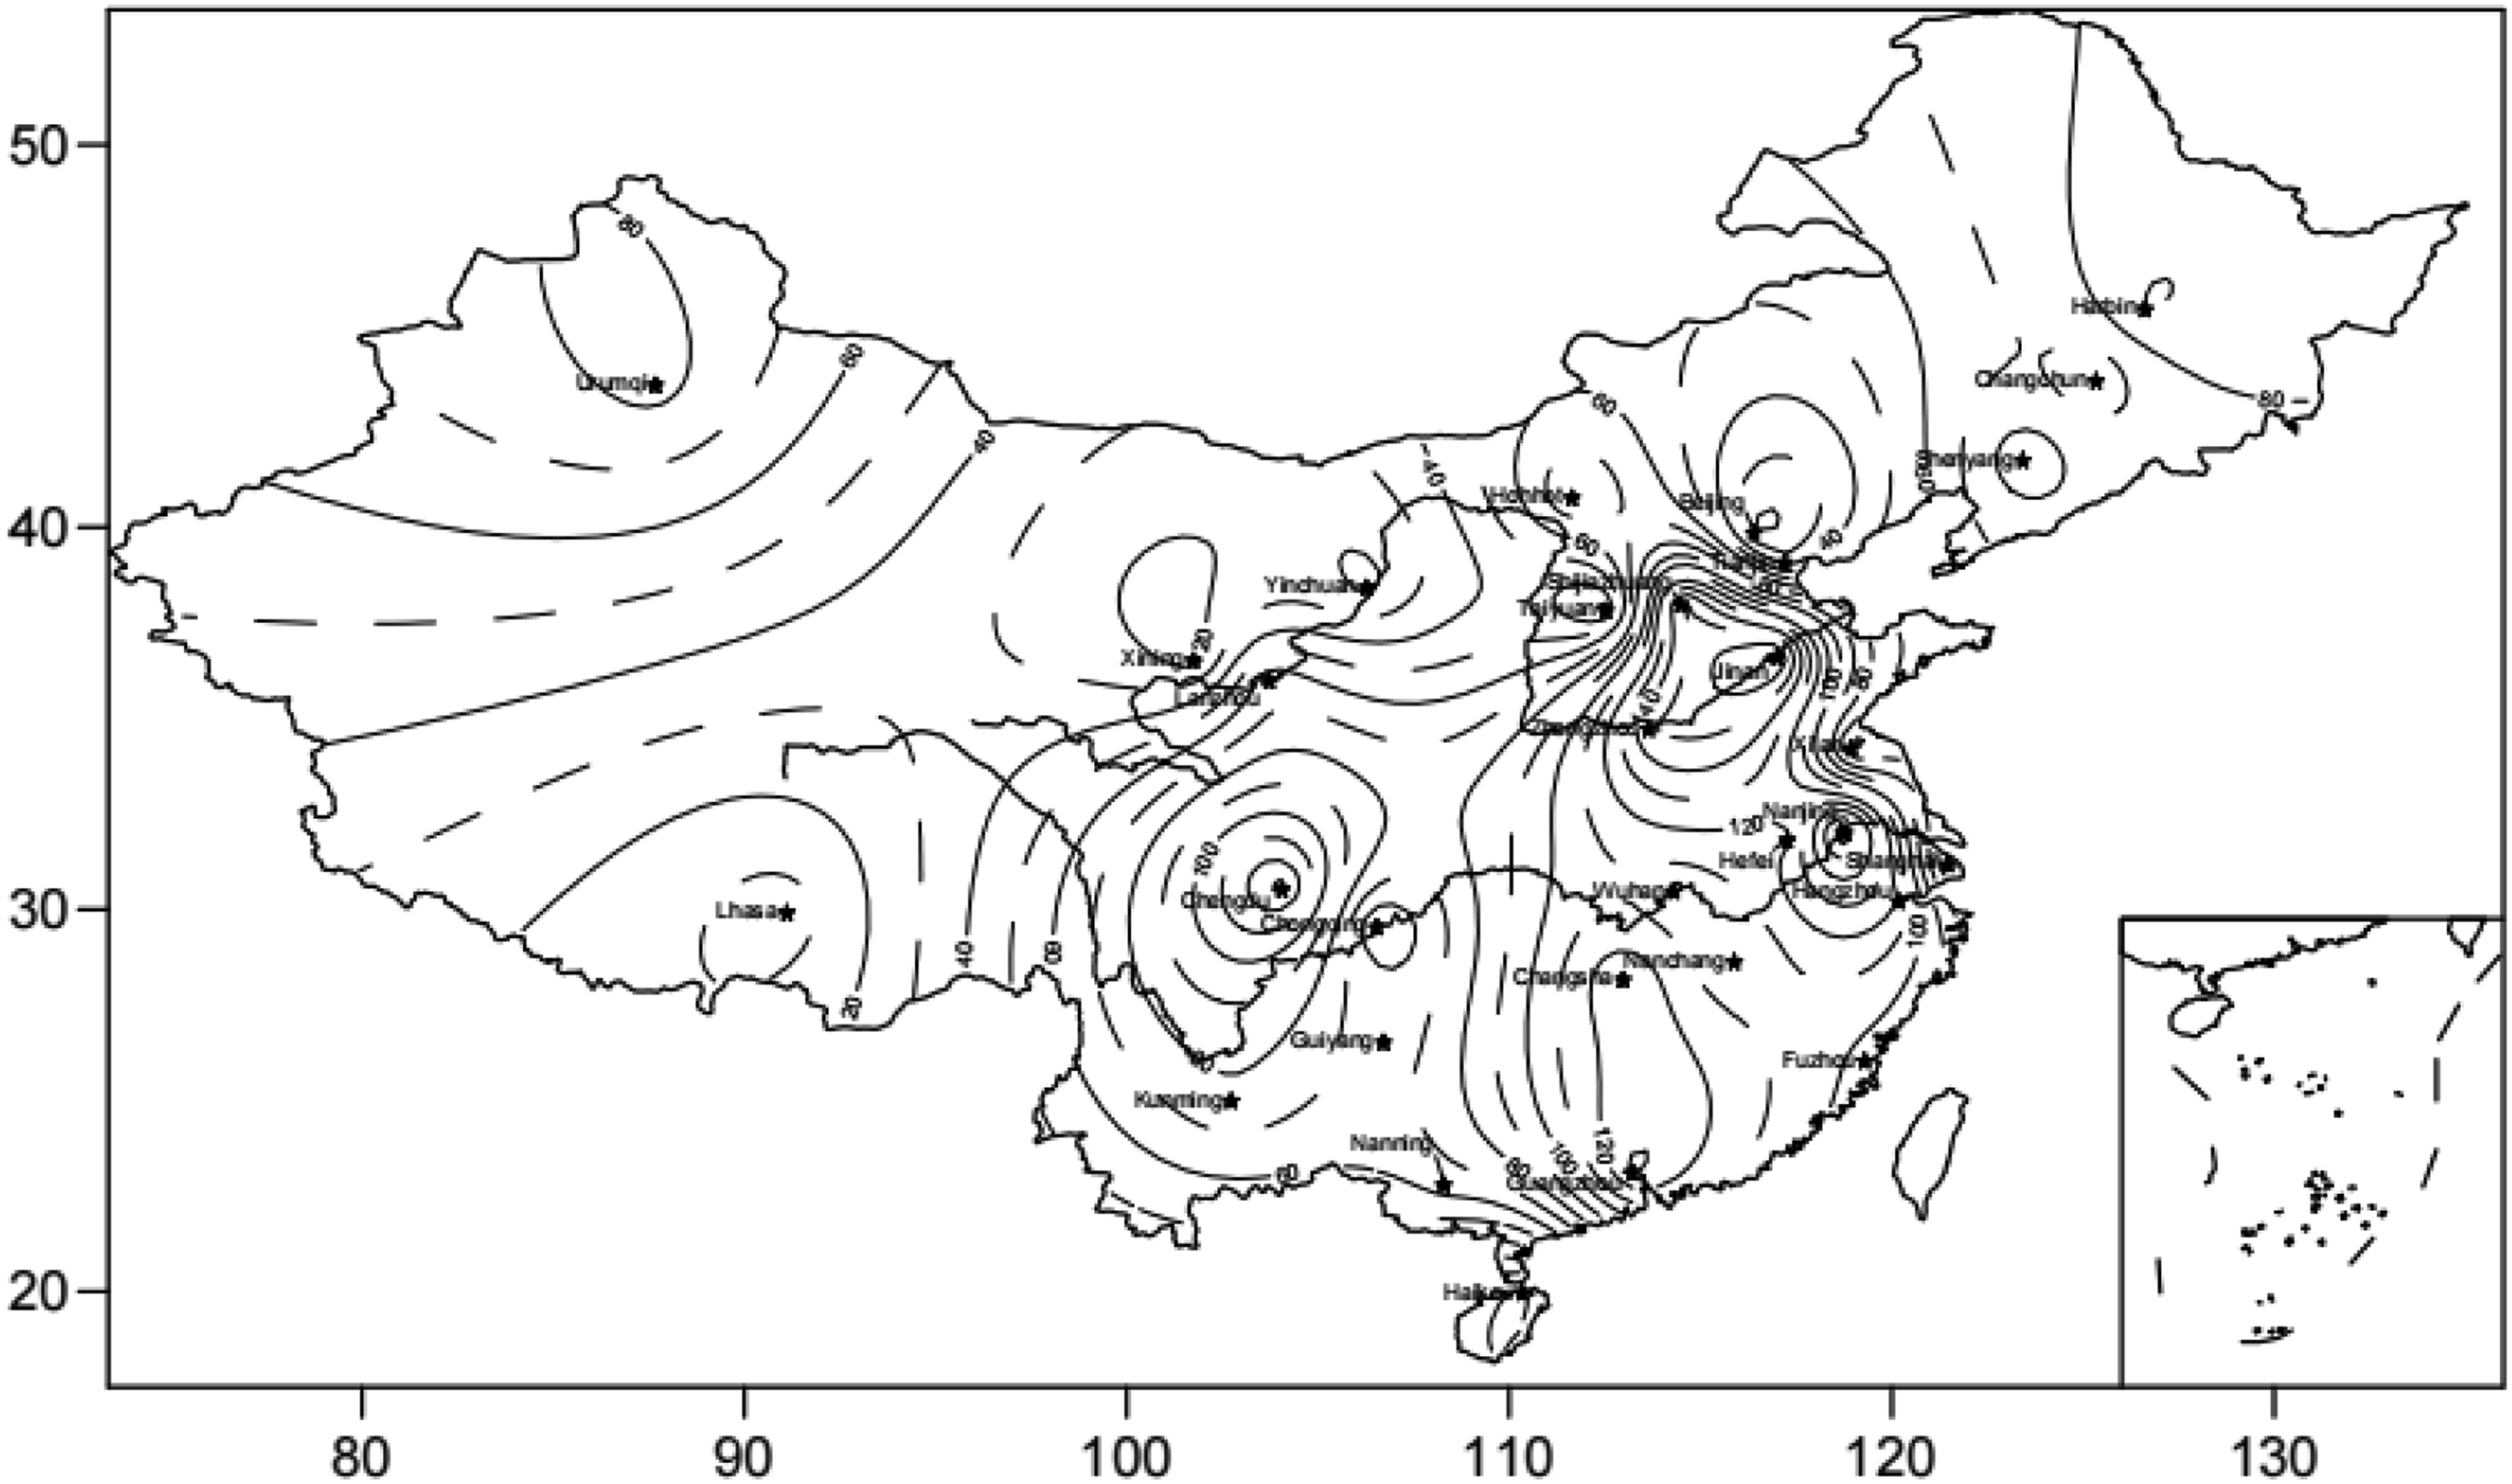
National development zone distribution trend chart.
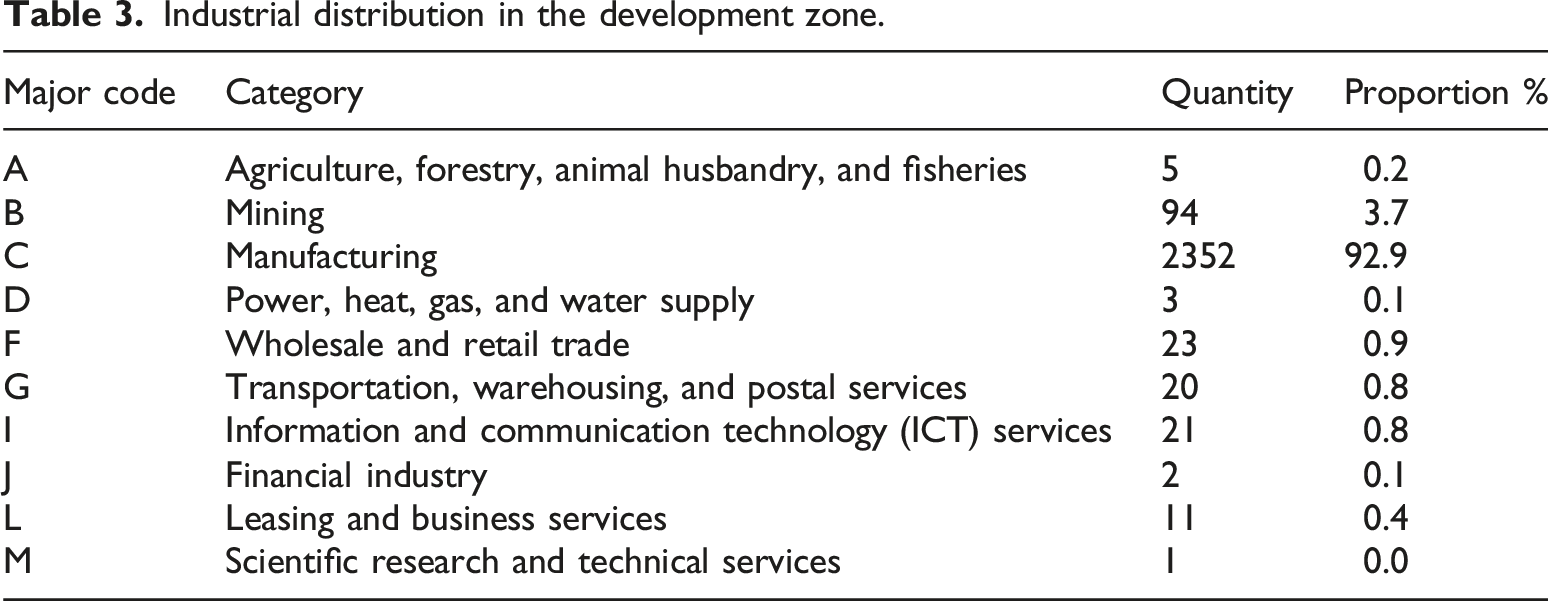
Industrial distribution in the development zone.
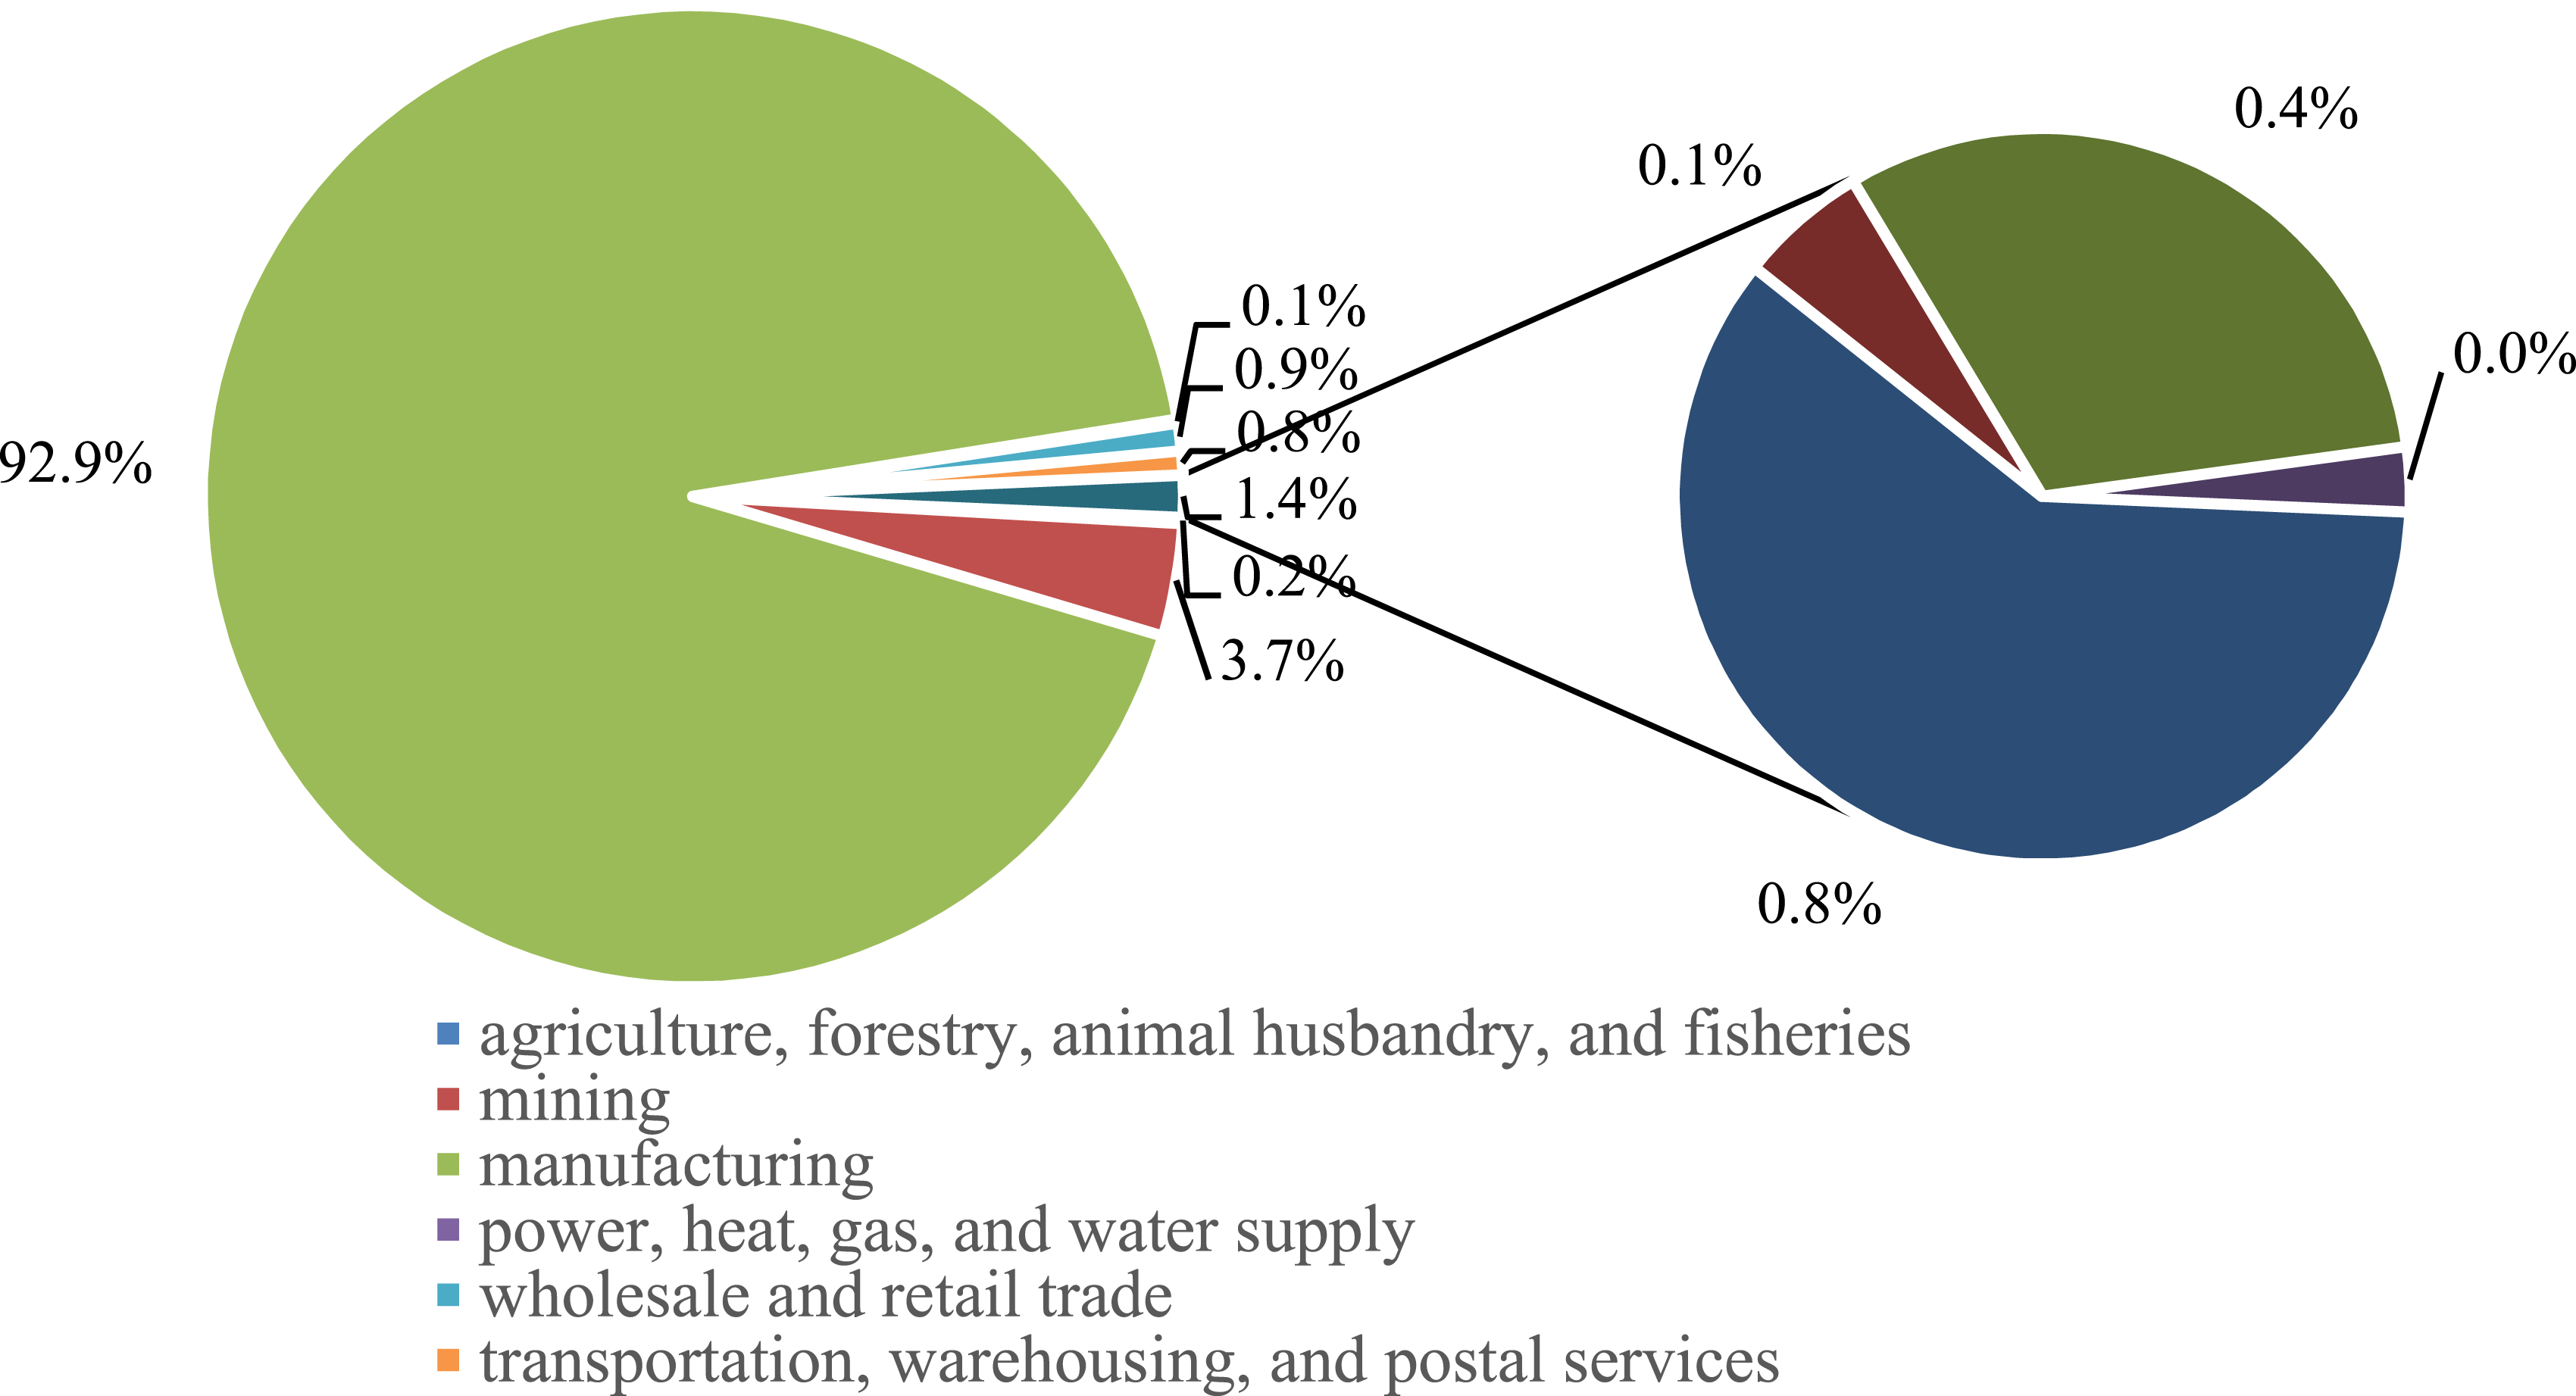
Industrial distribution map of the development zones.
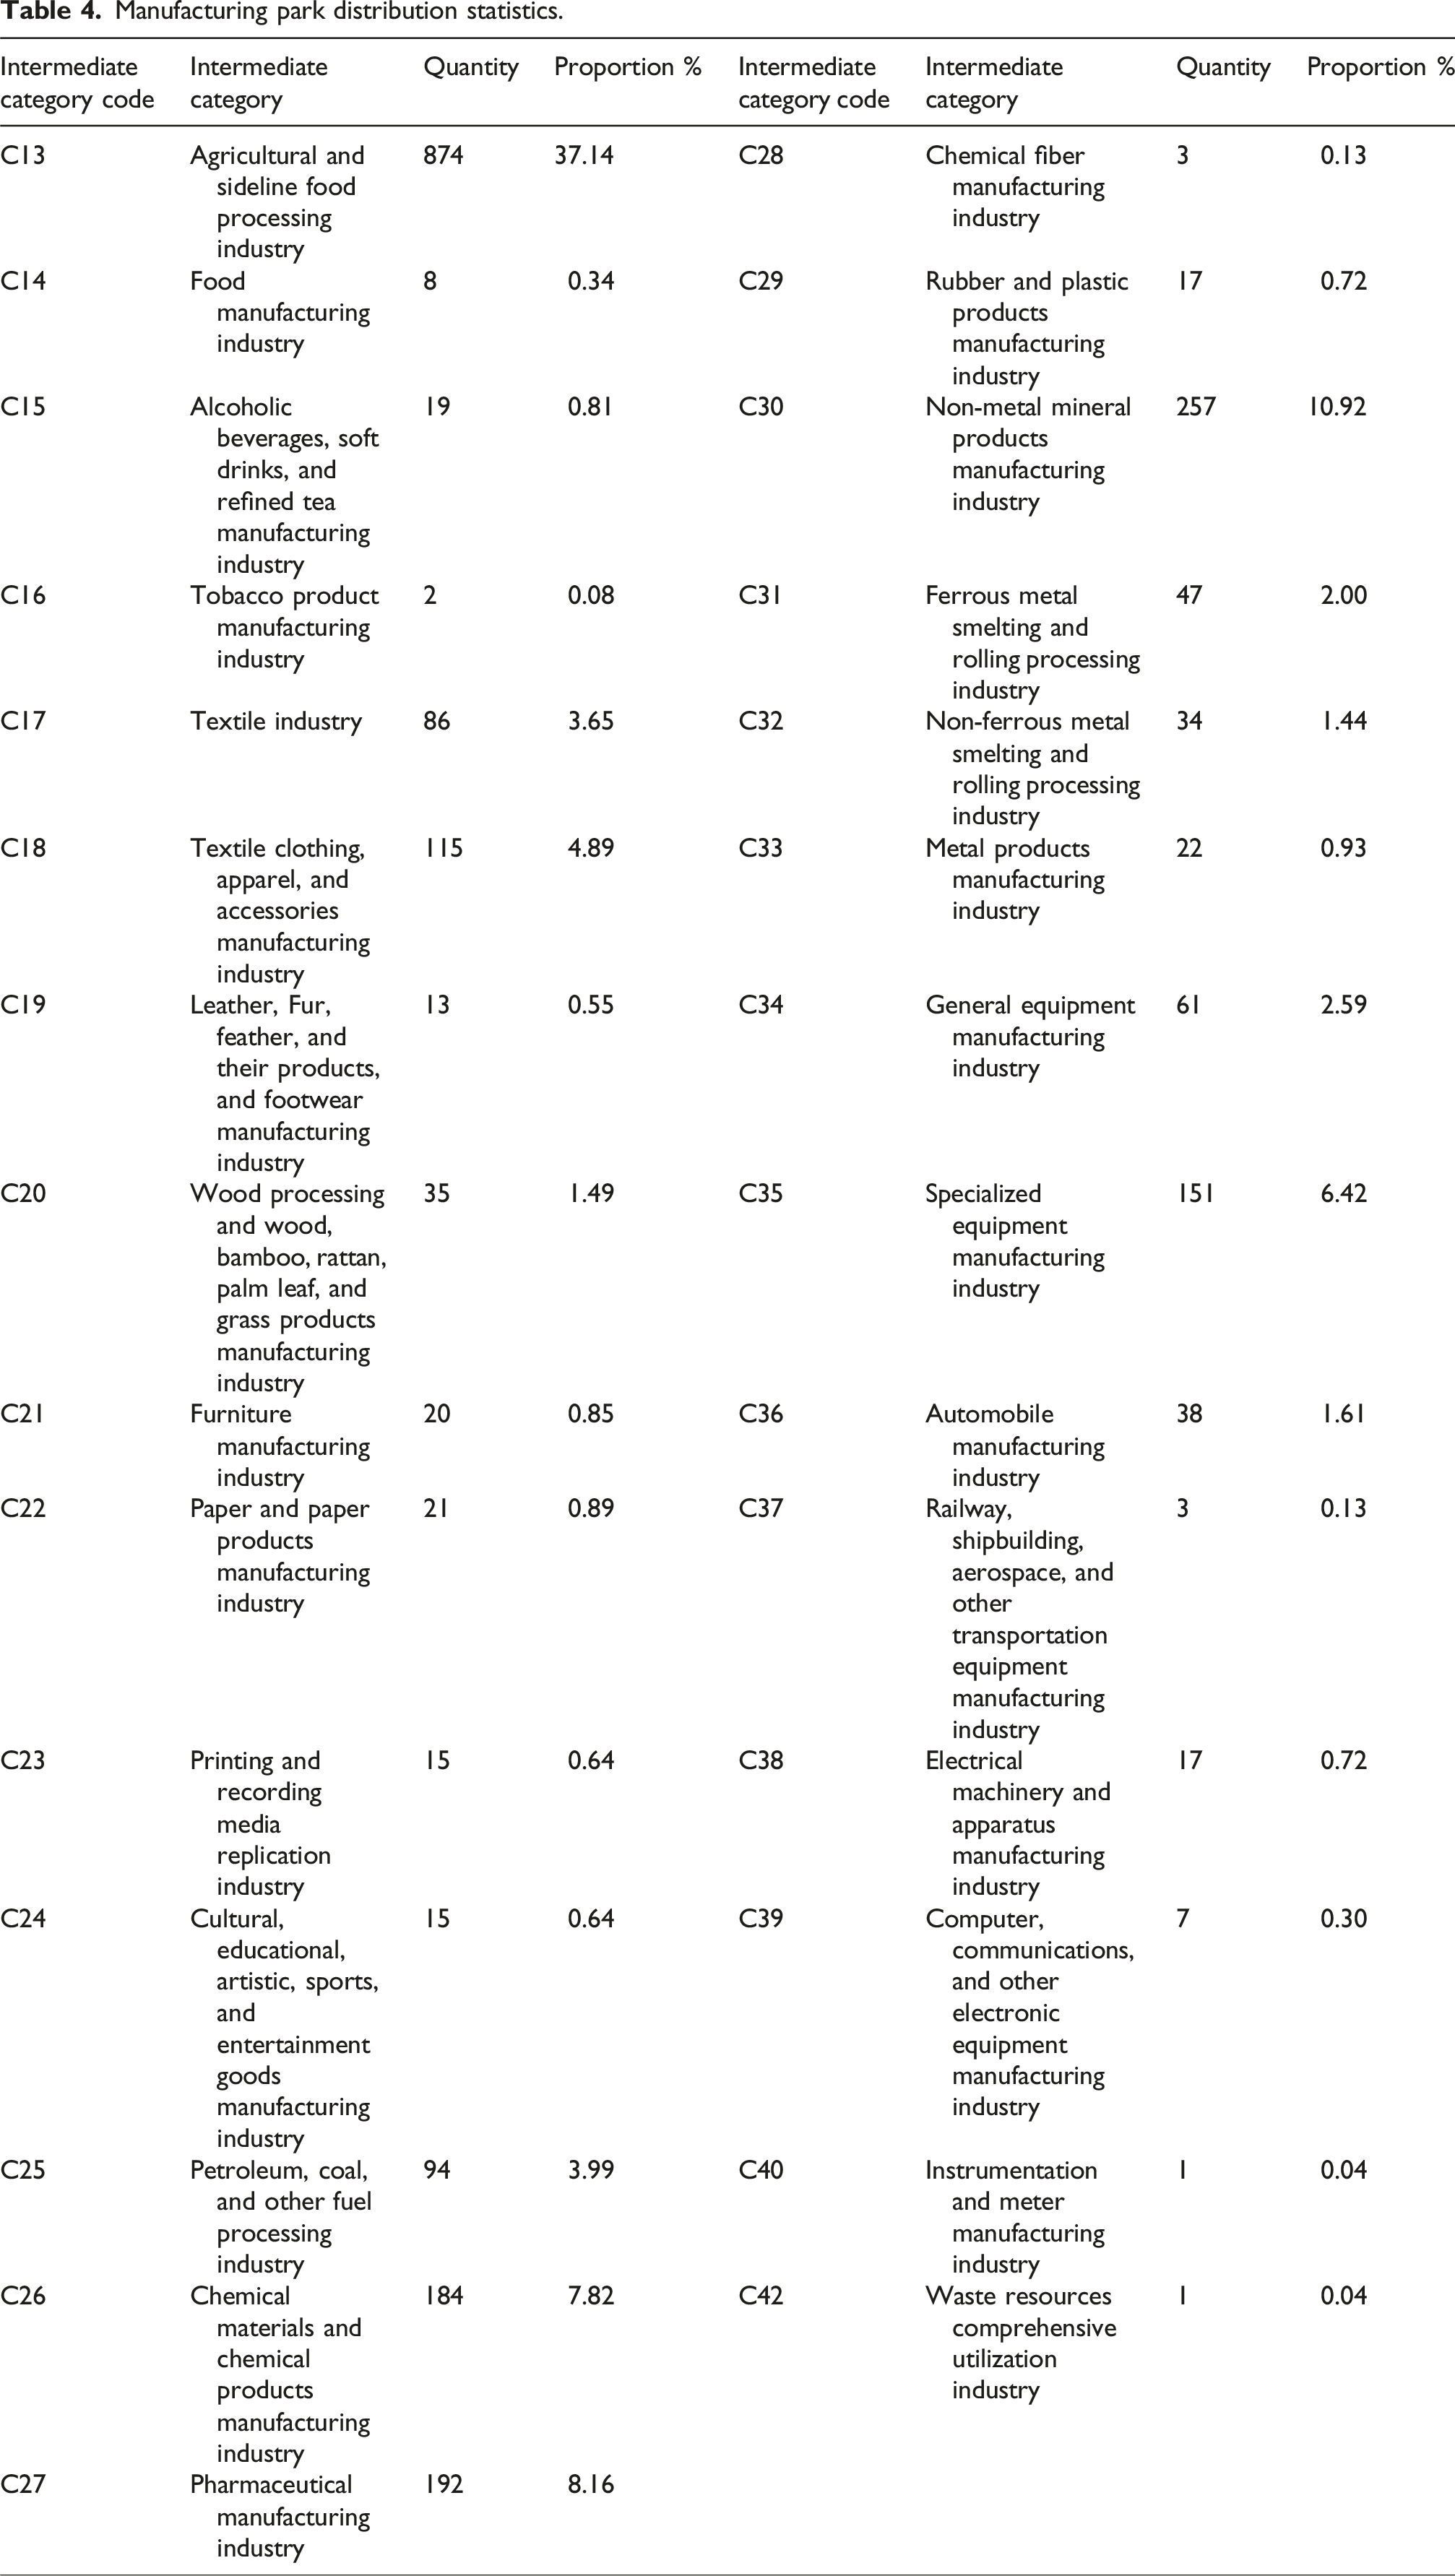
Manufacturing park distribution statistics.
Existing issues
Industrial Layout
In the early stages of industrial development, many industrial parks relied heavily on high-carbon industries. Traditional parks focused on heavy chemicals and energy-intensive and high-emission industries, such as steel and cement. These sectors consume vast amount of fossil fuels during production, resulting in high-carbon emissions and pose challenges to industrial upgrading. 8 The long-established industrial system and infrastructure, built around these high-carbon industries stand in the way to low-carbon transformation.
Even if some industrial parks are equipped with well-aligned industrial chains, they lack initiative in pursuing low carbon. For instance, in electronics information parks, component manufacturing and assembly enterprises may address energy supply issues independently, without considering the optimization of energy use and collaborative carbon management across the entire chain. The absence of effective low-carbon cooperation between upstream and downstream enterprises limits the recycling of resources and hierarchical energy utilization. Regional disparities are evident: southeastern coastal parks face stricter national carbon emission standards, while inland parks struggle with outdated energy infrastructure and limited access to green technologies. 11
Energy
Despite the attempt to introduce clean energy to the industrial parks, fossil fuel is still predominant in the energy structure. Numerous enterprises within the parks fail to give up using coal and natural gas-driven equipment, resulting in a low proportion of new energy in the energy supply. Moreover, the intermittent and unstable nature of clean energy use, coupled with a lack of efficient storage and smart energy management, hampers large-scale replacement to traditional energy sources.
In terms of energy management, some enterprises are plagued by energy waste due to inadequate monitoring and management technologies, so they cannot master the energy consumption during production. Discrepancies in energy use efficiency among enterprises also prevent the formation of a unified mechanism for improving efficiency and monitoring waste, which impedes the overall low-carbon development within the parks.
Competitiveness
In the shift to low-carbon processes, enterprises need invest a lot in low-carbon technological research and innovation, such as developing new energy-saving processes and carbon capture technologies. This is undoubtedly burdensome for small and medium-sized enterprises. The financial strain results in slow move to the application of low-carbon technologies, and place these enterprises at disadvantage compared to their peers from low-carbon development zones.
Currently, the low-carbon product market is underdeveloped, with limited consumer awareness and acceptance. Low-carbon products might be priced higher than traditional high-carbon ones, but their green value is under recognized by the market. Consequently, the motivation for enterprises to produce low-carbon products is dampened, posing challenges to nurturing low-carbon competitiveness and development. High-tech clusters in developed regions have stronger low-carbon R&D capabilities, whereas inland SMEs lack financial resources for green innovation.
Construction of standardized evaluation system
Principles of construction
The principle of scientific accuracy requires evaluation indicators to reflect industrial parks’ actual conditions and low-carbon performance effectively and objectively. The choosing of indicators should be built on sound theoretical foundation and practical experience, and should cover all critical aspects of low-carbon development. For instance, the comprehensive energy consumption per unit of industrial added value measures the total energy used per 10,000 yuan of industrial output, which is expressed in tons of standard coal. This metric directly reflects the energy efficiency in production processes and the park’s commitment to low-carbon practices. The metric can be kept at a low level when advanced low-carbon parks implement energy-saving technologies and management strategies.
Moreover, the calculation of indicators should be scientifically valid, practical, and replicable. An example in case is the carbon emission intensity reduction rate, which calculates the percentage decrease in carbon dioxide emission intensity compared to the previous year. The intensity is defined as the ratio of total CO2 emissions to the park’s GDP. Accurate measurement of CO2 emissions and GDP are need to ensure the reliability and precision of the results, in addition to scientifically robust calculation methods.
Finally, the indicator system should be dynamically evolving with technological advancements and improved management. As renewable energy technologies progress, the renewable energy consumption ratio will be a more important indicator. The system should reflect the change of effective indicators so as to guide parks to use renewable energy sources.
The principle of comprehensiveness requires that the indicator system is based on economic, environmental and social dimensions. Economic indicators should include industrial added value per unit of construction land and the reduction rate of energy consumption per GDP unit to illustrate the economic development level and energy utilization efficiency of the park. For instance, industrial added value per unit area of construction land represents the industrial output value generated per square meter, which measures the land use efficiency and economic output capability of the park.
Environment indicators should cover aspects such as the reduction rate of carbon emission intensity, the proportion of renewable energy consumption, wastewater generation per unit of industrial added value, and solid waste generation per unit of industrial added value. These metrics measure the influence of a park on the environment and resource utilization efficiency. For example, the proportion of renewable energy consumption indicates the percentage of renewable energy in the total energy consumption of a park. As more global attention is averted to environmental protection, parks are increasing their use of renewable energy sources such as solar and wind power to reduce reliance on traditional fossil fuels and lower carbon emissions.
In the social dimension, indicators may include the rate of household waste sorting and the centralized treatment rate of domestic sewage, which reflect a park’s contribution to and responsibility for the society. For instance, the household waste sorting rate refers to the percentage of sorted waste out of the total waste collected. This metric measures a park’s environmental awareness and management level in waste handling, playing a significant role in promoting waste sorting and resource recycling across the society.
In summary, by implementing the principles of scientific accuracy and comprehensiveness, the comprehensive evaluation system for low-carbon parks can accurately reflect a park’s level of carbon reduction and overall development capacity. This provides scientific guidance and evaluation standards for the planning, construction, operation, and management of the industrial park.
Evaluation methods
To better illustrate the weight of evaluation indicators, the following methods are typically used, individually or combined.
Expert Scoring Method
Expert scoring is commonly used to evaluate low-carbon economic zones. Experts with extensive knowledge and practical experience in the field of low-carbon economics, energy, and environmental science are invited to score the evaluation indicators based on their professional insights and understanding of low-carbon parks.
Analytic Hierarchy Process (AHP)
Together with expert scoring, AHP can be used to determine the weight of each evaluation indicator. The evaluation system for low-carbon industrial parks is divided into a goal layer (evaluation of the park’s low-carbon development level), a criteria layer (such as energy utilization, carbon emissions, and industrial decarbonization), and an indicator layer (specific indicators). By constructing a judgment matrix through expert comparisons of the importance of each layer, the relative weight of each indicator concerning the goal can be calculated. This can avoid the unduly influencing of a single indicator to the evaluation results.
Fuzzy Comprehensive Evaluation Method
Considering the inherent ambiguities in evaluating low-carbon industrial parks, the results of expert scoring can be processed through fuzzy treatment. By establishing membership functions, how much an indicator is affiliated to different evaluation levels is quantified. The fuzzy evaluation results of all indicators are then synthesized to obtain a comprehensive assessment of a park’s low-carbon development level.
In this study, the expert scoring method is primarily utilized to determine the weight of evaluation indicators.
Evaluation indicator system
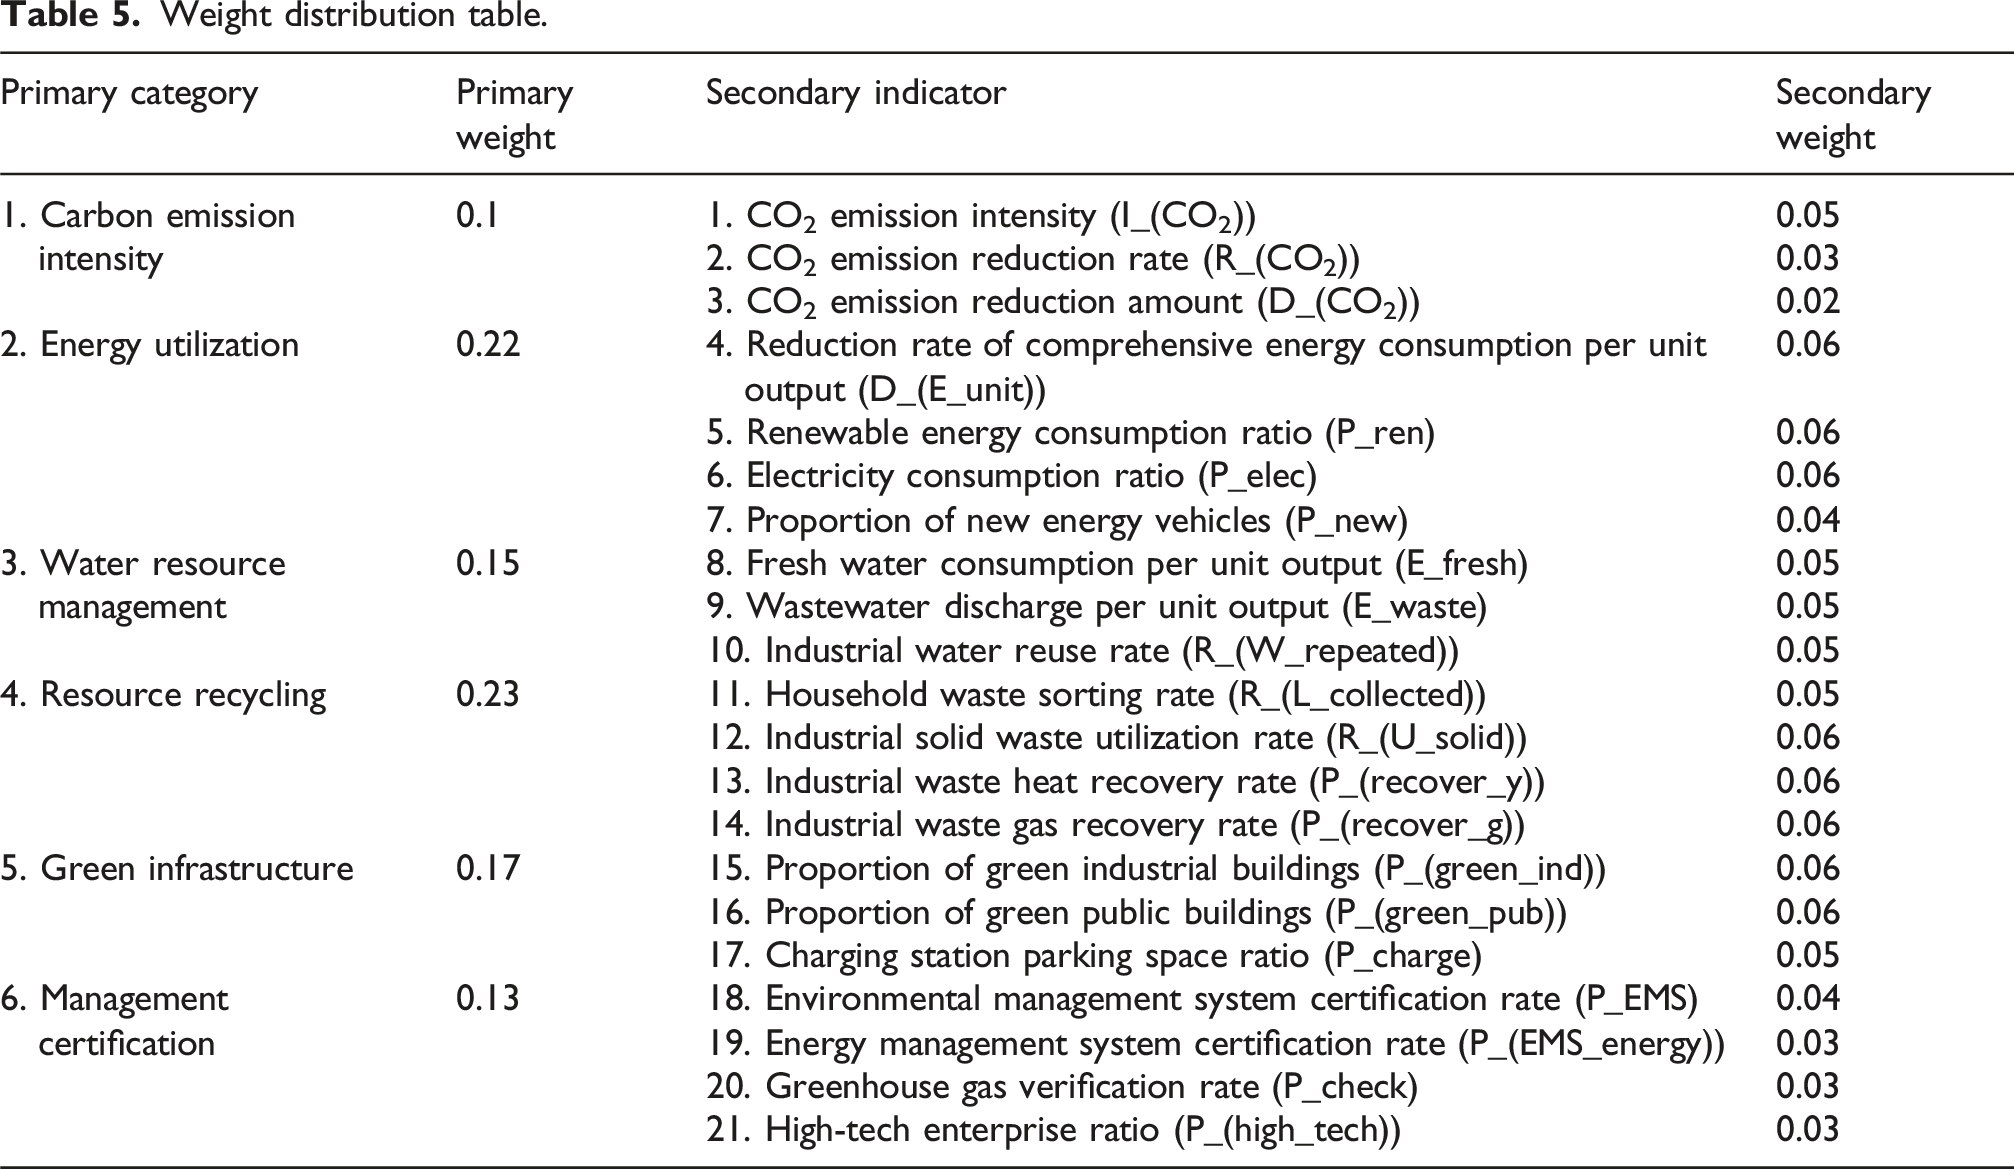
The standardized evaluation system for low-carbon parks includes six primary indicators: carbon emission intensity, energy utilization, ecological environment, resource recycling, infrastructure, and operational management, along with 21 secondary indicators (as shown in Figure 4). Standardized evaluation indicator system for low-carbon economic zones.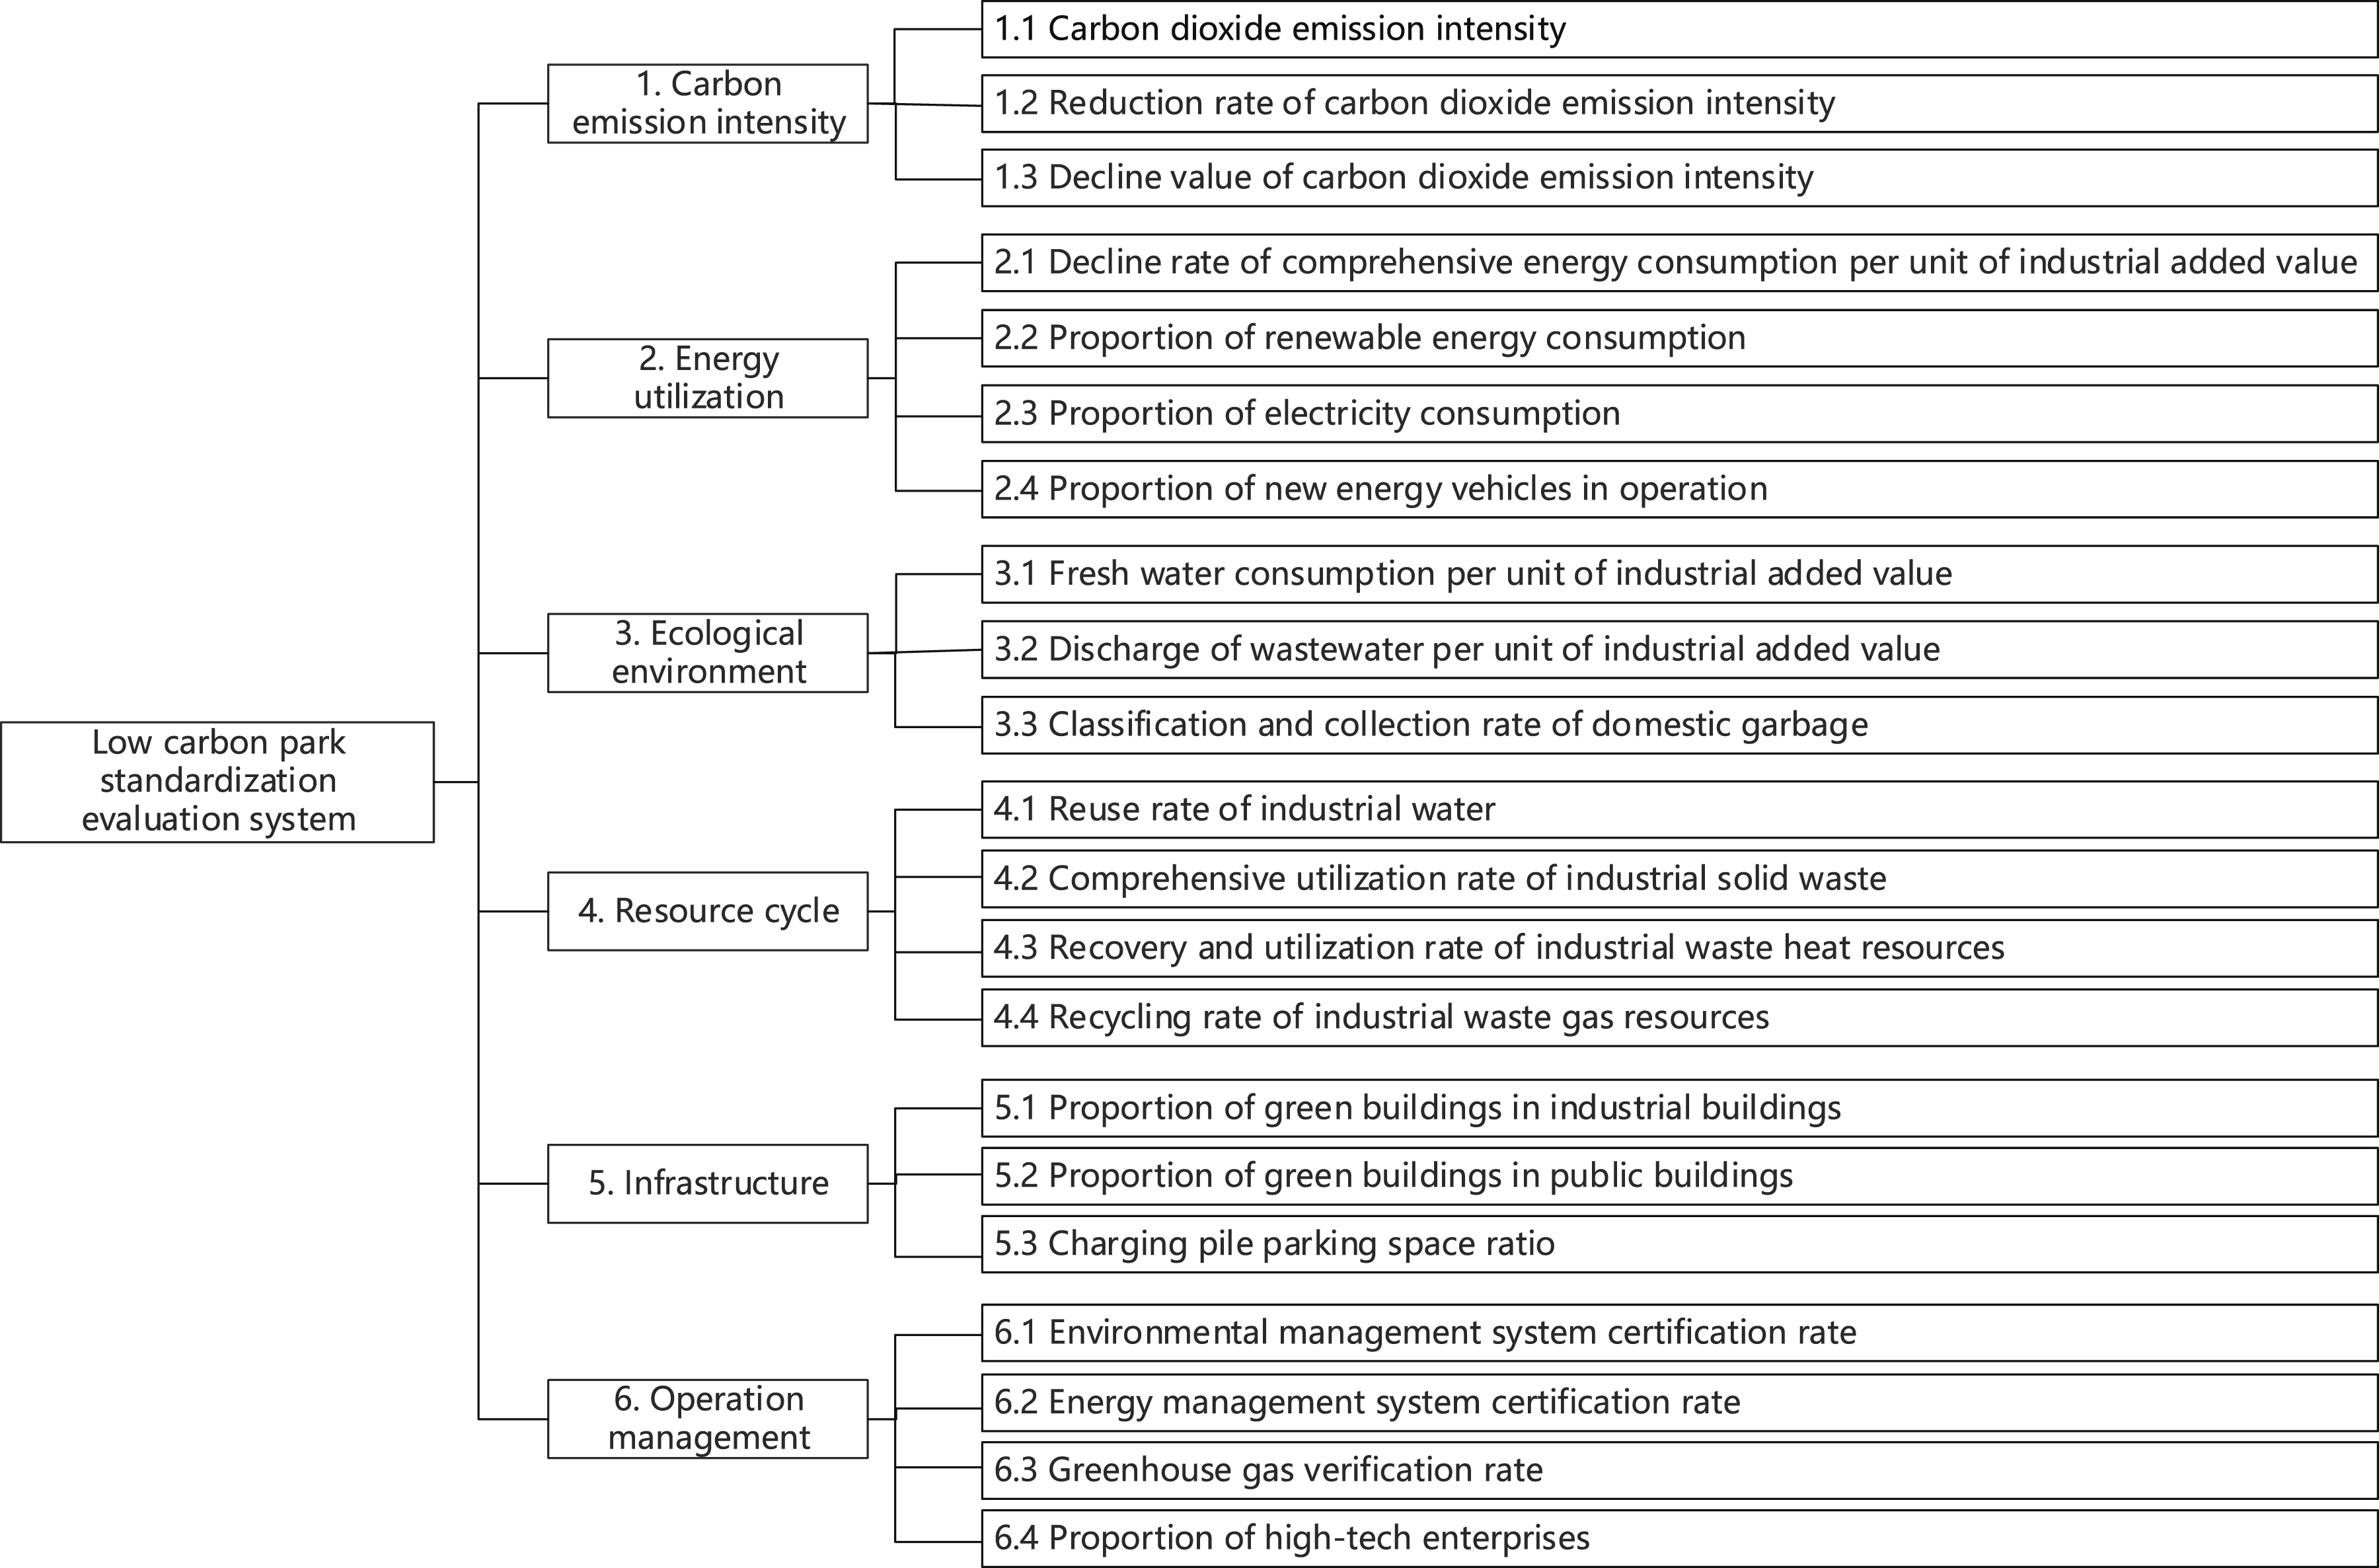
Weight distribution table.
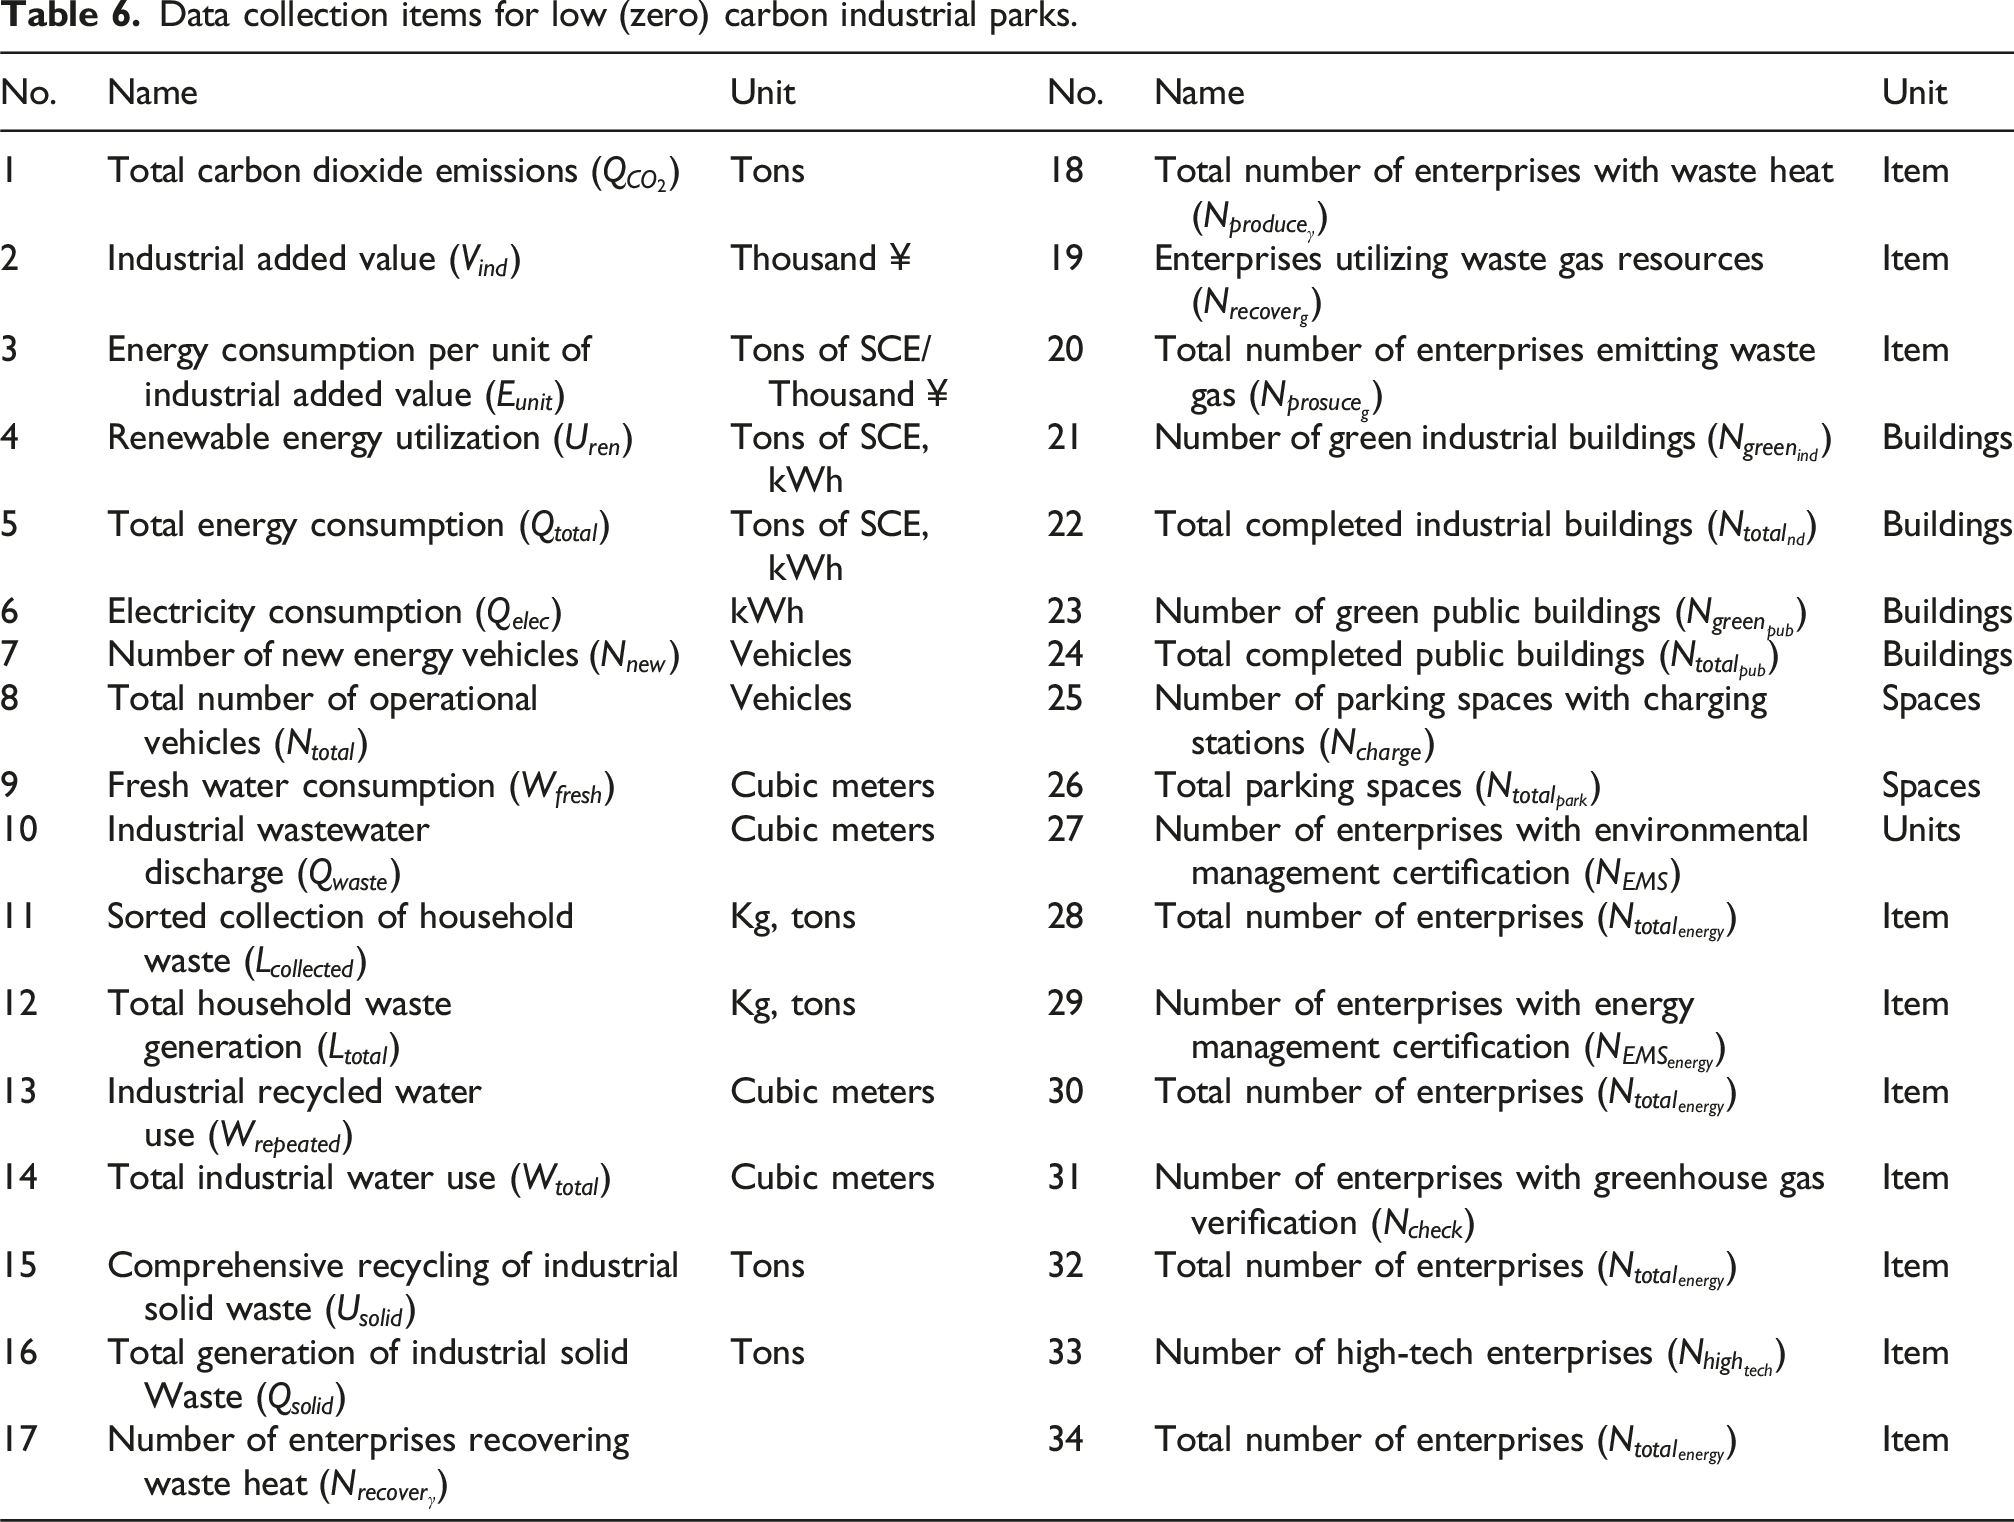
Evaluation data collection
Data collection items for low (zero) carbon industrial parks.
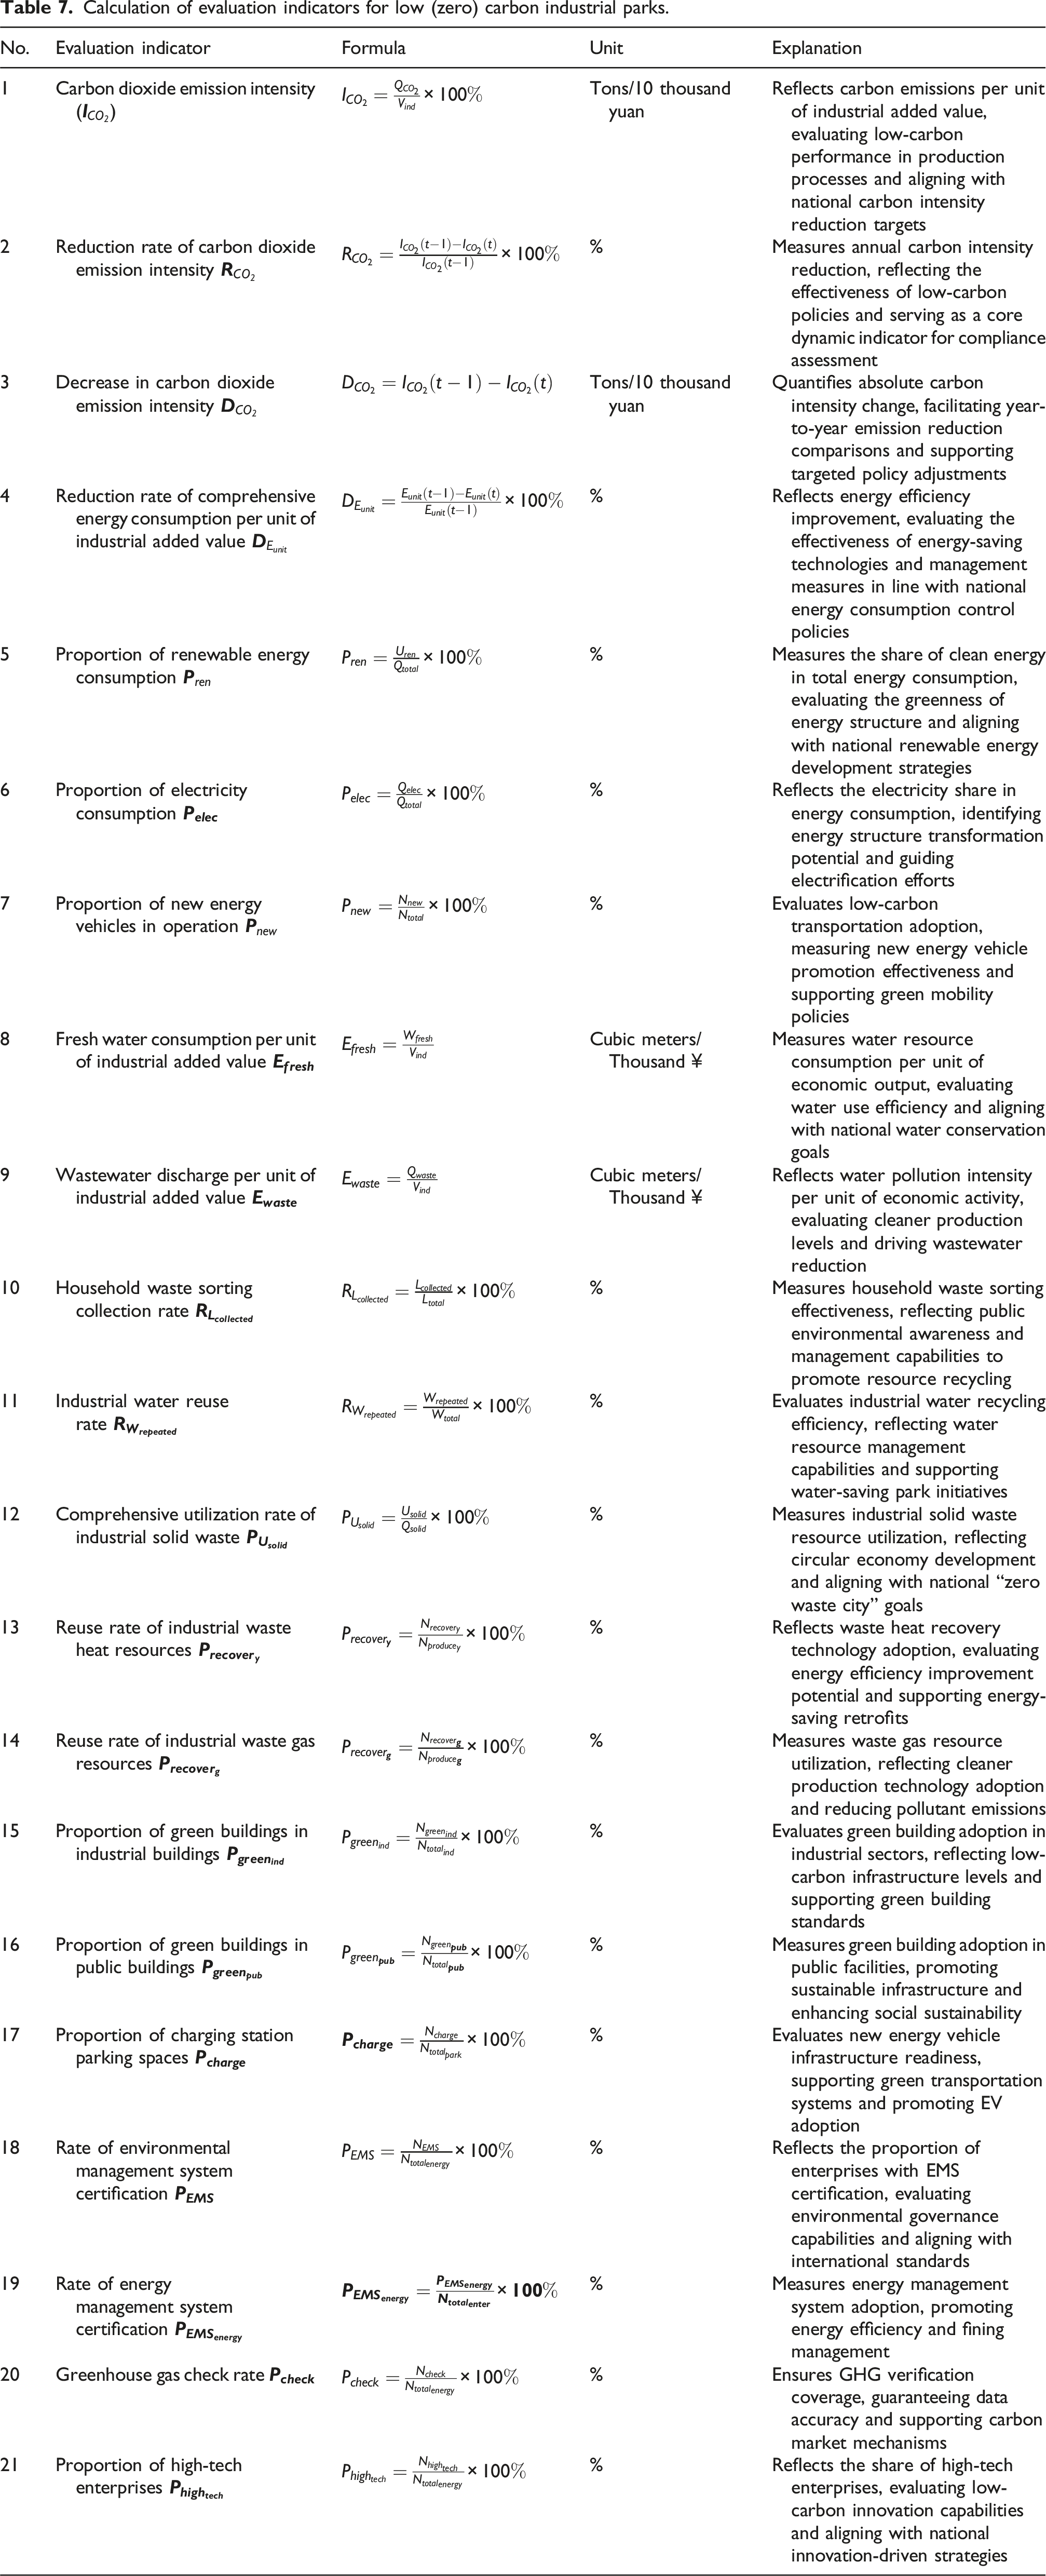
Calculation of evaluation indicators
Calculation of evaluation indicators for low (zero) carbon industrial parks.
Evaluation results
Indicator setting
Assume that the evaluation indicator system for the low-carbon industrial park comprises (n) primary indicators, denoted as
Set the weight of a primary indicator
For the secondary indicator
Scoring of indicators
The score of the secondary indicator
The score for the primary indicator 
The total evaluation score for the low-carbon industrial park (S) is derived from a weighted sum of the primary indicator scores, calculated as equation (2):
Representation of results
Industrial parks with scores below 60 points are classified as non-compliant low (zero) carbon parks, while those with over 60 points are categorized into the following three levels. ——Excellent: 90 points and above ——Good: 75 to 89 points ——Passable: 60 to 74 points
Case application
General overview
An economic development zone in the southeast coastal area was approved by the National Development and Reform Commission in 2006, whose major economic sectors cover both traditional and emerging industries. Traditional ones include textiles and apparel, footwear manufacturing, food and beverage, machinery manufacturing, and paper products. Among them, the total output of the textile and apparel cluster exceeds 100 billion, while the food processing cluster surpasses 50 billion. Many well-known leading enterprises have been nurtured in the park. By November 2024 (source: Qichacha), there are 2143 enterprises in agricultural and sideline food processing (C13), food manufacturing and liquor (C14), beverages, and refined tea manufacturing (C15), with total output exceeding 110 billion yuan. There are 218 high-tech enterprises, 6 specialized “Little Giant” enterprises, 53 provincial specialized enterprises, and 120 provincial innovative enterprises. The effects of industrial clustering and economic growth are significant, paving the way for the park to develop, showing great potential in standardization, industrial upgrading and digital transformation.
Data collection and indicator calculation
In the process of data collection and indicator calculation, we conducted field interviews and data verification to select 20 representative enterprises of various sizes. Based on a data model, we collected their data to estimate the overall sample. During this process, we encountered some key challenges, such as inconsistent reporting formats for energy consumption among enterprises and limited familiarity with low-carbon metrics among enterprise staff. To address these issues, we organized training sessions for over 50 managers to standardize data collection practices and enhance their understanding of evaluation indicators.
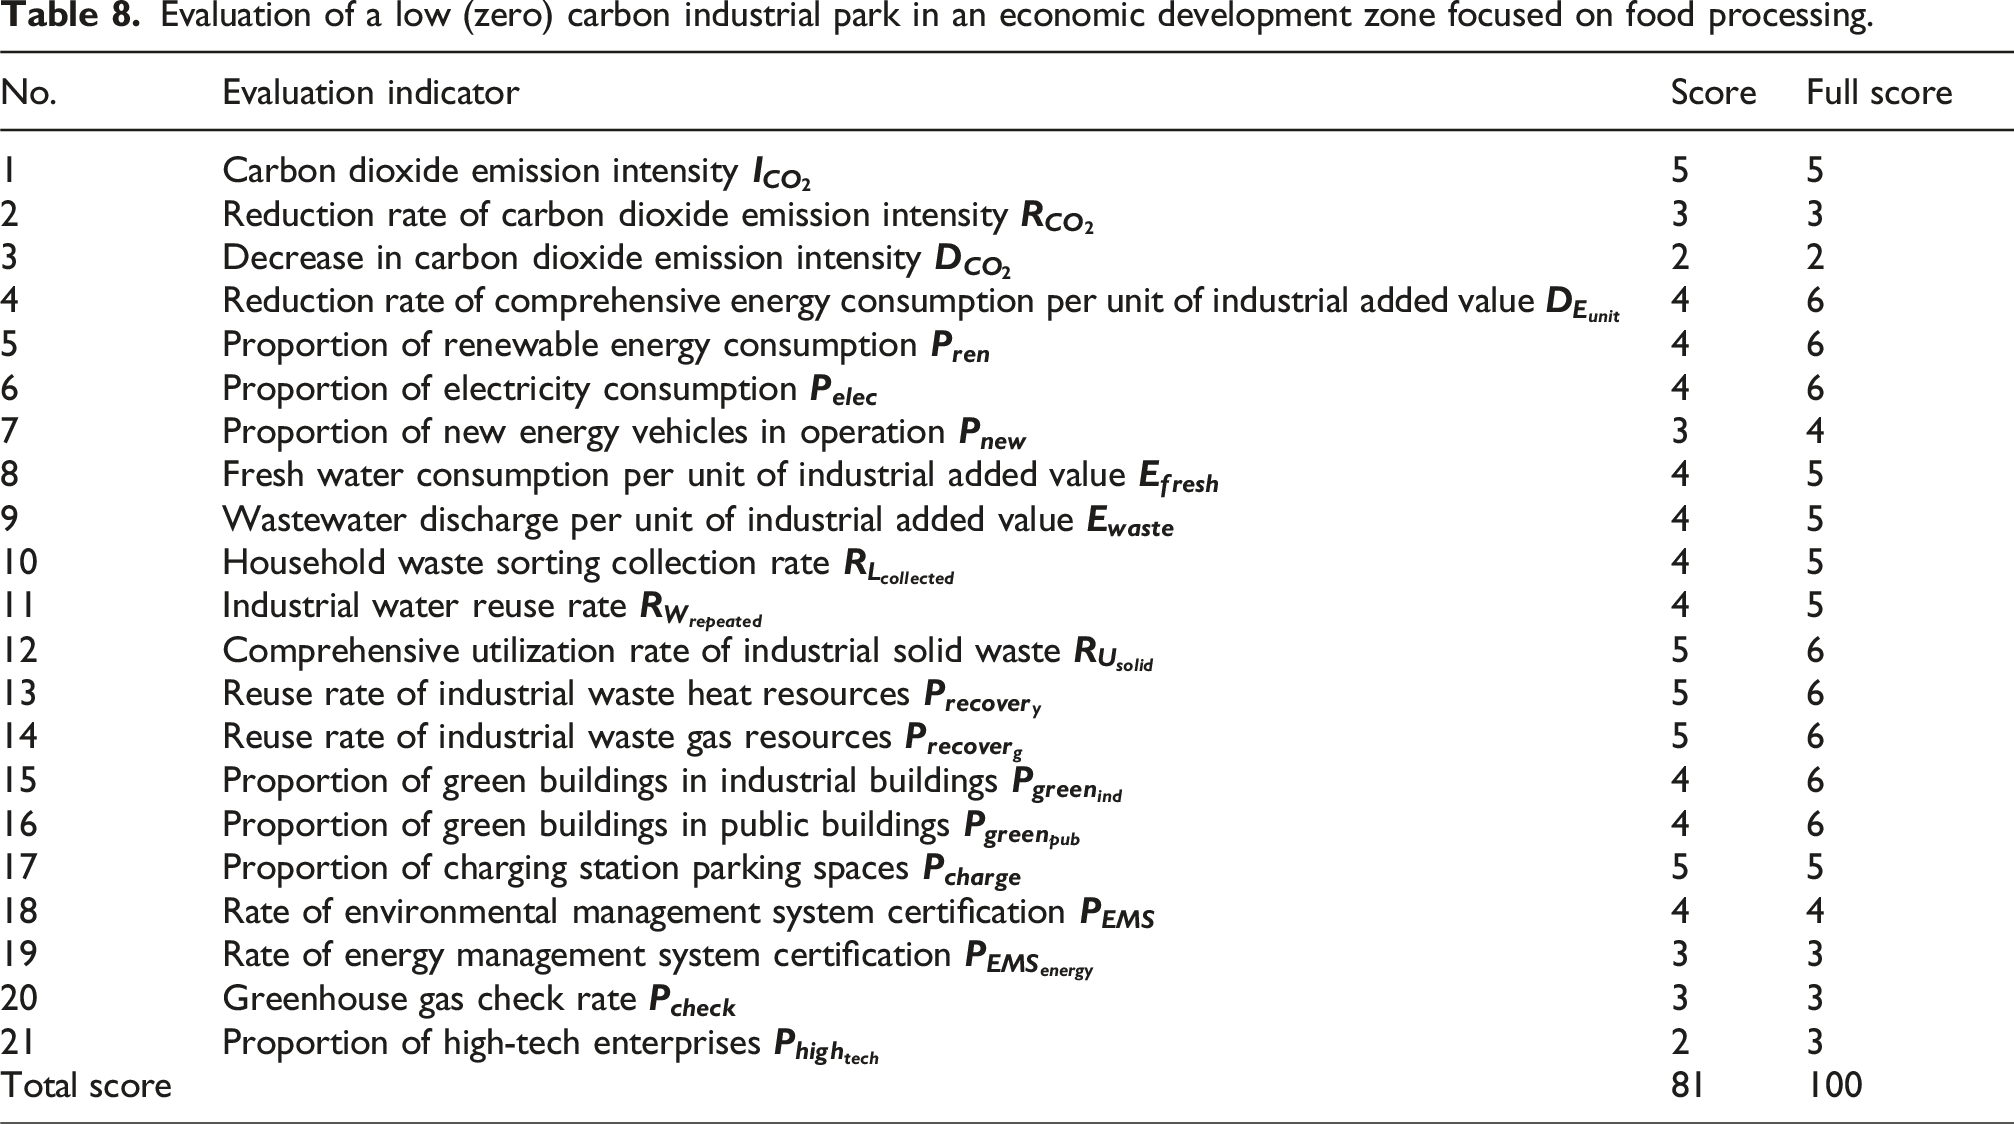
Evaluation of a low (zero) carbon industrial park in an economic development zone focused on food processing.
Presentation of results
The high scores for the indicators “Comprehensive Utilization Rate of Industrial Solid Waste,” “Reuse Rate of Industrial Waste Heat Resources,” and “Reuse Rate of Industrial Waste Gas Resources” can be attributed to the geographical advantages of the southeastern coastal area. The case study park is located in an economically developed region with a concentrated pool of capital, technological expertise, and talent resources, which facilitates the implementation of high-cost technologies and infrastructure. This enables efficient resource recycling, waste heat recovery, and emission reduction, aligning with national sustainability goals and driving superior performance in these metrics. The low scores of these indicators are mainly due to the industrial structure, technology application and management mechanism of the park. Traditional high-carbon industries (such as food processing and textile) rely on old and energy-consuming equipment, and their energy efficiency upgrading lags behind. The promotion of green building is limited by high renovation cost and insufficient policy incentives. The development of renewable energy is faced with the shortage of land resources and the bottleneck of power grid consumption. At the same time, the lack of refined energy management (insufficient real-time monitoring) and imperfect green electricity procurement mechanisms further restrict the progress of low-carbon transition. On the whole, by the standard in Representation of results, the economic development zone is rated as “Good” in the evaluation of the low (zero) carbon industrial park due toits successful implementation of national energy efficiency policies, evident in reduced energy consumption per unit of output, and adoption of energy-saving equipment in food processing enterprises. However, the park’s reliance on traditional industries constrained scores in low-carbon technology adoption, necessitating targeted R&D incentives to enhance green innovation.
Future prospects
How much an industrial park is aligned with the carbon peaking and carbon neutrality strategy can be known through the standardized evaluation system for low (zero) carbon industrial parks. The system offers valuable insights for coordinating low-carbon initiatives among enterprises and shaping the broader policies of the parks. However, given the diversity of industrial parks in China, a single set of fixed indicators and weights may not accurately reflect the state quo of low (zero) carbon development.
There remain several shortcomings in terms of comprehensive data collection and dynamic adjustment of the indicator system. Drawing on advanced experience both in China and abroad, we can enhance and refine the evaluation system for low-carbon industrial parks in an joint efforts with foreign peers. This serve as strong guidance and support for applying evaluation results to low-carbon development planning, management, and policy formulation of the industrial parks.
Footnotes

Funding
The authors disclosed receipt of the following financial support for the research, authorship, and/or publication of this article: This work was financially supported by the Director’s Fund of the China National Institute of Standardization project “Research on the Indicator System and Path of Green and Low Carbon Transformation in Industrial Parks from the Perspective of the Whole Life Cycle” (542023Y-10363).
Declaration of conflicting interests
The authors declared no potential conflicts of interest with respect to the research, authorship, and/or publication of this article.
Data Availability Statement
The data used to support the findings of this study are available from the corresponding author upon request.