




Abstract
This study proposes a hybrid Physical Education (PE) teaching quality evaluation system that integrates a K-medoids clustering algorithm with an enhanced CNN-LSTM neural network. Traditional evaluation methods are often subjective and inconsistent, failing to capture the complex, time-varying nature of student behavior in PE classes. The proposed model preprocesses historical classroom data through feature correlation analysis and PCA-based dimensionality reduction, followed by K-medoids clustering to improve data structure and training efficiency. It then takes Ensemble Empirical Mode Decomposition (EEMD) to enhance the input representation of the LSTM model. Experimental results demonstrated that the improved CNN-LSTM achieved an F1 value of 0.98 and an RMSE of 0.11 with 1000 training samples, significantly outperforming baseline models including CNN, LSTM, and GRNN. The model showed peak accuracy of 97.6% during 10:00–12:00 time slots, with an average recall of 90.4% across-varied student states. User evaluation by PE teachers indicated an average satisfaction score of 93.7. This model has been proven to be effective in handling nonlinear and non-stationary classroom data and can achieve real-time, objective, and personalized evaluation. Future improvements include expanding the dataset with classroom sensor data and incorporating cognitive and emotional engagement indicators.
Introduction
The development of big data has led to the gradual application of technologies such as artificial intelligence in campus construction. In the education environment. If big data is utilized and analyzed, it can significantly improve the quality of teaching. 1 Traditional Physical Education (PE) evaluation methods heavily rely on teachers’ subjective judgments and accumulated experience, often resulting in inconsistencies, low reliability, and inefficiencies. These methods typically lack standardized evaluation criteria and fail to account for the multi-dimensional aspects of students’ physical performance, learning engagement, and health conditions. Such limitations hinder the ability to deliver fair, timely, and data-driven feedback in PE settings. 2 Accordingly, developing an efficient and accurate Physical Education Teaching Quality Evaluation Model (PETQM) is crucial by combining modern data analysis techniques and machine learning algorithms. Some scholars have conducted research on teaching quality, but some have overlooked the impact of big data on teaching quality when conducting surveys and research. The model used is also relatively simple, which cannot accurately evaluate the state of students. To address these shortcomings, this study introduces an intelligent PETQM that integrates K-medoids clustering and an improved Long Short-Term Memory (LSTM) neural network. The clustering algorithm is used to filter and group large-scale historical classroom data, thereby enhancing the representation of key features. This data is then fed into a deep learning model that captures temporal patterns and nonlinear dependencies, improving prediction accuracy and evaluation fairness. The combination of unsupervised clustering and sequential modeling enables the system to adapt to individual student differences and dynamic classroom contexts. These capabilities are essential for building an objective, scalable, and accurate evaluation framework in modern PE environments. To enhance the clarity of the proposed framework, the core technical components are briefly introduced. K-center clustering, especially K-medoid clustering, is an unsupervised learning algorithm used to group similar data points by selecting actual observations as clustering centers. In this study, it helps filter and organize large-scale PE data into meaningful patterns before prediction. LSTM is a recurrent neural network well-suited for processing sequential data, such as time-series performance or engagement trends in PE classes. It captures temporal dependencies and variations in students’ learning behaviors. CNNs are deep learning models typically used for image or feature extraction. CNNs are adapted to enhance the input feature representation before feeding into the LSTM, improving the model’s ability to detect complex patterns in multi-dimensional PE data. The contribution of the research lies in its ability to enable teaching managers, teachers, and students to timely and accurately grasp the real teaching situation and continuously improve teaching quality. The research content has four parts. The first provides an overview about the teaching quality. The second briefly describes the algorithm. Next is the results obtained through algorithm research, and the results are analyzed. The fourth section presents the research content and research direction.
Related works
The quality of teaching has crucial impacts on the classroom learning quality, which is not only limited to students’ concentration and understanding ability in the classroom, but also directly related to their learning outcomes and motivation. Wang proposed a distance-based IVIF-CODAS method based on the traditional CODAS to fill the new demand for English language professionals in response to economic globalization. This method objectively evaluated the English teaching quality in colleges. It indicated that this method could effectively reduce subjective randomness, improve evaluation accuracy, and provide strong support for cultivating English major composite talents that adapt to the economic and social development.3–5 Hou proposed an improved gradient descent method based on BPNN to address the shortcomings of online education evaluation models in handling small-scale datasets. Meanwhile, a deep neural network model was proposed, which utilized support vector regression to process complex high-dimensional data. It performed well in evaluating large-scale data. 6 Yuan et al. proposed a strategy based on facial feature recognition to objectively evaluate the teaching quality of online classrooms. The system utilized an improved multitasking Convolutional Neural Network (CNN) to recognize facial features of students. By combining the optical AlexNet classification of the Ghost module, eye and mouth states were detected. The fatigue analysis was performed using the PERCLOS index. The system could also estimate student posture and learning concentration. It could assess the teaching quality of online courses. 7 Guo analyzed the PE quality evaluation. A universal PETQM based on expert systems, knowledge bases, and fuzzy set thinking was proposed. This method emphasized flexibility, fairness, and interactivity. The research results indicated that this evaluation system was of great significance for improving the PETQM. 8 Liu et al. combined deep CNN and weighted Naive Bayes algorithm to overcome the defects of PETQM and improve the evaluation comprehensiveness and accuracy. The correlation probability of class attributes was used to estimate the weight of each evaluation feature, achieving objective, realistic, and comprehensive teaching quality evaluation. It could promote the standardization and comprehensibility of teaching evaluation, improving the quality of teaching. 9 Zhou et al. proposed an intelligent PE classroom model based on the Internet of Things, cloud computing, and big data technology to improve the quality of PE teaching in universities. The research results indicated that this model effectively activated the atmosphere of PE classrooms, stimulated students’ learning interests and positive attitudes, helped them complete pre-class preparation, classroom teaching, and post class practice, and cultivated lifelong sports habits. 10
Massive scholars have carried out detailed research on clustering algorithms. Ushakov et al. proposed a parallel distributed primal dual heuristic strategy to solve the k-medoids clustering problem on large-scale datasets. This algorithm combined effective parallel subgradient column generation and high-quality core selection techniques, significantly reducing computational burden and memory requirements by approximating dissimilarity matrices. Experimental results showed that this algorithm could approach the optimal solution and achieve almost linear parallel acceleration on large-scale datasets. 11 Chen et al. proposed a parallel adaptive reliability analysis strategy based on importance sampling and K-medoids clustering to overcome the challenges in Kriging-based adaptive structural reliability analysis. It evaluated candidate samples through global convergence conditions and optimal importance sampling functions, and implemented parallel operations using clustering algorithms. It could effectively improve computational efficiency, balance accuracy with reduced iteration times, and verify its effectiveness and robustness. 12 Zhang et al. proposed a K-medoids fast collaborative spectrum sensing method based on Riemannian distance to improve spectrum utilization efficiency in cognitive radio networks. The sensing data of single and multiple antenna secondary users was fused. This method could effectively identify the status of the main user. Experimental results showed that the proposed method reduced computational complexity while ensuring convergence. The effectiveness was validated under different conditions. 13 Sado proposed a method based on the raw materials of different qualities and performance verification to develop high-quality and low-cost MgO-C refractory materials to cope with corrosion and reduce costs. By using principal component analysis and K-medoids algorithm to screen formulas, and testing them in a medium frequency induction furnace, MgO-C materials with similar corrosion resistance could be selected. 14 To solve the poor communication quality, chain prone to interruption and low data transmission reliability caused by frequent changes in the topological structure of vehicular AD hoc networks, Shu et al. proposed an adaptive K-medoids algorithm based on greedy peripheral stateless routing in this paper for multi-path vehicle networking communication in urban scenarios. The research results showed that this algorithm could form high-quality link communication, improved the reliability of data transmission, and had good performance and strong applicability. 15
To sum up, although numerous scholars have applied machine learning and clustering methods in educational evaluation, few have directly focused on PE teaching scenarios, which involve complex temporal, behavioral, and physiological data. Most existing studies emphasize general classroom environments, where facial expressions, text-based assessments, or survey data dominate. These approaches often lack sensitivity to the non-linear, sequential, and multi-dimensional nature of PE data. In addition, previous models tended to use clustering for data grouping or neural networks for prediction but rarely explored the synergistic integration of the two. For example, although models based on BPNN and CNN have improved their generalization ability to structured data, they cannot effectively capture sequence dependencies. In addition, pure LSTM models without prior feature screening may suffer from noise and redundancy in large datasets. Therefore, this study proposes a hybrid PETQM framework that first employs K-medoids clustering to reduce feature redundancy and enhance interpretability, and then applies an improved CNN-LSTM network for precise sequential prediction. This integration not only improves accuracy, but also enhances adaptability to PE-specific data such as motion records, exercise performance, and engagement states.
Design of PETQM integrating cluster analysis and neural network
The first section proposes a filtering model based on the K-medoids clustering algorithm, which can filter information in big data and optimize historical classroom data participating in training, thus preliminarily judging the teaching quality. The second section proposes an evaluation model based on LSTM and introduces CNN to improve the model.
Teaching data processing model based on cluster analysis
PE teaching has its particularity, which is not the same as teaching in other disciplines. Therefore, big data generated in PE is subjected to data processing. These data include students’ physical indicators, exercise performance, classroom performance, and health status. Processing and analyzing these data can better analyze the learning and physical conditions, thereby guiding teaching practice and improving teaching effectiveness. Correlation analysis is applied to determine the correlation among variables in a dataset. It is usually used to discover the interrelationships, patterns, or trends between variables to better make predictions or decisions. It includes two categories: correlation analysis and regression analysis. The former aims to measure the linear correlation between two or more variables. Correlation analysis can determine whether there is a correlation in variables, as well as the direction and strength of the correlation. Regression analysis aims to develop a mathematical relationship model in one or more independent variables and a dependent variable. This relationship can be linear or non-linear. Through regression analysis, independent variable information can be used to predict the dependent variable value, or to discuss the impact of independent variables on the dependent variable. The study uses correlation analysis to analyze the correlation between historical teaching data and influencing factors. The Pearson Correlation Coefficient (PCC) analysis method is used to screen the main factors affecting teaching quality. This method is a statistical method that measures the strength and direction of the linear relationship between two variables and is commonly used to explore the degree of correlation between two continuous variables. PCC is the quotient of covariance and standard deviation between two groups of variables. Its expression is shown in equation (1). PCA dimensionality reduction process for data.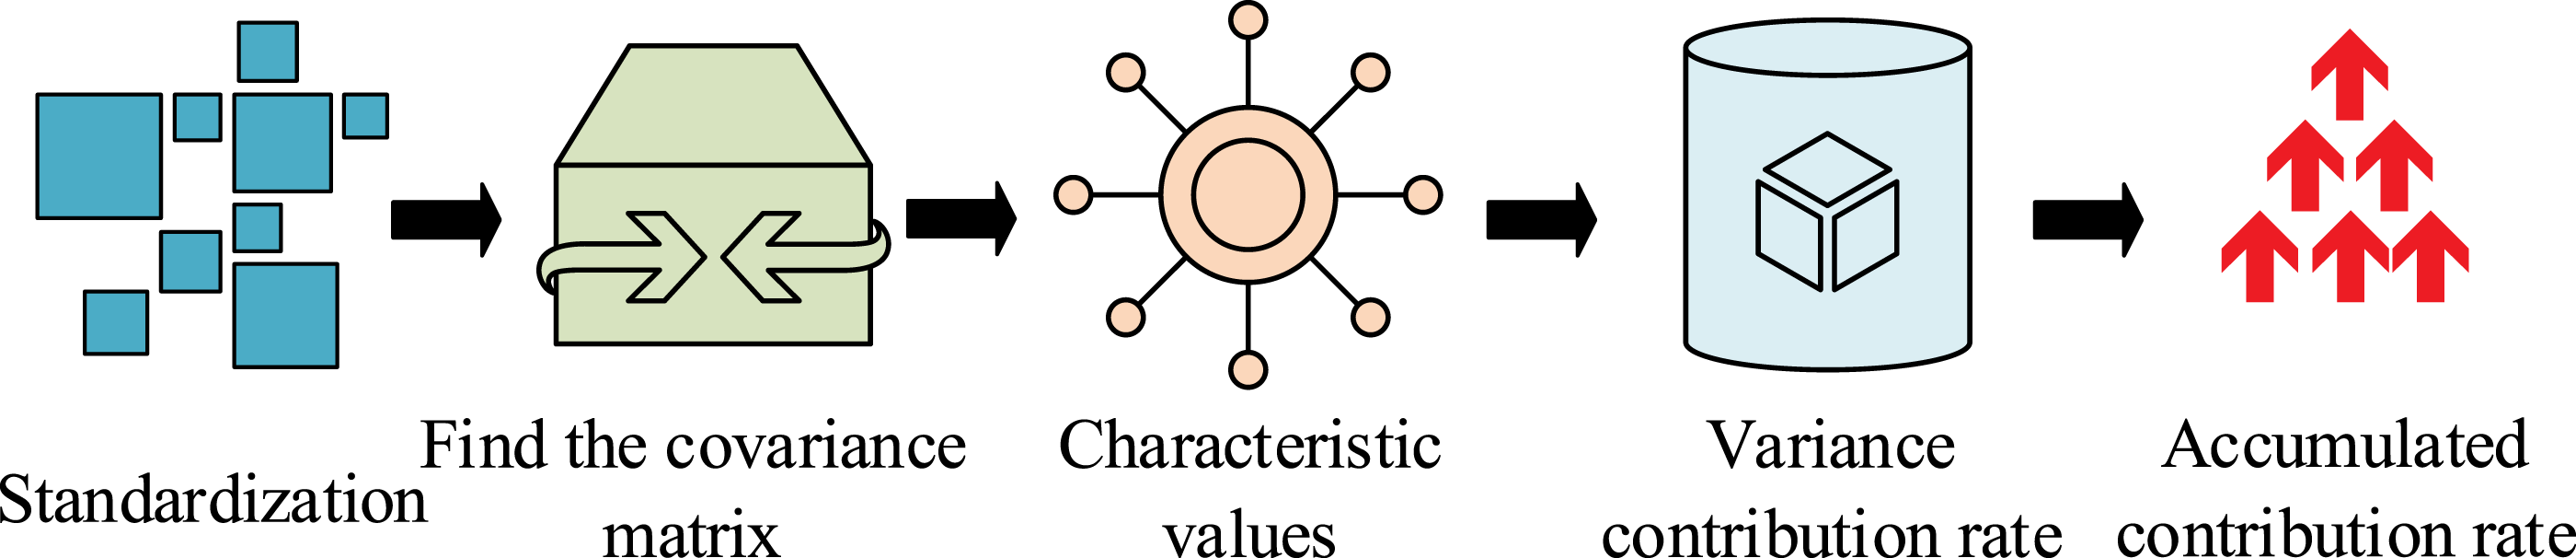


From Figure 1, firstly, the PE teaching feature data is composed into the original data matrix and standardized. Then, the covariance matrix of the original data matrix is displayed in equation (3).
18
Clustering of K-medoids.




In Figure 2, firstly, samples are selected as cluster centers in the dataset. Then, the distance between other data in the dataset and the current cluster center is obtained. Each sample point is distributed with its nearest cluster center. The calculation is shown in equation (7). Architecture of the Km-LSTM-based preprocessing and prediction pipeline.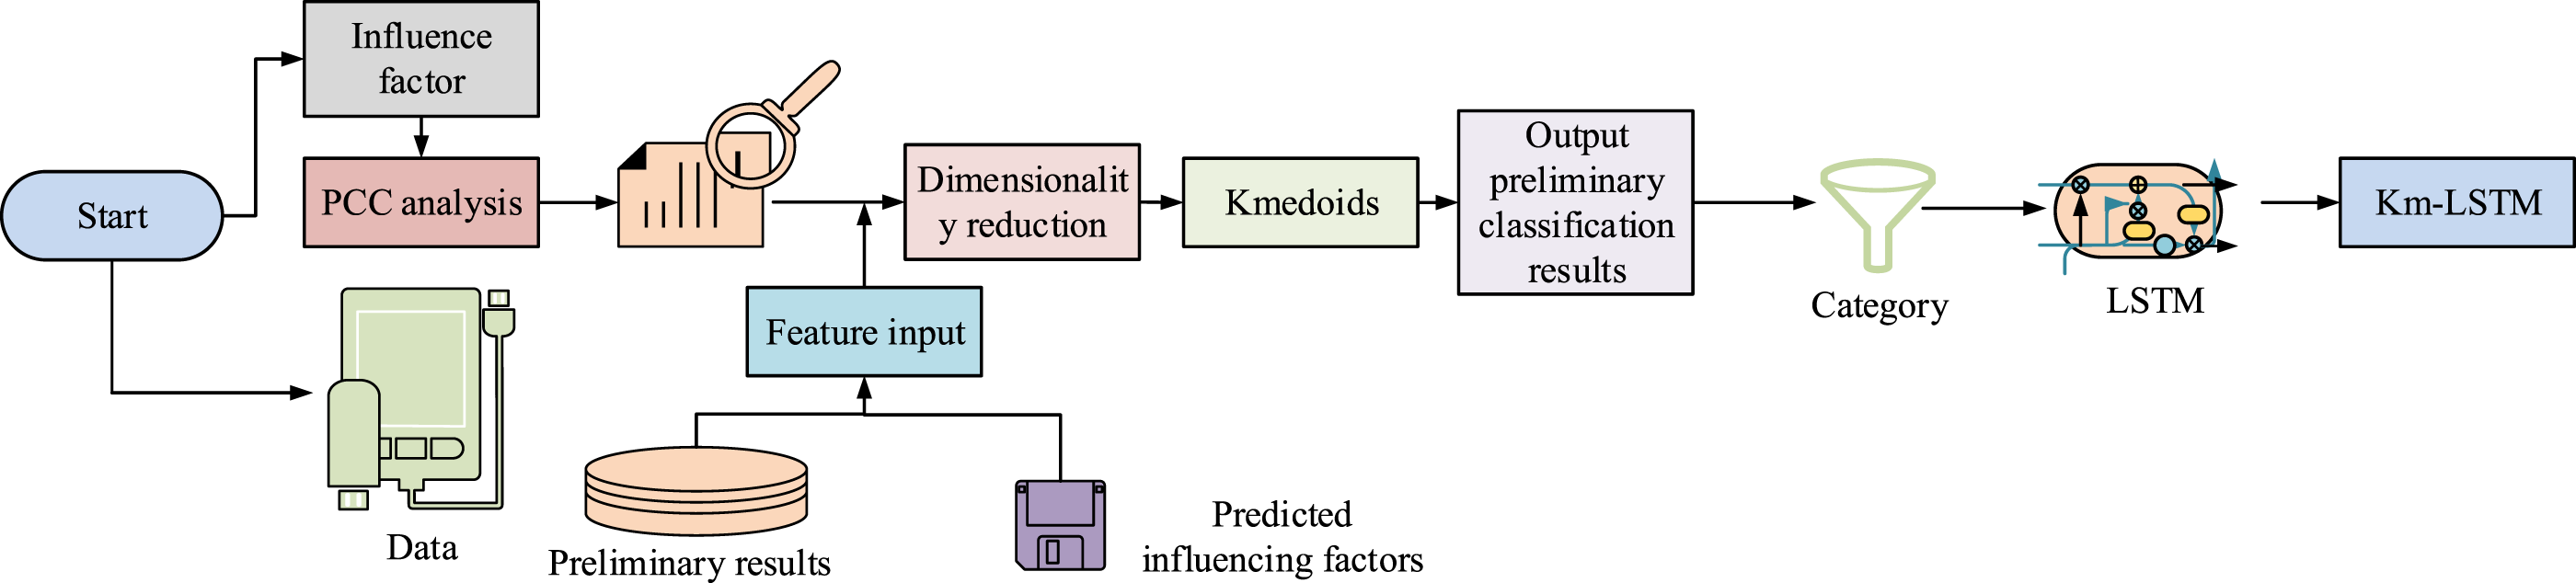


From Figure 3, the influencing factors are first determined through PCC analysis to obtain the teaching quality characteristics. Then, it be predicted and the teaching quality characteristics are input into PAC for dimensionality reduction. Then, the clustering results are obtained through K-medoids clustering. Each result is input into the LSTM. The predicted teaching data is then input to obtain the processed data.
PETQM based on improved LSTM network
After processing teaching data using the Km-LSTM model, the teaching features are decomposed using Ensemble Empirical Mode Decomposition (EEMD) to generate new feature components as new training features.
24
EEMD is an extension of Empirical Mode Decomposition (EMD). It reduces the inherent mode-mixing problem in EMD. Modal mixing refers to the possibility that the Intrinsic Mode Function (IMF) obtained from empirical mode decomposition may be contaminated by the components of different oscillation modes. EEMD solves this problem by adding white noise to the signal and repeating the EMD process multiple times. EMD is an adaptive method that can automatically adjust the decomposition process based on local features of data. This makes the method very effective in handling nonlinear and non-stationary data. Unlike traditional frequency based decomposition methods, EMD does not require prior knowledge or assumptions about the frequency characteristics of the signal. Therefore, it is possible to better process various types of signals, including nonlinear, and non-stationary signals. EMD captures the local features and nonlinear components of a signal by decomposing it into multiple local feature components. Each component represents a scale or frequency range in the signal, better preserving the local structure of the signal. This generates a set of IMFs. The average value of these IMFs often reduces modal mixing.
25
Its expression is shown in equation (9). EEMD process.

In Figure 4, firstly, the parameters of the EEMD are set. The threshold for the amplitude of white noise and the number of integrations are initialized. White noise is added to the data sequence. The data with added white noise is subjected to EMD to obtain the intrinsic mode components. After obtaining the integration count, the process is ended.26,27 Finally, the mean of IMF components for all groups is calculated. The solution result is used as the decomposition result of EEMD. The decomposed IMF and residual components are used as inputs for the prediction model. Then they are input into the LSTM network structure for further prediction.28,29 The LSTM is displayed in Figure 5. LSTM structure diagram.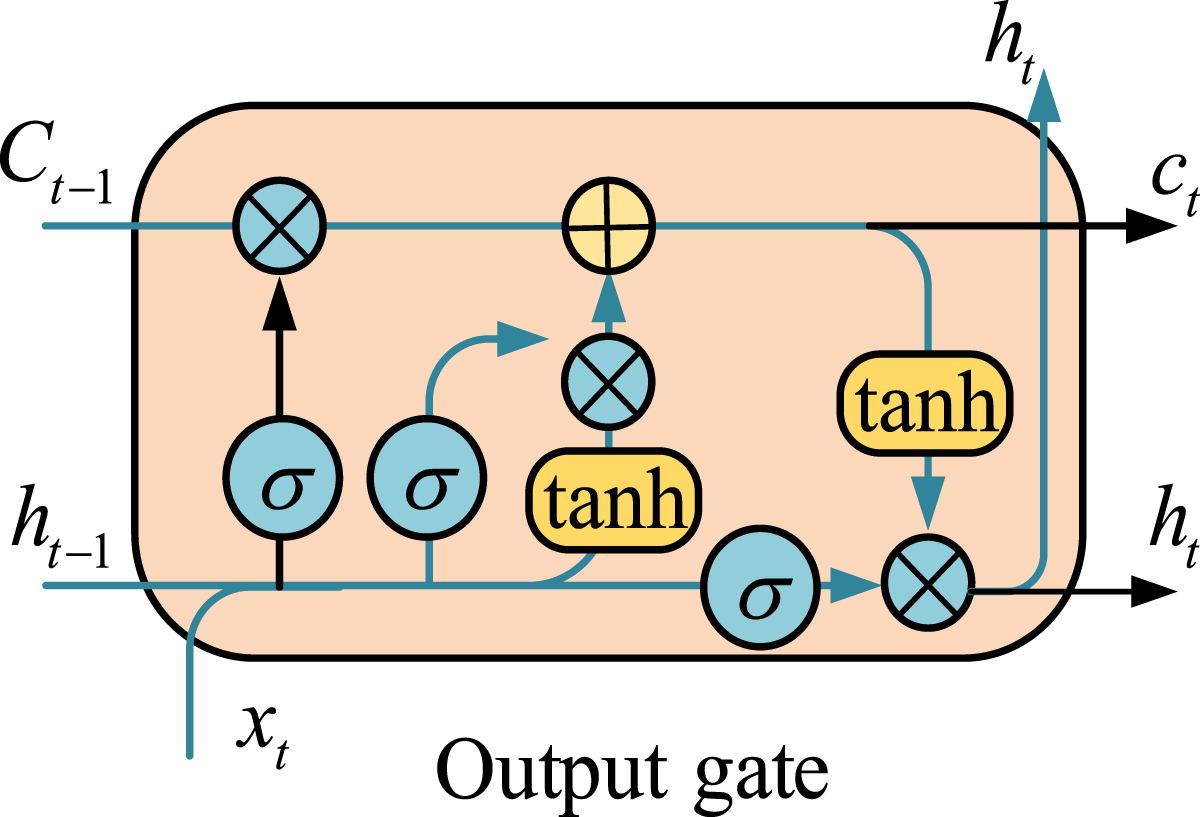
From Figure 5, the LSTM neuron structure is based on CNN with added gating, including three parts. LSTM has an additional transfer state compared to CNN, with two transfer states, namely, long-term state and short-term state.
30
Considering that LSTM can process continuous time series, while CNN can obtain feature information from high-level data, CNN is used to improve the LSTM. CNN extracts effective features from high-dimensional datasets to obtain teaching quality feature vectors, which are then input into the LSTM network to complete prediction. In LSRM, the update gate controls how much information is retained from the Hidden State (HS) of the previous time step to update the current time step’s HS. The output of the update gate is in [0,1], demonstrating how much information from the previous time step needs to be retained. The update gate is shown in equation (10). High correlation component selection process.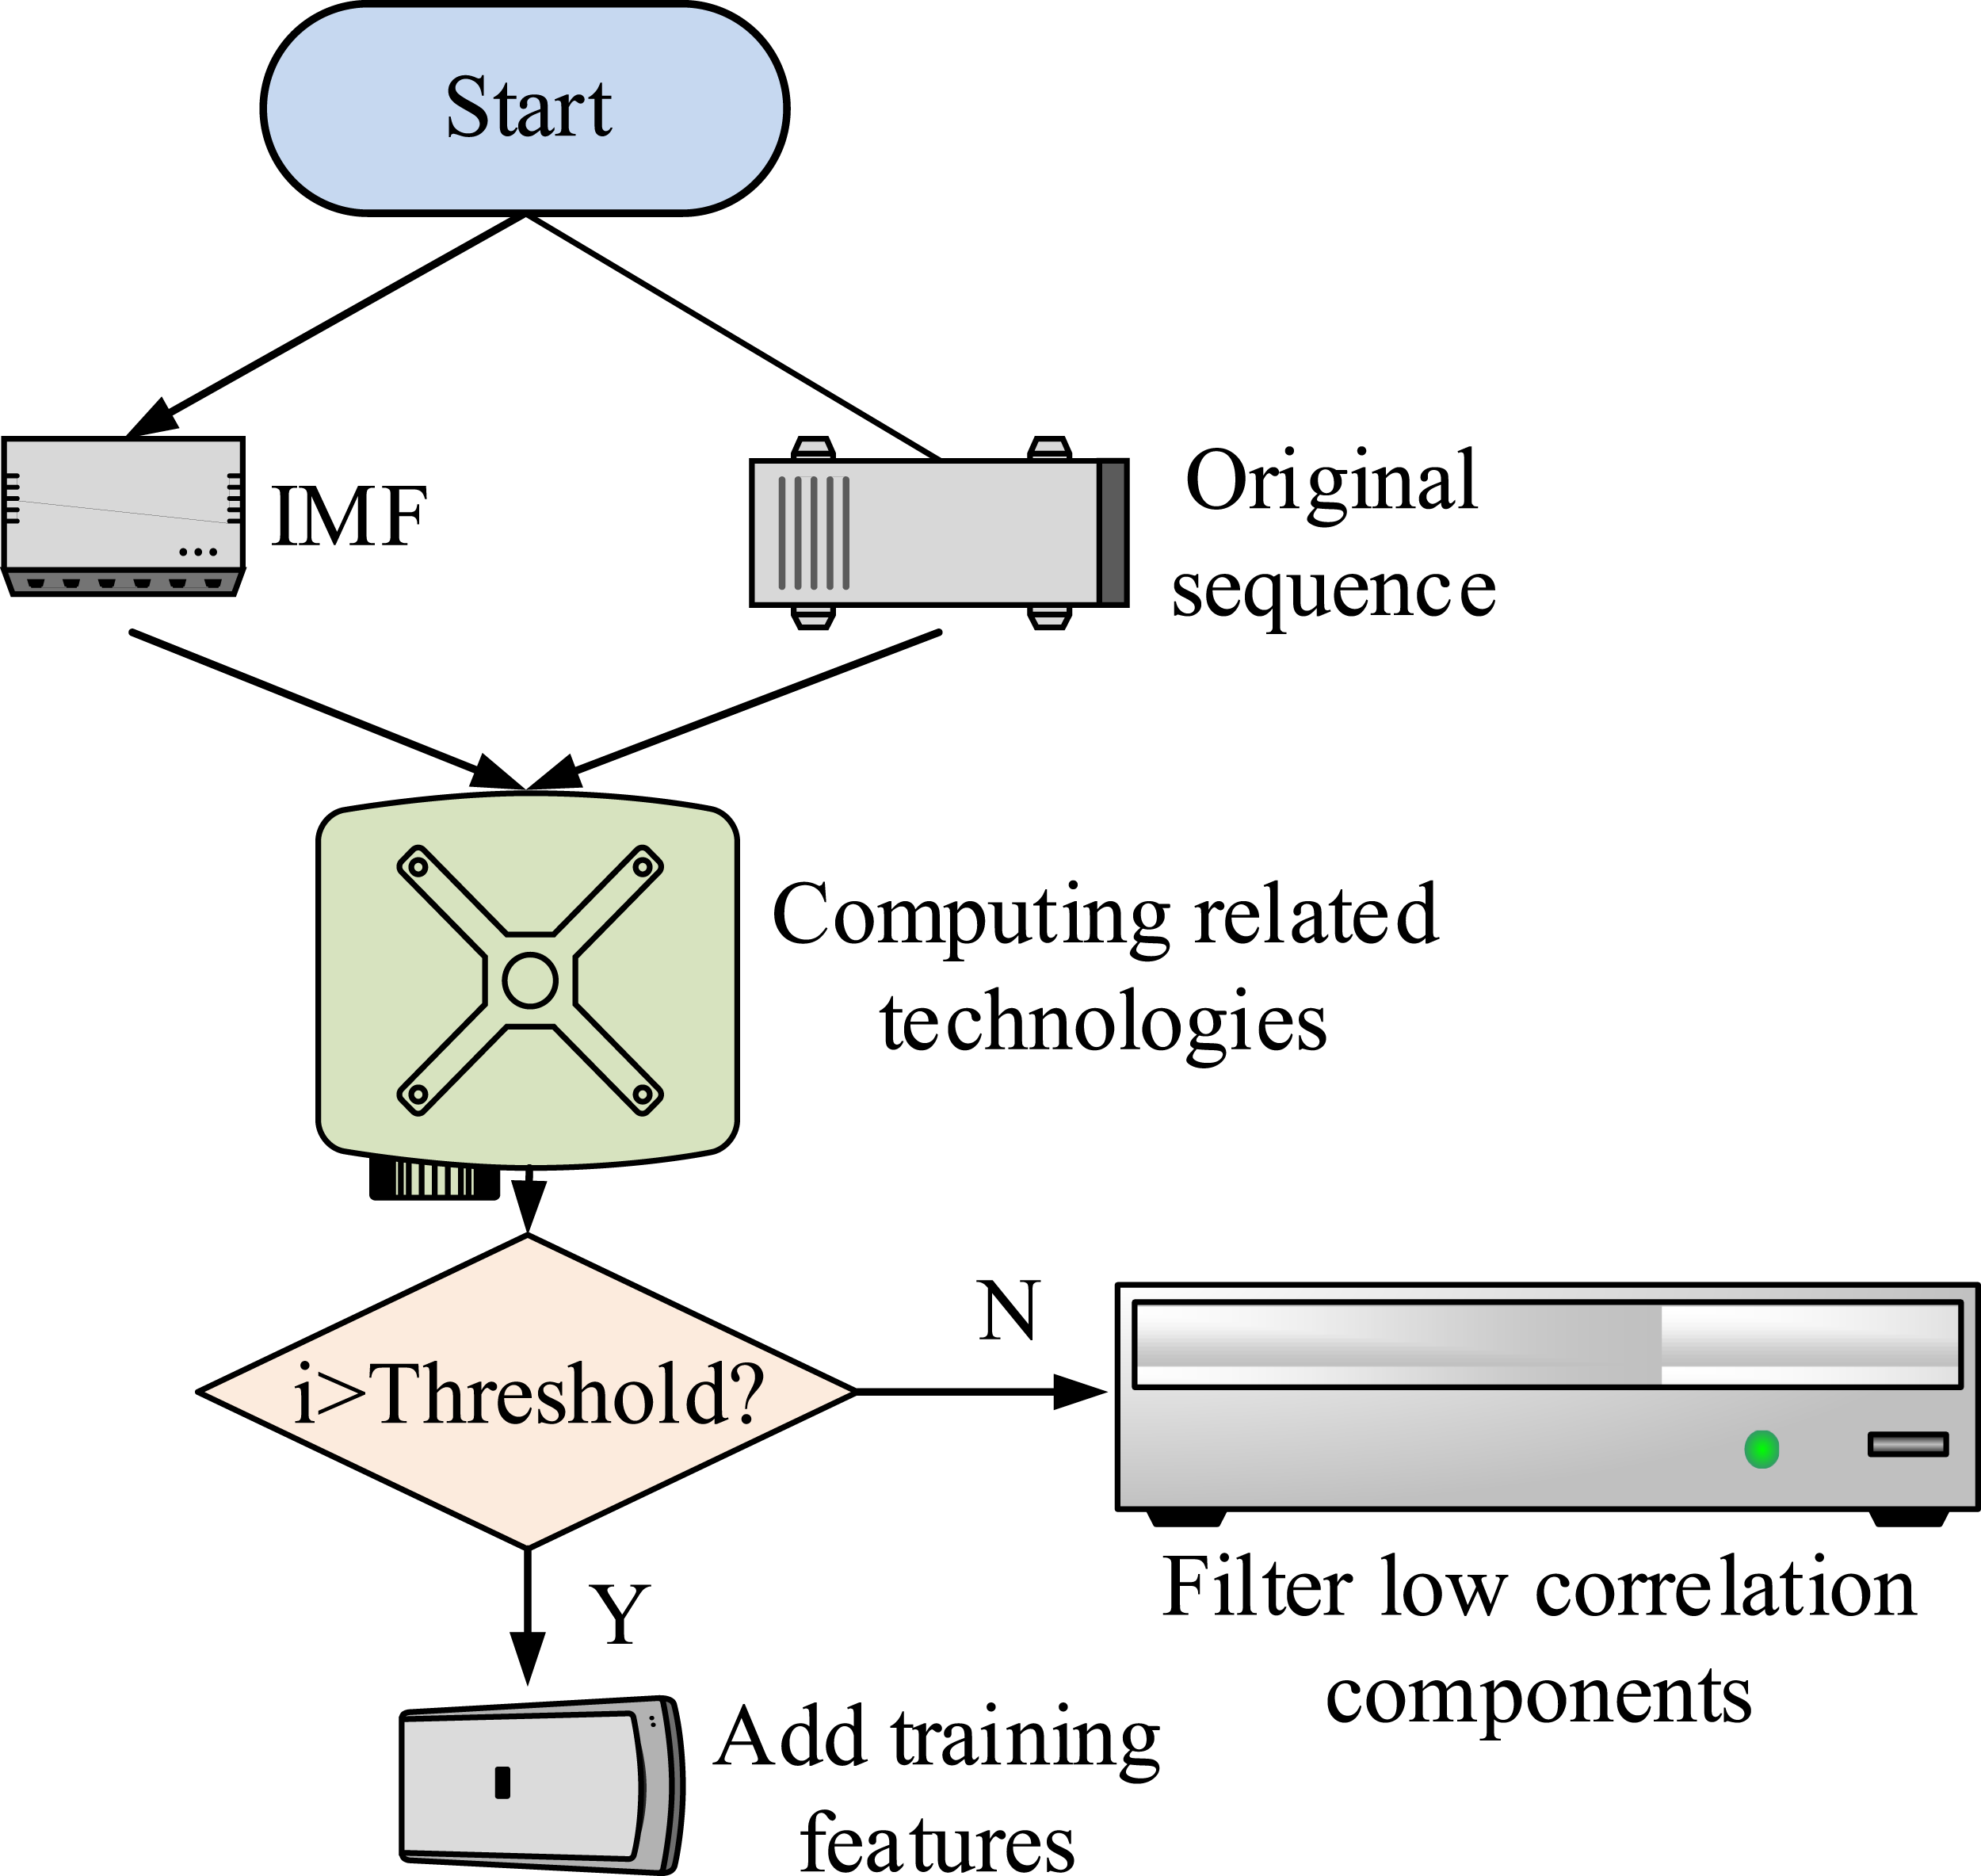




In Figure 6, the IMF component and residual component are obtained through EEMD. Two components and raw data are subjected to PCC analysis. The PCC is used as an indicator. The classification with a correlation coefficient greater than the IMF component is considered as a high correlation component for training and then filtered to the low correlation component.
32
In this study, CNN is introduced to enhance the feature representation capability of the LSTM model. LSTM networks are well-suited for capturing temporal dependencies and modeling time-series relationships in sequential data, such as students’ behavioral engagement over multiple class sessions. However, LSTM alone is limited in its ability to extract spatial correlations or local feature patterns from high-dimensional inputs, especially when the input includes multiple physical, behavioral, and psychological indicators. CNN excels at extracting localized and hierarchical features through convolution operations. By placing the CNN layer before the LSTM, the model first applies convolutional filters to capture salient patterns across input dimensions, such as co-occurring changes in physical performance and class participation. These feature maps are then flattened and passed to the LSTM layer, which models the sequential dynamics. The integration of CNN and LSTM allows the model to jointly exploit spatial structure and temporal evolution in PE data. CNN serves as a front-end encoder that transforms raw features into compact representations, while LSTM acts as a temporal decoder that learns long-term dependencies across time steps. This design improves model generalization, reduces training complexity, and enhances prediction accuracy in PE teaching evaluation. Due to the adaptability of EEMD, it is not possible to generate a specified number of components when decomposing data sequences. Therefore, a threshold needs to be set to filter the decomposed IMF components. The final model structure is shown in Figure 7. Overall prediction workflow of the PETQM framework integrating K-medoids, EEMD, and CNN-LSTM.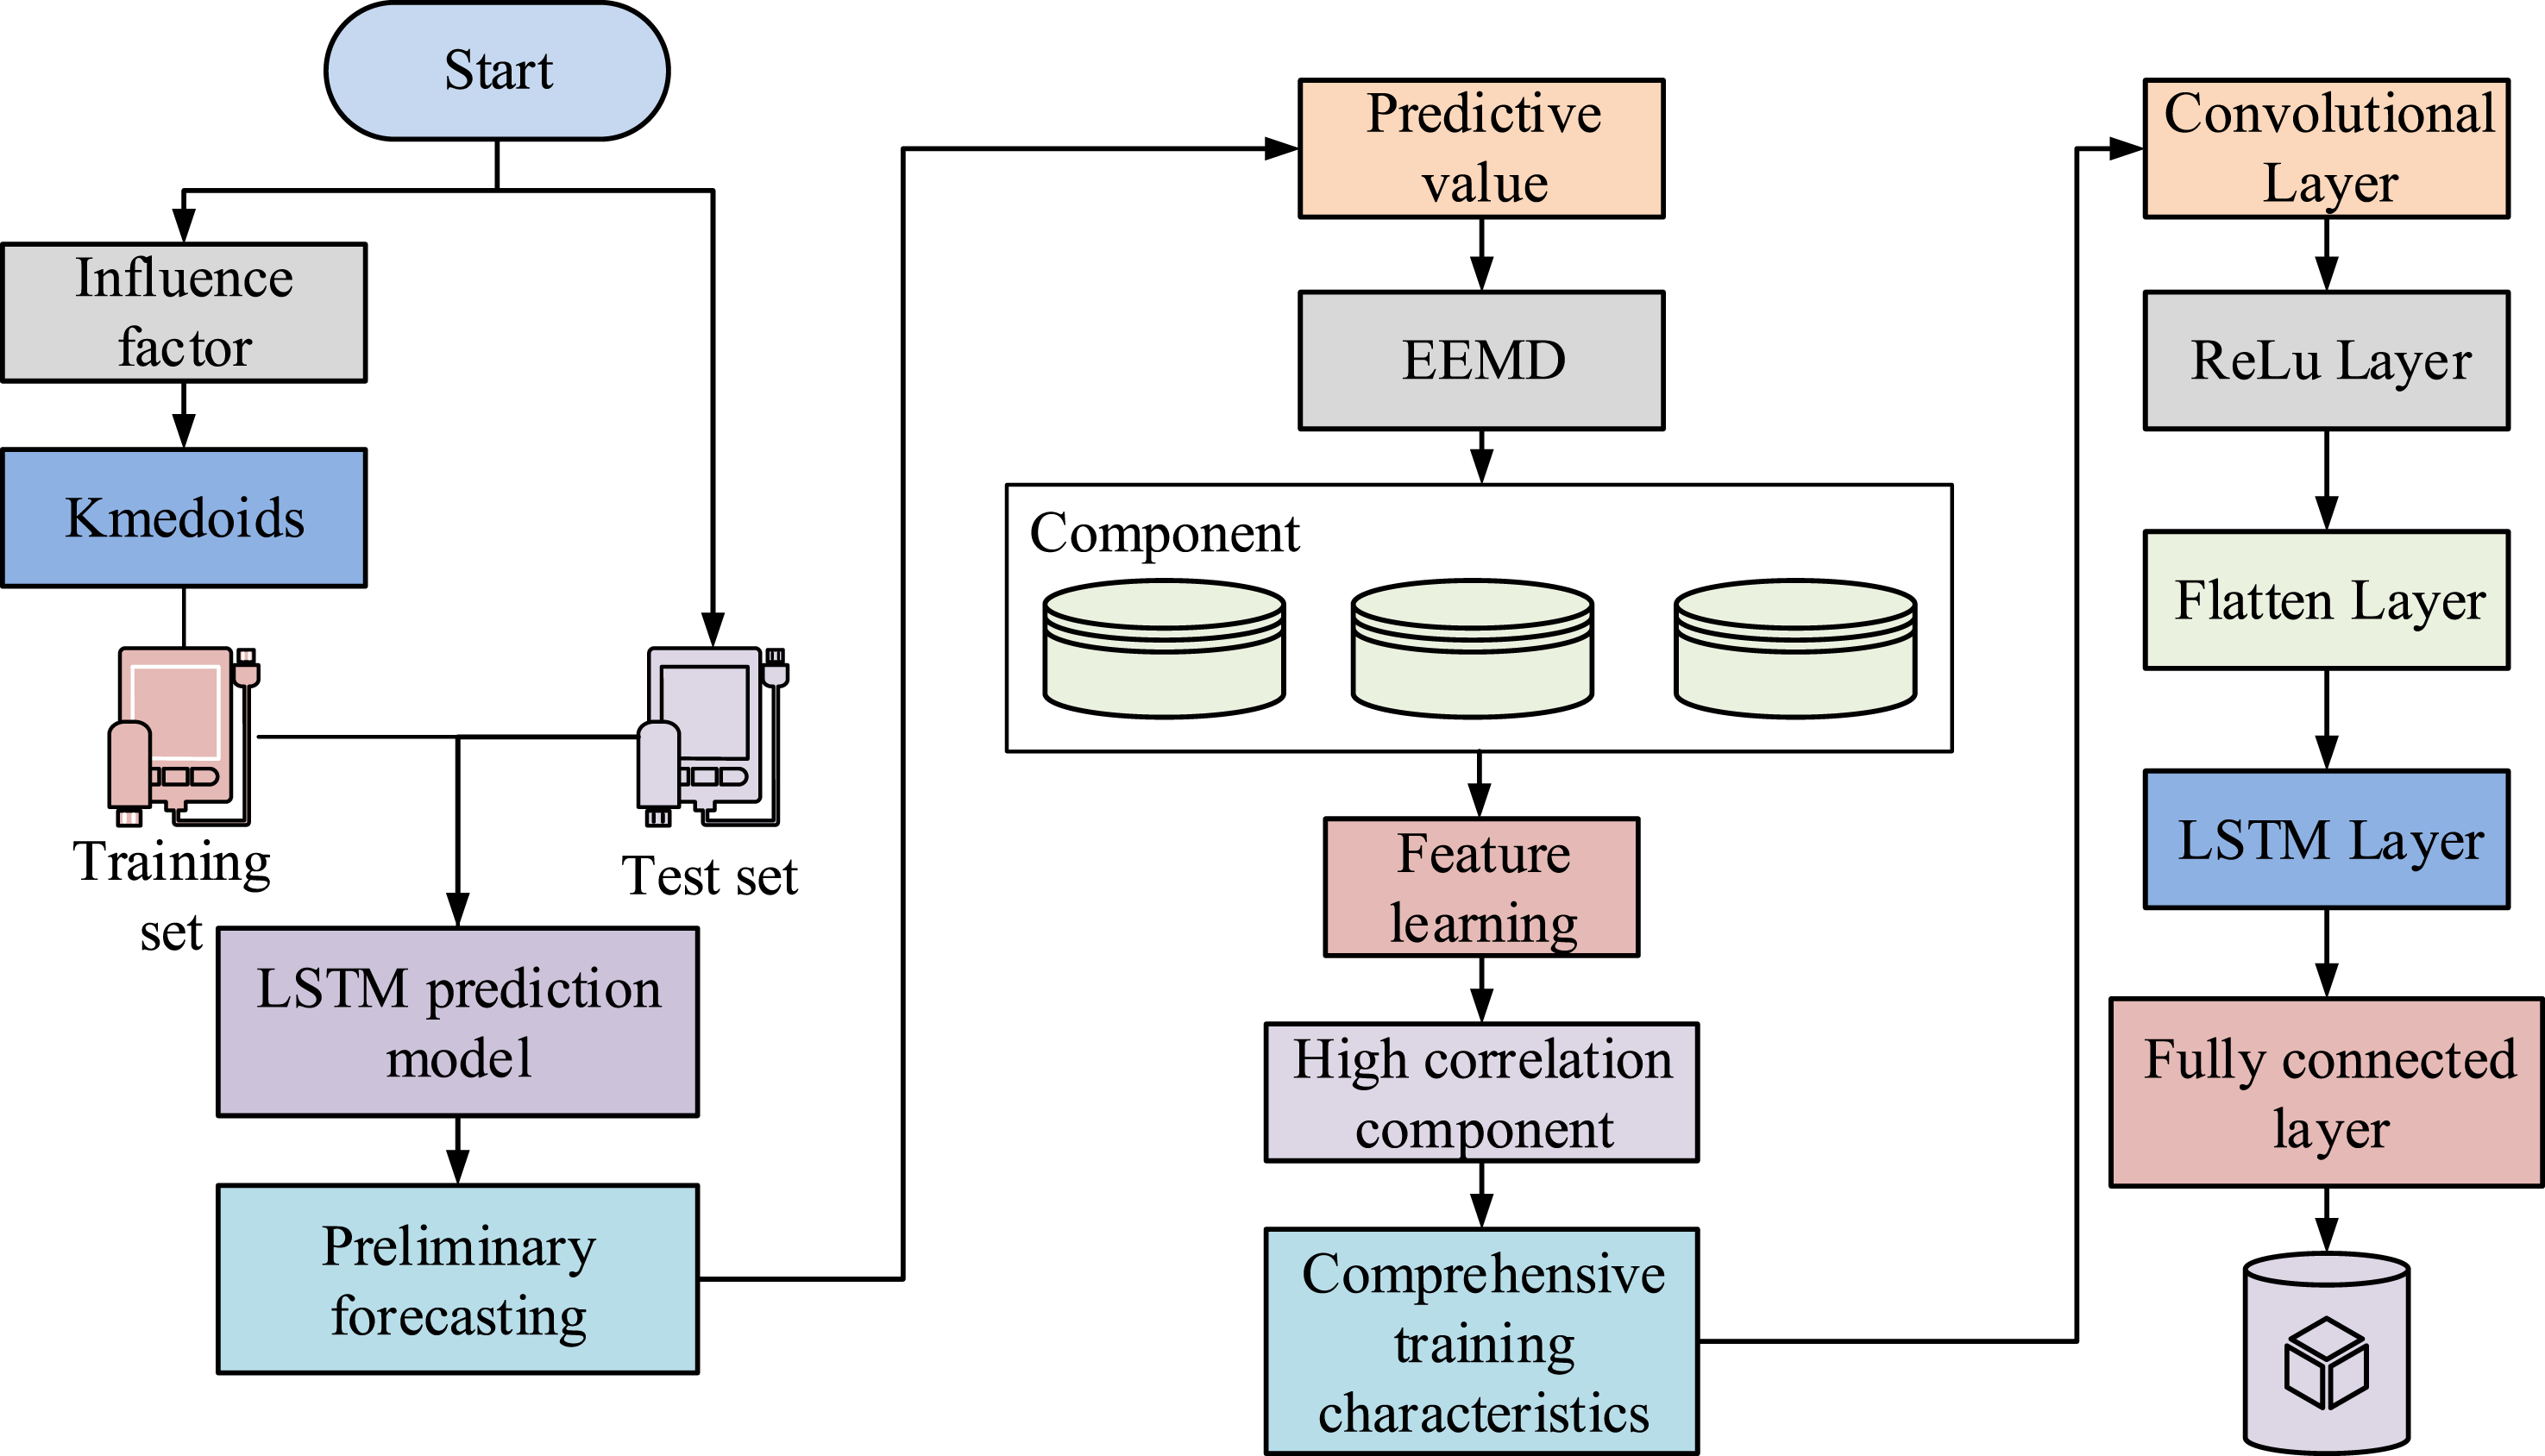
From Figure 7, the influencing factors to be predicted are first inputted into the K-medoids clustering model for judgment. Then the results are inputted into the LSTM prediction model to obtain preliminary prediction results. The preliminary prediction results are inputted into the EEMD model for decomposition to obtain data components. Then, the features are learned to obtain highly correlated feature components. Lastly, the obtained features are inputted in the CNN-LSTM for judgment to obtain the prediction results.
Design of PETQM integrating cluster analysis and neural network
In the first section, the General Regression Neural Network (GRNN), CNN, and LSTM are compared with the data preprocessing model in terms of F1 values and other aspects. The second section introduces CNN and LSTM for comparison with PE teaching evaluation models.
Performance analysis of teaching data processing model based on cluster analysis
The dataset used in this study is the Youth Behavioral Surveillance Survey (YBSS), a large-scale monitoring project led by the Centers for Disease Control and Prevention (CDC) in the United States. It aims to assess health-related behaviors among adolescents through nationwide questionnaire-based sampling. In this study, data related to PE and student health are extracted, including the following dimensions: frequency of participation in PE courses and extracurricular physical activity, self-reported physical condition (e.g., sleep quality, body image, and exercise fatigue), engagement and satisfaction levels with school PE classes, and basic demographic information such as age, gender, and grade. The data consist of both ordinal and categorical variables, which are standardized before further processing. These indicators represent students’ behavior and health status in multiple dimensions, enabling a more comprehensive assessment of PE. The CPU used in the experimental hardware configuration is Intel Core i5-8750H. The GPU is NVIDIA Geforce GTX2080Ti, with 8 GB of graphics memory and 16 GB of memory. The F1 score and Root Mean Square Error (RMSE) in evaluating the performance of the PETQM model provides a more comprehensive assessment beyond basic accuracy. The F1 score reflects the model’s balance between precision and recall, which is particularly useful in educational evaluation where both overestimation and underestimation of quality levels can mislead decision-making by administrators or teachers. A higher F1 score means that the system can not only correctly identify high-quality or low-quality sessions but also minimize false positives and false negatives in these judgments. Meanwhile, RMSE provides an interpretable indication of the average prediction error magnitude, measured in the same units as the original quality score scale. In the context of PE teaching, a lower RMSE suggests that the model can reliably predict nuanced quality differences between instructional sessions. The GRNN, CNN, and LSTM are introduced. Figure 8 displays the results. Comparison of F1-score and RMSE values across different models as training set size increases.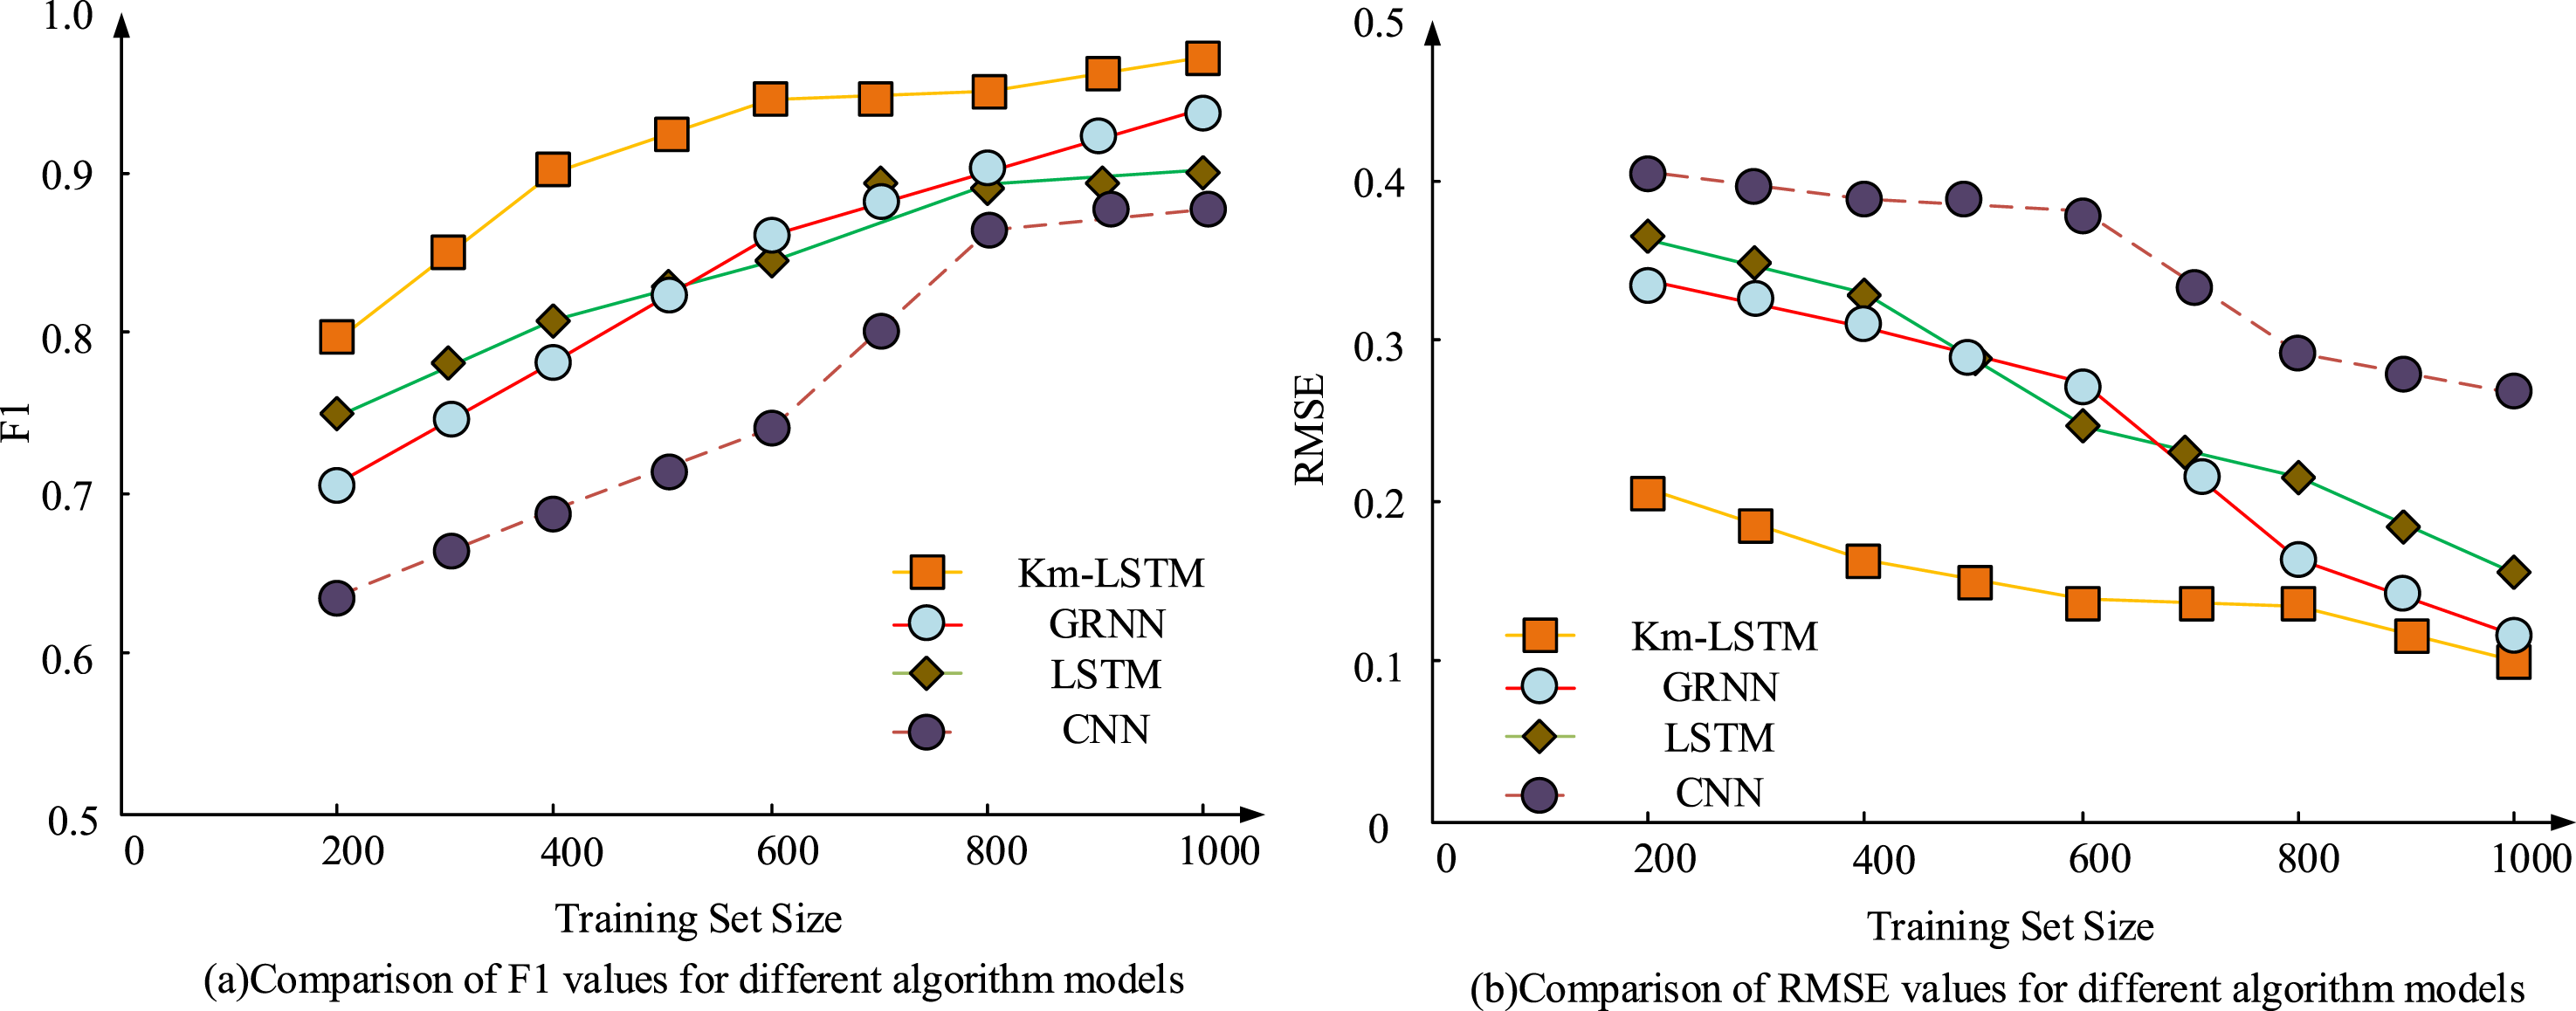
Figure 8(a) shows the F1 values of each model. Figure 8(b) displays the RMSE values of each model as the size of the training set adds. In Figure 8(a), as the size increased, the F1 of each model also increased. When the training set size was 1000, the F1 values of CNN, LSTM, GRNN, and Km-LSTM were 0.88, 0.90, 0.95, and 0.98. In Figure 8(b), as the training set increased, the RMSE values of each model has decreased. When the training set size was 1000, the RMSE values of CNN, LSTM, GRNN, and Km-LSTM were 0.27, 0.16, 0.13, and 0.11. The data is divided into datasets with different sizes, arranged in ascending order from dataset 1 to dataset 4. The processing time of each model is compared. The results are shown in Figure 9. Processing time comparison of four models across training and validation datasets.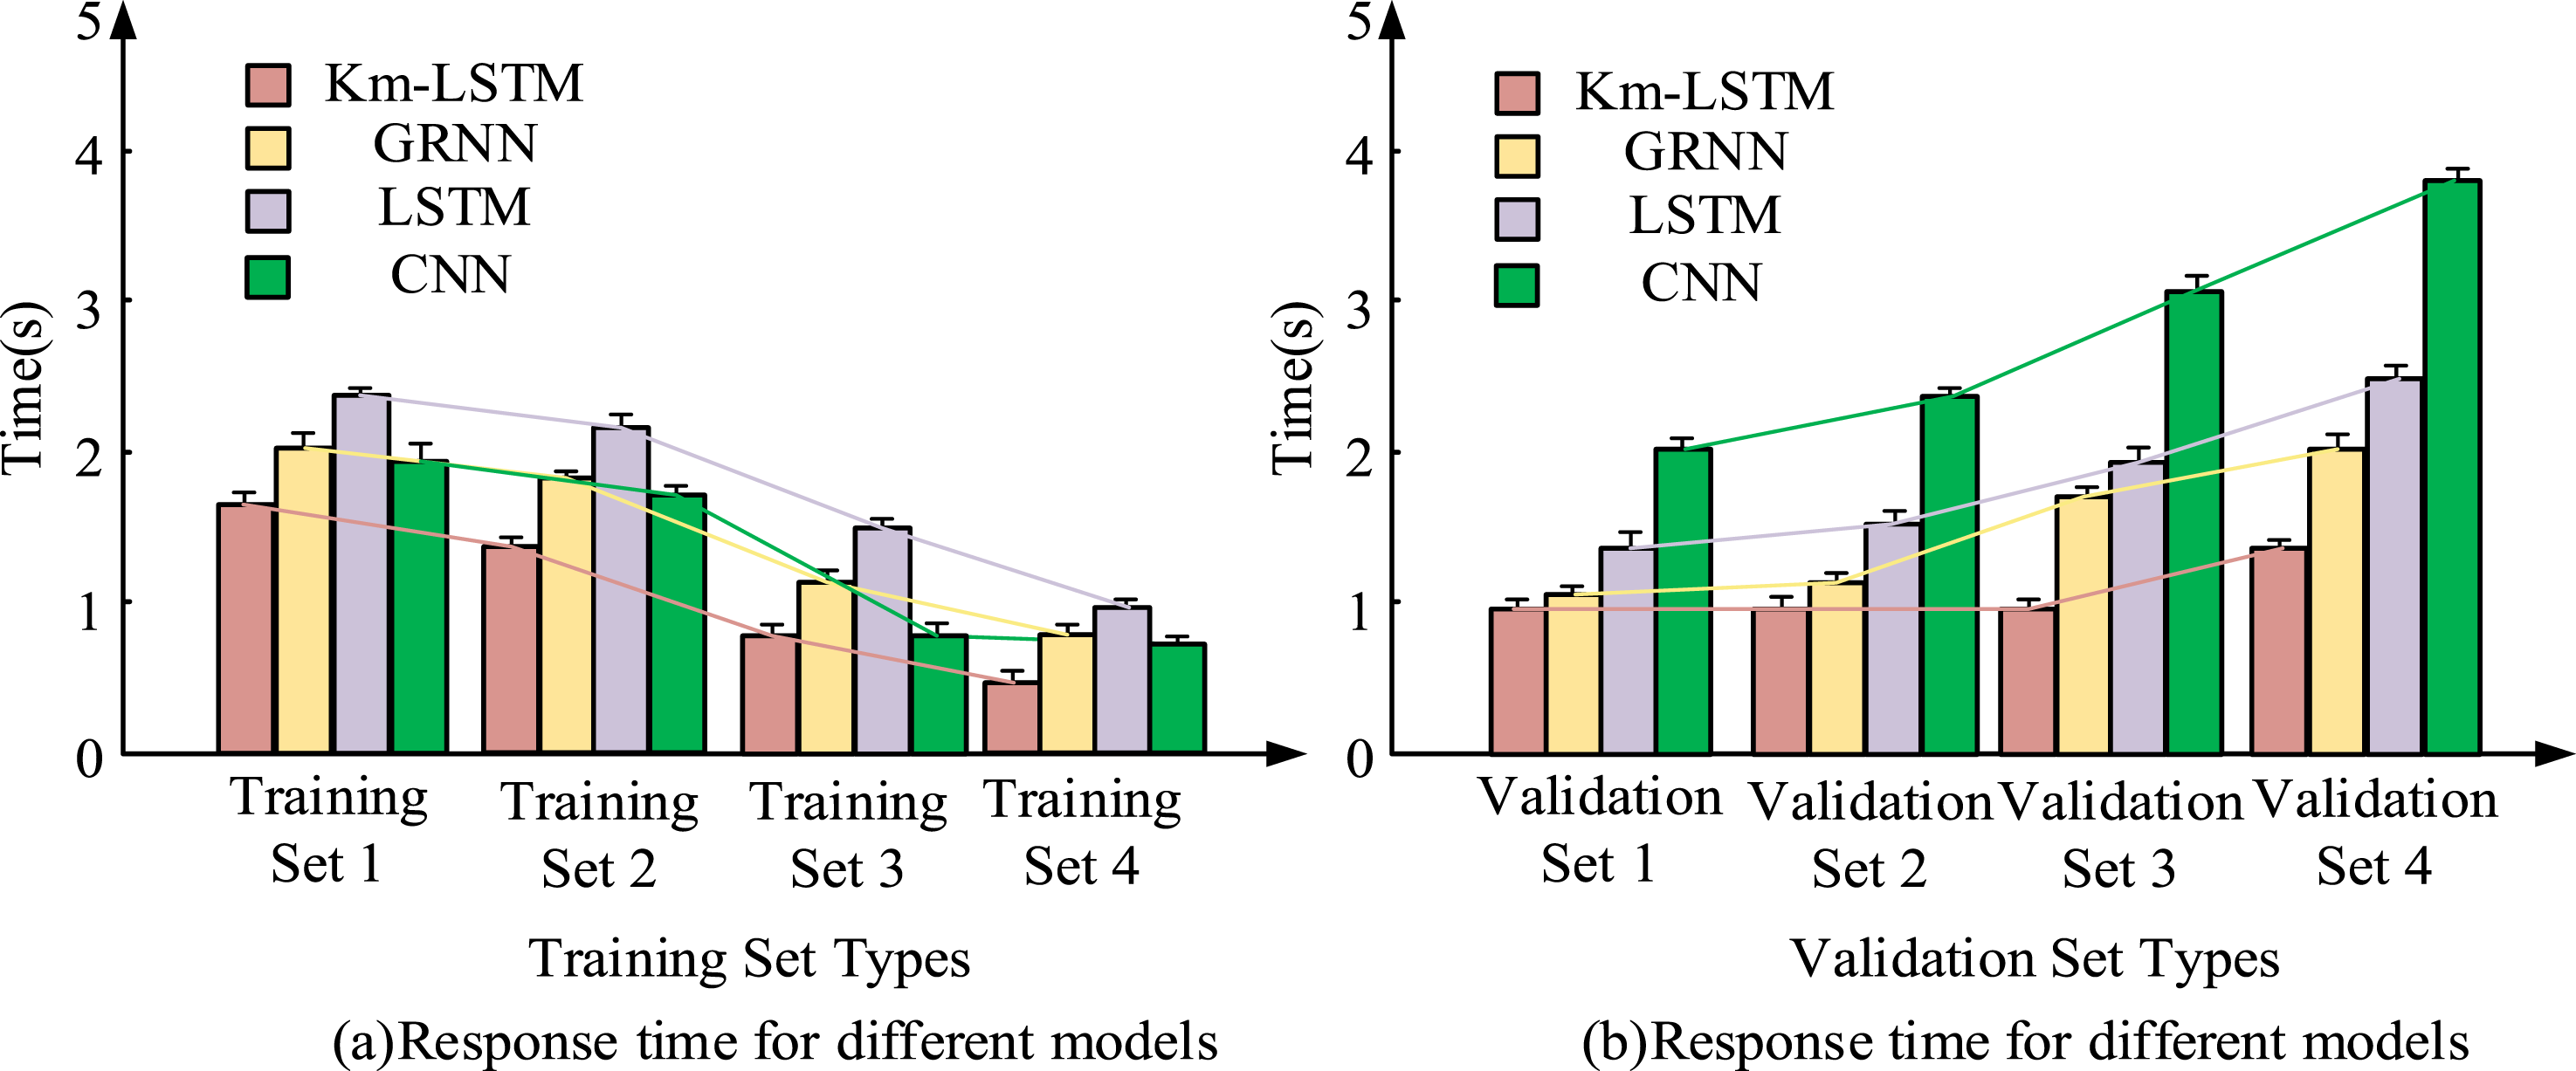
Figure 9(a) shows the processing time of each model on the same validation set under different training set sizes. Figure 9(b) shows the processing time of each model on different validation sets under the same training set size. In Figure 9(a), the processing time decreased. In training set 4, the processing time of CNN, LSTM, GRNN, and Km-LSTM was 0.8 s, 1.0 s, 0.9 s, and 0.4 s, respectively. In Figure 9(b), in different size validation sets, as the validation set increased, the processing time of each model increased. The proposed Km-LSTM had the least incremental processing time among the four models. In validation set 4, the processing time of CNN, LSTM, GRNN, and Km-LSTM was 3.8 s, 2.5 s, 2.0 s, and 1.4 s, respectively. The Km-LSTM can handle large datasets and exhibits good performance in larger datasets. The performance in different iterations is analyzed. The results are displayed in Figure 10. Accuracy and MAE comparison of four models across different iteration counts.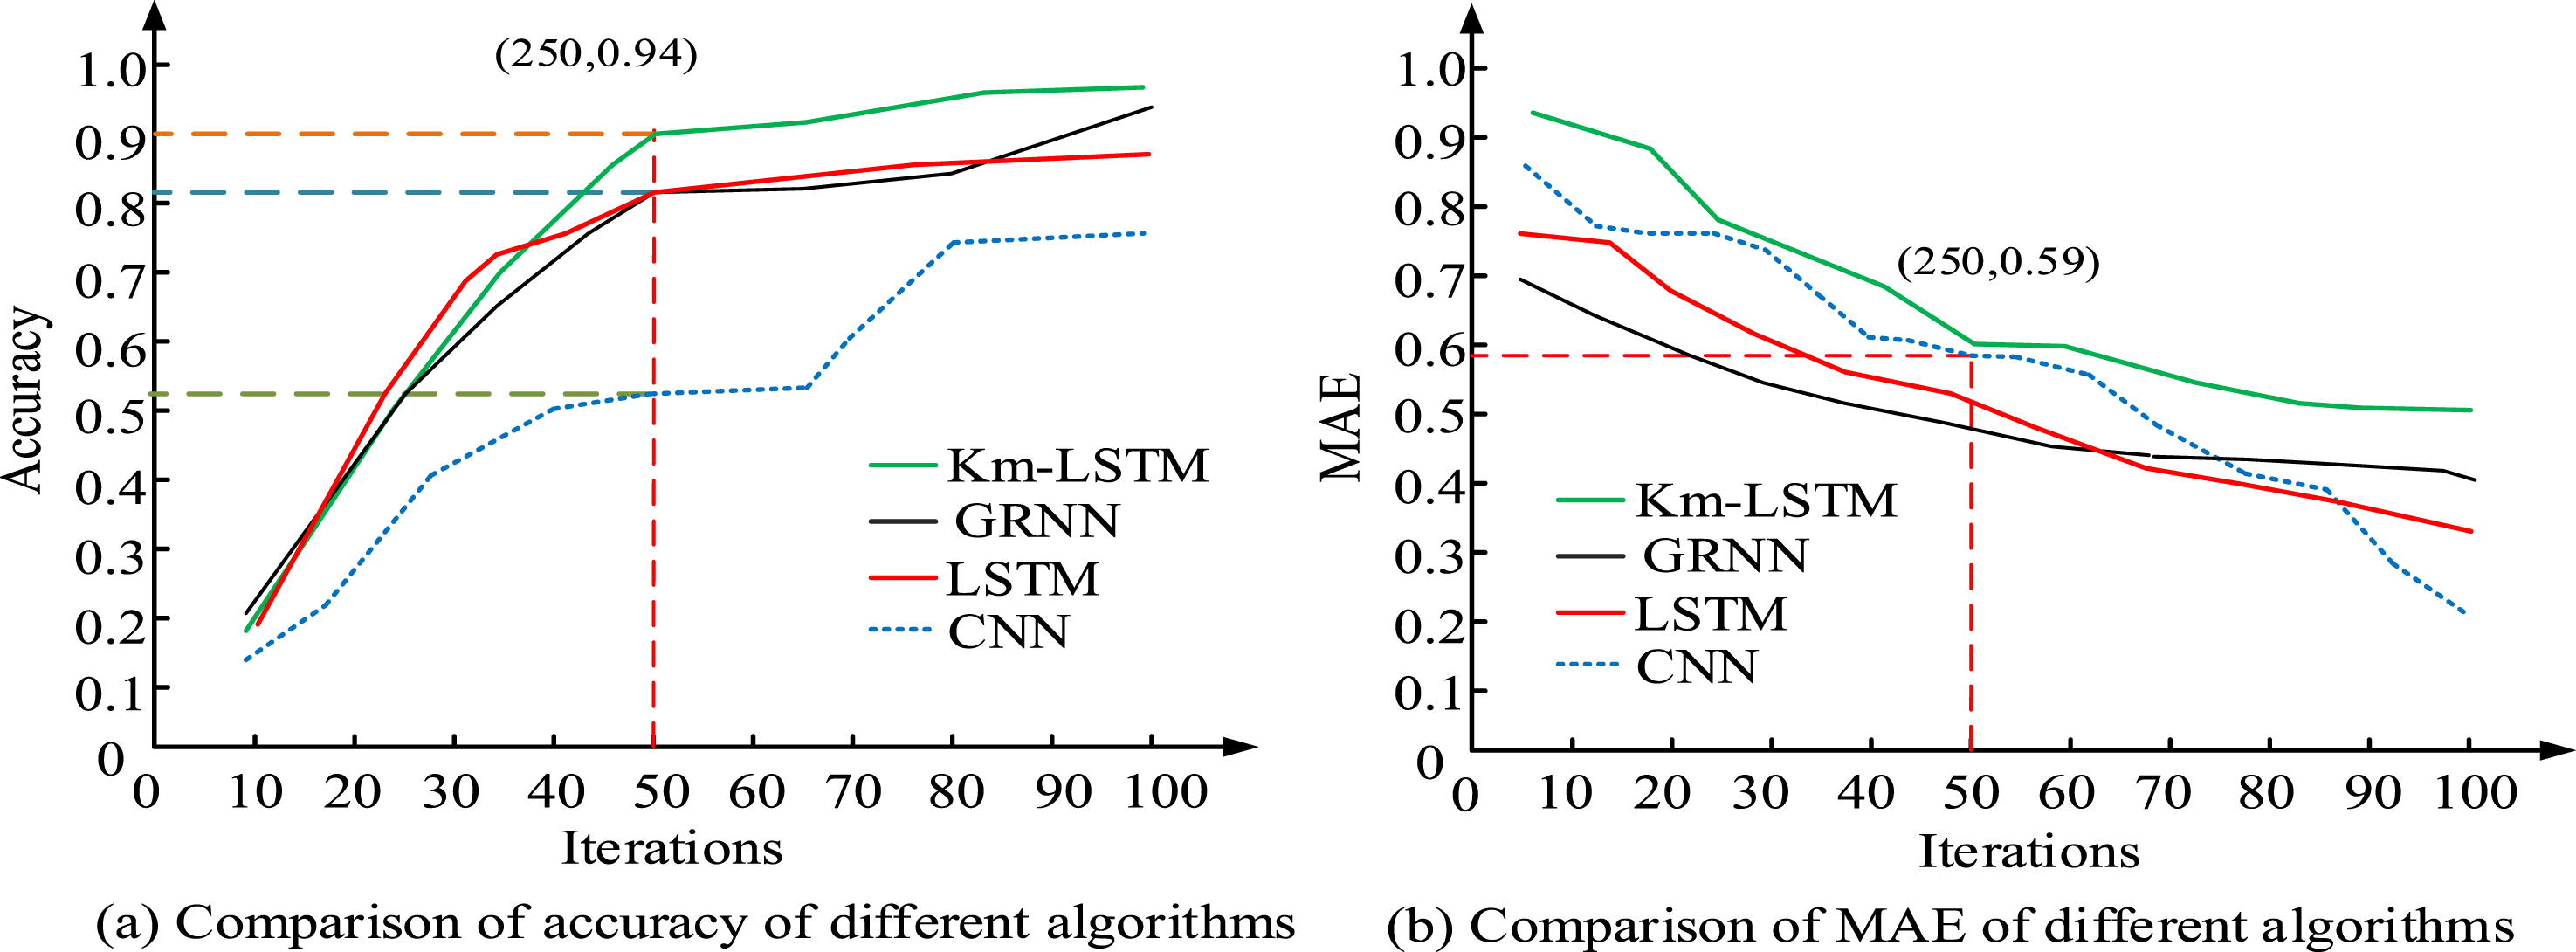
Comparative performance of four models under different student activity states.
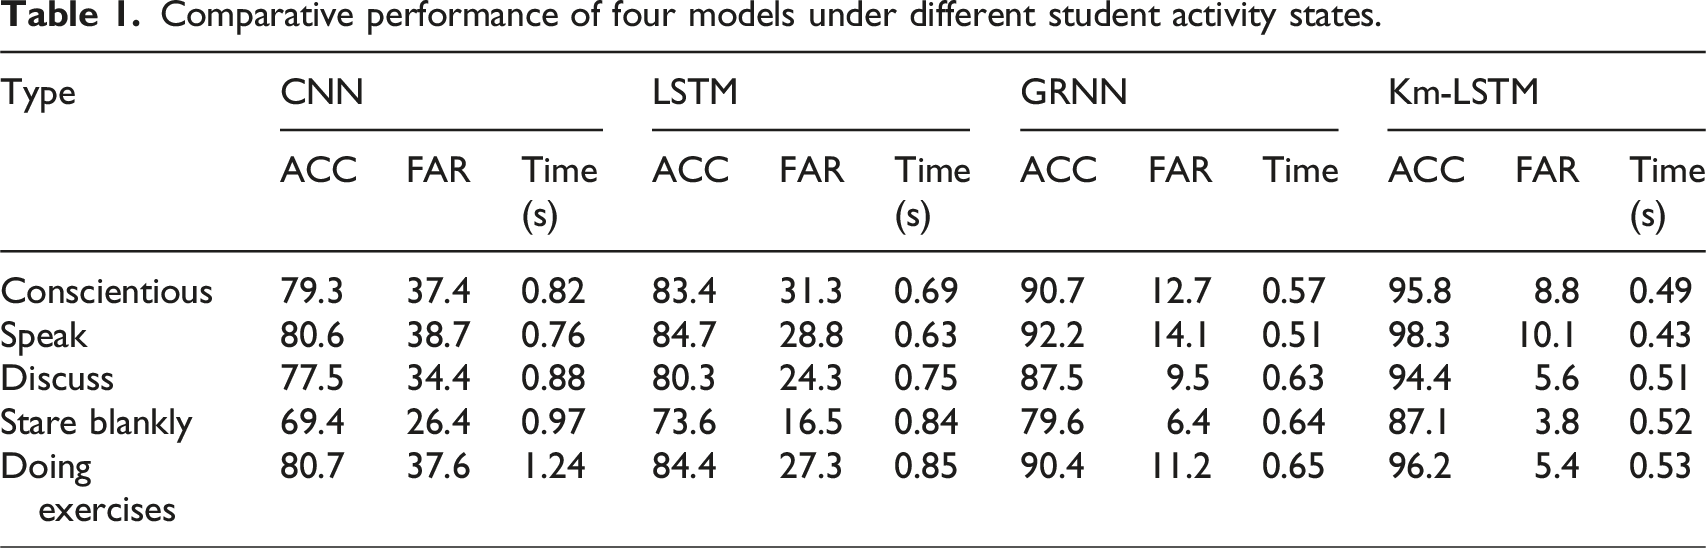
In Table 1, ACC represents the recognition accuracy. FAR represents the false alarm rate of the model. According to Table 1, the CNN showed poor performance. The feature recognition accuracy for different student states was 79.3%, 80.6%, 77.5%, 69.4%, and 80.7%, respectively. It showed a high false alarm rate. The Km-LSTM had a high recognition accuracy and exhibited a low false alarm rate. The feature recognition accuracy of the Km-LSTM for different student states was 95.8%, 98.3%, 94.4%, 87.1%, and 96.2%, respectively, with false alarm rates of 8.8%, 10.1%, 5.6%, 3.8%, and 5.4%. The Km-LSTM had better performance than other models. Another important consideration is the scalability of the proposed model in real-world applications. Experimental results in this study demonstrate that the Km-LSTM and CNN-LSTM structures maintain stable accuracy and low error rates as the training set expands up to 1000 samples. Specifically, the F1-score and RMSE results indicate that the model continues to perform robustly with increasing data volume, and its processing time remains acceptable due to the dimensionality reduction and clustering mechanisms applied in preprocessing. This suggests that the model can be extended to larger PE datasets, such as those collected across multiple schools, semesters, or even districts. In addition, the modular design of the system features decoupled clustering and prediction stages, enabling it to adapt to different teaching environments, whether in secondary schools, universities, or professional training centers. For broader deployments, the framework can be integrated into cloud-based or edge-computing systems, where clustering and LSTM inference can be parallelized or distributed. This provides an opportunity for real-time and scalable evaluation of PE teaching in different educational backgrounds, while maintaining high prediction accuracy and processing efficiency.
In terms of computational efficiency, the proposed PETQM framework is designed to balance prediction accuracy with real-time applicability in PE scenarios. The framework consists of several stages: data preprocessing, clustering using K-medoids, signal decomposition through EEMD, and sequential prediction via CNN-LSTM. Each of these modules has its own computational footprint. The PCA component operates efficiently on medium-scale datasets and significantly reduces feature dimensionality, thereby speeding up downstream processing. Although K-medoids is computationally more intensive than simpler clustering algorithms like K-means, it offers better robustness to outliers and works well given that the number of clusters is relatively small and controlled. The EEMD module, while computationally demanding due to its ensemble nature, benefits from high parallelizability and can be executed efficiently on multi-core systems. The CNN-LSTM model, which integrates spatial and temporal feature extraction, adds modest computational overhead but ensures high-quality predictive performance. The empirical results demonstrate that the full system remains highly efficient in practice. The average processing time per sample stays well below one second, even when scaling up training iterations or data volume. This indicates that PETQM is not only accurate but also computationally feasible for deployment in real-time or near-real-time PE evaluation applications.
Performance analysis of teaching quality evaluation model based on improved LSTM
The YBSS dataset is applied as the training set and the TIMSS dataset as the validation set to analyze the PETQM based on the improved LSTM. The results are shown in Figure 11. Performance of CNN-LSTM, LSTM, and CNN under different training dataset sizes.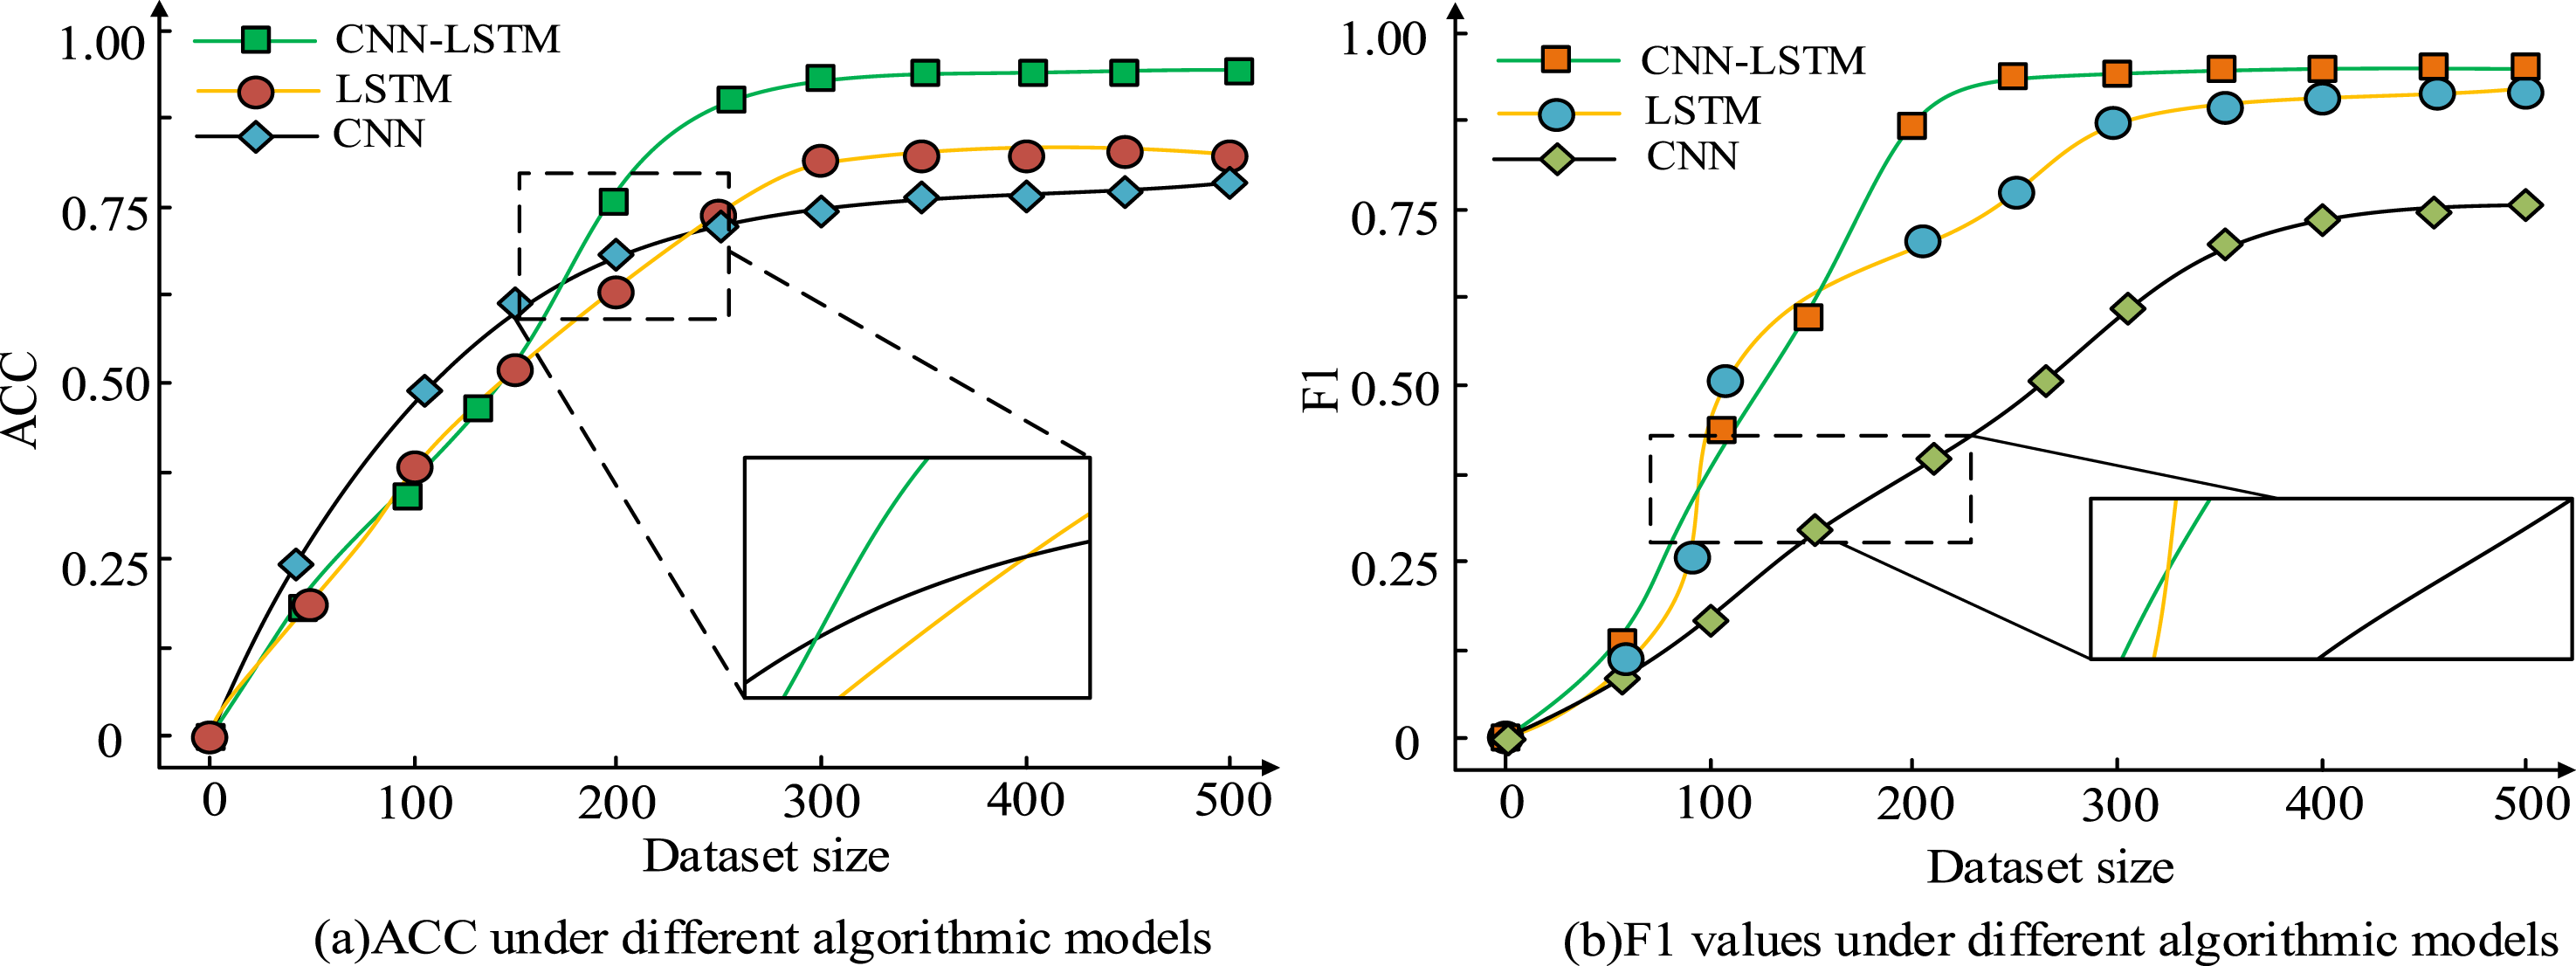
Figure 11(a) displays the accuracy. Figure 11(b) shows the F1 values. In Figure 11(a), as the training set increases, the accuracy of all three models has added. The proposed CNN-LSTM exceeded other strategies. When the size was 500, the accuracy of the CNN-LSTM, LSTM, and CNN were 0.96, 0.83, and 0.79, respectively. In Figure 11(b), as the training set increased, the F1 has continued to increase. When the dataset size was 500, the F1 values of the three models were 0.97, 0.90, and 0.76. The proposed CNN-LSTM exhibited good accuracy and F1 value among the three models. The CNN-LSTM can achieve good performance on smaller datasets. The performance and efficiency of various models in practical applications are displayed in Figure 12. Execution time of different models under increasing iterations and PE data volume.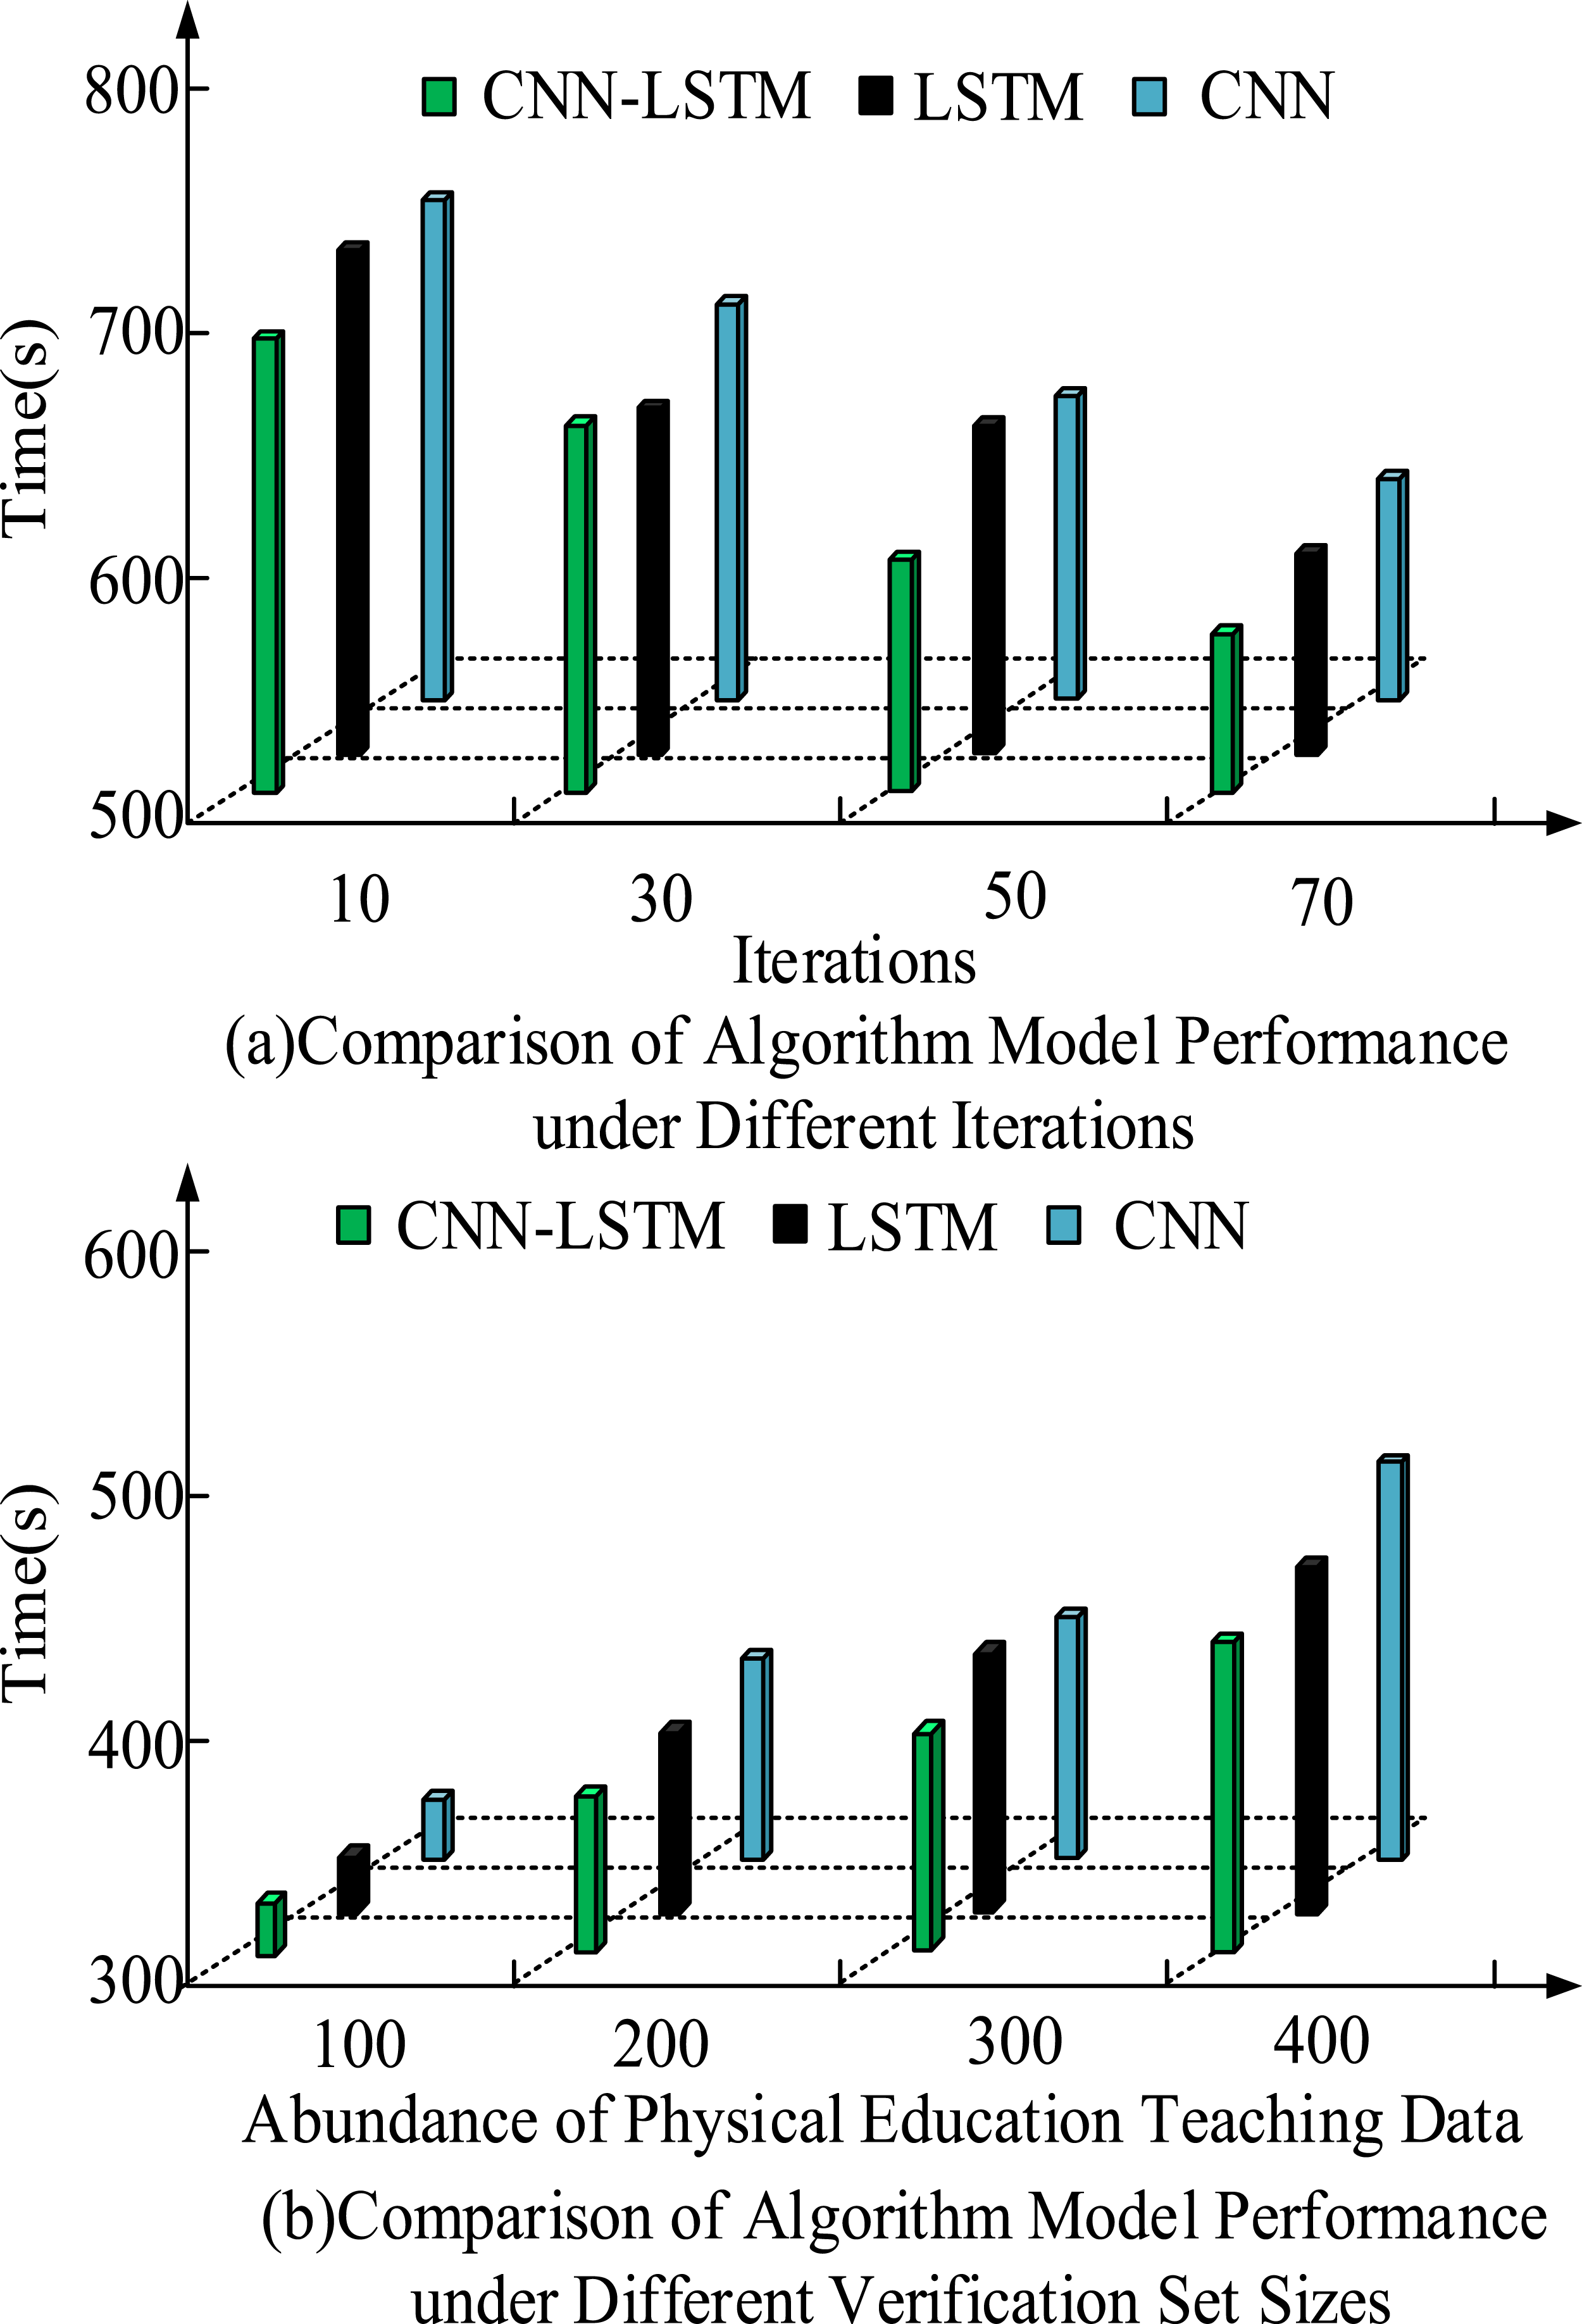
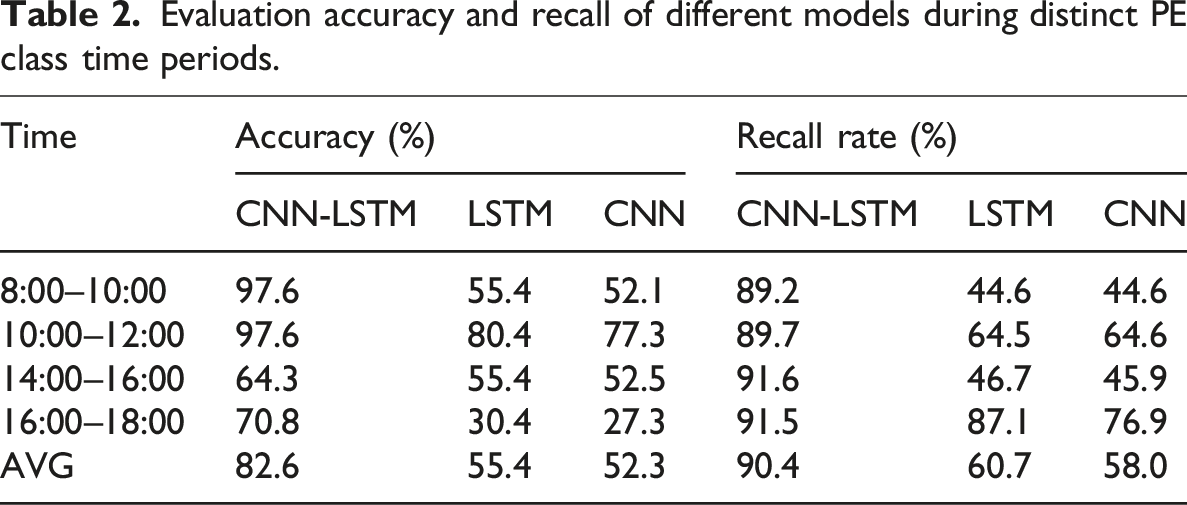
Evaluation accuracy and recall of different models during distinct PE class time periods.
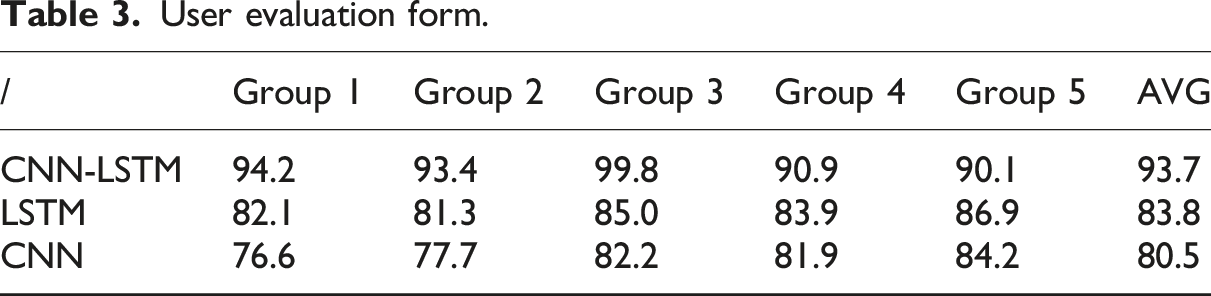
User evaluation form.
Ablation experiment analysis table.
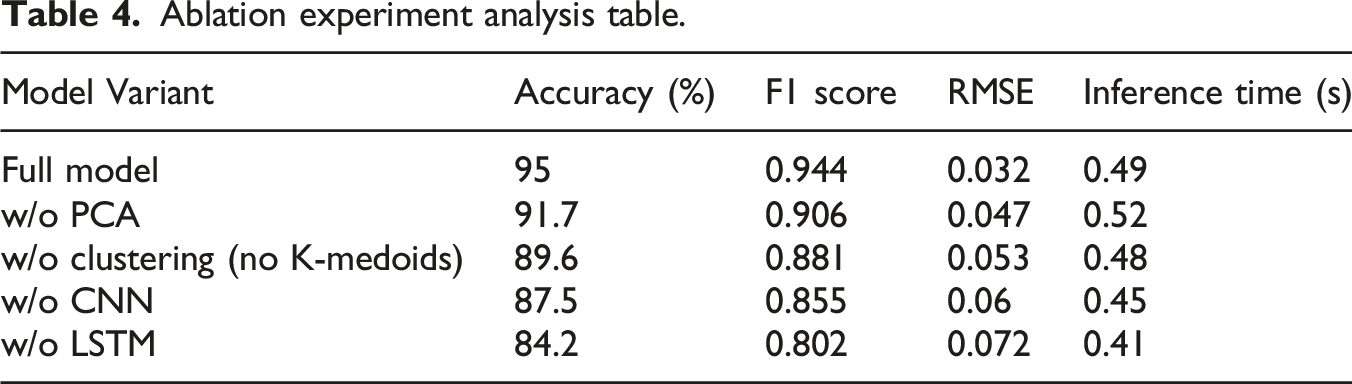
To assess the contribution of each component, an ablation study is conducted by removing one module at a time from the full CNN-LSTM framework. As shown in Table 3, excluding PCA led to a noticeable drop in accuracy and increased RMSE, indicating its role in noise reduction and decorrelating inputs. When clustering was removed, performance further declined, as the lack of structured pre-grouping degraded temporal learning. Removing CNN caused the model to rely solely on LSTM, weakening its spatial feature extraction, while omitting LSTM greatly impaired the model’s ability to learn sequential dependencies. This confirms that each module contributes uniquely to the model’s final performance. The synergy between spatial, structural, and temporal modeling is essential for high-quality PE teaching evaluation.
Conclusion
With the advancement of big data in education, objective, accurate, and scalable models for evaluating PE quality have become increasingly necessary. This study proposes a novel evaluation framework integrating K-medoids clustering with an improved CNN-LSTM model, enhanced further by EEMD-based decomposition. The model effectively filtered and compressed noisy classroom data, captured spatiotemporal features, and delivered high prediction accuracy. Then, the data was input into CNN-LSTM for teaching quality evaluation. The data was then input into CNN-LSTM for assessment. The experimental results showed that when the training set size was 1,000, the F1 of CNN, LSTM, GRNN, and Km-LSTM was 0.88, 0.90, 0.95, and 0.98, respectively. The RMSE values were 0.27, 0.16, 0.13, and 0.11, respectively. In training set 4, the processing time of CNN, LSTM, GRNN, and Km-LSTM was 0.8 s, 1.0 s, 0.9 s, and 0.4 s, respectively. When the iterations reached 100, all models converged. The accuracy of CNN, LSTM, GRNN, and Km-LSTM was 0.76, 0.87, 0.92, and 0.98, respectively. The MAE values were 0.55, 0.44, 0.34, and 0.21, respectively. The feature recognition accuracy of the Km-LSTM for different student states was 95.8%, 98.3%, 94.4%, 87.1%, and 96.2%, respectively, with false alarm rates of 8.8%, 10.1%, 5.6%, 3.8%, and 5.4%. The proposed CNN-LSTM was better. When the dataset size was 500, the accuracy of the CNN-LSTM, LSTM, and CNN was 0.96, 0.83, and 0.79. It achieved good performance on smaller datasets. However, there are still shortcomings in the current research. A significant limitation lies in the composition of the dataset used. Although the YBSS and TIMSS datasets provide valuable large-scale survey information, a portion of the data originates from non-classroom environments, such as general physical health records or extracurricular activity logs. These records may not accurately reflect students’ real-time behavior, engagement, or instructional context within PE classes. This discrepancy may have introduced semantic noise or domain mismatch, which in turn could affect the prediction accuracy of the neural network. For example, certain features, such as physical health indicators, might exhibit strong correlations in general health assessments but show weak predictive value in assessing moment-to-moment teaching quality. To overcome this issue, future research should consider constructing or utilizing specialized, high-resolution classroom datasets tailored specifically for PE instruction. These datasets should include synchronized data streams from actual PE settings, such as in-class motion tracking, wearable sensor readings, real-time participation logs, and instructor evaluations. Additionally, improved data annotation protocols and multi-modal sensor integration (e.g., video, posture, and audio cues) can help capture richer contextual signals. These enhancements will allow future models to better align with the realistic dynamics of PE instruction, reduce generalization bias, and improve the interpretability and reliability of the evaluation outcomes.
Beyond theoretical performance, the proposed PETQM model also holds practical significance for teaching managers and PE instructors. By integrating this evaluation system into classroom environments, teachers can obtain real-time feedback on students’ physical engagement, behavioral performance, and learning outcomes. This enables instructors to identify at-risk students, adjust teaching strategies dynamically, and allocate instructional time more effectively across different learner groups. For teaching administrators, the model facilitates data-informed decision-making regarding curriculum planning, teacher performance reviews, and overall quality control in PE programs. The clustering-based preprocessing enables the system to adapt to diverse student populations, while the neural network component delivers consistent evaluation results without the variability caused by subjective observation. In practical deployment, the model can be embedded into smart classroom platforms or mobile PE monitoring systems, continuously collecting and evaluating multi-modal data such as movement patterns, test scores, and participation logs. Over time, this could lead to a shift from traditional one-size-fits-all assessment approaches toward personalized and adaptive PE instruction, supporting more inclusive and scientifically grounded PE environments.
Footnotes

Funding
The authors received no financial support for the research, authorship, and/or publication of this article.
Declaration of Conflicting Interests
The authors declared no potential conflicts of interest with respect to the research, authorship, and/or publication of this article.