
Abstract
With the growing complexity of enterprise financial data, traditional financial warning models face limitations in handling large datasets and outliers. This study proposes a novel financial warning model integrating ensemble learning and stacked generalization. A two-layer fusion model is constructed using stacking generalization, while SMOTETomek addresses data imbalance. Model parameters are optimized via grid search and five-fold cross validation. Experimental results demonstrate superior performance, with an average accuracy of over 90%. The accuracy on the training and testing sets reach 0.93 and 0.95, respectively. The model achieves a low false positive rate (3.8%) and false negative rate (3.2%) in the low debt category, outperforming comparison models. It also exhibits high resource efficiency and low time costs, making it an ideal tool for enterprise financial early warning. The model aids in identifying financial risks, enabling proactive response strategies, promoting healthy financial management, and enhancing market stability.
Keywords
Introduction
Building accurate and timely financial warning systems has become an important component of modern enterprise financial management. 1 An efficient financial warning system can not only help businesses identify potential risks and ensure financial stability, but also improve overall operational efficiency and competitiveness in a fierce and unpredictable market environment. As information technology and big data advance rapidly, traditional financial warning models are no longer able to cope with the diversity and complexity of enterprise financial data. 2 Recently, the utilization of machine learning and ensemble learning (EL) in financial early warning has gradually become a research hotspot. These emerging technologies can demonstrate significant advantages in model performance, prediction accuracy, and generalization ability. Machine learning algorithms analyze and predict financial data in a data-driven manner, capturing potential nonlinear relationships. 3 The integrated learning method effectively reduces the deviation and variance of a single model by integrating multiple basic models, and enhances the robustness and reliability of the forecasting system. 4 The enterprise financial warning system predicts the company’s upcoming financial condition, helps the management to identify potential financial risks beforehand and implement prompt countermeasures, and is an important component of enterprise management. 5 The instability of the economic market makes financial risk management for enterprises more complex and necessary. An effective financial warning system can improve the consistency of the monetary market, especially for listed companies. Accurate financial warnings contribute to the sound progression of both the company and the financial market. Against the backdrop of increasingly volatile economic markets and accelerating globalization, the financial risks faced by enterprises have become more complex, and traditional financial analysis methods can no longer fulfill the risk management requirements of modern enterprises. 6
Numerous researchers globally have investigated improving the accuracy of financial forecasting for enterprises. To compensate for the shortcomings of a single machine learning model in predictive performance, Yi combined Support Vector Machine (SVM) with Backpropagation Neural Network (BPNN) to construct a business financial and budgetary advance alert system. The simulation experiment outcomes showed that the combined model surpassed the single algorithm model in the context of convergence speed and prediction accuracy, and had a positive impact on the fiscal stability of publicly traded firms. 7 Jiao believed that the rational utilization of financial resources is helpful for achieving business goals. Therefore, he studied the use of chaotic particle swarm optimization algorithm to improve the BPNN and constructed a financial management early warning model for circular economy in enterprises. The experiment showed that the model had low error and fast convergence speed, significantly better than traditional models, and had high application value in enterprise financial management. 8 Li developed an enterprise financial risk identification system grounded on logistic regression models to handle the problem of low recognition accuracy in existing financial warning models. By comparing companies with losses and those with normal financial conditions, it was found that the model had an accuracy of 94.68% in identifying financial risks in enterprises. The high accuracy of the model in identifying financial risks in scientific research enterprises was verified, providing an effective risk management tool for enterprise management. 9 Li and Chen proposed a financial distress prediction framework grounded on the Improved Fruit Fly Optimization Algorithm (IFOA) and studied the use of quantum computing to select financial crisis indicators and optimize the FOA. By optimizing the diversity of solutions and individual cross performance, the prediction accuracy and convergence speed of the model was significantly proposed, rendering it appropriate for financial crisis warning in the manufacturing industry. 10 Zeng proposed a financial risk warning model grounded on the Internet of Things to improve the financial management capabilities of enterprises. By using BPNN to mine financial data and input the model, mobile edge computing (MEC) service was introduced to improve the timeliness of financial information processing. Experiments showed that optimizing service preloading improved the response speed of the model and had important reference value for enterprise financial management. 11
Comparative summary table of related research.
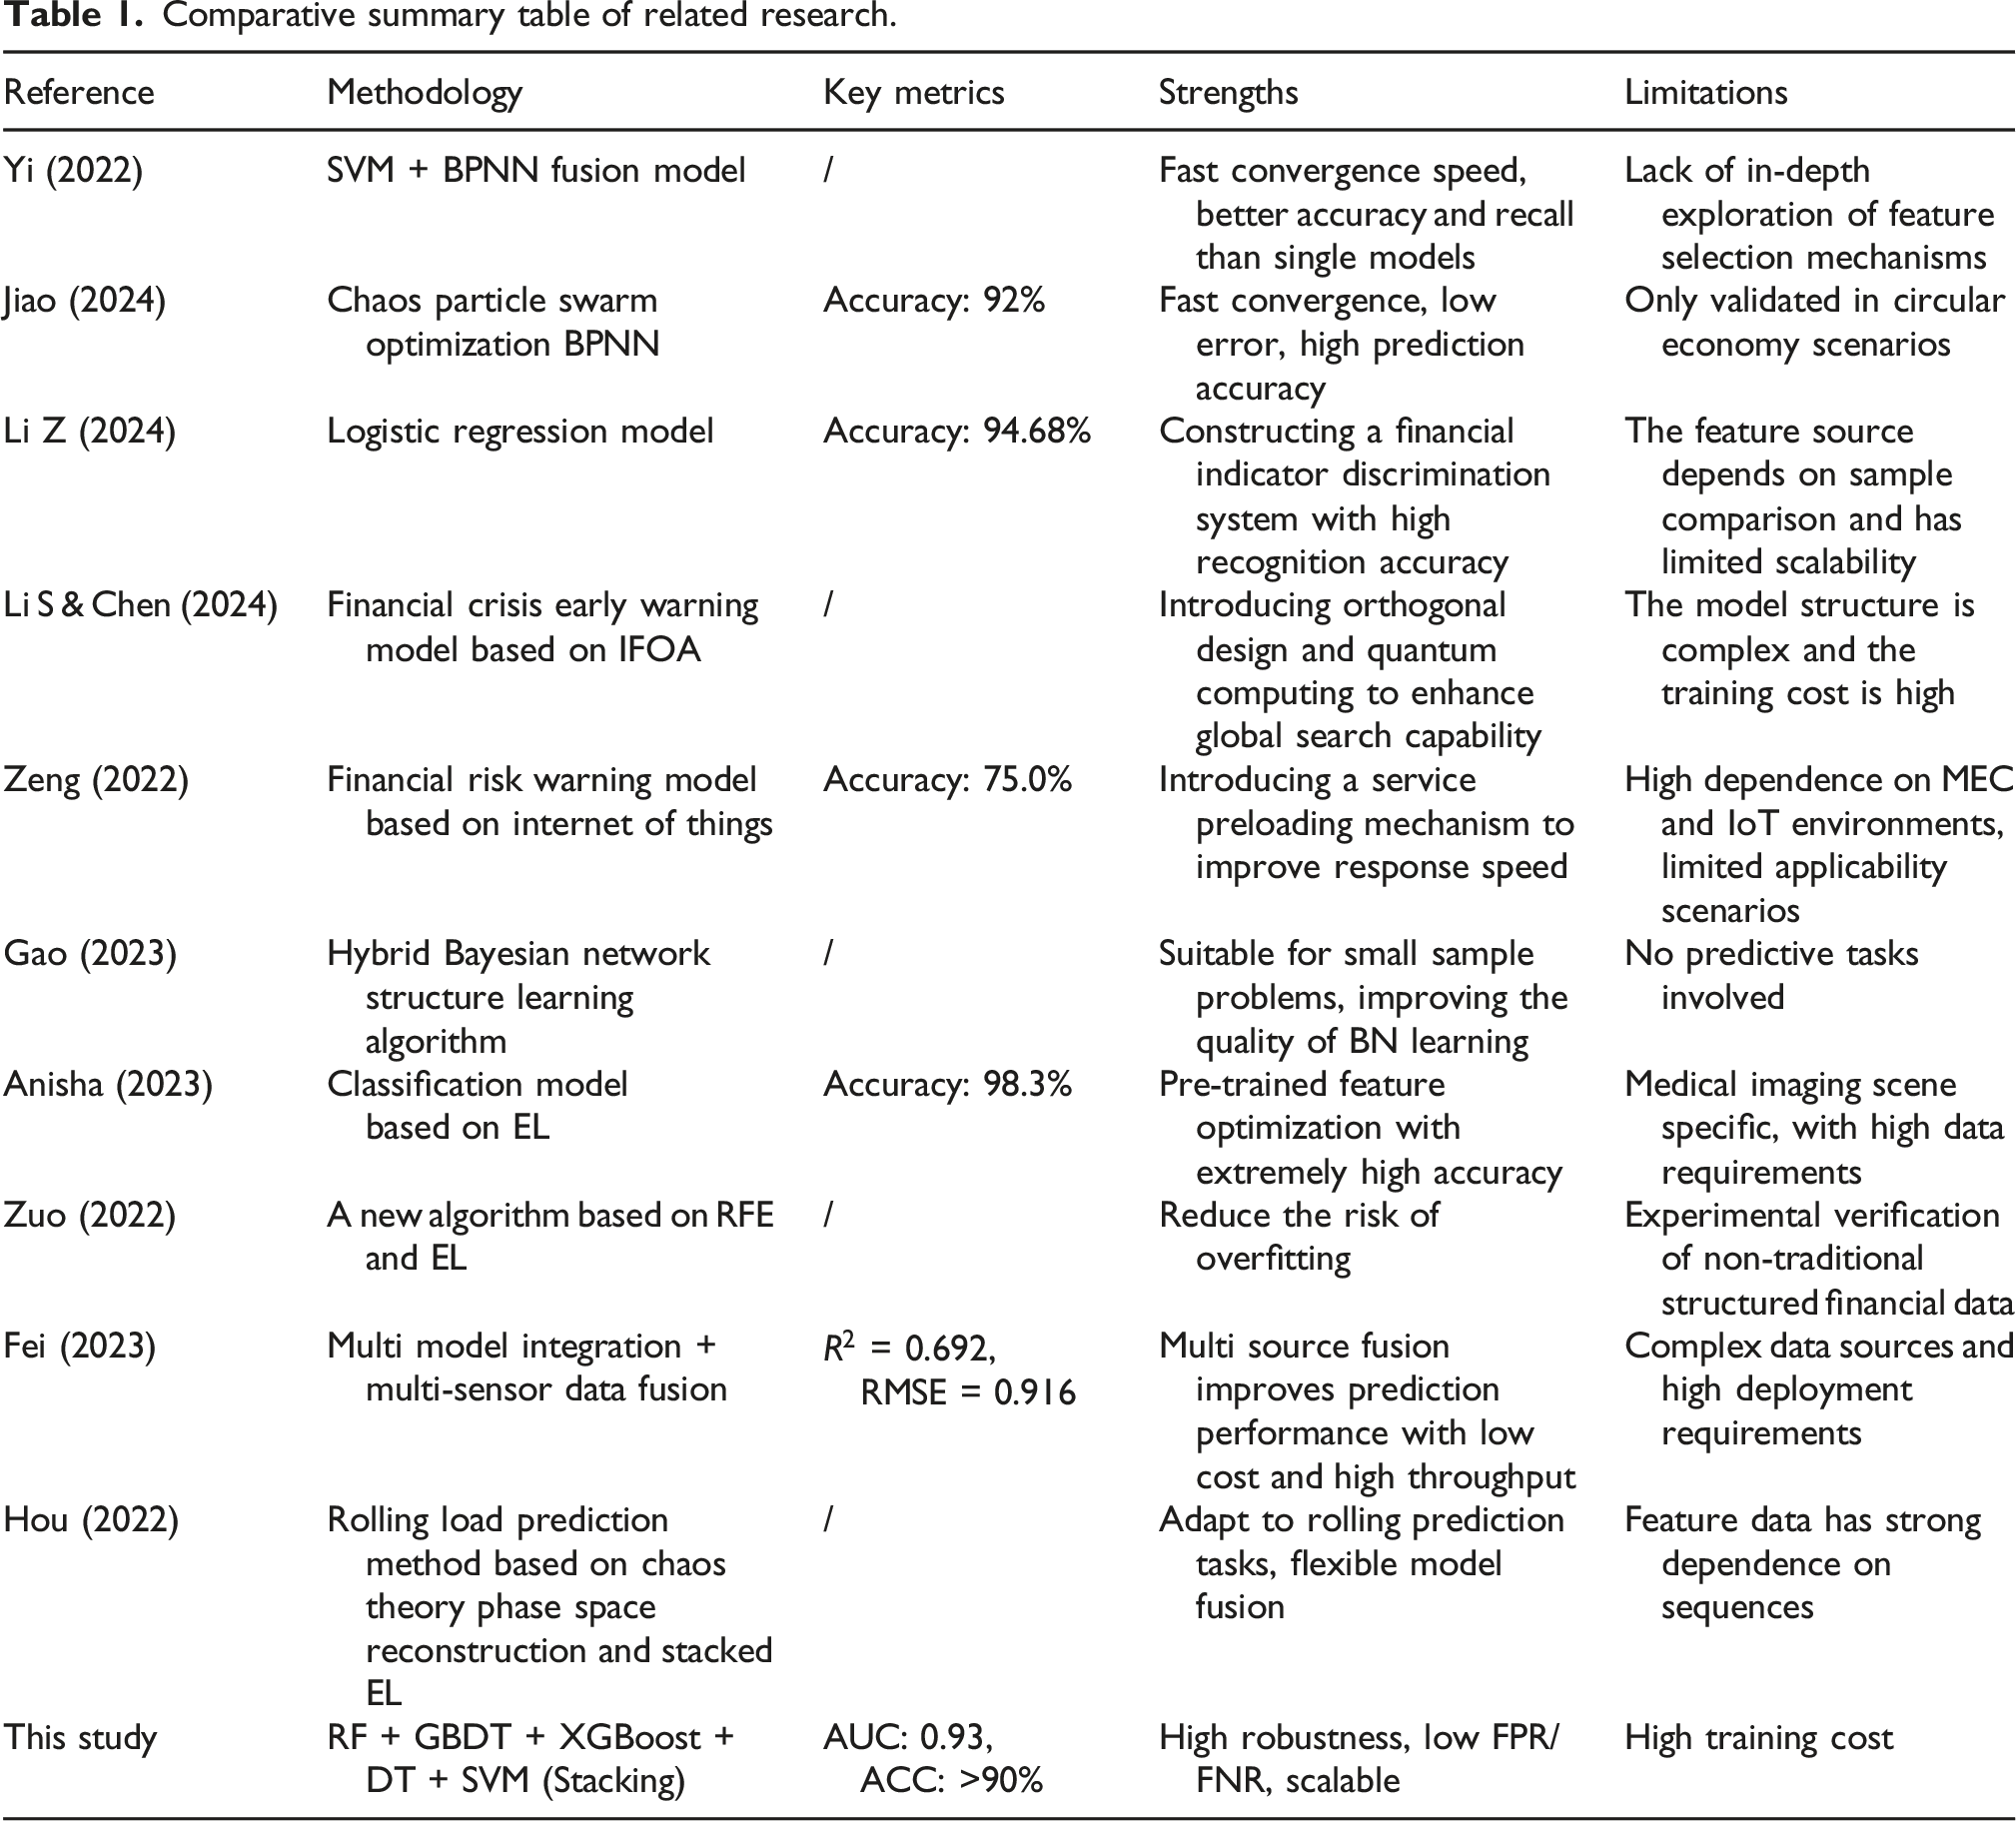
According to the comparison of relevant works in Table 1, although existing research has made some progress, most models still face challenges such as data imbalance, difficulty in feature selection, and insufficient model generalization ability. In view of this, an innovative enterprise financial warning model based on EL and stacked generalization fusion algorithm is proposed. By integrating multiple machine learning algorithms such as RF, Gradient Boosting Decision Tree (GBDT), eXtreme Gradient Boosting (XGBoost), Decision Tree (DT), and SVM, a high-performance and robust fusion model is constructed. Intended to help enterprises maintain financial health in complex and ever-changing market environments, support the creation of business strategy choices, and provide guarantees for the healthy development of financial markets.
Methods and materials
The study first constructed a financial warning indicator system based on 8 dimensions, aiming to provide comprehensive monitoring and management of the fiscal well-being of companies. Meanwhile, to tackle the problem of unequal data distribution, the study adopted the SMOTETomek sampling method, which combines oversampling and undersampling to ensure the balance of the dataset. In terms of model construction, the study adopted EL and stacked generalization techniques, integrating five machine learning algorithms to construct a two-layer stacked fusion model. Model parameters were optimized through grid search and five-fold cross validation to ensure good robustness and high prediction accuracy of the model.
Construction of enterprise financial early warning indicator system
A comprehensive indicator system is the key foundation for the efficient and accurate financial warning model of a company. Based on the principles of comprehensiveness, operability, comparability, and sensitivity, the study comprehensively considered multiple key dimensions to guarantee the comprehensiveness and accuracy of the model and constructed a preliminary financial warning indicator system, as shown in Figure 1.
19
Preliminary financial warning indicator system.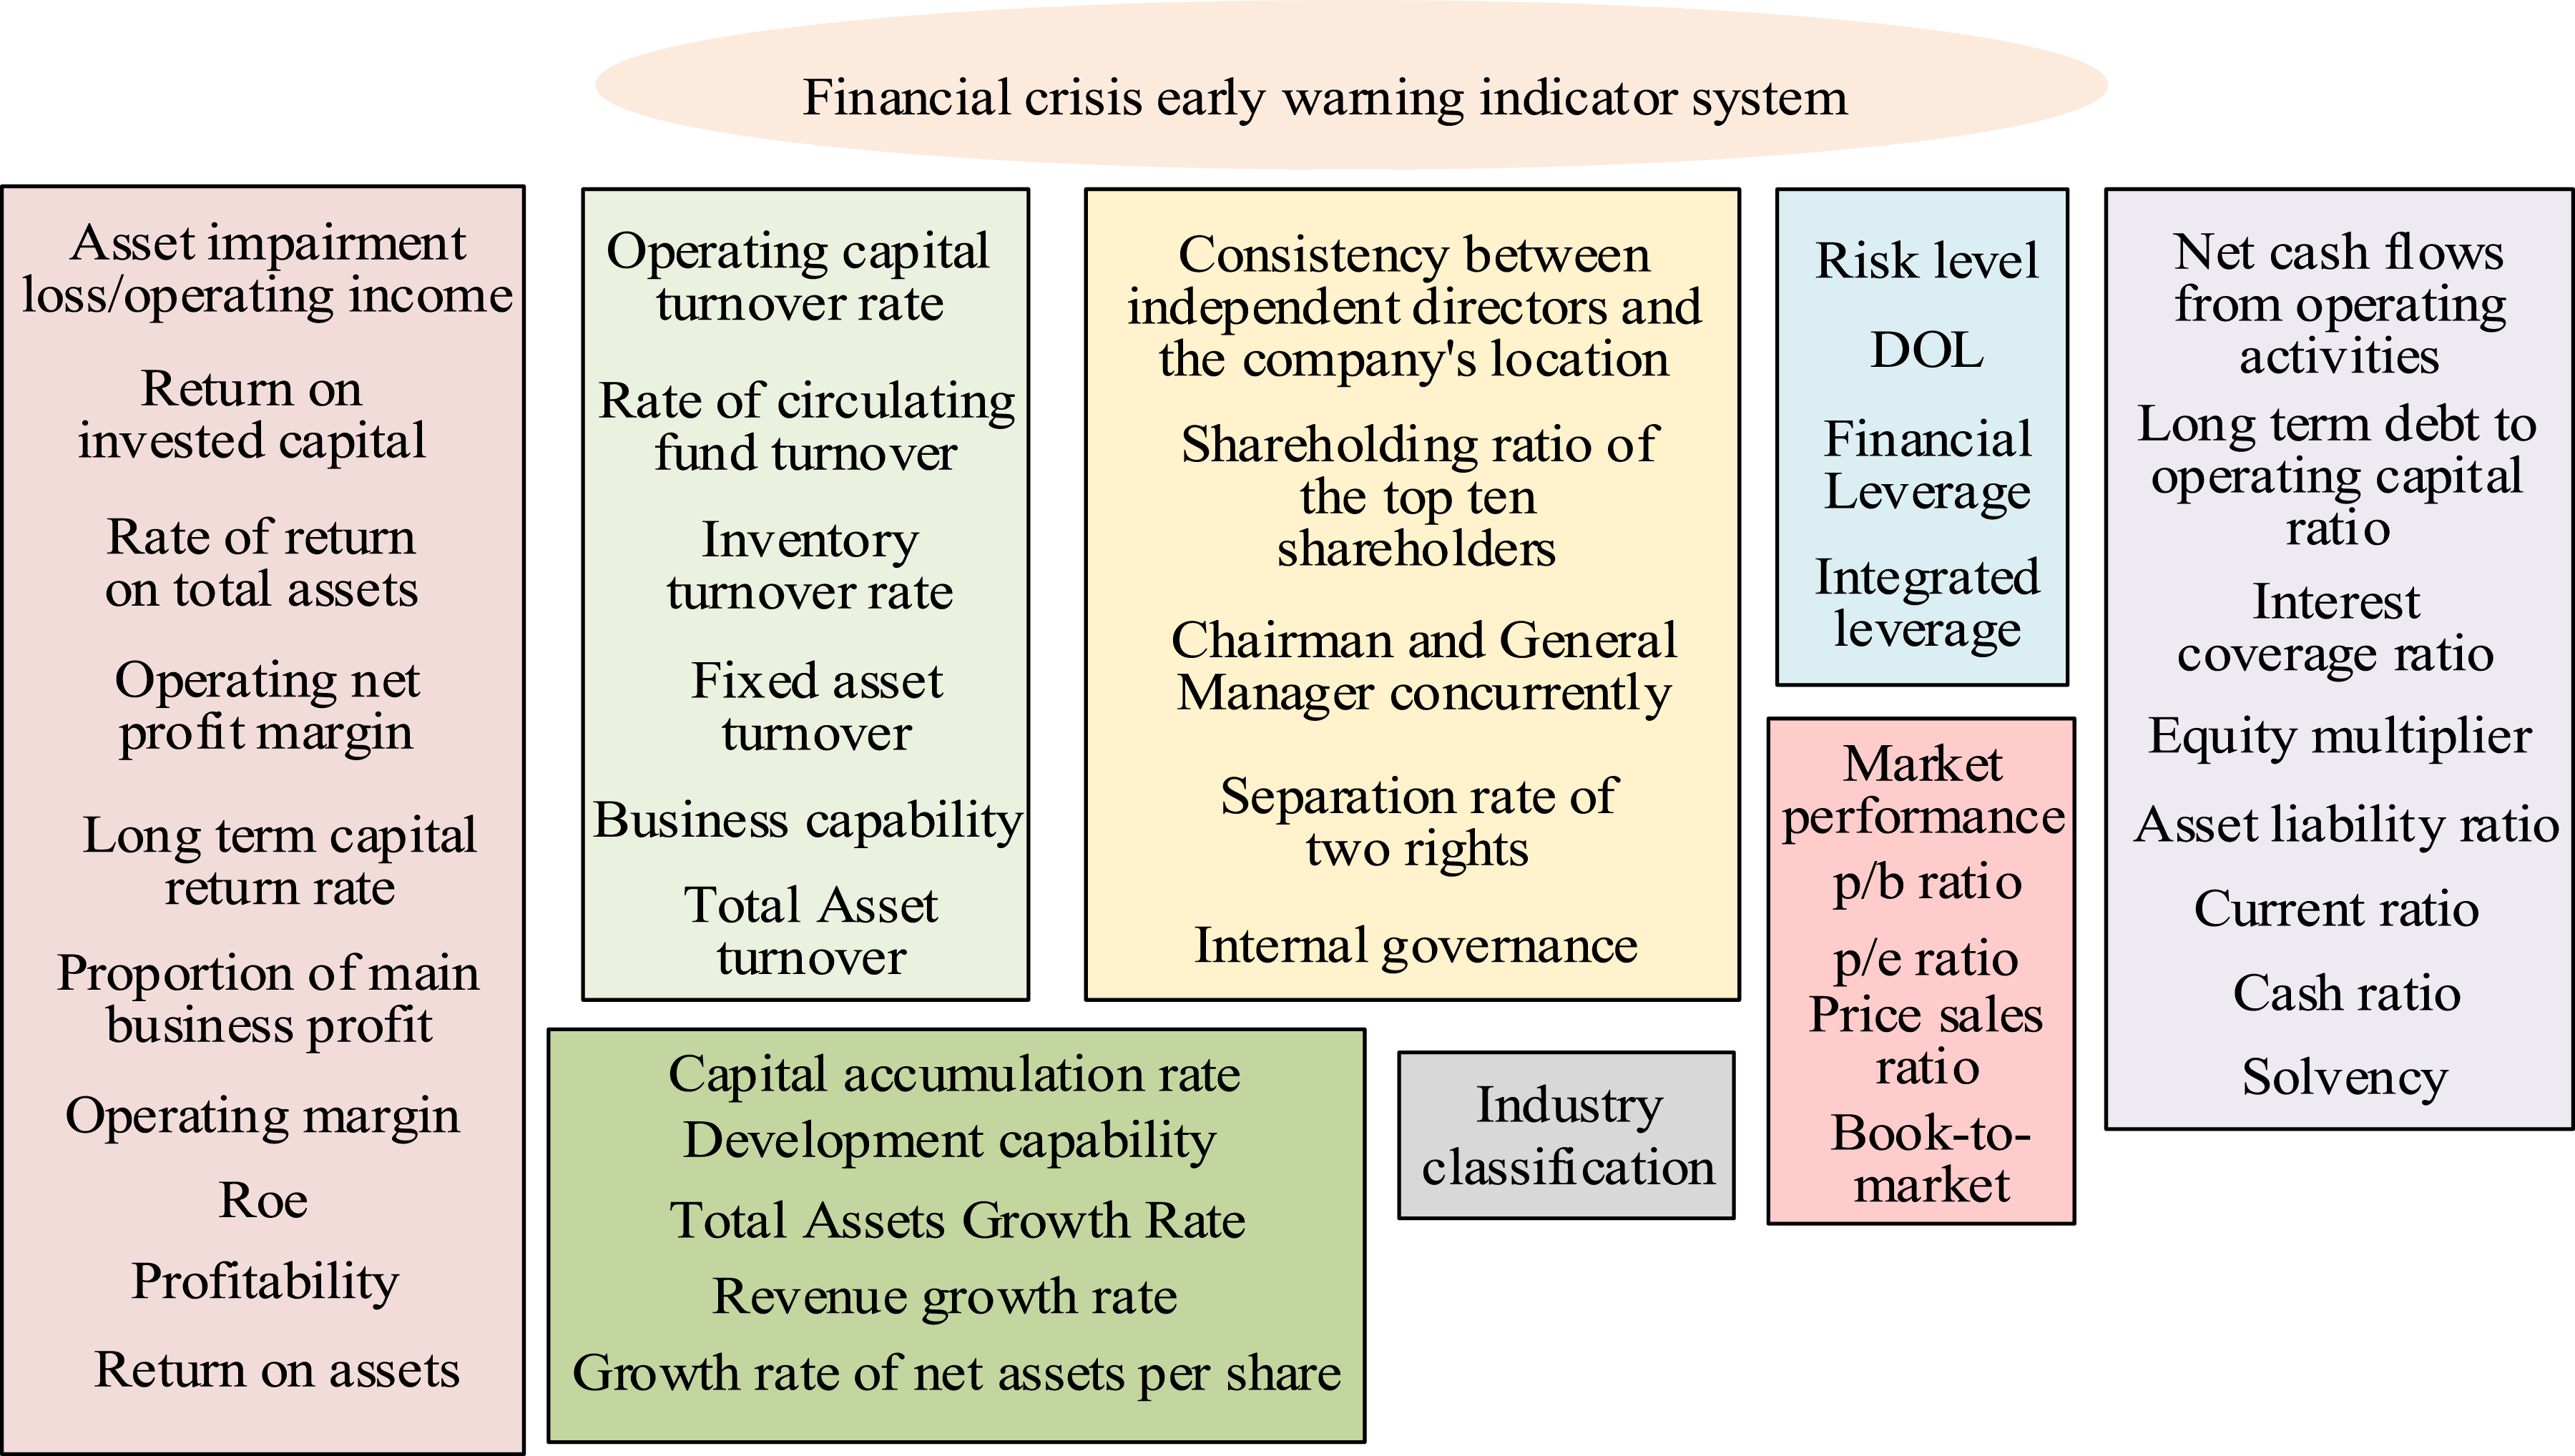
In Figure 1, when constructing the enterprise financial early warning system, the study considered eight main dimensions, namely industry classification, operational capability, profitability, debt paying capability, development capability, risk level, market performance, and internal governance, to ensure that the model is comprehensive and accurate.
5
Financial indicators are the core, directly related to financial crises, and also easy to obtain and operate. Financial losses, insufficient cash flow, and negative net profit are clear signs of a crisis, and these indicators can be obtained through financial statements. The market efficiency hypothesis supports stock price changes as warning indicators. The study also emphasizes the importance of internal governance, such as shareholder affiliation and executive dual roles, which can raise the predictive precision of the model. The study selected 29 financial indicators, 4 market performance indicators, and 4 internal governance indicators, totaling 37 dimensions, to construct a comprehensive financial risk monitoring and management tool. In reality, the proportion of companies facing financial difficulties among all listed companies is relatively small, and the proportion between companies with financial crises and those with good financial conditions is extremely uneven. If this imbalanced data are directly used for analysis, the predicted results are likely to lean towards samples with good financial conditions. Faced with this imbalance problem, previous studies often increased the number of financial crisis samples through random oversampling, or reduced the number of financial health samples through random undersampling, in order to achieve data balance. However, oversampling may lead to overfitting of the model to positive samples, while undersampling may result in loss of key information. Considering the shortcomings of using oversampling or undersampling separately, a comprehensive sampling strategy was adopted in the study, which combines SMOTE oversampling and Tomek link undersampling methods to achieve data balance. The SMOTETomek comprehensive sampling process is shown in Figure 2.
20
SMOTETomek comprehensive sampling flowchart. (a) SMOTE (b) Tomek link.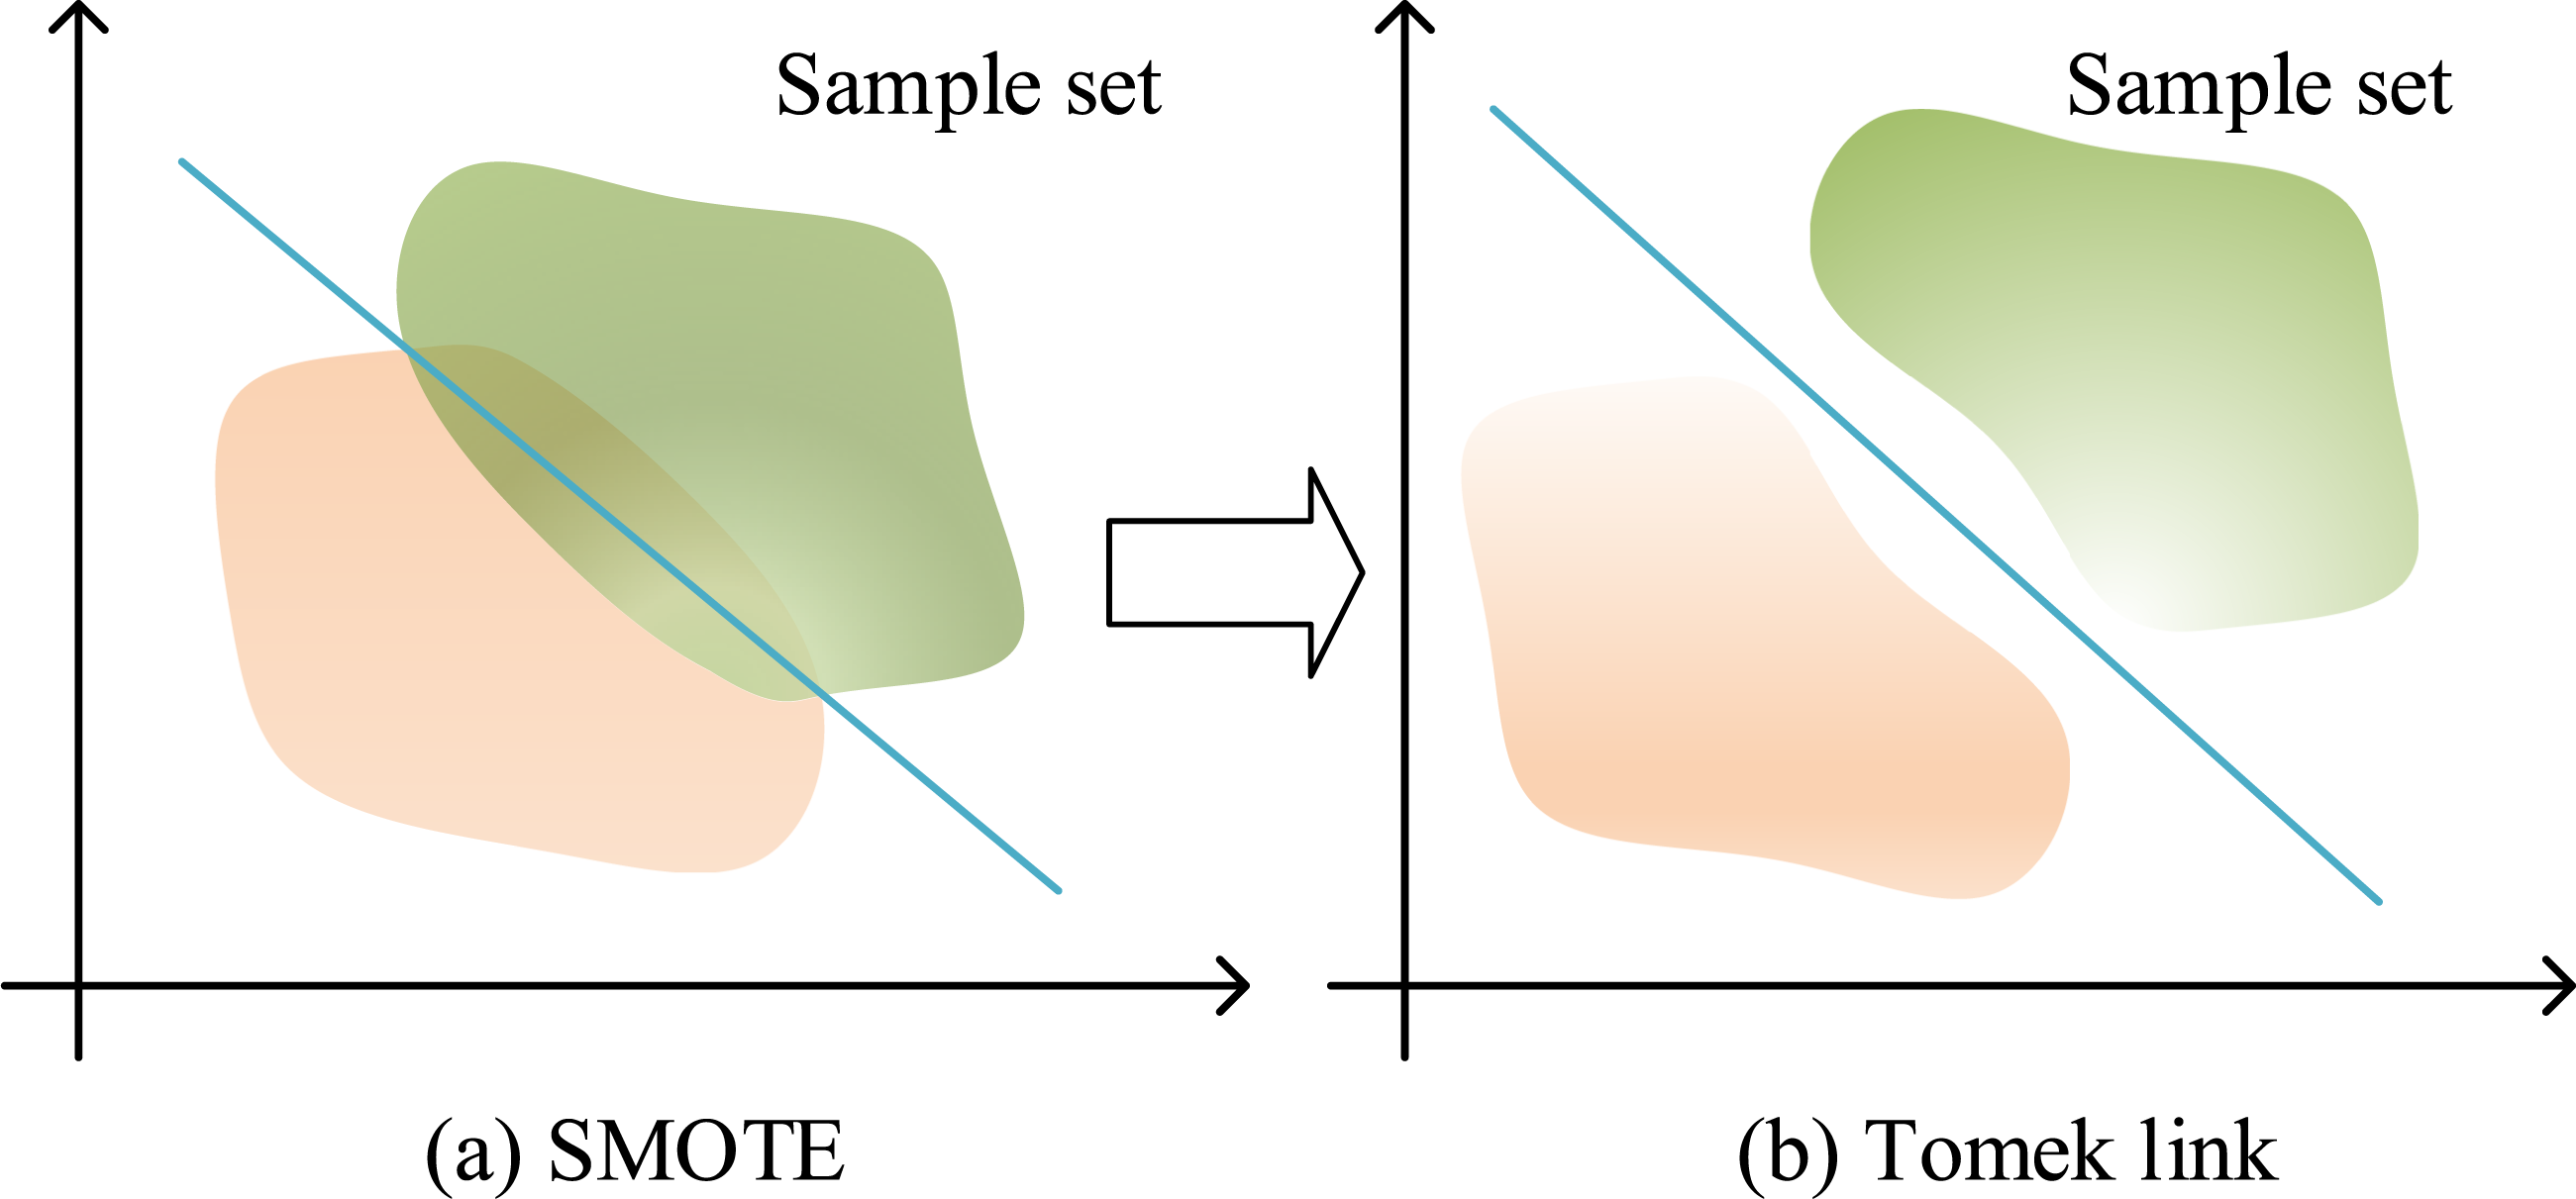
Figure 2(a) and (b) respectively show the process of SMOTE oversampling and Tomek link undersampling, which are combined to perform data balancing operations at a 1:1 target ratio. The SMOTE oversampling technique involves finding 
In equation (1), 
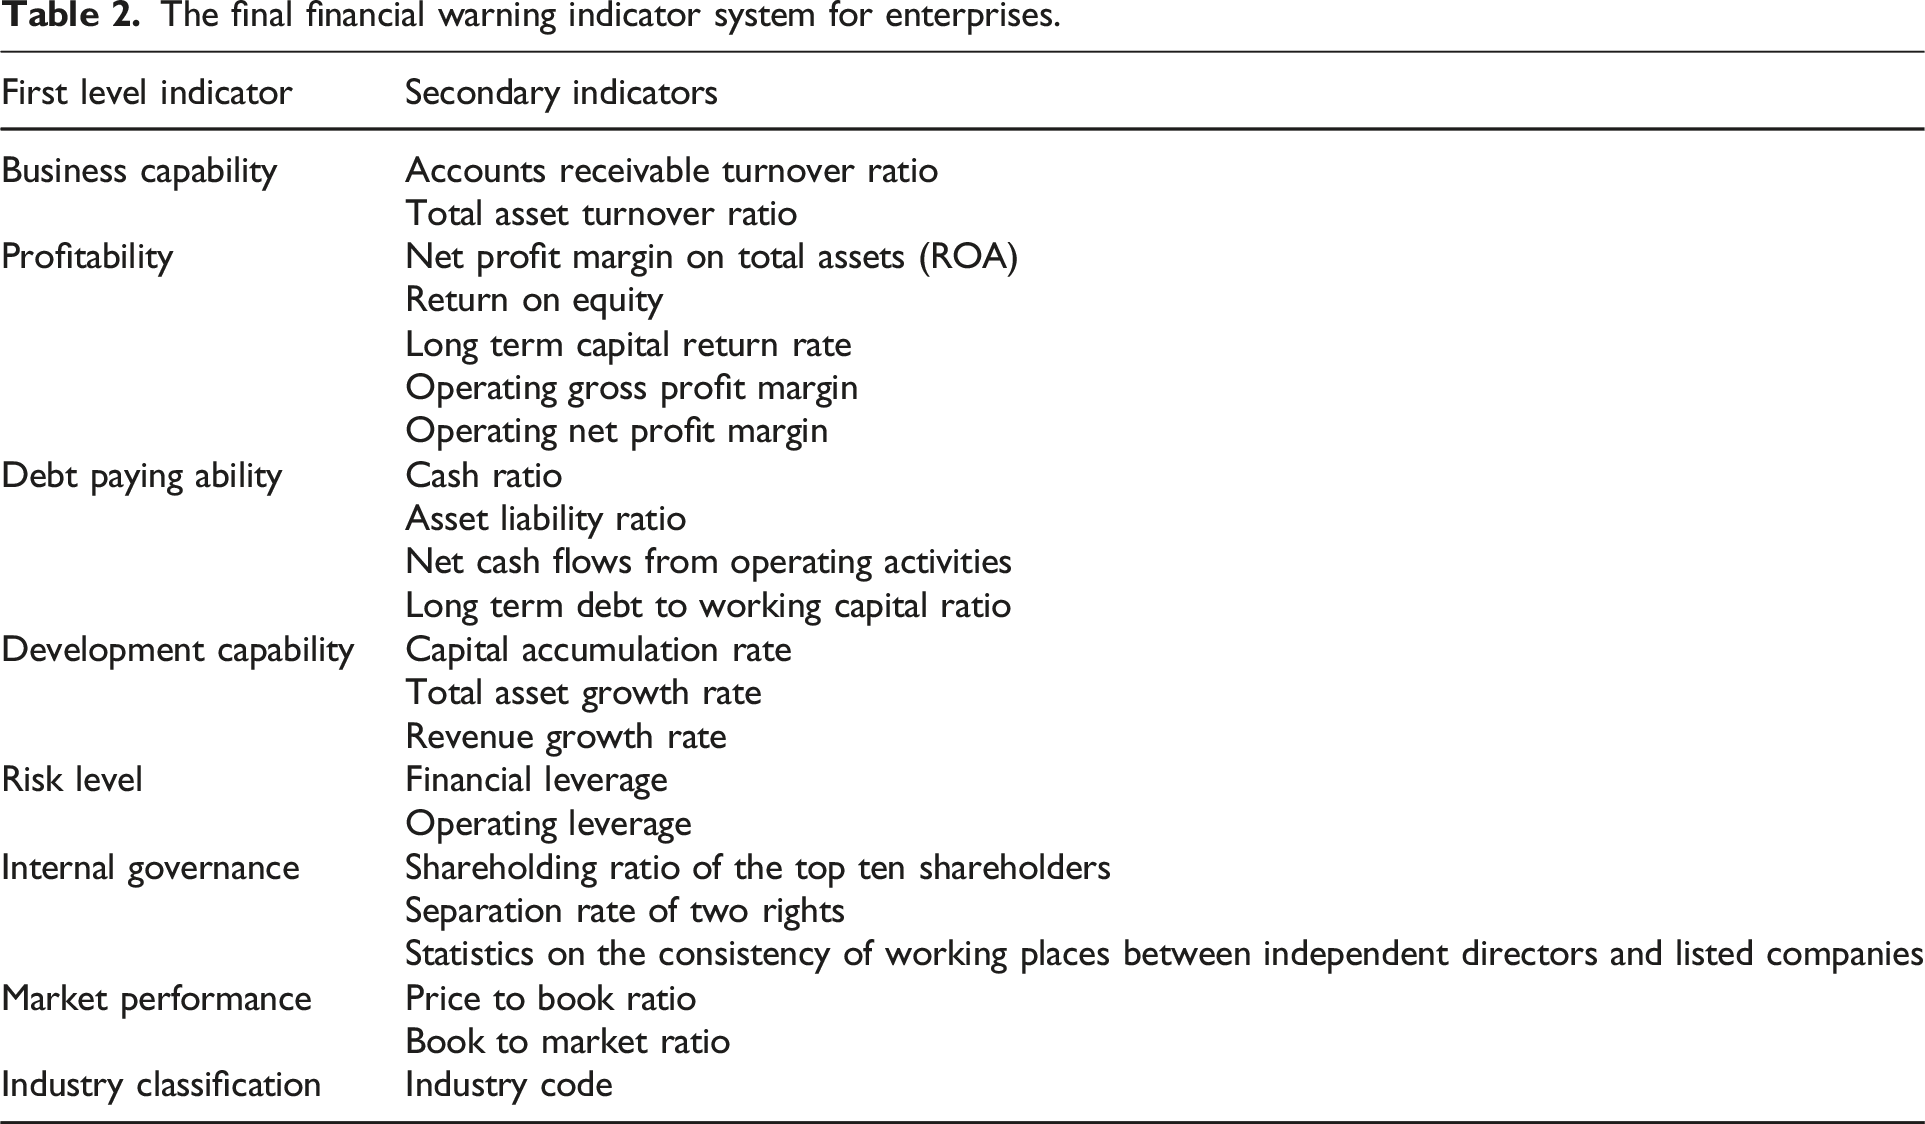
The final financial warning indicator system for enterprises.
Establishment of enterprise financial early warning model grounded on EL and stacked generalization fusion algorithm
Due to the fact that enterprise financial early warning is essentially a binary classification problem, and the powerful functions of machine learning in computation and classification recognition, this study adopted five classic machine learning algorithms and a stacked generalization ensemble model to construct a financial crisis early warning model. EL algorithms combine multiple simple learners to form a powerful learner, with the aim of effectively reducing variance and bias while improving predictive performance. This includes RF, GBDT, and XGBoost, while a single machine algorithm includes DT and SVM.23,24 RF consists of multiple decision trees, each of which can independently predict and increase diversity through random sampling and feature selection. RF enhances robustness through the Bagging integration mechanism of multiple decision trees, making it suitable for processing high-dimensional feature data and effectively suppressing overfitting. Although the bias of individual trees may slightly increase, the overall model performance is significantly improved. Unlike RF, GBDT optimizes model performance by gradually fitting residuals and excels at handling nonlinear relationships and feature interactions. Each decision tree is associated with the previous 
In equation (3), 
In equation (4), c represents the correction term for the predicted value, then 
In equation (5), 
In equation (6), 
In equation (7), 
In equation (8), 
In equation (9), Data preprocessing process.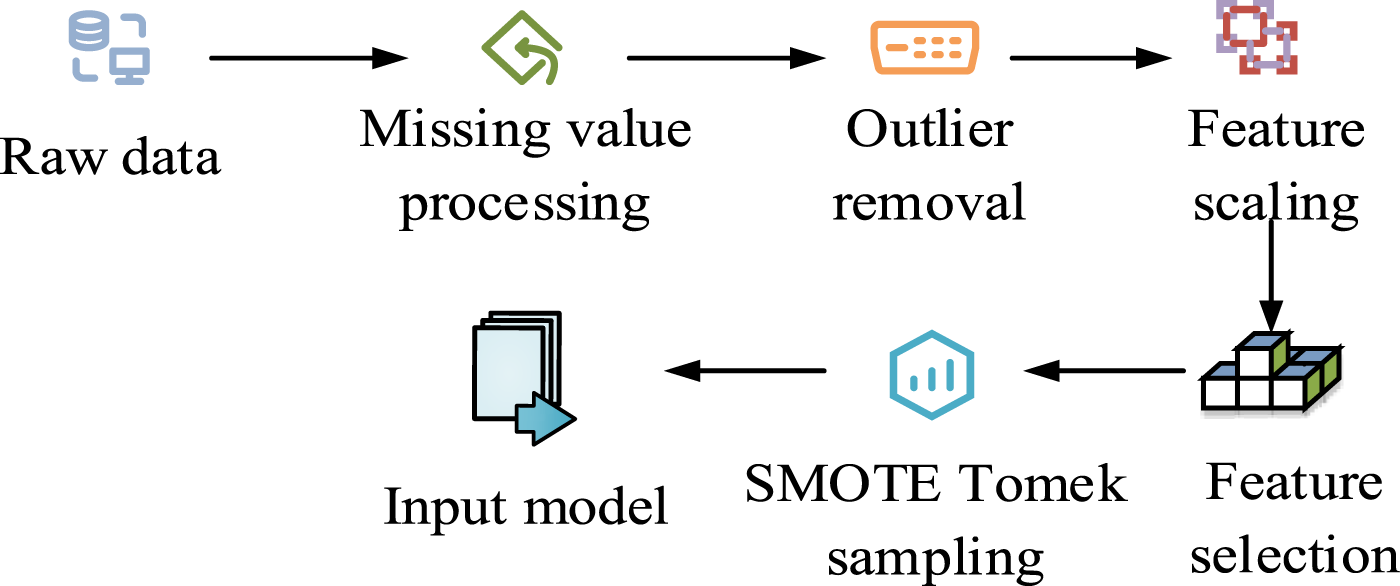
In Figure 3, for the original financial data, mean imputation and industry median imputation were used to handle missing values and eliminate abnormal data. In the feature selection stage, variables are initially screened through information gain, and then the top 30% of core features are retained in combination with RF importance ranking as the feature set for subsequent training. Considering the significant uneven distribution of sample categories in enterprise financial early warning issues, this study further introduces SMOTETomek sampling technology, which effectively balances the positive and negative sample ratios through a combination of oversampling and undersampling, enhancing the model’s ability to identify minority financial crisis samples. Stacking generalization is a very effective strategy in EL algorithms, especially when multiple different machine learning models have their own advantages and disadvantages. Stacking generalization can fully utilize the strengths of different models, integrate the predictive abilities of each model, and thus improve overall performance. Therefore, the study chose ensemble generalization as the model fusion strategy, and constructed a more high-performance enterprise financial warning model by integrating RF, GBDT, XGBoost, as well as DT and SVM learning algorithms. The structure of the stacked generalization fusion algorithm is shown in Figure 4. Structure of stacked generalization fusion algorithm.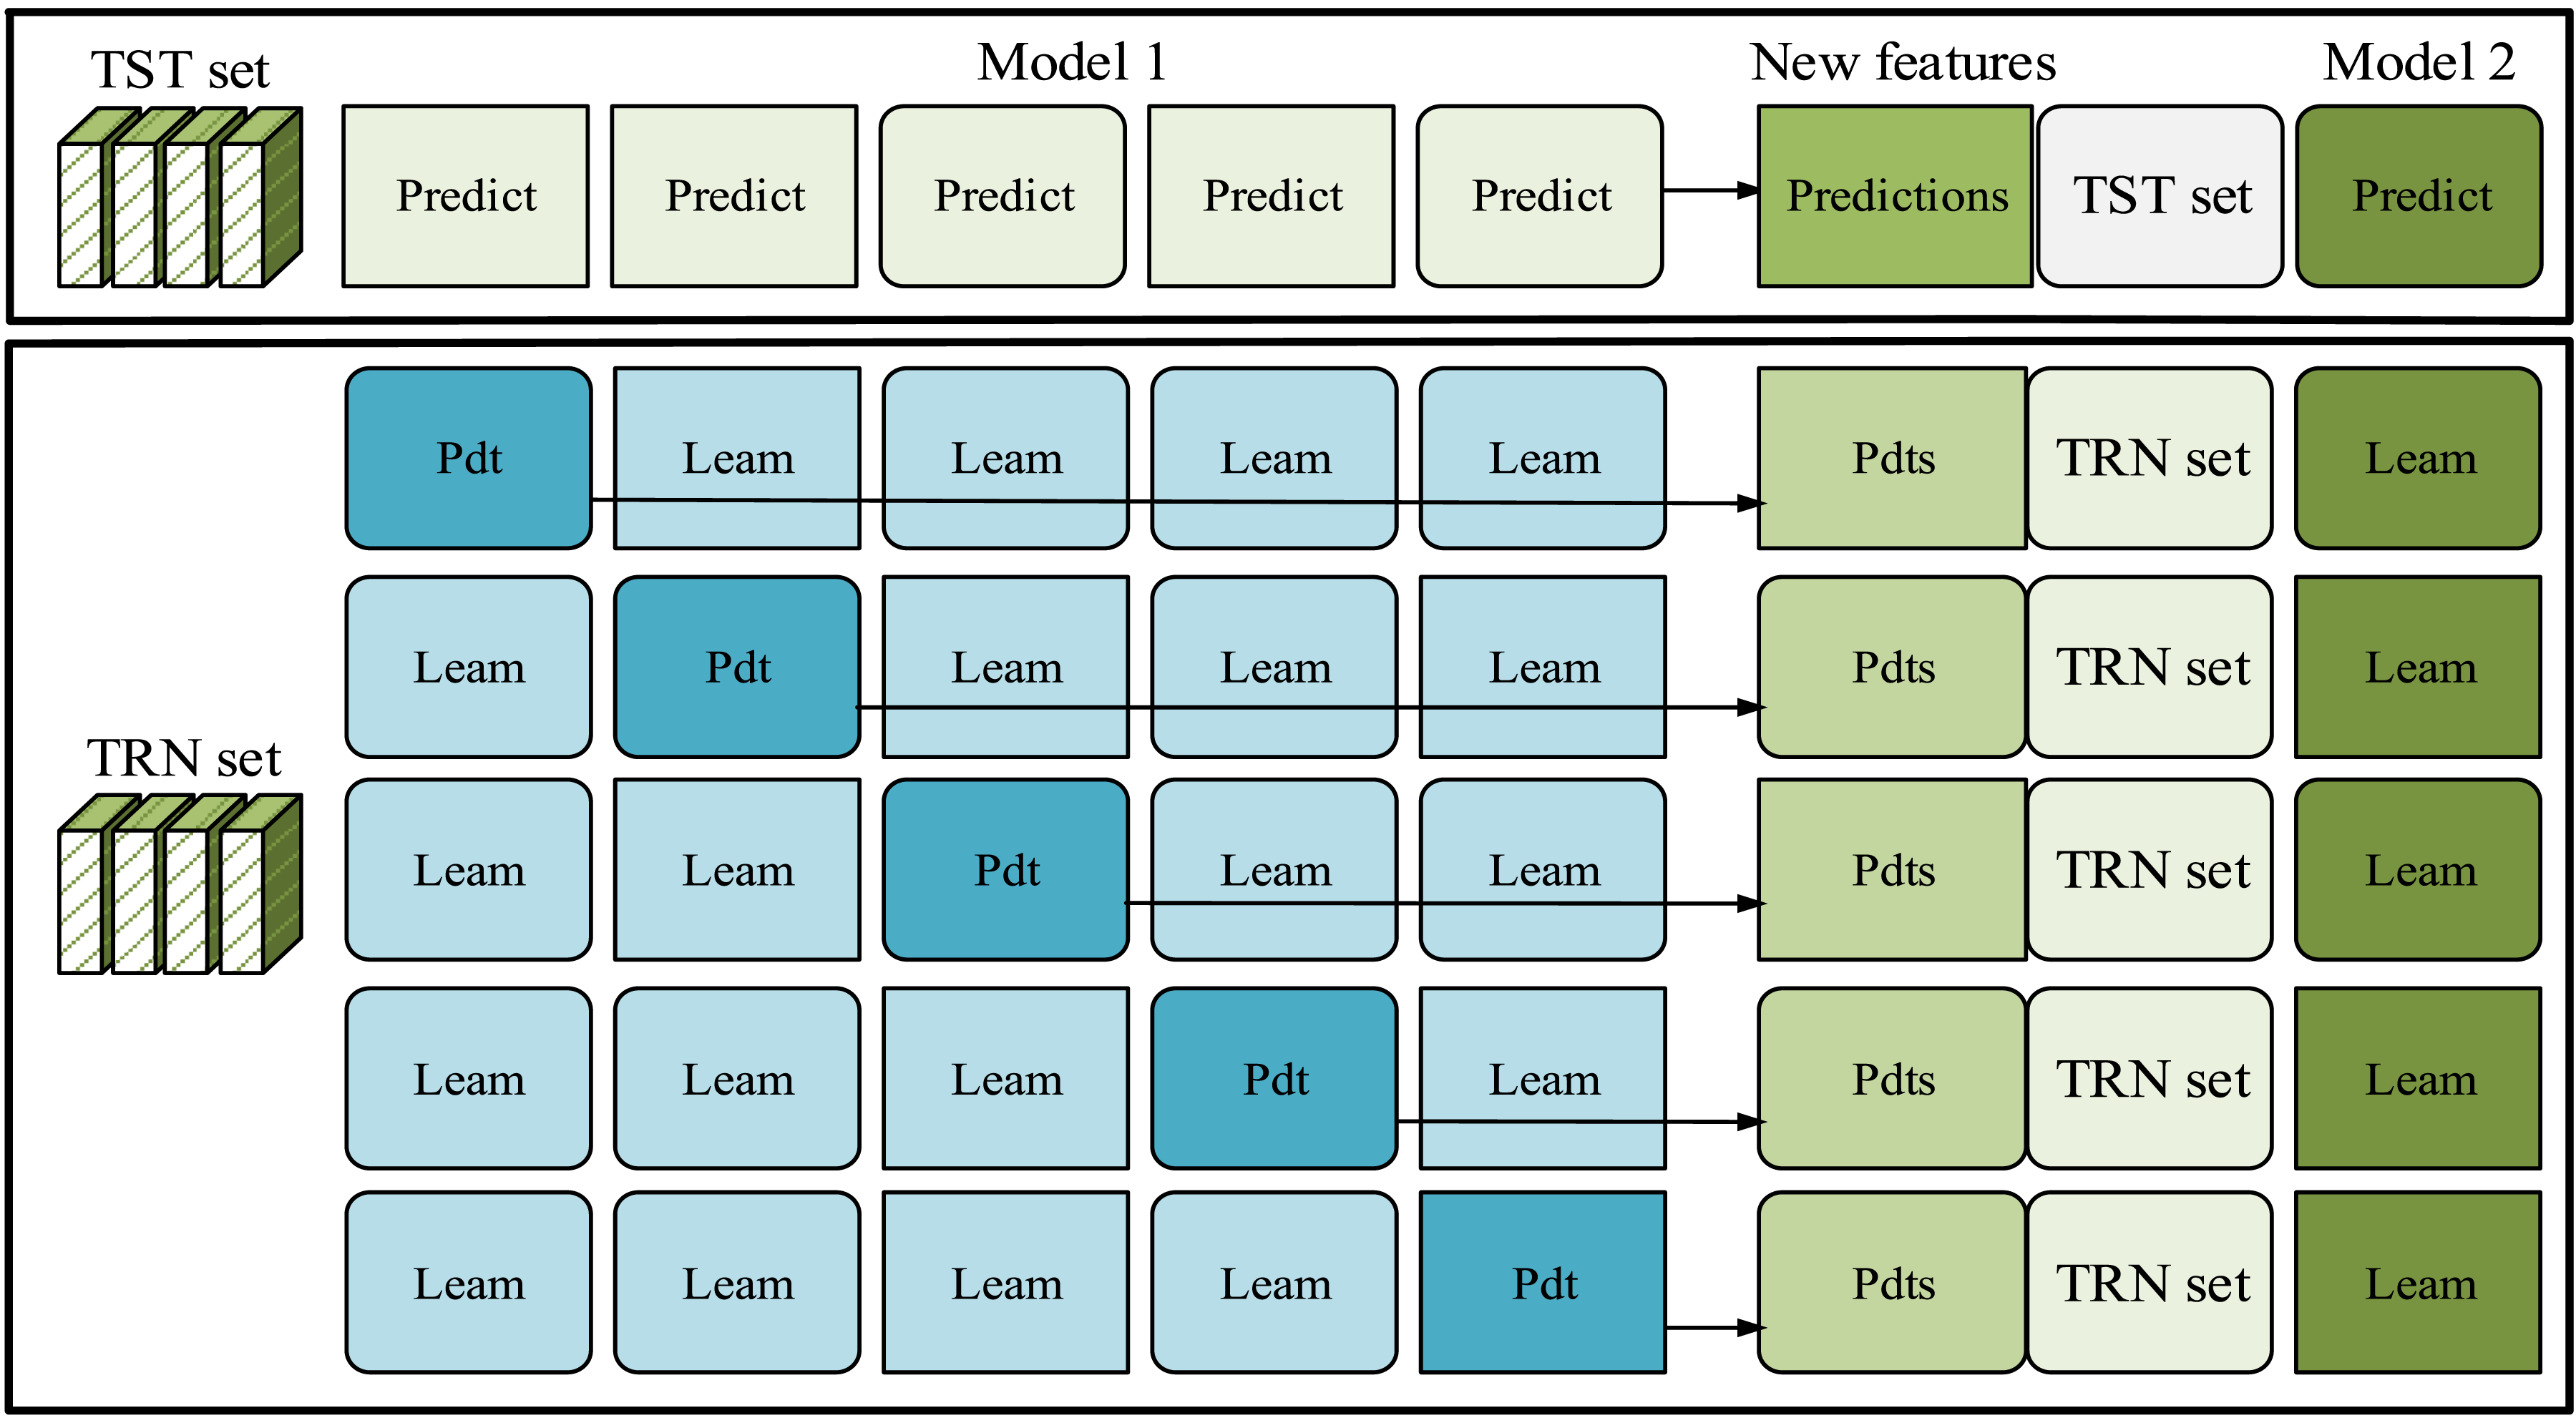
In Figure 4, the first layer base learner of the stacked generalization fusion algorithm needs to have both strong classification performance and differentiation. Therefore, RF, GBDT, XGBoost, and DT were selected as the basic models for the first layer in the study. Among them, RF has good generalization ability by introducing random subspaces and bagging mechanism. GBDT and XGBoost respectively use traditional and improved Boosting strategies to process complex data, while XGBoost also improves efficiency through regularization. The DT model has a simple structure and is suitable for capturing patterns dominated by a few features. These tree-based models can effectively handle nonlinear relationships and high-dimensional data, and their training strategies complement each other. The second layer uses SVM as the meta learner. SVM excels in high-dimensional classification tasks and boasts a relatively straightforward architectural design. It can learn the implicit relationships output by the base model and reduce the risk of overfitting. Compared with complex networks, SVM is more conducive to improving generalization and stability. The workflow is as follows: Firstly, the first layer model segments the data through five-fold cross validation, leaving one fold as the test set and the rest as the training set. Then, the prediction results from five cross validations are accumulated to form the training data for the second layer model. Meanwhile, five predictions are made on the original test set, and the average is taken as the test data for the second layer model. In this way, the output of the first layer model becomes the input of the second layer model, and ultimately the prediction results are output by the second layer model. In addition, building an efficient prediction model not only requires filtering out useful features, but also determining the optimal parameter settings. The study used grid search and five-fold cross validation methods to optimize model parameters. Firstly, using grid search technology to systematically arrange and combine all possible parameter values, a “grid” containing all candidate combinations is constructed. Subsequently, five-fold cross validation is performed for each parameter combination to calculate five sets of generalization performance indicators and take their average. Finally, the parameter combination with the highest average score is selected as the optimal parameter configuration for the model. The five-fold cross validation process is in Figure 5.
27
Five-fold cross inspection process diagram.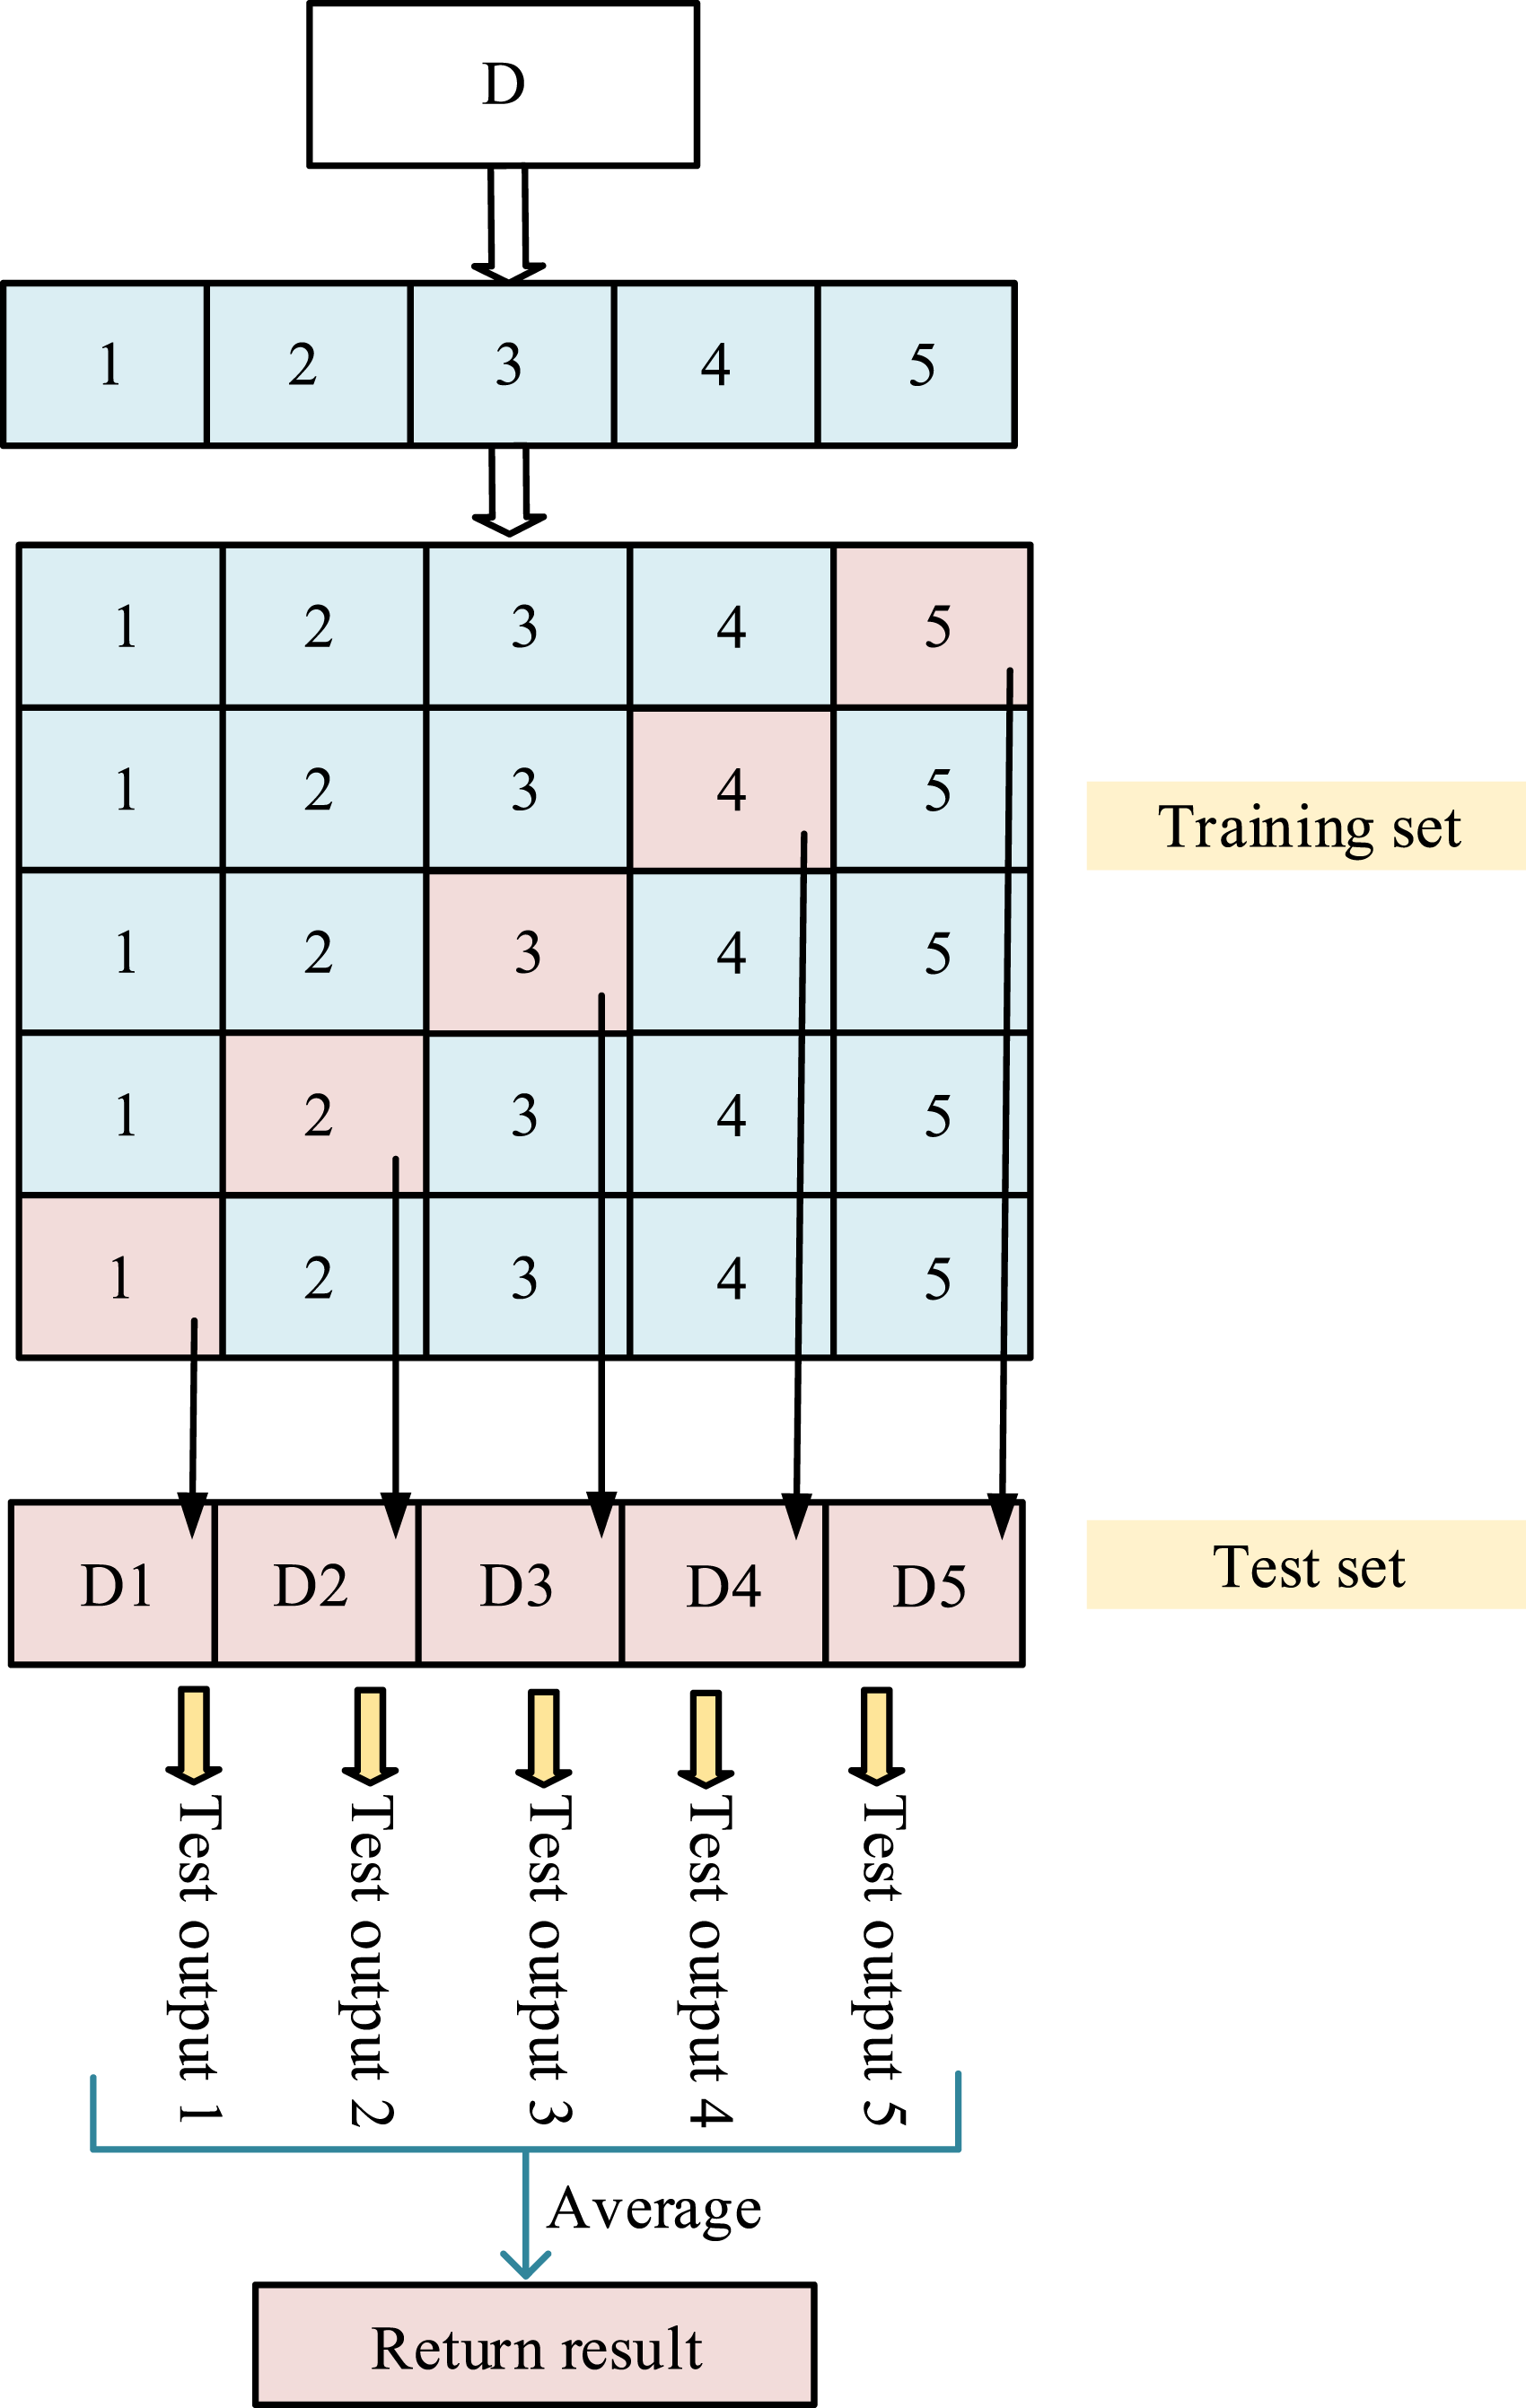
In Figure 5, each iteration produces a test result, so there are a total of five test results labeled as Test result 1, 2, 3, 4, and 5. By averaging the results of these five tests, the final return result is obtained to reduce model bias caused by different data partitioning, thereby obtaining a more robust model performance evaluation result. In stacked generalization techniques, each model in the first layer needs to have high performance and similar performance, otherwise it may influence the overall capability of the model. Therefore, among numerous models, DT, RF, GBDT, and XGBoost are studied as the first layer models. To prevent overfitting, a relatively simple SVM classifier is used as the second layer model, as shown in Figure 6. Stacking generalization flowchart.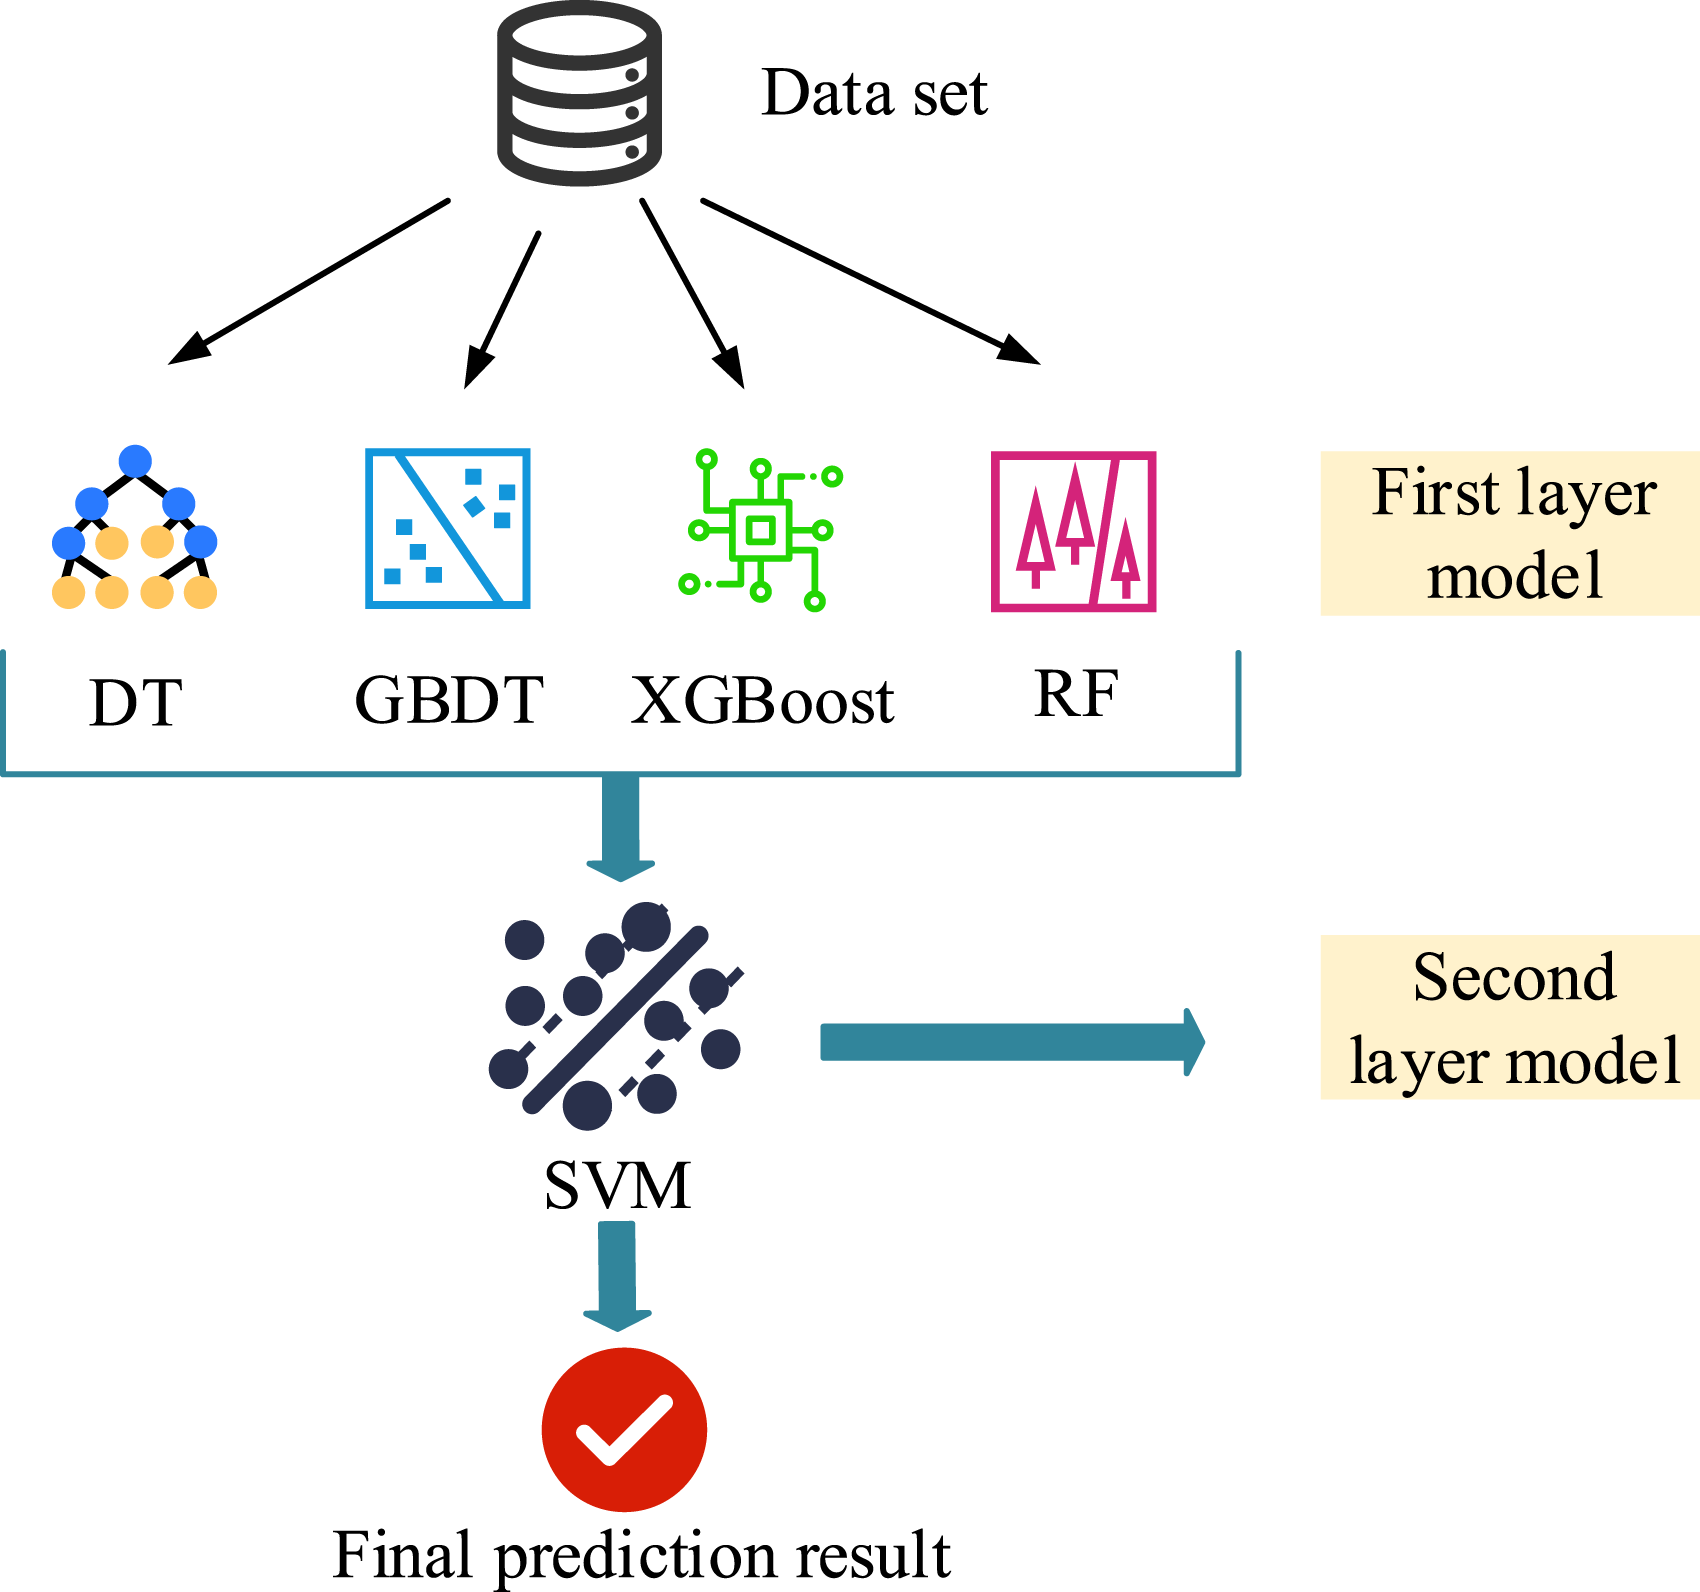
Figure 6 further illustrates the input–output data flow relationship between various models during the training and prediction stages of the model, and more specifically reflects how the output of the base learner in Stacking serves as the input for the meta learner. Each model in the first layer generates new feature training and testing sets through five rounds of cross validation, and these new datasets are then input into the SVM learner in the second layer to obtain the final enterprise financial prediction results.
Results
Research is conducted by setting experimental parameters, setting up an experimental environment, and selecting Compustat as the dataset for algorithm performance testing. Comparative experiments were conducted between the EL and stacked generalization fusion algorithm proposed in the study, the Z-score model, and the Differential Evolution SVM (DE-SVM). Finally, the three models were applied to run in the financial management system of a certain financial enterprise, and real-time data analysis was conducted to compare and confirm the validity of the proposed models in enterprise financial early warning.
Performance testing of EL and stacked generalization fusion algorithm
The configuration details of the experimental setup.
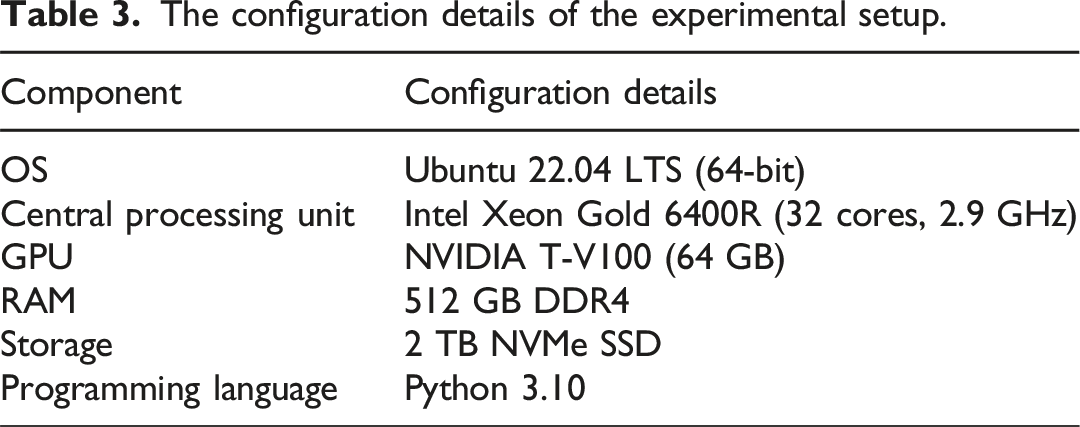
On the basis of the experimental environment in Table 3, the Compustat dataset was split into training and testing subsets, with a ratio of 70% for training and 30% for testing, and with an iteration number of 500. The fusion algorithm based on EL and stacked generalization proposed by the research was compared and tested with the Z-score model
9
and DE-SVM.
28
The accuracy results are shown in Figure 7. Changes in accuracy of different algorithms. (a) Training set (b) Test set.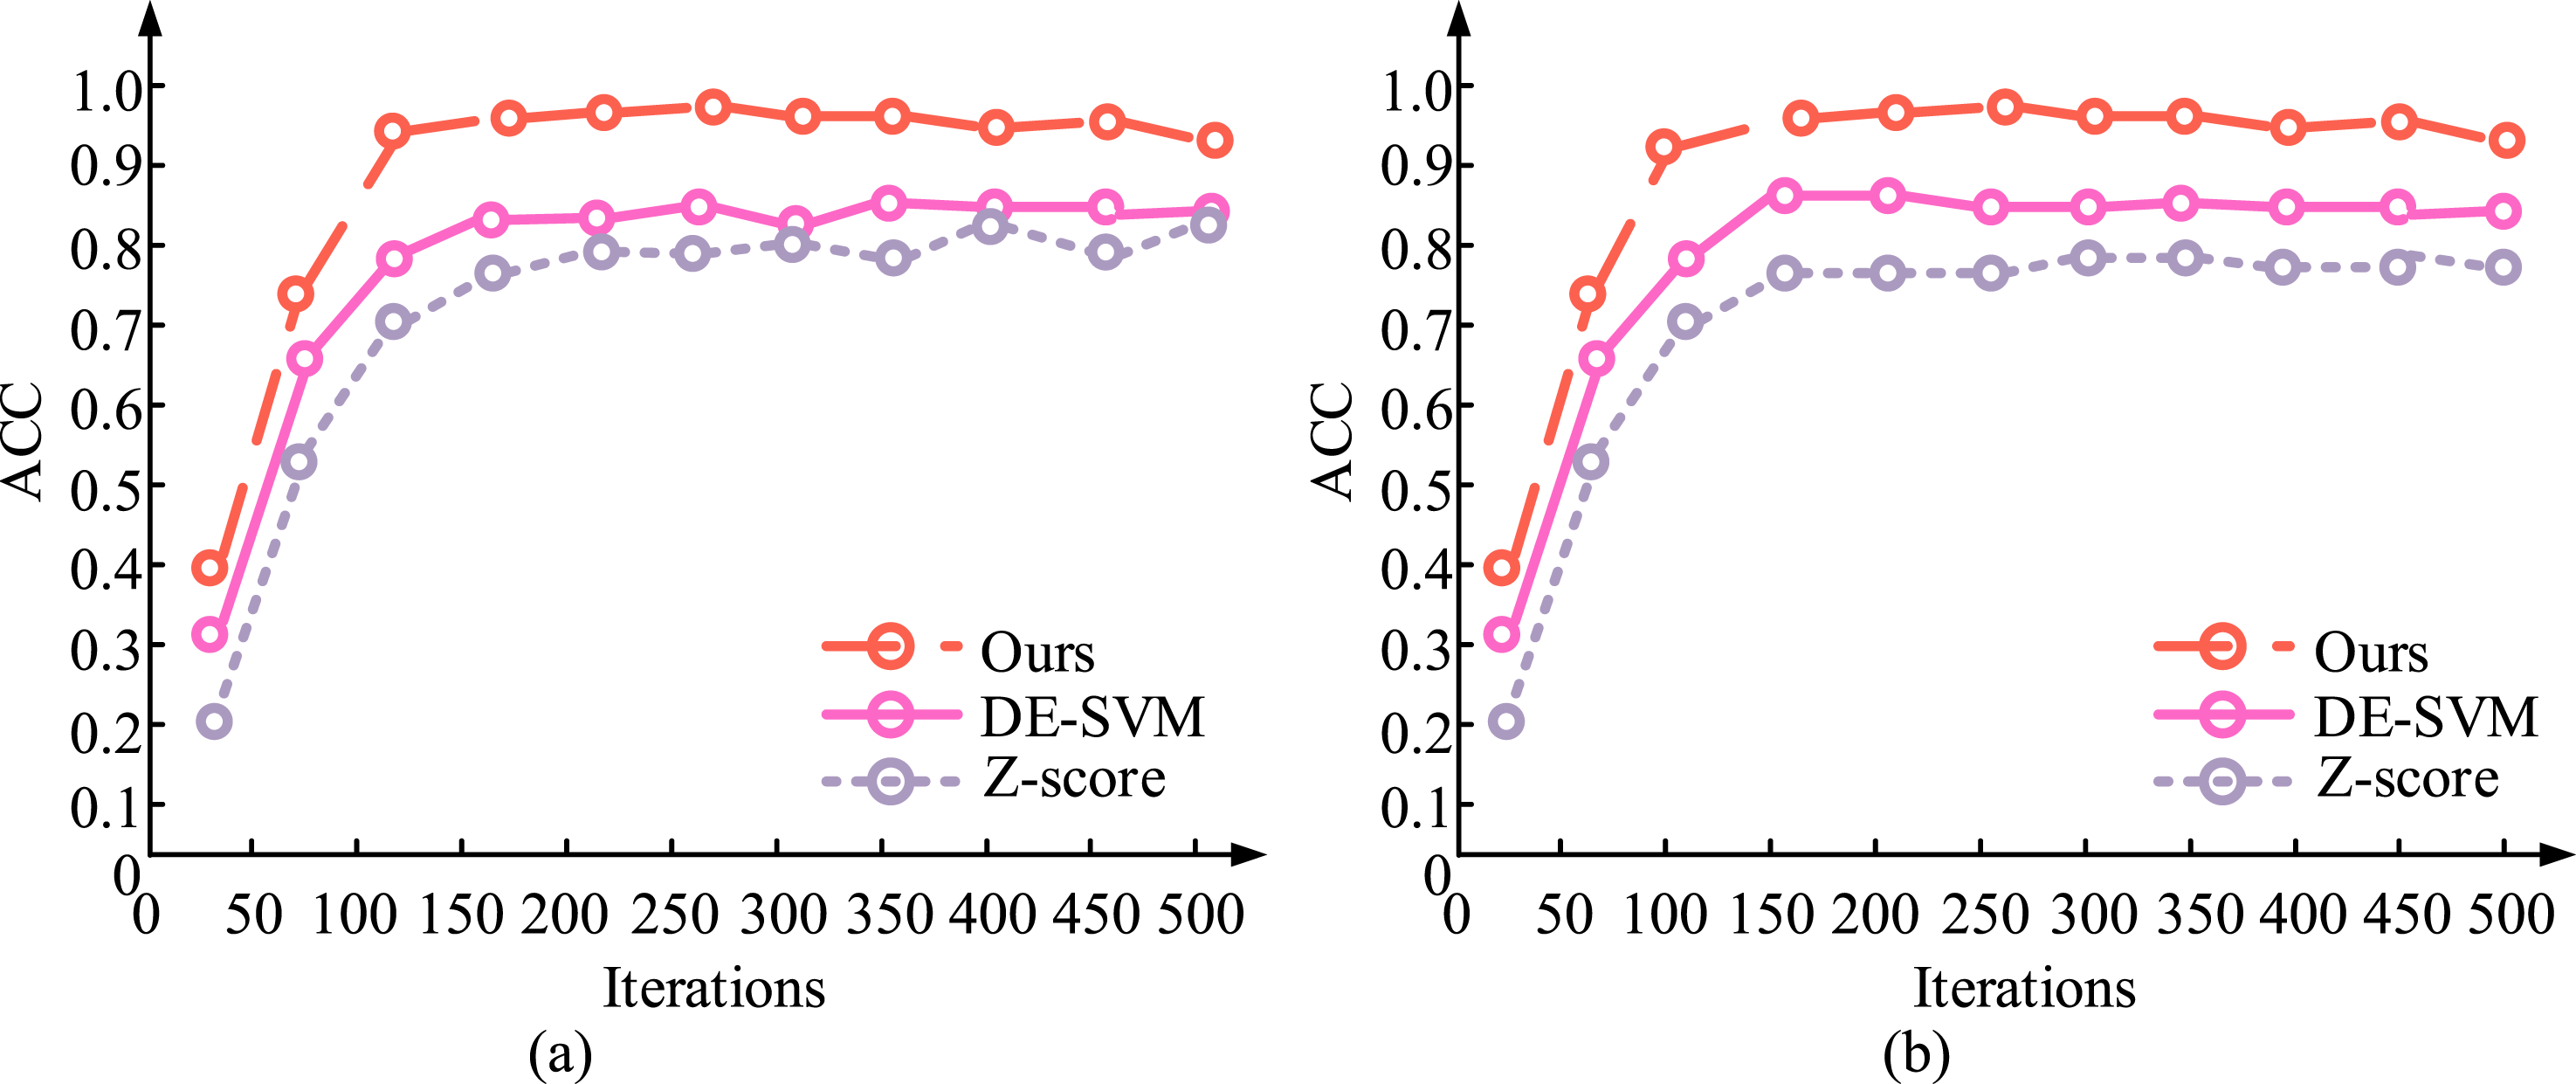
Figure 7(a) and (b) show the accuracy changes of different models on the training and testing sets as the number of iterations increases. In Figure 7(a), the algorithm proposed by the research showed the best accuracy and the fastest convergence speed during the training process. By the 50th iteration, the accuracy already exceeded 0.8, ultimately reached 0.93. DE-SVM improved rapidly in the early stage, but its accuracy was slightly lower than the model proposed by the author in the later stage, resulting in poor performance. The performance of Z-score was significantly lower than the other two models, indicating that using Z-score standardization alone is not sufficient to significantly improve the capability of the model. In Figure 7(b), the suggested algorithm also achieved optimal results on the test set with an accuracy of nearly 0.95. DE-SVM performed second with an accuracy of around 0.9, which was relatively stable. Z-score performed the worst, with an accuracy of about 0.75 and a slow convergence speed. The algorithm proposed by the research performed the best on both the training and testing sets, with significantly higher accuracy than other models, indicating that the model has fast convergence and good generalization performance. The changes in true and false positive rates of different algorithms at different thresholds are shown in Figure 8. ROC curves and AUC results for different models. (a) Training set (b) Test set.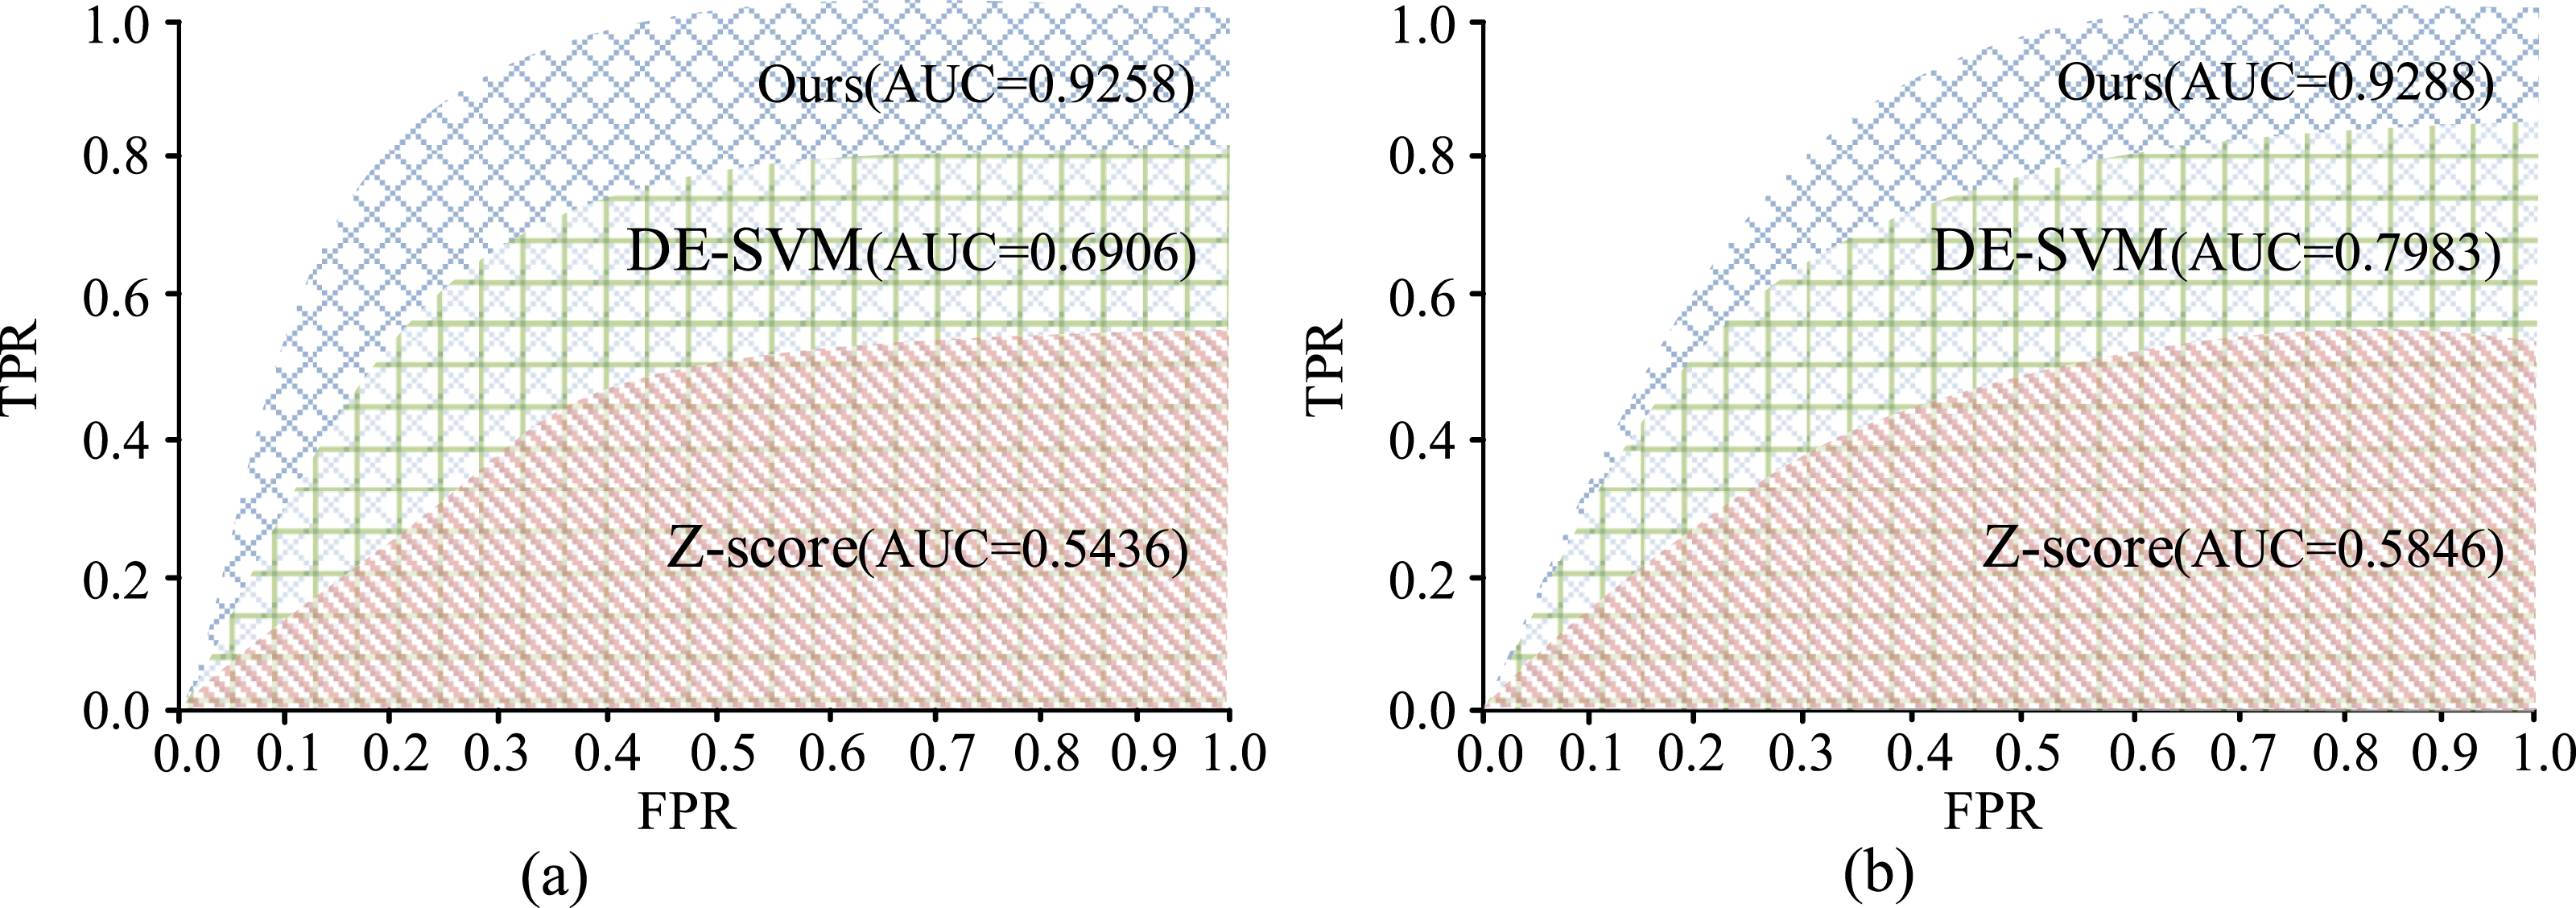
Comparative experimental results.
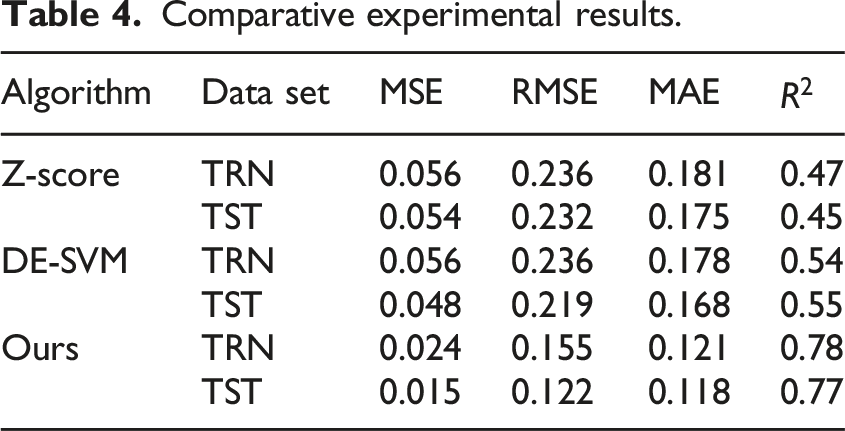
In Table 4, the MSE, RMSE, and MAE of the suggested algorithm on both the training and testing sets were the smallest, indicating the minimum prediction error of the model. Among them, the MSE, RMSE, and MAE on the training set were 0.024, 0.155, and 0.121, demonstrating that the model has a good fitting effect. Accuracy results of different models. (a) PR curves (b) F1 value results.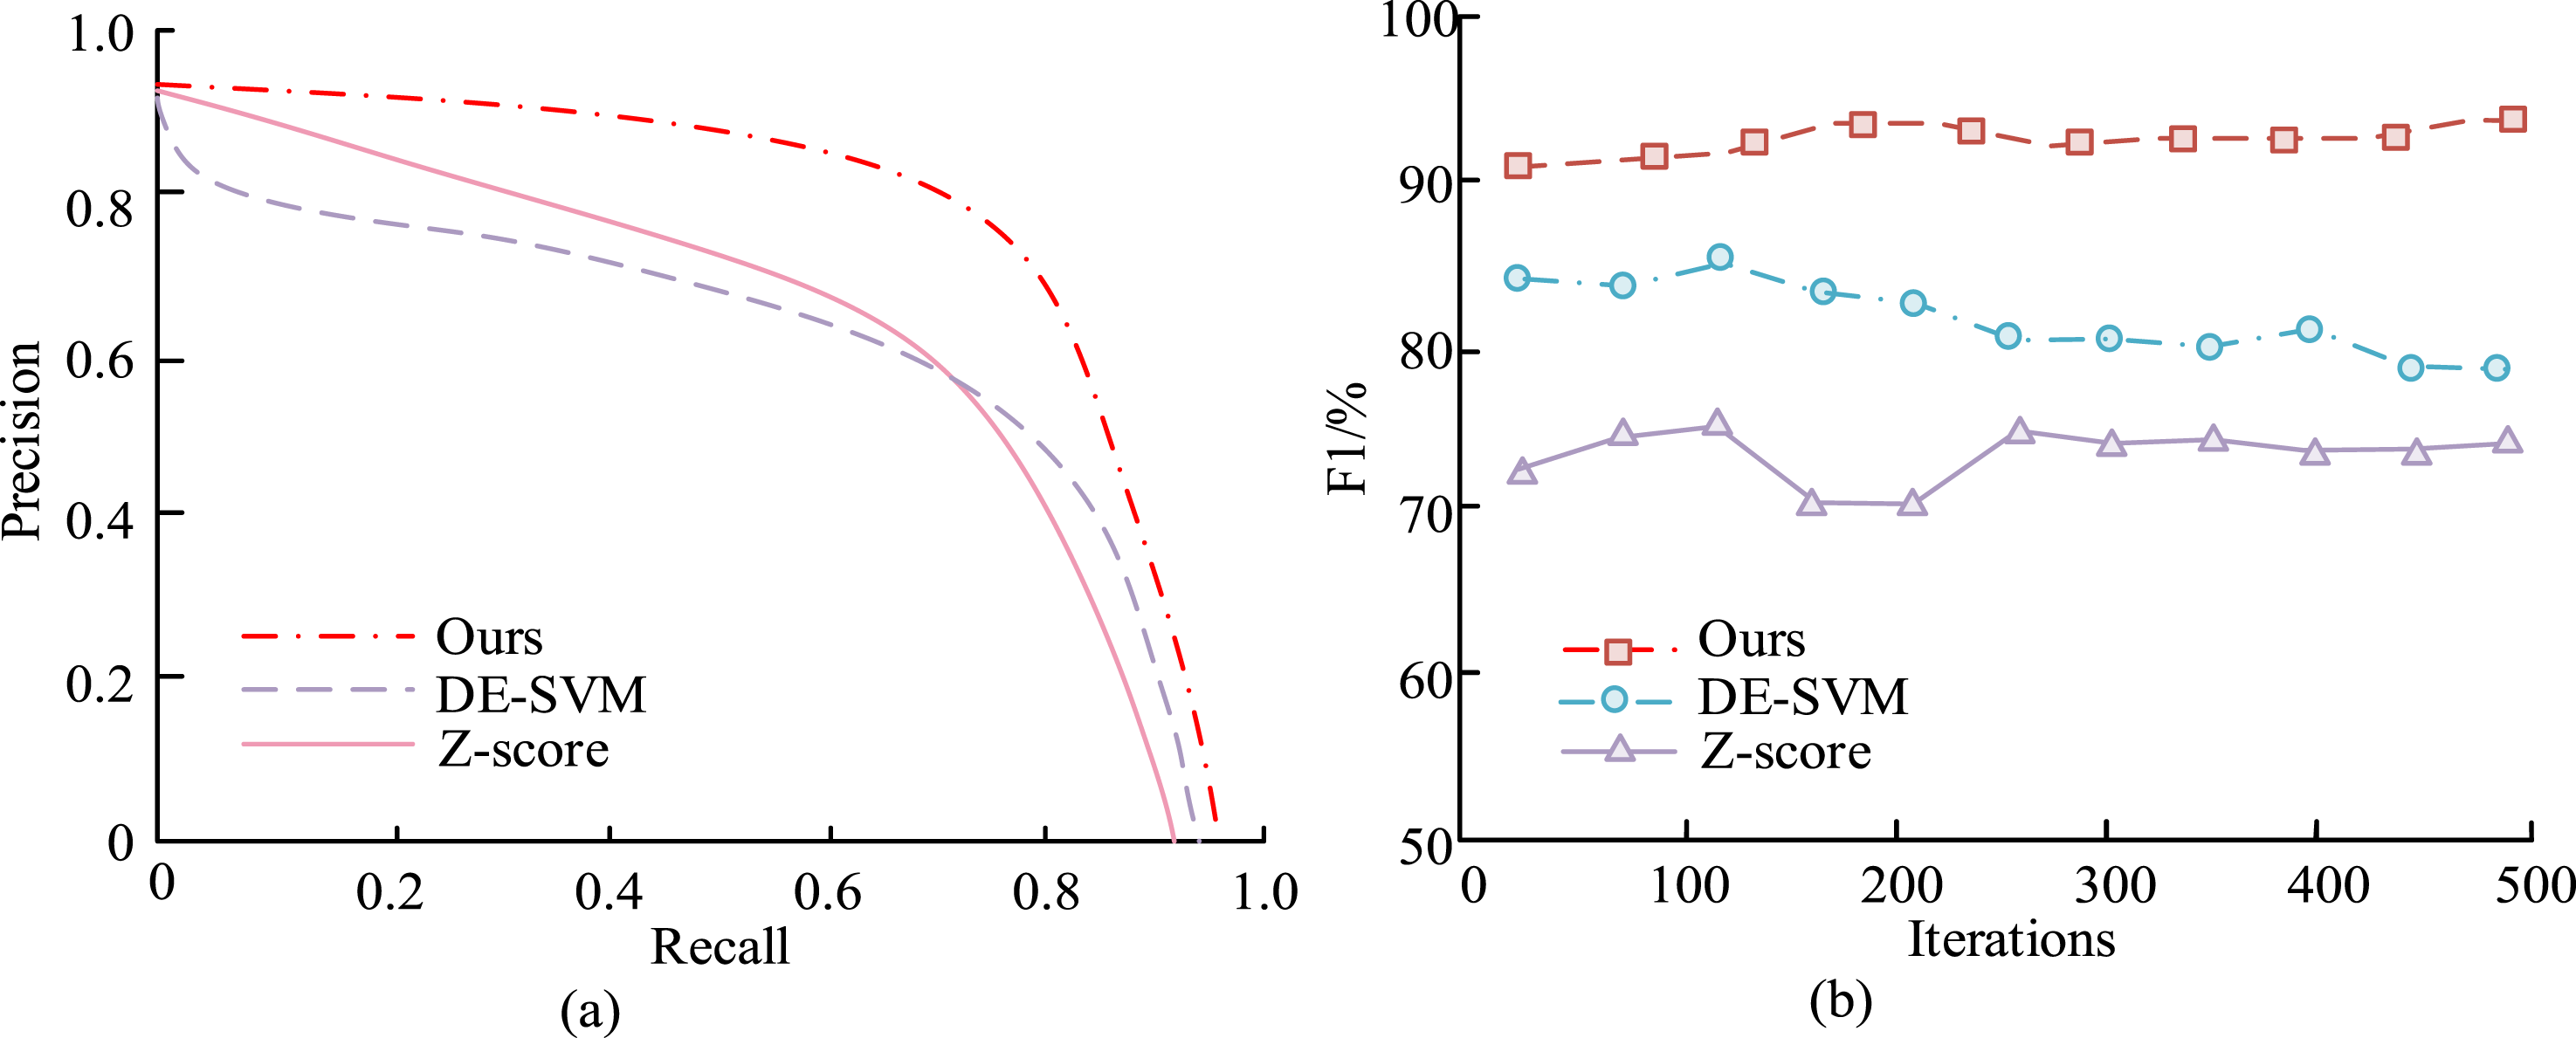
Figure 9(a) and (b) show the ability comparison of different models in terms of PR curve and F1 value. In Figure 9(a), the PR curve of the proposed algorithm was clearly located at the top, and its overall performance was better than other models. At high recall rates, the accuracy remained high, demonstrating strong overall performance. The PR curve of DE-SVM was centered, and the balance between accuracy and recall was moderate. At high recall rates, the accuracy decreased significantly, indicating that the model’s predictions for a large number of samples were not accurate enough. The PR curve of Z-score was located at the bottom, with the lowest accuracy. At low recall rates, the accuracy slightly improved, but the overall performance was poor, indicating that the model’s ability to identify positive samples was limited. The algorithm proposed by the research performed the best in the PR curve, indicating that it could maintain high accuracy at different recall rates and was suitable for use in scenarios with high precision and high recall requirements. In Figure 9(b), the F1 value of the proposed algorithm consistently remained above 90%, showing the most stable and excellent performance. As the count of repetitions grew, the fluctuation of F1 value decreased, demonstrating strong stability and robustness. The F1 value of DE-SVM fluctuated between 80% and 85%, with some degree of volatility, but the overall trend was relatively stable. The F1 value of Z-score ranged from 70% to 75%, which was significantly lower than the other two models. At the same time, the F1 curve fluctuated greatly, especially in the early and middle stages of iteration, indicating poor stability of the model. The method proposed by the research performed the best in both PR curve and F1 value, indicating significant advantages in accuracy, recall, and stability.
Analysis of the effect of enterprise financial early warning grounded on EL and stacked generalization fusion algorithm
To confirm the utility in real-world deployment of the enterprise financial early warning model grounded on EL and stacked generalization fusion algorithm proposed in the research, the model was integrated into the financial management system of a certain financial enterprise to run, analyze the latest financial data in real time, and generate early warning reports. Meanwhile, a comparative analysis was conducted with the performance of enterprise financial warning models grounded on Z-score and DE-SVM. Positive samples were classified into loss, cash flow shortage, and high debt, while negative samples were classified into profit, cash flow abundance, and low debt. The confusion matrix obtained is shown in Figure 10. Classification confusion matrix. (a) Z-score (b) DE-SVM (c) Ours.
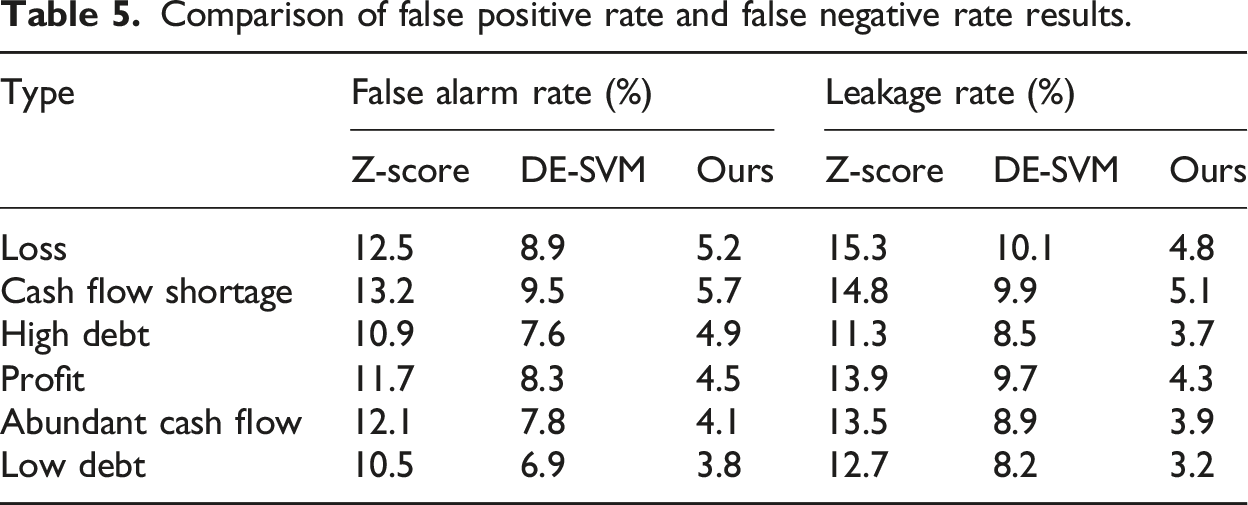
Comparison of false positive rate and false negative rate results.
Analysis of the application effect of evaluation indicators.
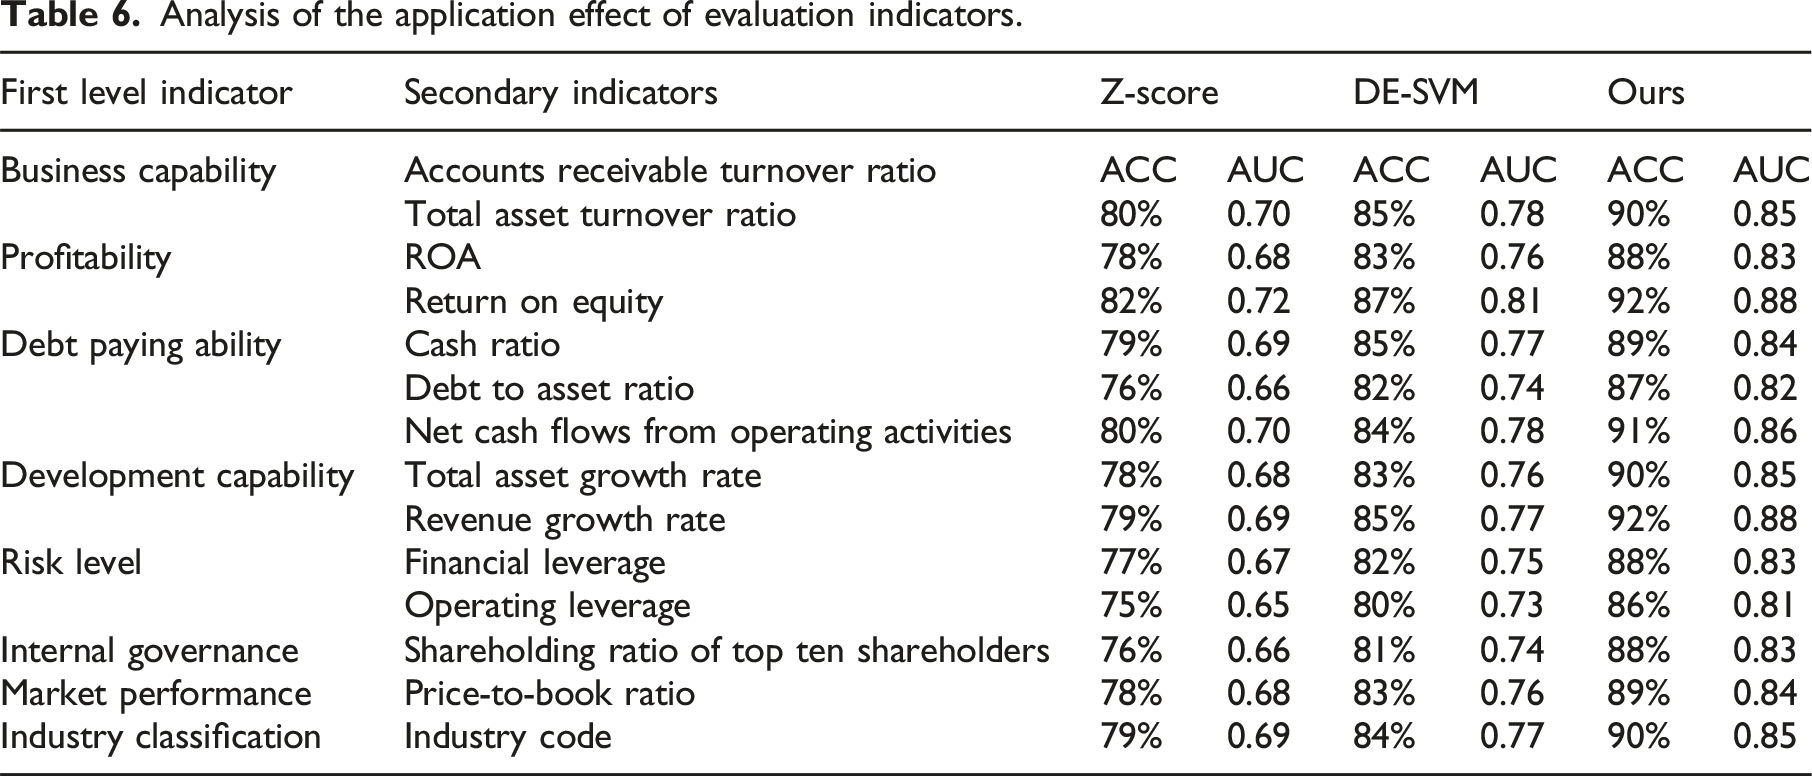
In Table 6, the Z-score model performed relatively poorly on all secondary indicators, with AUC values ranging from 0.65 to 0.72, reflecting its weak ability to distinguish complex and multidimensional financial data. The accuracy was generally below 80%, and it performed poorly in the evaluation indicators of total asset turnover and cash ratio. The DE-SVM model showed significant improvement compared to the Z-score model, achieving an accuracy of over 80% in most indicators, and the AUC value also increased, stabilizing within the range of 0.73–0.80. However, in terms of financial leverage and total asset growth rate indicators, the accuracy did not yet reach the optimal effect. The model proposed by the research performed the best on all indicators, with accuracy mostly exceeding 88% and AUC values between 0.81–0.88, demonstrating high sensitivity and accuracy to different financial health states. Especially in terms of profitability and development ability, the performance of this model was significantly better than other models, indicating its robustness and predictive accuracy under multidimensional indicators. From this, the model proposed by the research performed better than the other two models in terms of accuracy and AUC value, demonstrating advantages in multidimensional financial indicator prediction. This indicated that the model could better identify different types of financial health status in enterprise financial warning systems and provide more accurate decision support for management. To ensure fairness in comparison between models and reproducibility of experimental results, all models were independently run on the same testing platform, ensuring exclusive use of CPU and GPU resources and no interference from concurrent computing tasks. Finally, the resource consumption and running time cost of the three models during operation were compared, as shown in Figure 11. Resource consumption and time cost analysis. (a) Resource consumption (b) Time cost.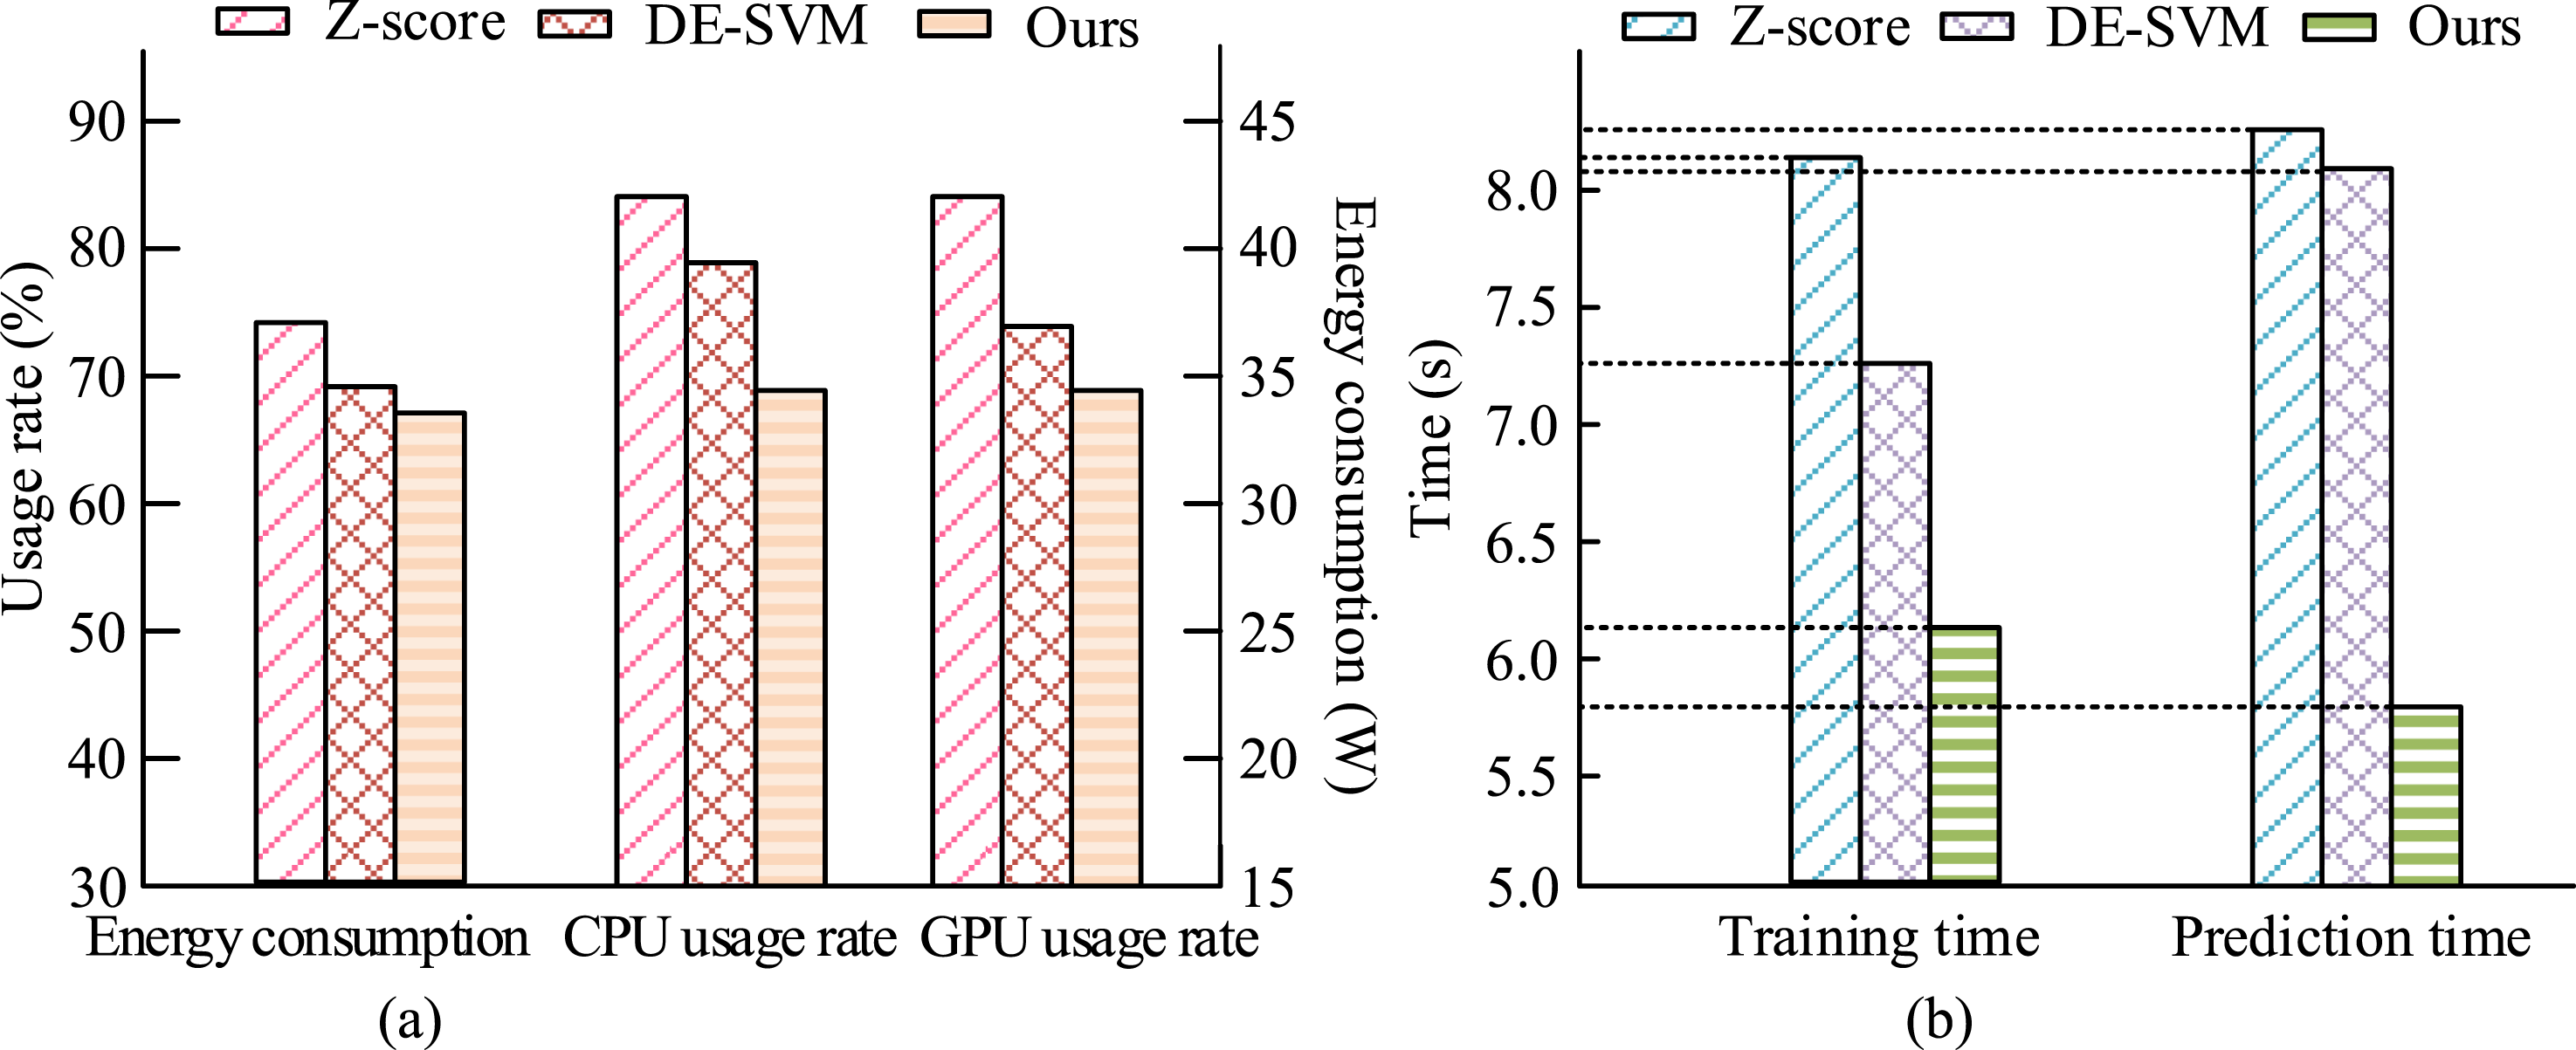
Figure 11(a) and (b) respectively show the comparative analysis of three models in terms of resource consumption and time cost. In Figure 11(a), the DE-SVM model had the highest energy consumption, reaching a usage rate of over 80%, followed by the Z-score model. The model proposed by the research had the lowest energy consumption, around 60%, indicating that the model was more energy-efficient during execution and suitable for deployment in resource constrained environments. The CPU usage rate of the DE-SVM model was the highest, close to 85%, while the Z-score model was about 75%. The CPU usage rate of the suggested model was the lowest, close to 65%. This indicated that the DE-SVM model relied heavily on CPU resources and might generate high loads in environments with multi-threaded processing or concurrent requests, while the proposed model was more CPU resource efficient. Similarly, the DE-SVM model consumed a significant amount of GPU resources, reaching about 80%, while the Z-score model consumed about 70%. The GPU utilization rate of the proposed model was the lowest, at around 60%. In Figure 11(b), the training time of the Z-score model was 8.13 seconds, while the DE-SVM model was slightly lower than the Z-score at 7.38 seconds. The training time of the proposed model was the shortest, only 6.21 seconds. In terms of prediction time, both the Z-score model and the DE-SVM model required 8.23 seconds and 8.04 seconds respectively, while the proposed model had the shortest prediction time of only 5.86 seconds, indicating that the model had a faster response speed in practical applications.
Model performance comparison.
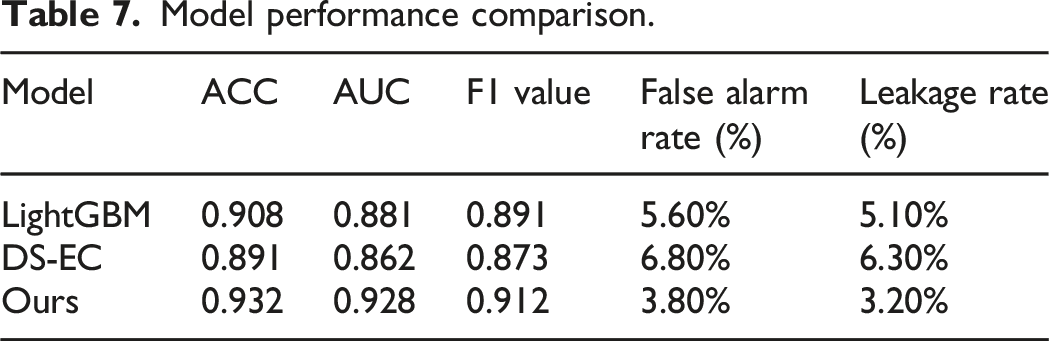
From Table 7, the proposed model outperformed the comparative models LightGBM and DS-EC in all key indicators, demonstrating stronger financial risk warning capabilities. Specifically, the accuracy of the model proposed by the research was 0.932, the AUC value reached 0.928, and the F1 value was 0.912, which was at the optimal level in multiple dimensions of comprehensive evaluation of the model’s discriminative ability. Meanwhile, the false positive rate and false negative rate of this model were 3.8% and 3.2%, respectively, which were much lower than other models, indicating that it had stronger reliability in reducing false positives and false negatives. In contrast, although LightGBM performed well in efficiency and generalization ability, it fell slightly short in controlling errors. The DS-EC model improved decision stability by integrating evidence reasoning mechanisms, but its ability to handle complex classification boundaries was still inferior to the structure of deep fusion models. Overall, the model proposed by the research balanced prediction accuracy and error control capability while maintaining model robustness, and had significant advantages in enterprise financial risk warning tasks.
Discussion and conclusion
Aiming at the problem of traditional models being unable to cope with complex financial data and outliers in the field of enterprise financial early warning, the research introduced an enterprise financial early warning model based on EL and stacked generalization fusion algorithm. By integrating multiple machine learning algorithms such as RF, GBDT, XGBoost, DT, and SVM, the proposed model demonstrated significant advantages in classification accuracy and robustness. The experiment outcomes showed that the average accuracy of the model proposed by the research reached over 90%, and the AUC value was close to 0.93, consistently outperforming the benchmark model in multiple indicators. In terms of resource consumption, the proposed model exhibited significant advantages in energy consumption and CPU/GPU utilization. Specifically, the average energy consumption of the model proposed by the research was about 60%, the CPU usage rate was about 65%, and the GPU usage rate was about 60%, all of which were lower than the corresponding consumption of the other two models. This indicated that the model proposed by the research was not only more accurate than traditional models, but also more energy-efficient in terms of computational resource consumption, making it suitable for running in environments with high real-time requirements or limited resources. In addition, the model proposed by the research performed well in terms of false positive and false negative rates, maintaining low false positive and false negative rates in various financial risk categories. For example, in the “high debt” category, the false positive rate of this model was only 4.9%, and the false negative rate was 3.7%, significantly better than the other two comparative models. This further proved the reliability and stability of the proposed model in accurately predicting financial risks. In summary, the enterprise financial warning model based on EL performed well in accuracy, resource efficiency, and predictive stability, providing strong support for financial risk management of enterprises. However, there are also some limitations. The model did not fully consider external factors such as macroeconomic environment and industry changes, which may have significant effects on the financial situation of enterprises. Future research can introduce more external data, such as macroeconomic indicators and industry characteristics, to improve the predictive capability and adaptability of the model. Besides, the complexity and training cost of the model are high, and further optimization may be needed in practical applications to reduce the demand for computing resources and deployment difficulty.
Footnotes
Funding
The authors received no financial support for the research, authorship, and/or publication of this article.
Declaration of conflicting interests
The authors declared no potential conflicts of interest with respect to the research, authorship, and/or publication of this article.