
Abstract
In the era of complicated information, consumer behavior mining is of great significance to enterprises and markets, however, the current information processing technology is difficult to comprehensively mine and segment consumer data. The study aims to conduct an effective analysis of consumer behavior. And for the shortcomings of the current consumer behavior mining algorithms, the study proposes an improved consumer behavior data mining algorithm based on the map reduce model. After the experimental analysis, the results revealed that the research algorithm has the closest Mahalanobis Distances compared to the two algorithms, fuzzy C-means and density-based spatial clustering of application with noise, indicating that the research algorithm is more effective in clustering. The average clustering accuracy of K-means clustering algorithm (K-means) based on Andersori’s Iris data seto dataset was 93.2%, and the average clustering accuracy of the two datasets Glass and Wine was 94.3% and 93.8%, respectively. The research methodology categorized consumers into three classes based on their transaction frequency and transaction amount. Among the consumers in cluster 1, the total transaction amount was in the range of 0.62–0.82, the transaction frequency was between 0.41 and 0.72, and the number of transactions was between 0.72 and 0.94, which shows that the consumers in this cluster belonged to the group of moderately active and high consumption. The above data indicate that this method, through the collaborative optimization of MapReduce and K-means, has an accuracy rate of over 90% in cross-industry scenarios. It effectively solves the problems of low efficiency, poor accuracy and weak adaptability of traditional algorithms, providing a quantifiable technical solution for the research of consumer behavior.
Introduction
As the Internet grows, there are a growing number of online trading platforms available. Consumer behavior (CB) features are shaped by economic development and encompass not only specific material needs but also multidimensional information such as brand, company structure, product quality, and so forth.1,2 Therefore, strengthening the analysis of consumers’ behavioral characteristics can provide a realistic basis for enterprise decision-making and production. However, traditional data mining techniques are difficult to deal with large-scale data and cannot realize high efficiency and speed of data processing. Previous studies have adopted the logistic regression algorithm to predict the probability of event occurrence.3,4 However, this method has significant problems in terms of efficiency and speed when dealing with large-scale data, and it requires that the data distribution satisfy the assumption of being linearly separable. Once the data presents complex nonlinear relationships, the fitting effect of the model will be greatly reduced, and it will be difficult to accurately capture the data features, thereby limiting its application in complex data scenarios. MapReduce, as a fundamental framework in the field of distributed computing, its core value lies in solving the problem of large-scale data processing through the idea of divide-and-conquer. 5 Mapreduce is used for concurrent processing of large-scale data. Tasks are represented by two functions, Map and Reduce. First, tasks and data are allocated to each computing node through the Map function, and then the computing results of each node are collected through Reduce and summarized into the final result required by the user. 6 K-means clustering algorithm (K-means CA) is based on the similarity metric and maximizes the difference of the elements by making the differences between the subsets decreasing. 7 In order to solve the problems such as low efficiency, insufficient accuracy, and difficulty in responding to market changes in real time that traditional data mining techniques face when dealing with large-scale consumer behavior data, a data mining algorithm applied in the field of consumer behavior prediction is studied and proposed. Therefore, the study introduces K-means CA to improve data mining algorithms (DMA) based on MapReduce to achieve effective analysis and segmentation of CB features. It is anticipated that this research would enable precise analysis of CB properties, hence offering data support for company development. The innovation of the research lies in combining the MapReduce distributed computing framework with the K-means clustering algorithm to construct a composite data mining algorithm. The data mining algorithm based on MapReduce proposed in the research can process massive consumer behavior data quickly and accurately in a distributed environment. It successfully breaks through the bottleneck of traditional data mining methods in large-scale data processing, providing a brand-new and effective technical path for enterprises to accurately analyze consumer behavior and grasp market dynamics. It has important theoretical value and practical significance. The first part of the study will provide an overview of related research and introduce the current status of the application of MapReduce and clustering algorithms. The second part will detail the data mining techniques and implementation steps based on MapReduce and K-means CA. The third section will carry out an empirical investigation to confirm through experiments the algorithms’ viability and efficacy. Finally, the fourth part will summarize the research results and present the future research outlook.
Related works
The configuration parameters that are set affect how well MapReduce workloads execute on Hadoop and Spark. In metro systems, improving energy efficiency has received increasing attention due to the huge energy consumption of rail transportation operations. To shorten the integrated model’s execution runtime, Shang et al. suggested a parallel particle swarm optimization approach based on the MapReduce algorithm. According to the results of the experimental research, the study’s suggested strategy can achieve faster execution times and lower energy consumption. 8 Current MapReduce performance tweaking systems are hard to utilize in real-world scenarios and have opaque implementations. Because of this, Chen’s group suggested the open-source Catla project for Hadoop and Spark, which offered extensive tools for tweaking, predicting, and visualizing data using a variety of optimization and machine learning techniques. Experimental investigation shows that the study’s proposed approach may automatically improve performance change pattern mining. 9 Wang et al. proposed a multi-threaded particle swarm optimization K-Means algorithm based on MapReduce. Experimental results show that this method performs well on large-scale datasets and can effectively reduce computing time and resource consumption. 10 Kumar et al. studied the resource allocation management problem based on Hadoop and MapReduce, and proposed a copy query management method. The experimental results strongly proved that this method could effectively reduce the query response time, avoid the waste of resources, and provide a feasible solution for the optimization of related systems. 11 Matrouk K M et al. proposed a novel sequential rule mining method for predicting user categories using the proposed MapReduce framework based on hybrid Tasmanian Tasmanian Devil optimization. The results showed that the performance in terms of the number of mining rules, execution time, recall rate and accuracy was significantly improved. Their values were 183, 7.70 seconds, 0.88 and 0.88, respectively. 12
Ghezelbash’s team used the K-means algorithm (KMA) to cluster geochemical data in order to reveal anomalous populations associated with porphyry and skarn-type copper deposits in the Baft area of northeastern Iran. This was made possible by the algorithm’s ease of implementation, quick computational speed, and scalability to large datasets. The efficacy of this strategy in enhancing the certainty of mineralized zones for the subsequent exploration phase has been demonstrated by the experimental results. 13 K-means clustering (KMC) is one example of an unsupervised learning method that has the potential to identify signals from small UASs that have never been detected before. So Swinney et al. used migration learning based on KMC and CNN feature extraction with spectrogrammatic graphical signal representation applied to audio classification. Experiments showed that the study’s suggested approach has a greater classification accuracy. 14 In the field of big data analysis, the K-means algorithm also plays an important role. The research of Begum N. Points out that big data analysis has a profound impact on the prediction of consumer behavior in retail business. By using the K-means algorithm to conduct cluster analysis on consumer data, the behavioral patterns of different consumer groups can be effectively identified, thereby providing support for precise marketing and personalized services. 15 Since there hasn’t been much research on the normalization effect and how it affects KMA performance, Nio-Adan et al. developed a novel metric to assess the normalizing effect on features. The study’s suggested approach can greatly enhance K-means’s classification performance and computing cost, according to the results of an experimental investigation. 16 Bhatia K. and Gupta BP further explored the analytical methods of consumer behavior prediction and sales prediction in retail business, emphasizing the efficiency and accuracy of the K-means algorithm when dealing with large-scale consumer data. 17 Kumar S et al. compared the application of K-means clustering and hierarchical clustering in the segmentation of e-commerce customers. The study found that the K-means algorithm has higher efficiency and better scalability when dealing with large-scale customer data. 18
A comprehensive analysis of the existing work reveals that there are three technical gaps in the combined application of MapReduce and K-means. The collaborative optimization of distributed computing frameworks and clustering algorithms is insufficient. Existing studies mostly focus on the optimization of a single technology, such as MapReduce tuning or K-means improvement, lacking a systematic design of the coupling relationship between the two. For example, the influence of the MapReduce partitioning strategy on the convergence speed of K-means is not considered. The lack of a balance between domain specificity and universality: Optimization solutions for scenarios such as metro energy consumption and geological exploration are difficult to be directly transferred to fields like retail and e-commerce, lacking a cross-industry universal methodology. The disconnection between theoretical analysis and engineering practice is found. Most studies only verify the effect through experiments and fail to prove the reliability of the optimization strategy from theoretical levels such as algorithm complexity and convergence. For example, the convergence boundary conditions of K-means in the MapReduce distributed environment are not clarified. To this end, the research proposes a K-means clustering algorithm based on MapReduce to optimize the traditional data mining techniques and ultimately achieve the effective mining of consumer behavior data.
Consumer behavior prediction method based on MapReduce
The study optimizes and improves DMA based on MapReduce, aiming to improve customer profiles and provide accurate consumer profiles for enterprises to achieve precision marketing. The study first optimizes CB mining data, combines MapReduce with K-means CA, and then builds a system framework for analyzing and predicting CB.
Design of data mining algorithms based on MapReduce
With the continuous improvement and development of the market, the number of consumers is getting bigger and bigger, and the emergence of online payment means further promotes the CB. Consumers as the main body of the purchase of their consumption behavior brought about by the digital trade to promote the exchange of information between multiple subjects, how to start from the transaction data for data mining, for the analysis of market trends and enterprise development is crucial.
19
However, the current data mining technology has difficulties such as high latitude and high redundancy, for this reason, the research proposes MapReduce technology for data mining against CB to provide technical support for providing enterprise competition.
20
The MapReduce model is a computational task automation tool used in massive data processing. MapReduce mainly relies on distributed files as well as data support provided by Hadoop distributed file system (HDFS) when performing distributed computing. Compared with other distributed files, HDFS is characterized and advantaged by a high degree of fault tolerance, so it can help MapReduce improve the high processing capacity of massive data in the experiment. For example, in the clustering task, even if some Datanodes fail, other replicas can still be accessed, thereby ensuring the continuous execution of the clustering algorithm. Figure 1 depicts the HDFS architecture. HDFS architecture.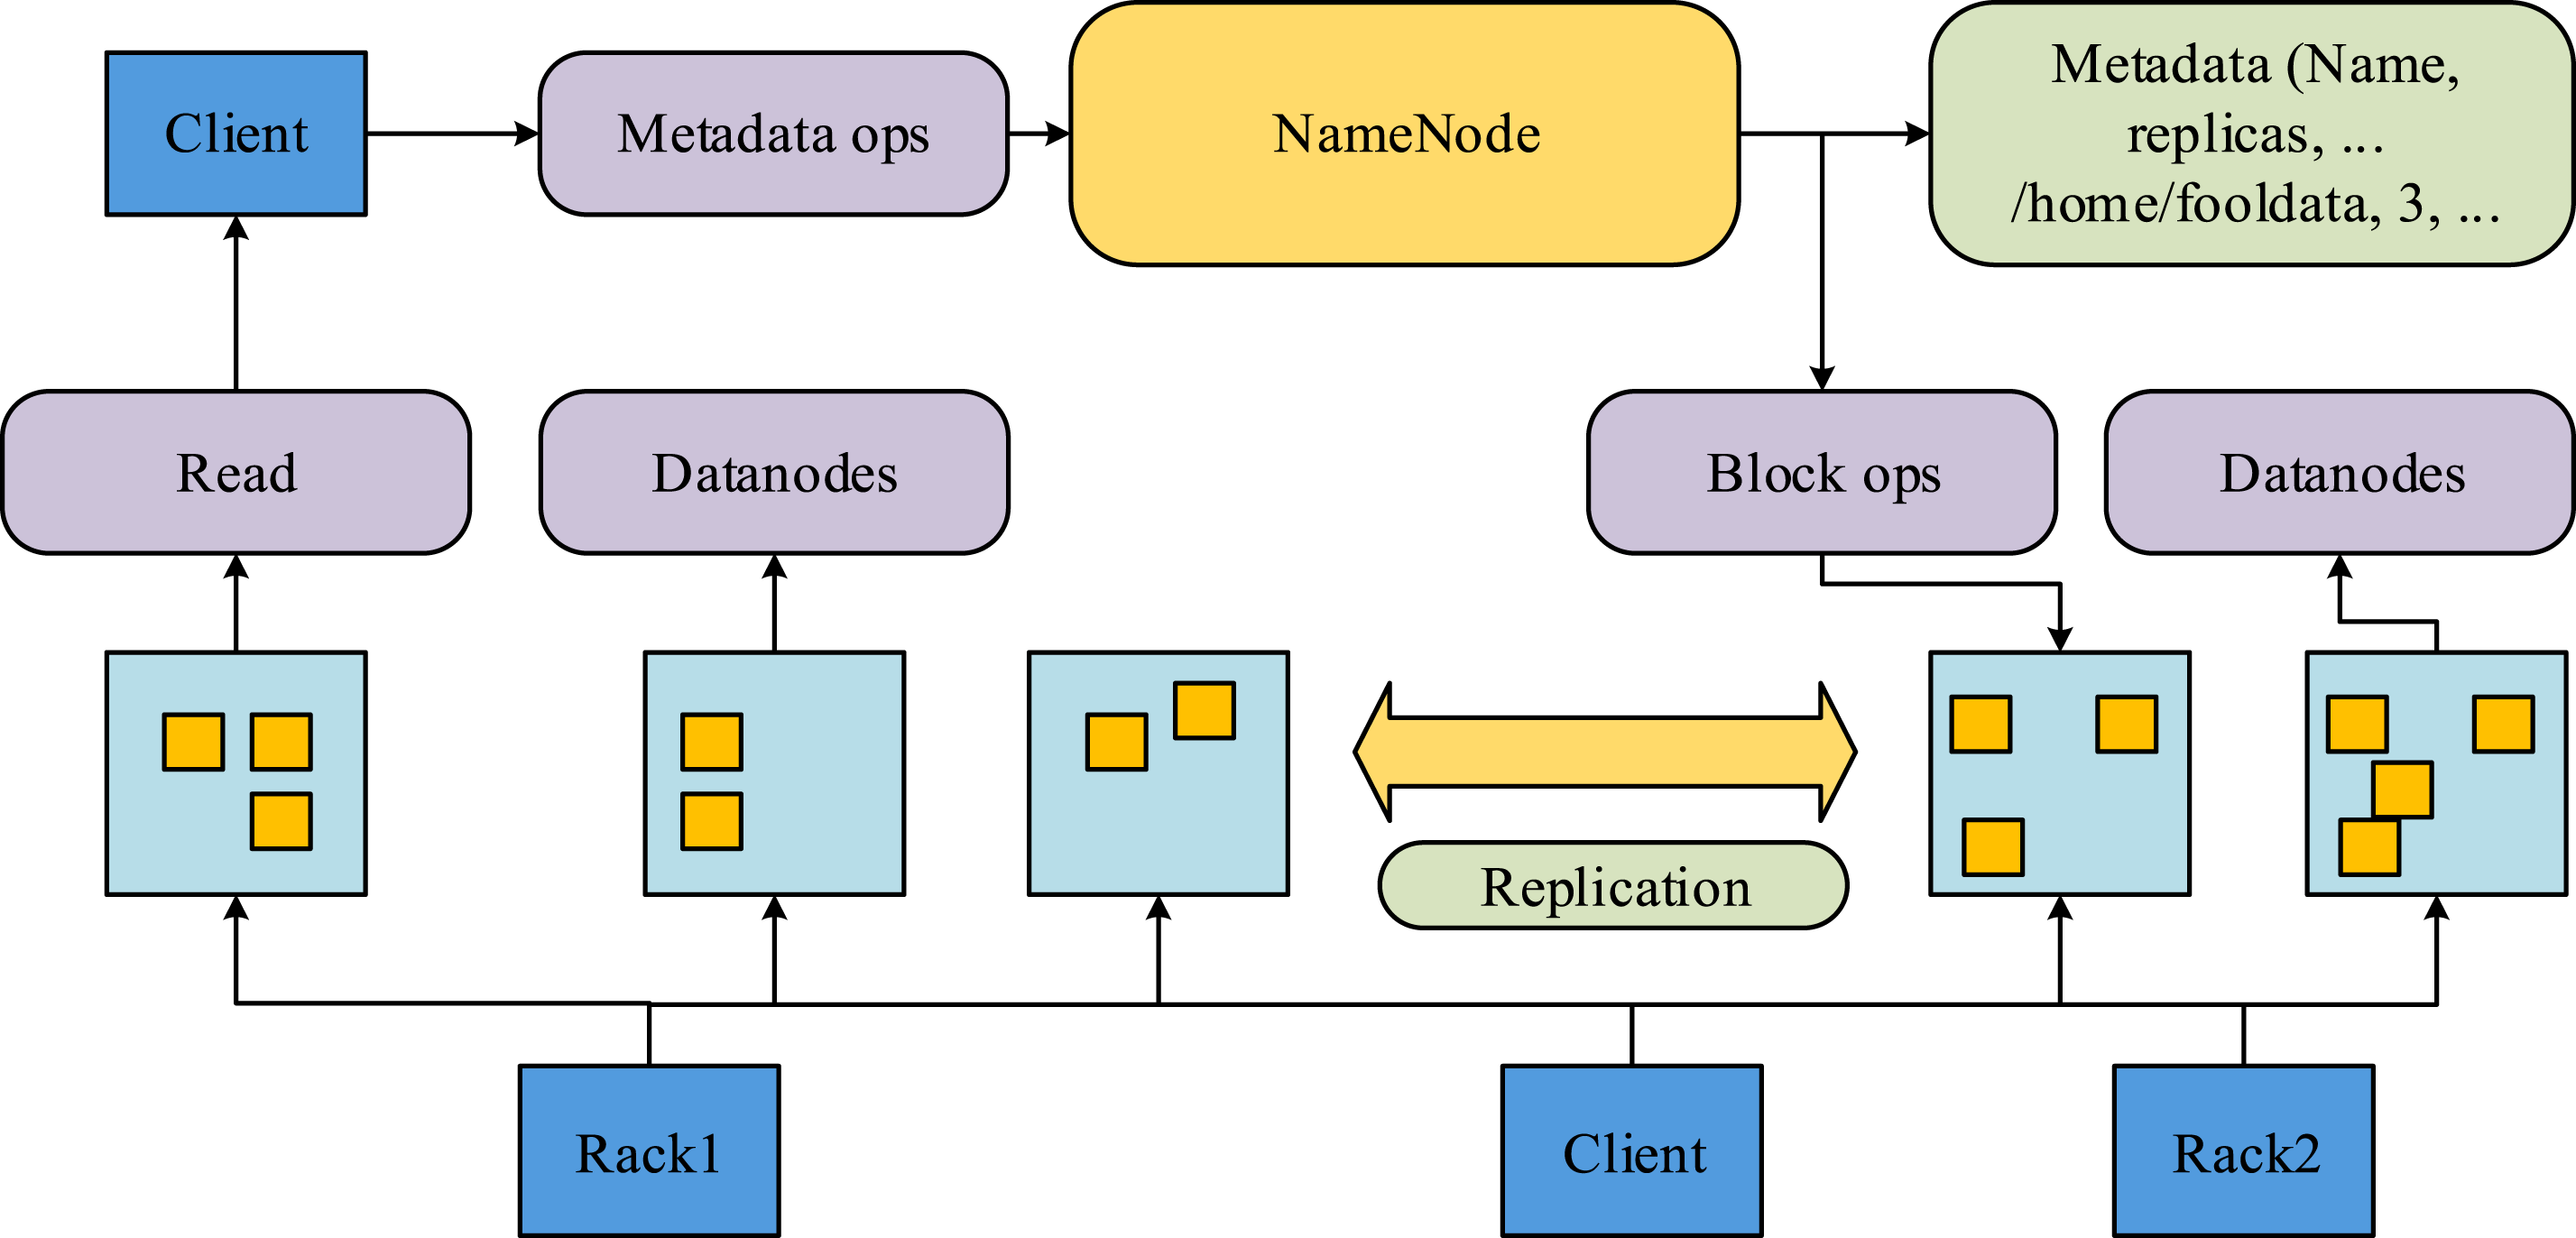
In Figure 1 the architecture of HDFS is mainly composed of DataNode and NameNode. Among them NameNode is mainly used for file system management operation access and DataNode is mainly used for data storage management. The storage of files in HDFS is mainly in the form of files, in the management, the data is further sliced, which is mainly operated by the Client module, and the data is stored in the DataNode after being sliced. NameNode is the key part of HDFS, which carries out the editing operation of important information by opening, naming and editing the directory of files. Figure 2 depicts the MapReduce execution flow. MapReduce execution flow.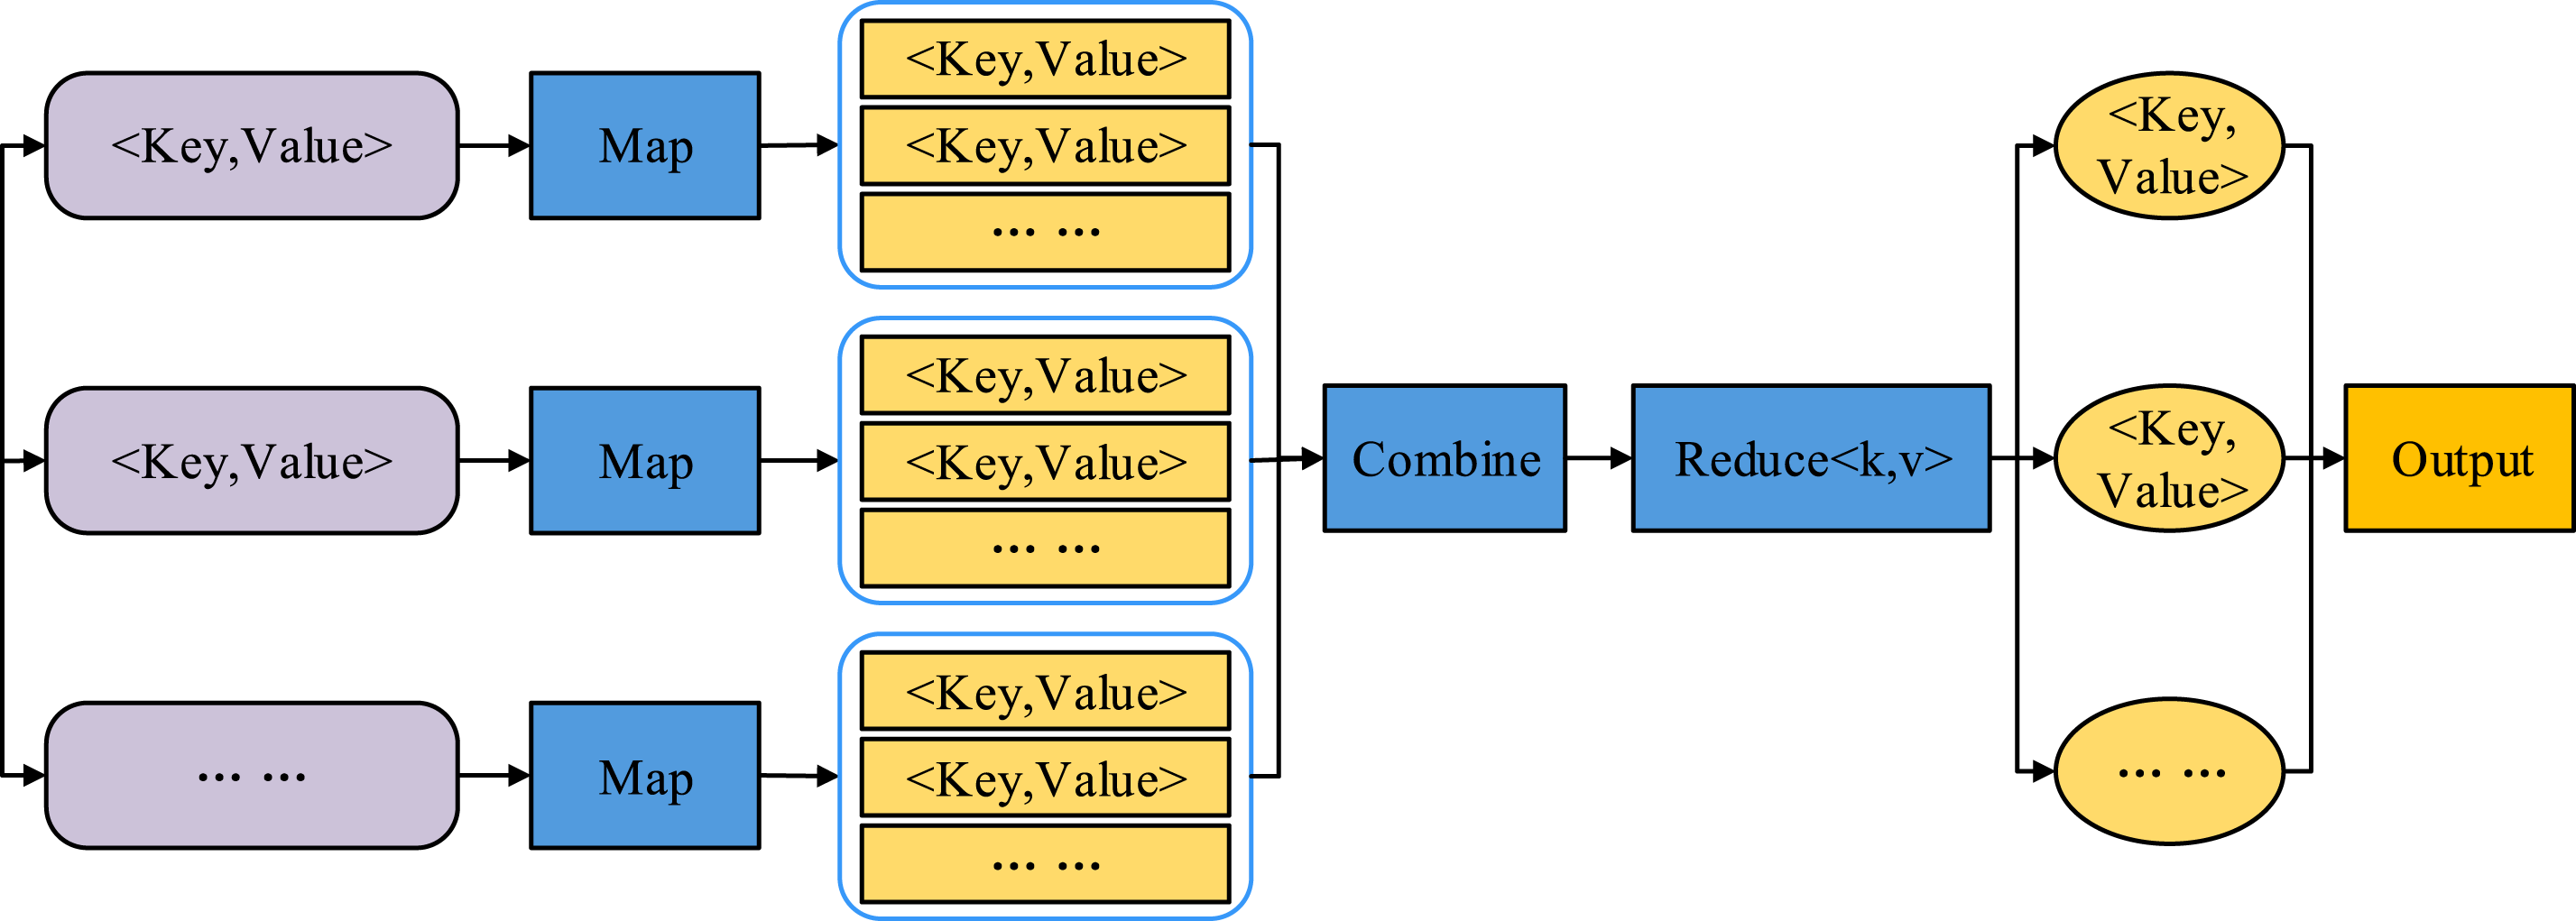
User programming for MapReduce is divided into three main parts. First is the Mapper phase, in which Map is used for mapping, depending on the user-defined Mapper needs to inherit its parent class. The Mapper reads the input key-value pairs, performs preliminary processing on the data, and outputs intermediate results. These intermediate results will directly affect the quality and distribution of the input data in the subsequent clustering process, and thereby influence the efficiency and accuracy of the clustering algorithm. Next is the Shuffle phase, in which the output is grouped according to the Map function, and then the keys of the same group are sent to the same Reduce node. The data grouping and transmission efficiency in the Shuffle stage are crucial to the clustering process. If the data distribution in the Shuffle stage is unreasonable, it may lead to excessive load on some Reduce nodes and insufficient load on other nodes, thereby affecting the execution efficiency of the entire clustering task. Then the last stage is the Reduce stage, in which the same set of keys are combined to generate the results through the operation, and the results are merged and output. Although MapReduce can handle massive node data with fault tolerance, it is difficult to cope with the dynamic changes of data in stream computing, and a large amount of output is generated during data analysis, increasing the burden on the disk. To solve these problems, the research introduces the K-means clustering algorithm to improve the efficiency and quality of data mining. The K-means algorithm is simple and easy to deploy. Its core lies in optimizing clustering by minimizing the sum of squared errors. The goal is clear and the optimization is easy. It performs well on large-scale datasets, can converge rapidly and generate high-quality clustering results, and is suitable for distributed computing environments. In prediction, K-means can efficiently classify data, quickly identify consumer behavior patterns, significantly reduce computing time, improve clustering accuracy, and provide high-quality input for precise marketing and dynamic prediction.21,22
The KMA performs the grouping process by dividing the number of K clusters, followed by randomly selecting K data points as the initial cluster centroids. In KMA cluster centroid squared error and its sum


The data samples in cluster


The expression for the mean squared distance The data mining process based on MapReduce and K-means clustering algorithms.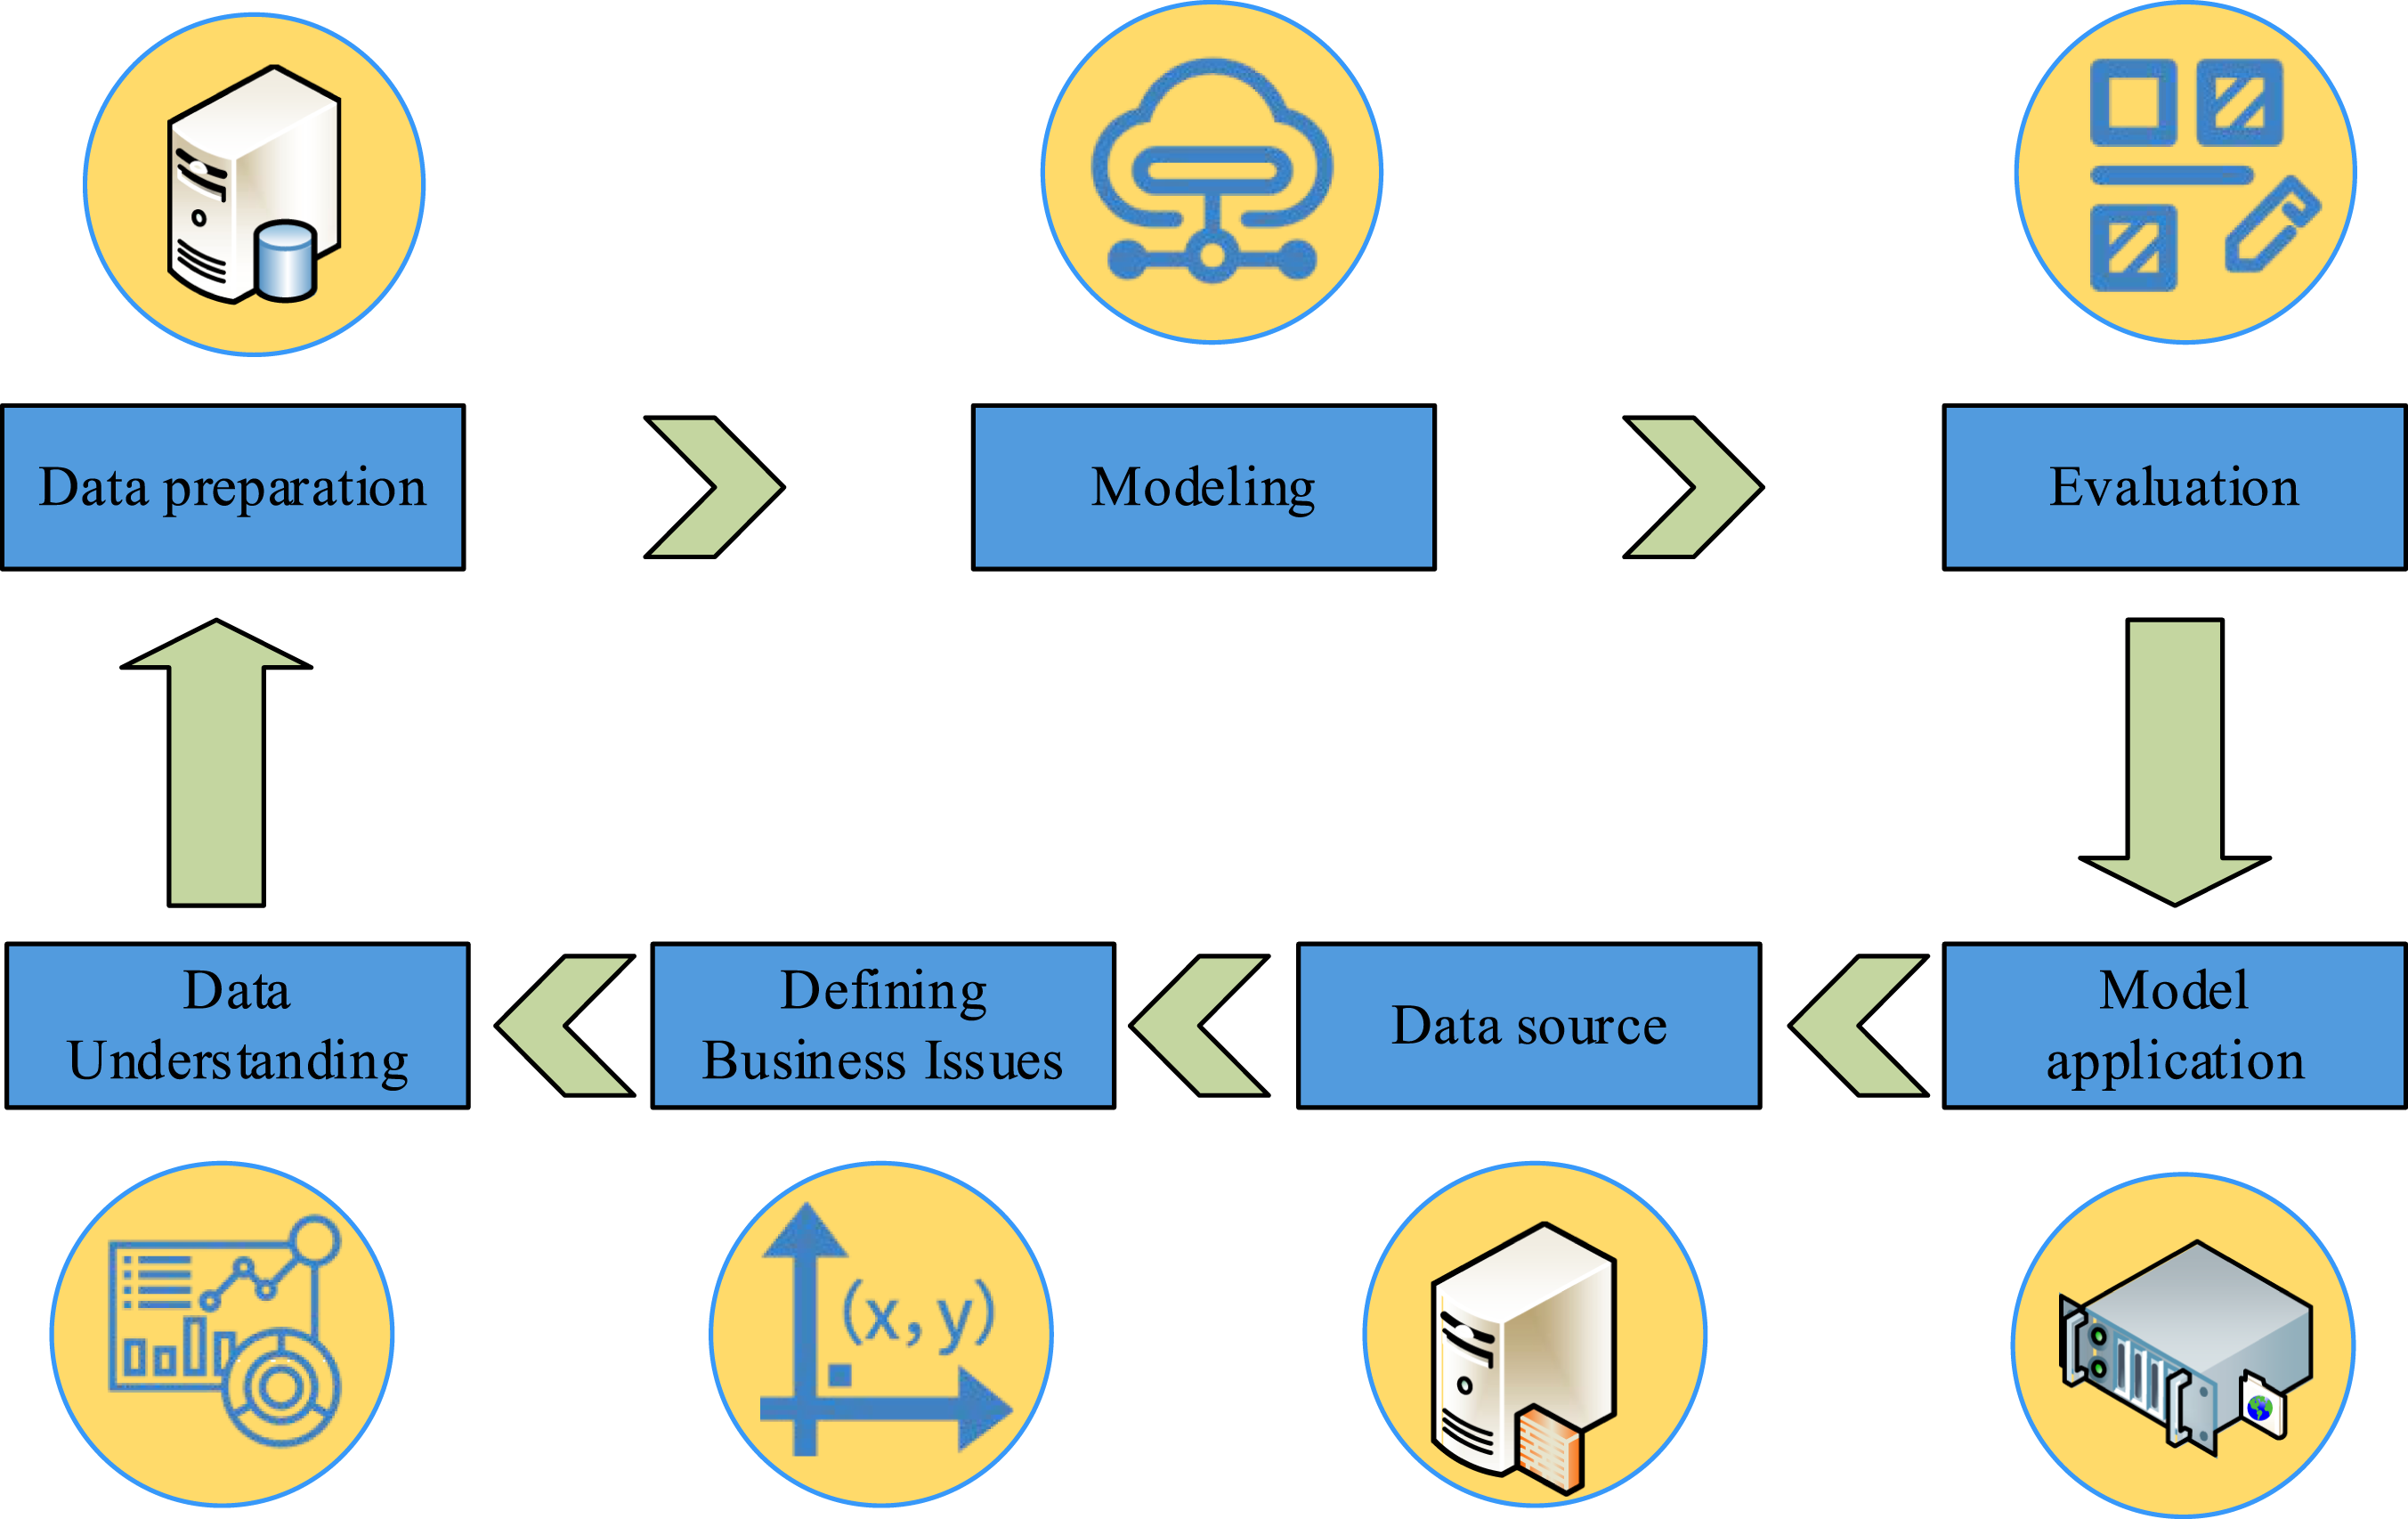

First, data understanding, which primarily clarifies the primary goal and scope of data mining in CB-oriented, is the first phase in the data mining process shown in Figure 3. Second, data collection and preparation, in this step, the main consumer’s personal information, commodity goods information, and transaction records for data collection. Second, there is data collection and preparation. The data collection work of the research mainly focuses on consumers’ personal information, commodity and goods information, and transaction records. These data sources are extensive and the structures are diverse. In order to improve the data quality, the study conducted a comprehensive cleaning and integration of the collected data, with a focus on data missing and outlier issues, and adopted appropriate data interpolation and preprocessing methods for optimization. For the outliers and noise of consumer data, the study adopts the local outlier factor algorithm to detect the data points in the low-density area and mark them as outliers. In the Map task stage of the MapReduce framework, the input data is preprocessed, including data formatting, standardization processing, as well as operations such as removing duplicate data and filling in missing values. Then for model establishment, the establishment of the model in this research is mainly based on MapReduce for the construction of the model, and DMA selects K-means CA to analyze the collected dataset in order to find out the consumption patterns and correlation factors existing in the data. Then for the model evaluation, the results of data mining are mainly analyzed and evaluated, and their effectiveness and superiority are verified. Finally, the deployment and application of the model is carried out based on the conclusions drawn, and the CB data is reported and illustrated.
System architecture study for consumer behavior analysis and prediction
After optimizing the DMA, the study builds a system framework for CB analysis based on the proposed composite algorithm of MapReduce combined with K-means. Growing numbers of customers are beginning to shop and consume online against the backdrop of the network’s rapid development. Data mining can be used to evaluate CB data in order to produce consumer profiles for businesses. Enterprises can further optimize their production and marketing strategies through the consumer information from data mining. The formula of consumer’s behavioral influencing factors is shown in equation (9). User consumption behavior analysis system.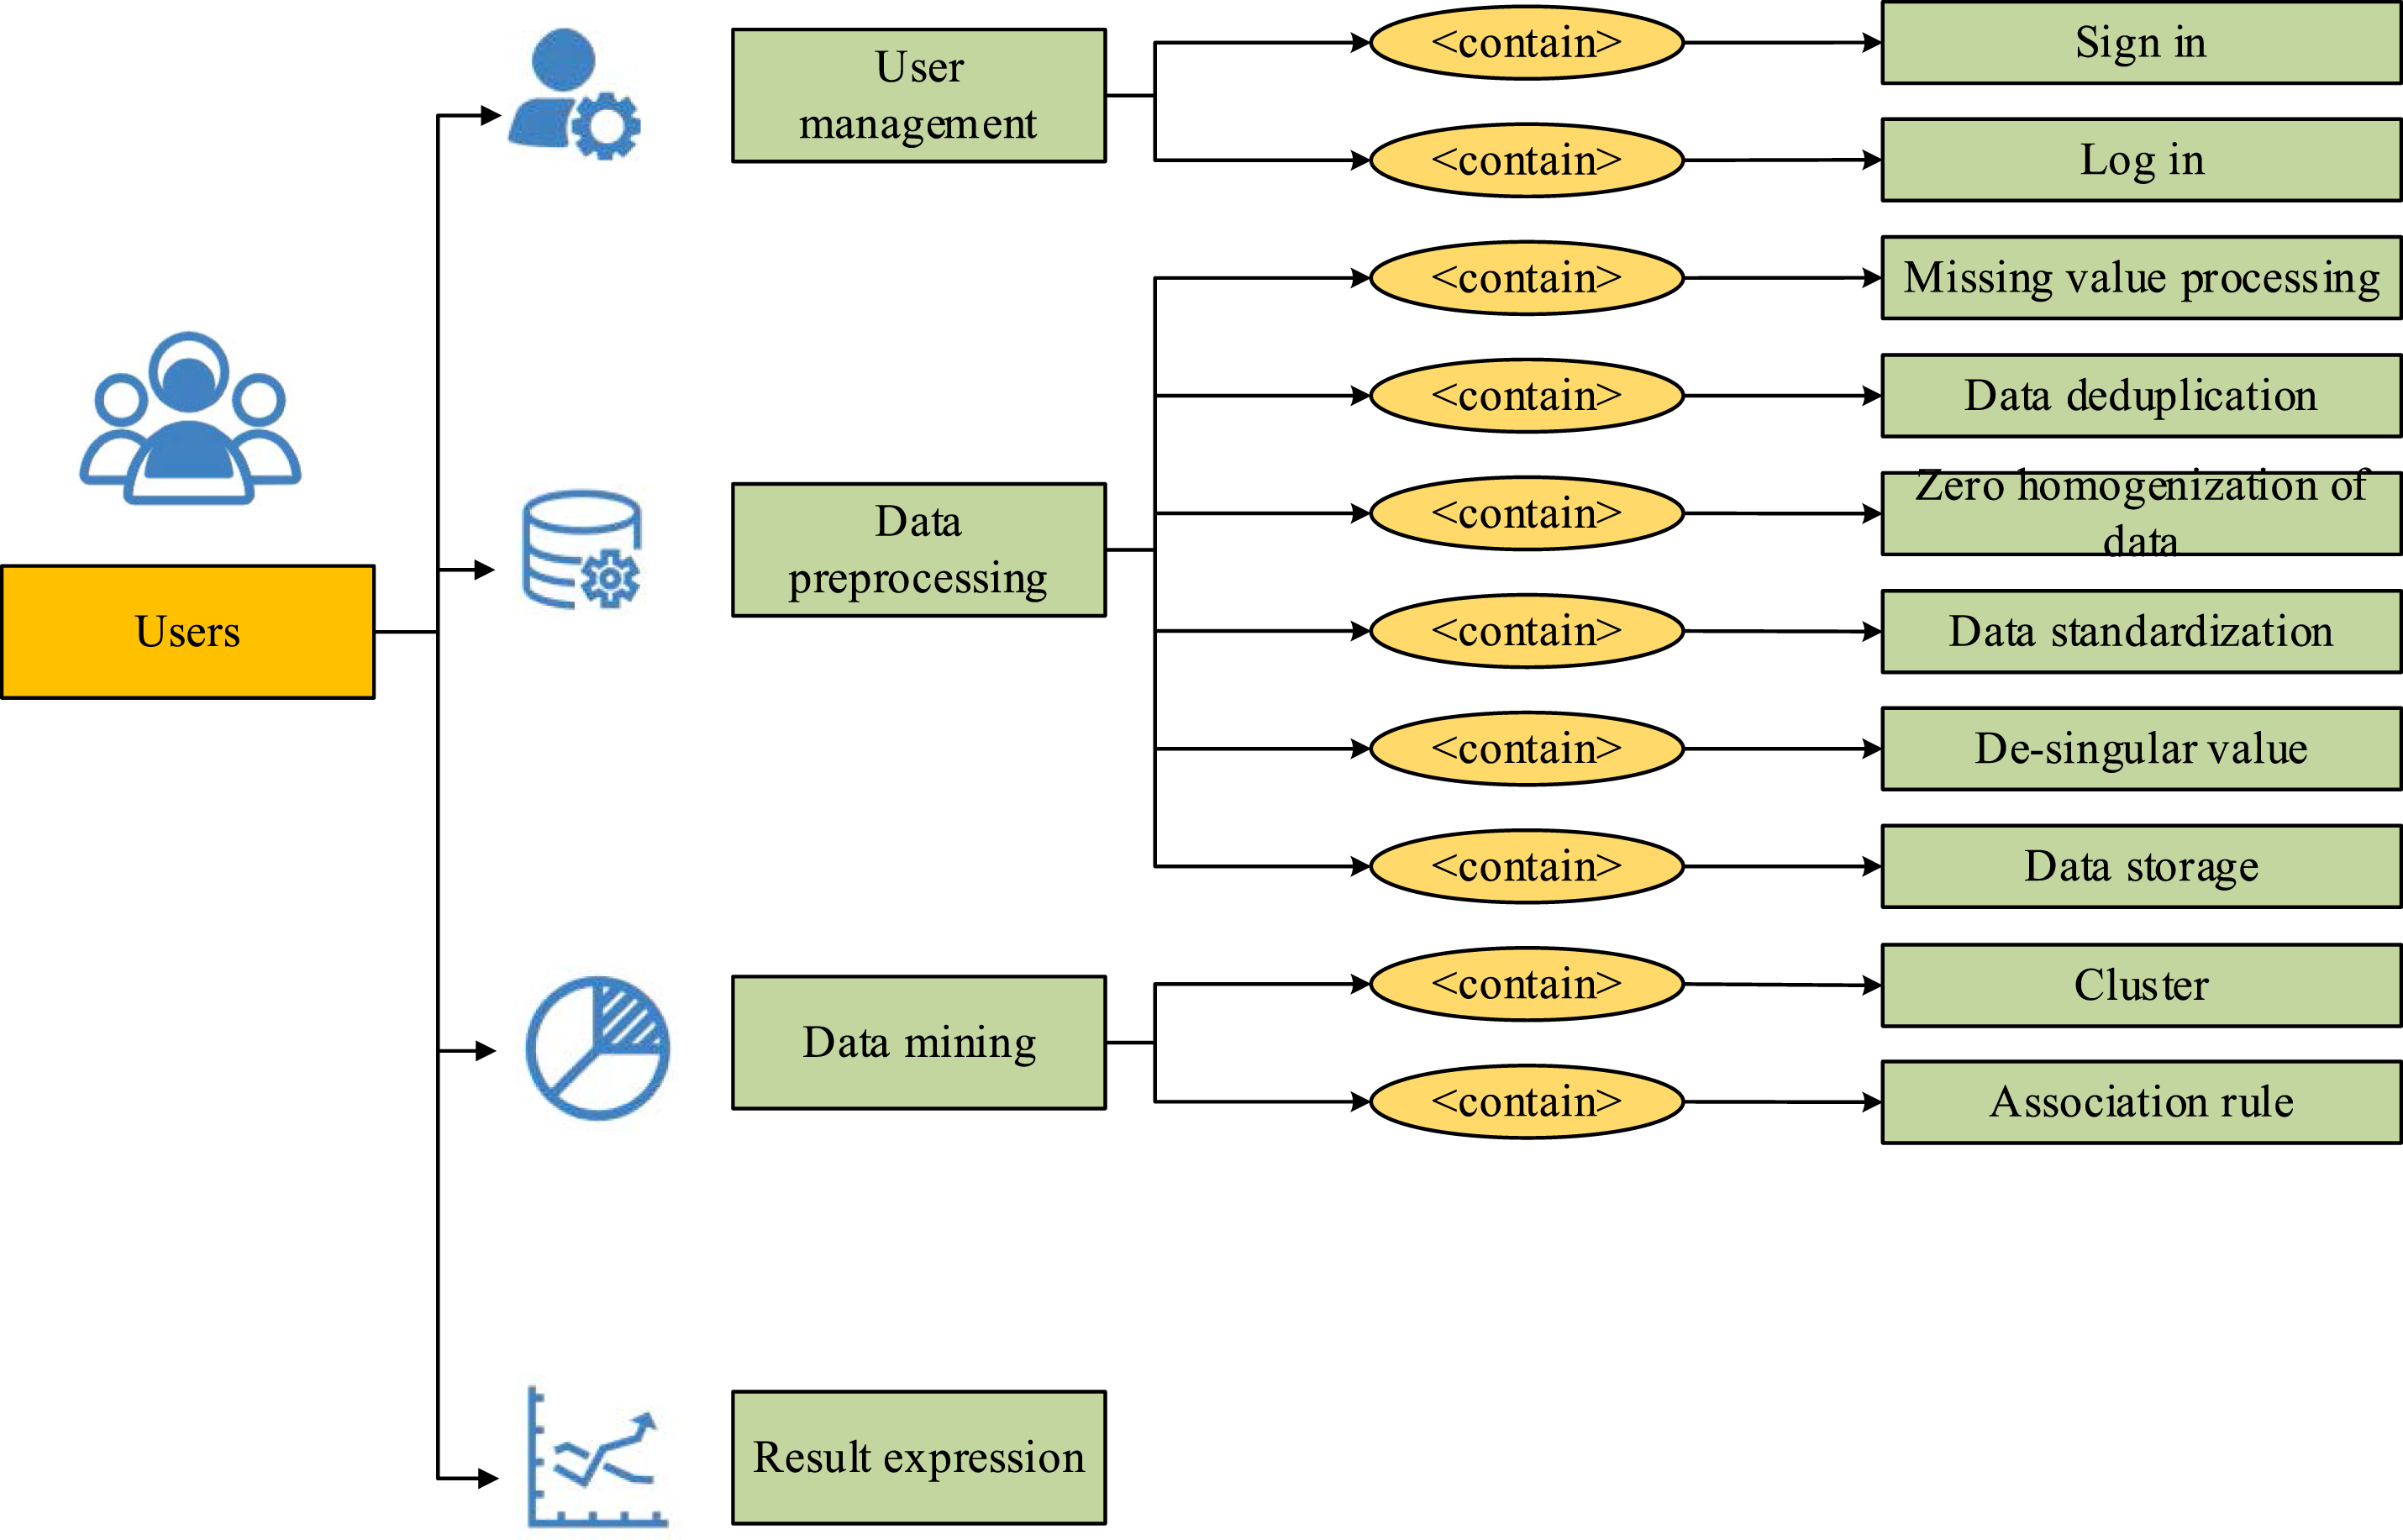

There are four main parts involved in CB analysis. The first one is user management, which mainly focuses on user registration and login operations, and storage of user’s personal information. The mobile phone strictly adheres to the relevant regulations of the Personal Information Protection Law, uses encrypted storage technology to process users’ sensitive data, and ensures the minimization management of data access rights to prevent information leakage and abuse. Then there is data preprocessing. The data preprocessing mainly includes missing value processing, data de-weighting, zero-mean data, data normalization, singular value removal and data storage. Then the data mining part includes K-means CA and association rules. Equation (10) illustrates how the expression of support is used to examine the support in association rules and characterize the utility of data mining.


Equation (11) represents the ratio of the data records containing Overall business flow of the system.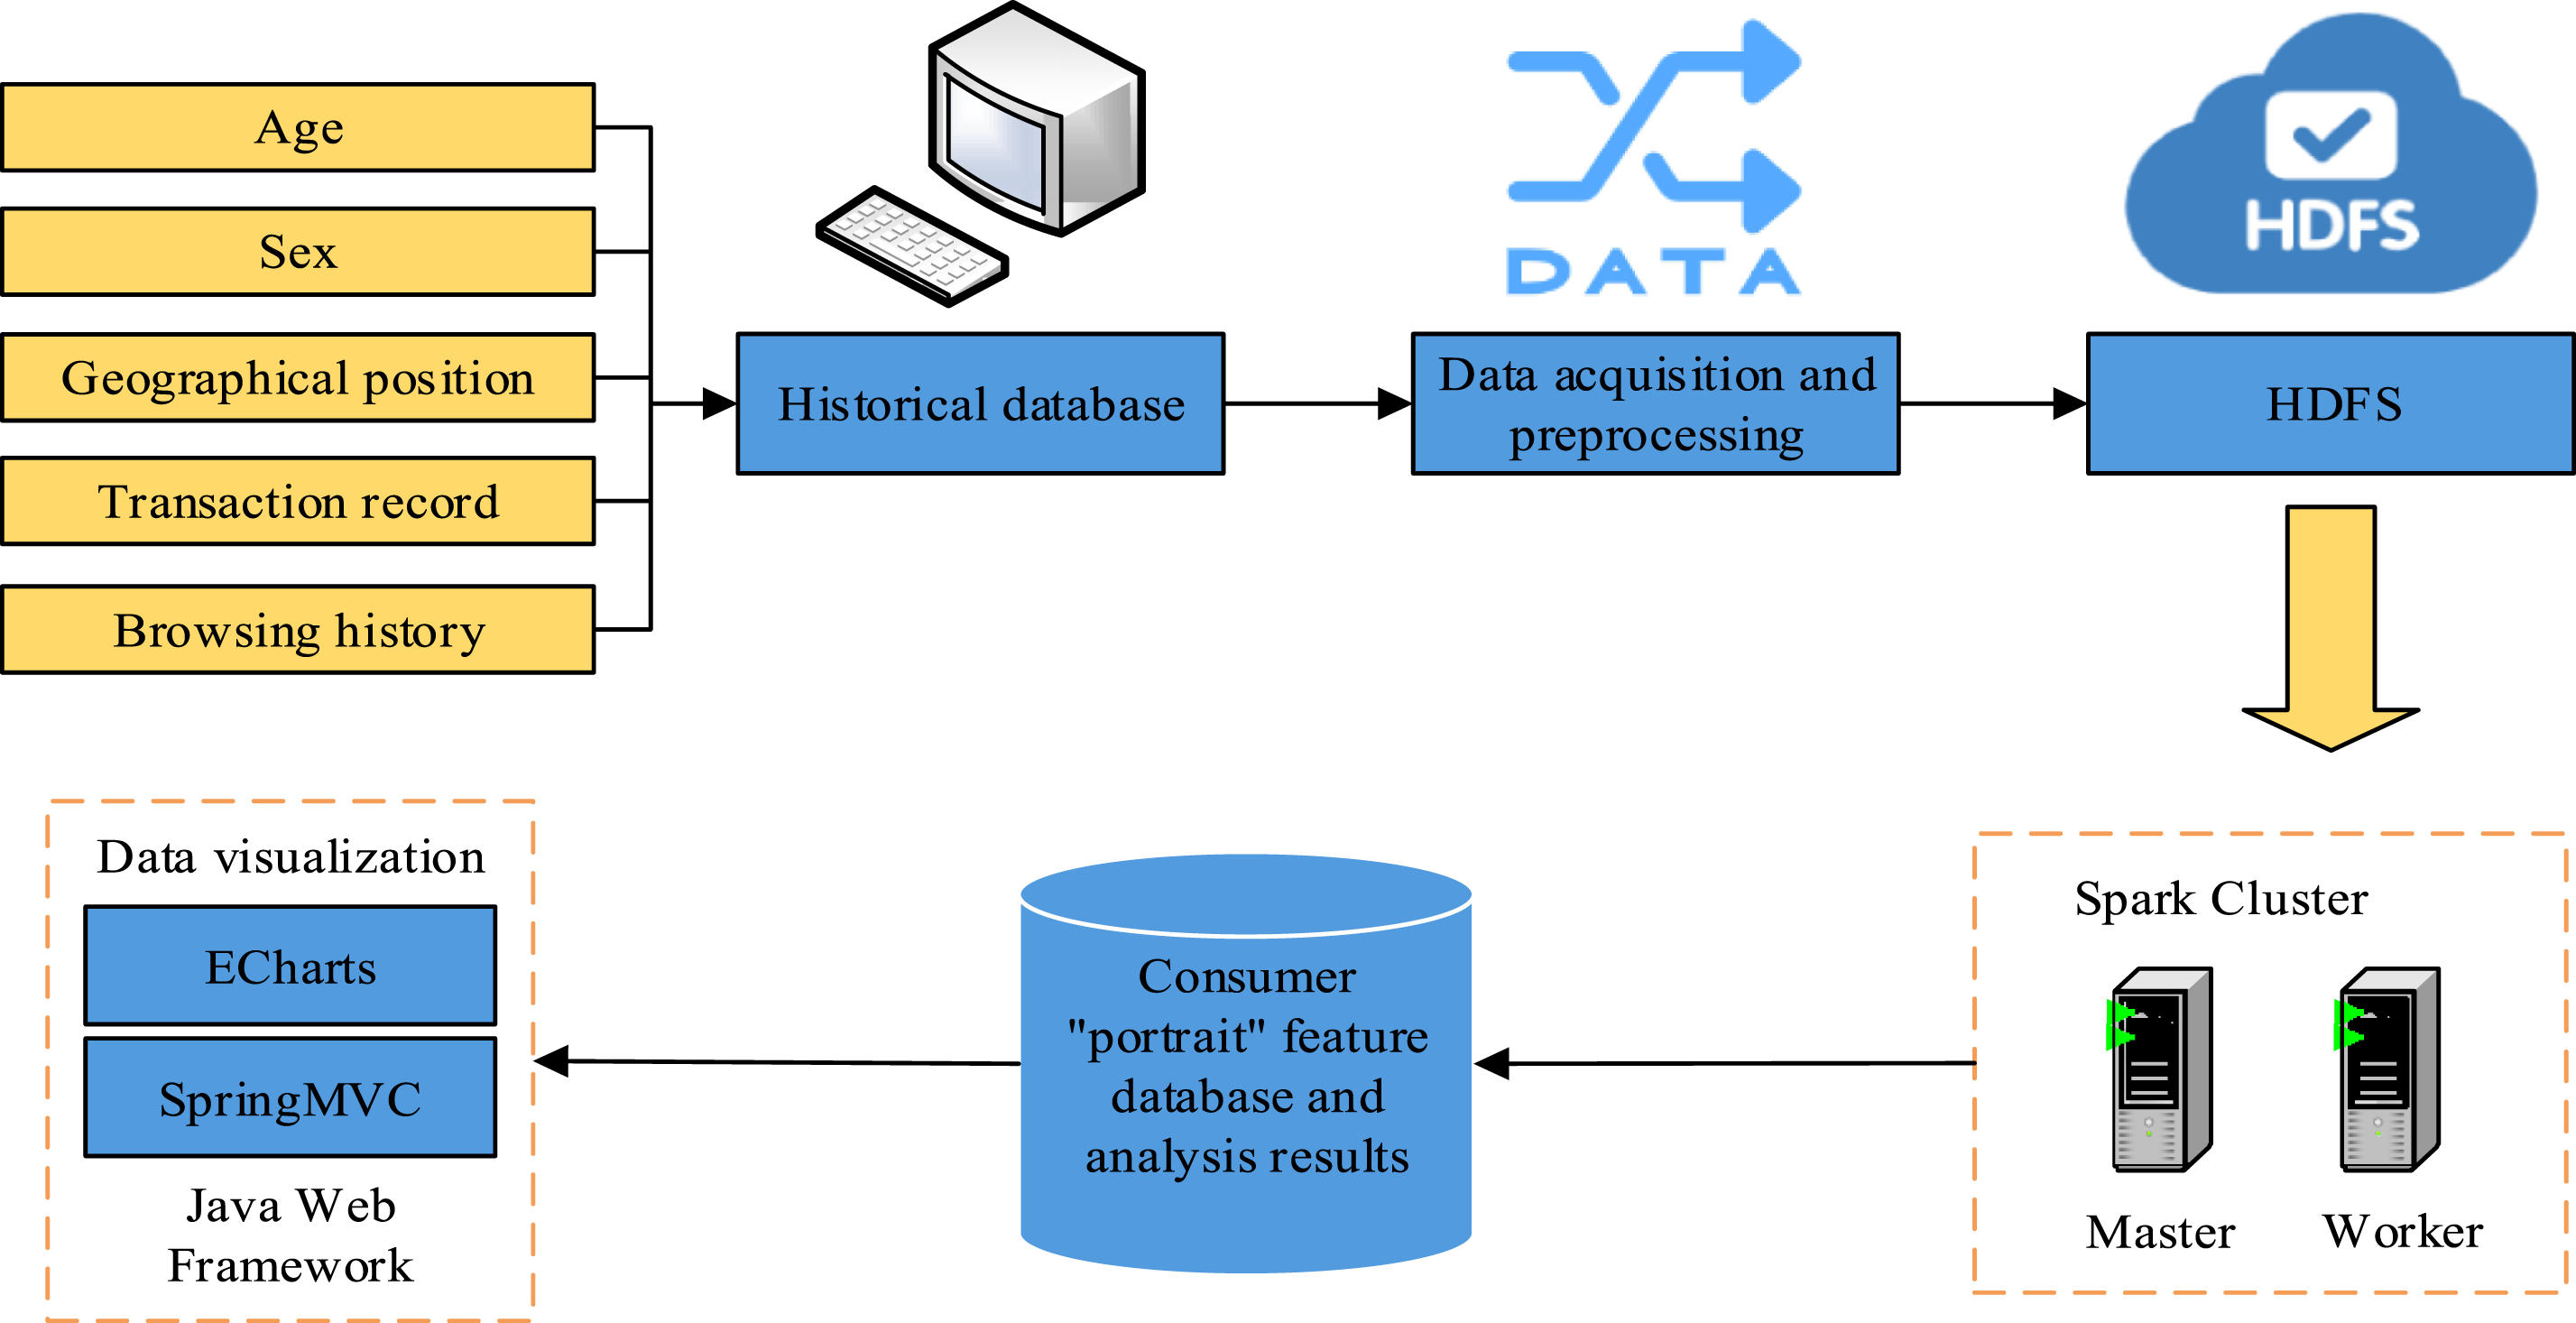

In Figure 5, the age, gender and geographic location of the consumers are first collected and their transaction history and browsing history are collected. After that the data is entered into the historical database for storage and the data is transformed in data mining, the data is transformed using the min-max normalization function whose expression is shown in equation (13).


MapReduce-based consumer behavior prediction system testing
The study first examines the clustering impact of the suggested DMA in order to confirm the superiority of the CB prediction system, and then it applies the system to an actual case to assess how well the research system analyzes CB.
Performance analysis of MapReduce-based data mining algorithms
Software and hardware configurations.
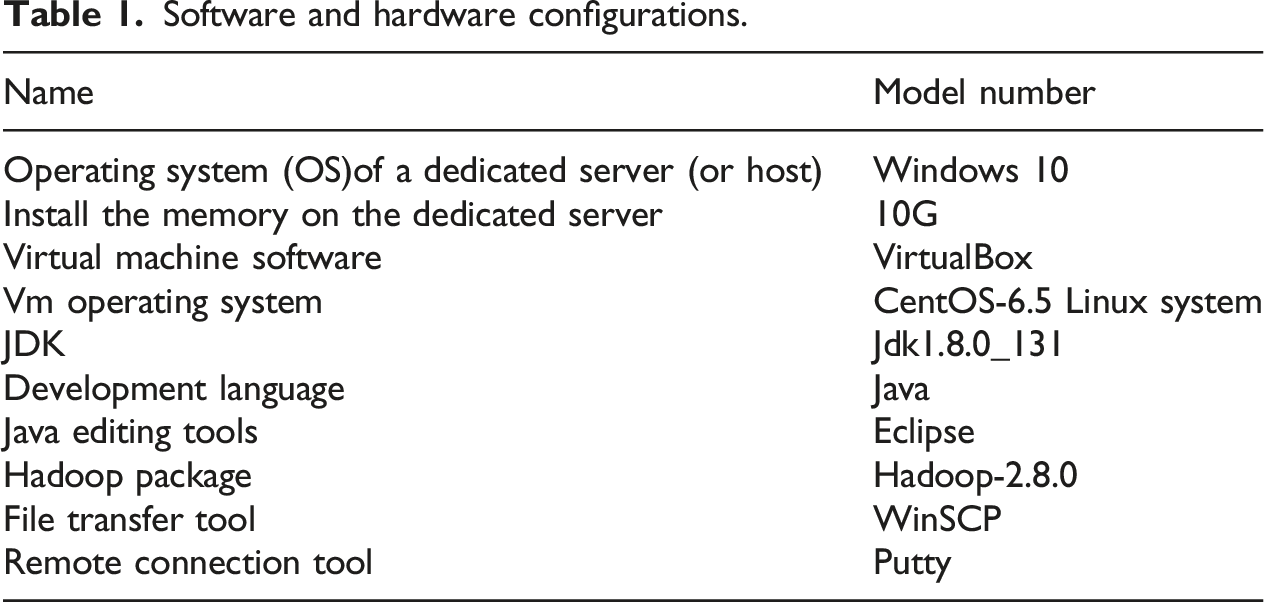
The host operating system in Table 1 is Windows 10 and the installed memory of the host is 10 G. To set up the Hadoop cluster, the study uses VirtualBox as the virtual machine software and combines it with Linux system for installation. The research development language is Java editing tool as the installation package, and the file transfer tool and remote connection tool are WinSCP and Putty, respectively. The distributed cluster system of the experimental platform consists of one Master node (Master) and three computing nodes (Worker), among which the Master node is also used as a Worker node. The IP of the Master node is 10.50.28.221, that of the Worker1 node is 10.50.28.222, that of the Worker2 node is 10.50.28.223, and that of the Worker3 node is 10.50.28.224. Then the research for specifically analyzing the superiority of KMA in CB analysis, fuzzy C-means (FCM) and density-based spatial clustering of application with noise (DBSCAN) for clustering comparison with the research algorithm. All comparison algorithms are implemented on the MapReduce framework to ensure the fairness and comparability of the experiments. The dataset of different commodities such as IRIS, Glass and Wine is selected for the experiment, among them, the sample size of the IRIS dataset is 150 samples, the feature dimension is four features, and the number of categories is 3 categories. The sample size of the Glass dataset is 214 samples, the feature dimension is 10 features, and the number of categories is 6 categories. The Wine dataset has 178 samples, 13 feature dimensions and 3 categories. Figure 6 displays the experimental results from the dataset, which consists of 1340 data points. Clustering effect analysis.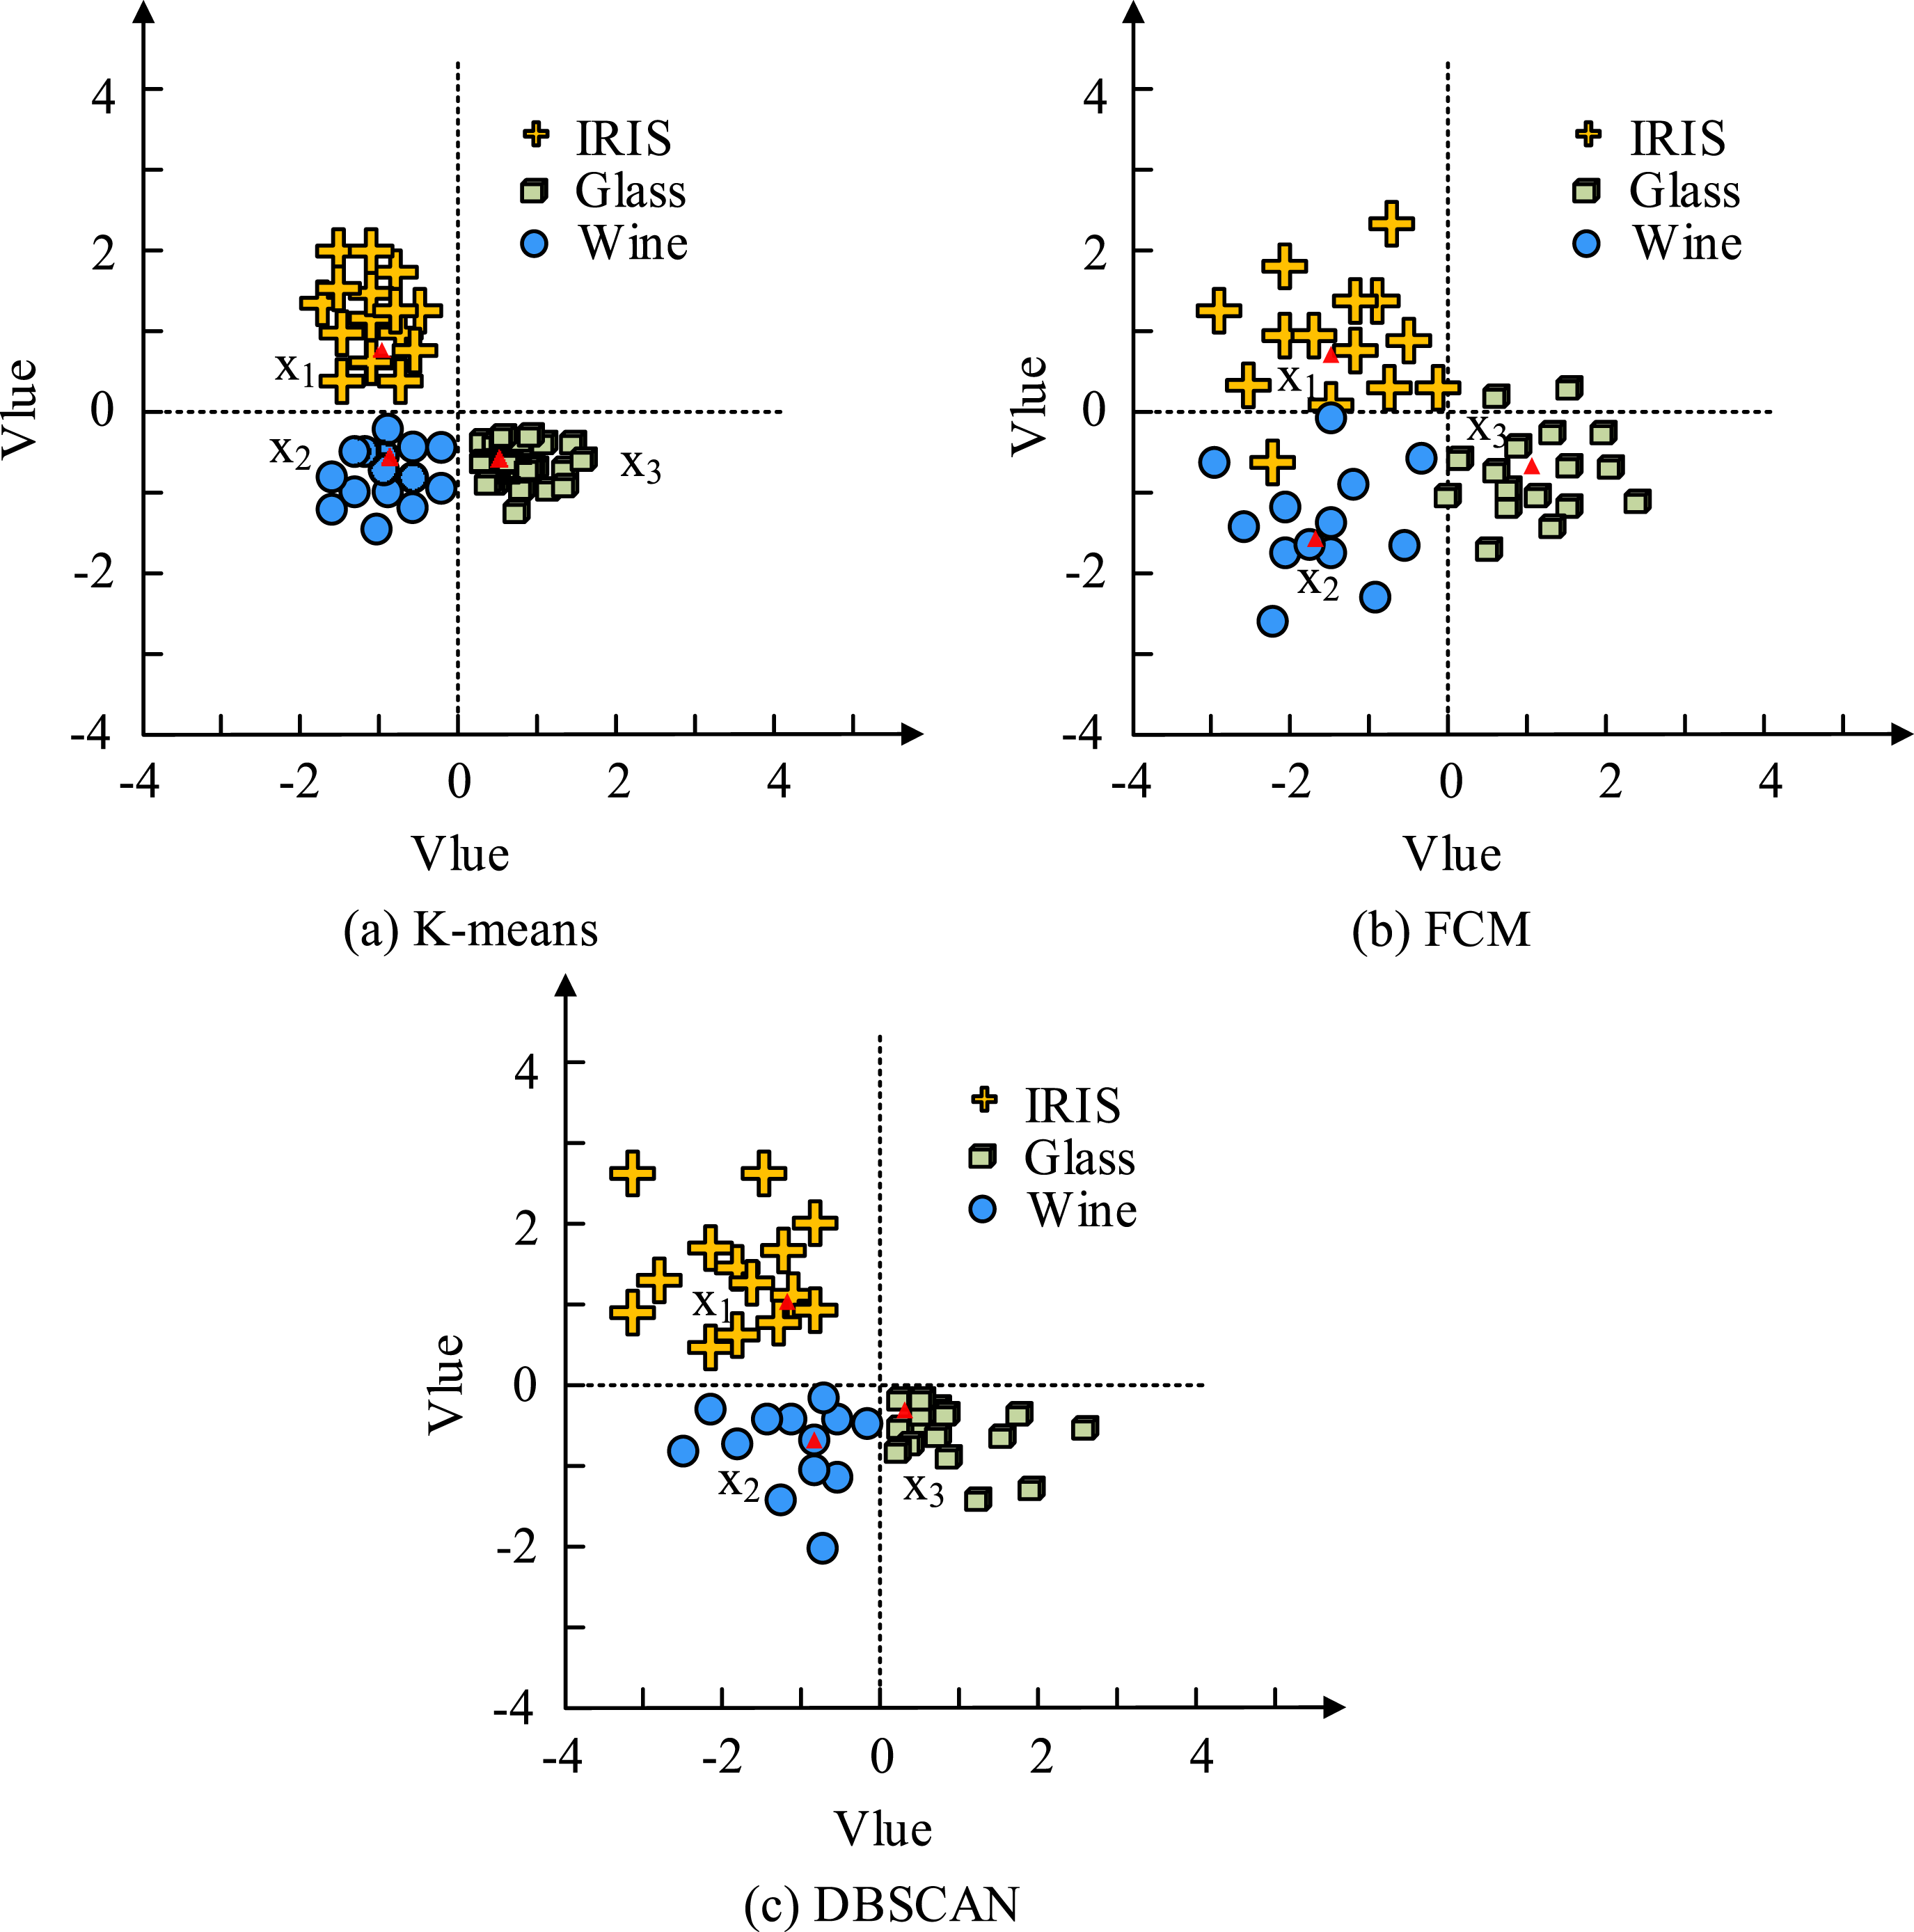
Figure 6(a)–(c) show the clustering effect analysis of DMA using K-means, FCM, and DBSCAN, respectively. From Figure 6(a), K-means has the Mahalanobis distances of 1.32, 1.24, and 1.45 in the three datasets of IRIS, Glass, and Wine, respectively. The FCM has the Mahalanobis distances of 2.32, 2.12, and 2.53 in the three datasets of RIS, Glass, and Wine, respectively, while the DBSCAN has the Mahalanobis distances of 2.32, 2.12, and 2.53 in the three datasets of RIS, Glass, and Wine, respectively. In RIS, Glass, and Wine, the Mahalanobis Distances of DBSCAN is 2.34, 1.87, and 1.74 in the corresponding datasets. It is evident that the research algorithm’s clustering effect outperforms the other two techniques. Then the clustering accuracy of the above three algorithms is analyzed, and the experimental datasets are also IRIS, Glass, and Wine. Additionally, Figure 7 displays the findings of the experiment. Comparison of clustering accuracy.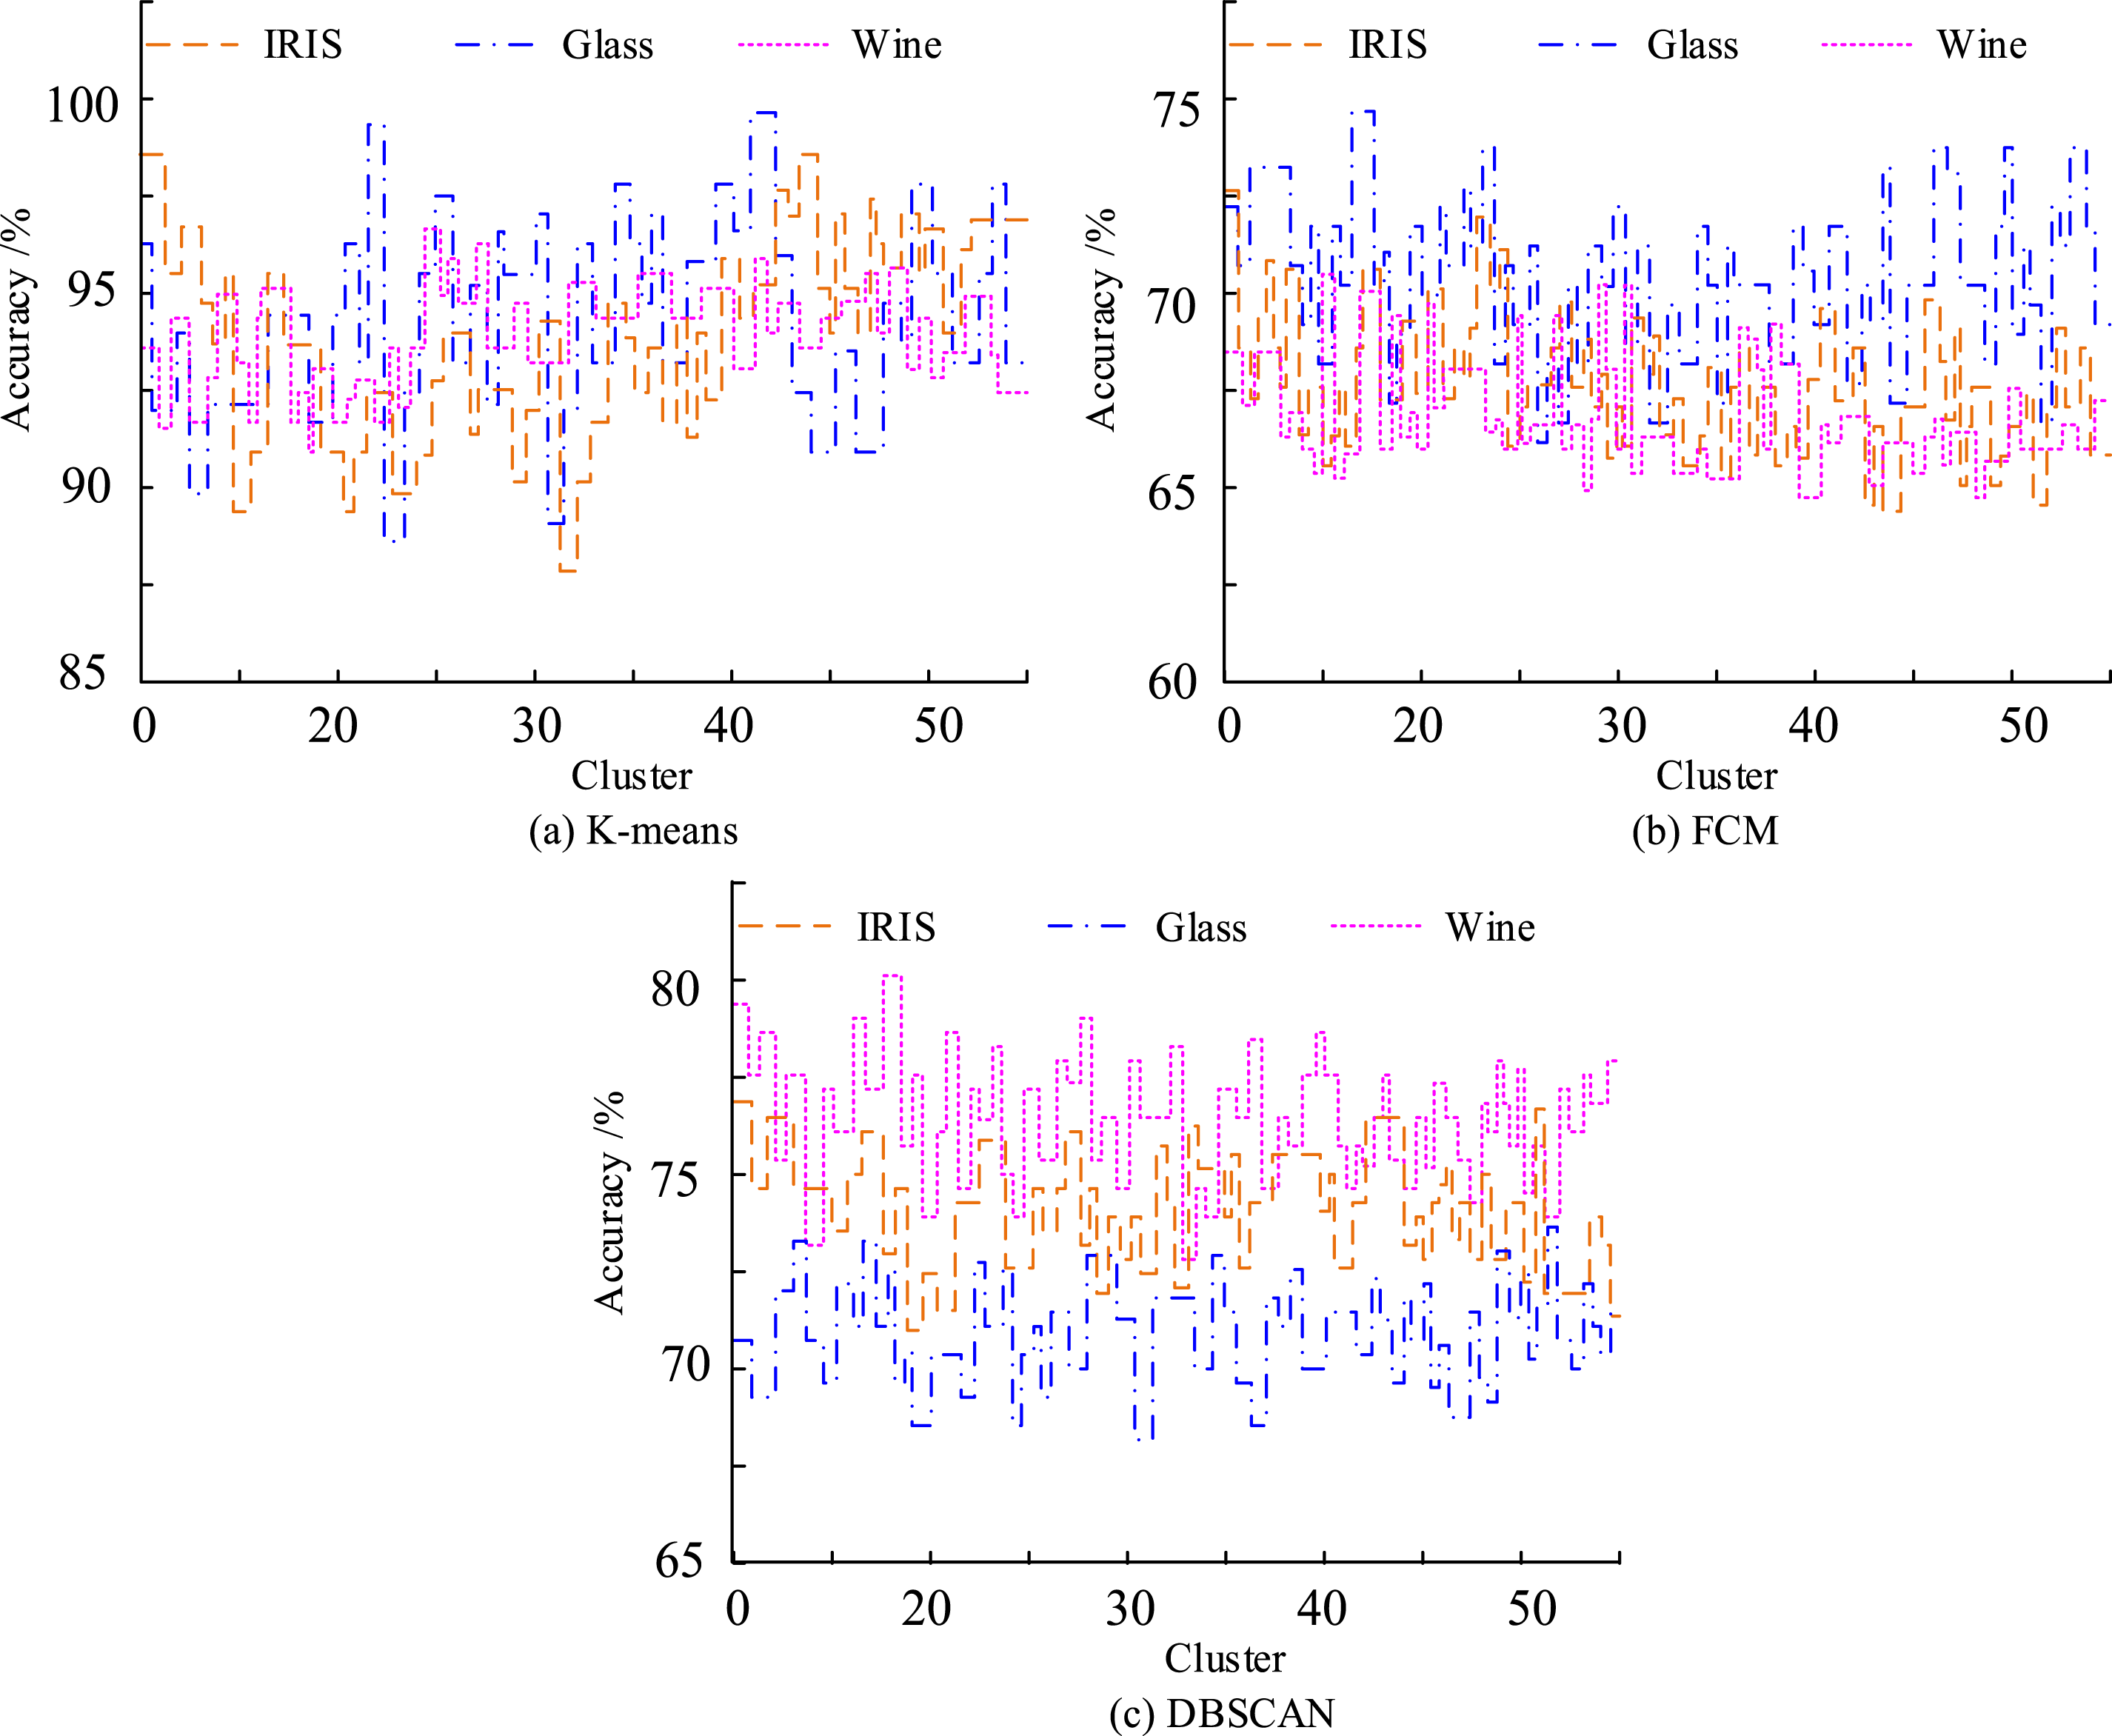
Figure 7(a)–(c) show the clustering accuracy analysis of DMA using K-means, FCM, and DBSCAN, respectively. In Figure 7(a) the average clustering accuracy based on KMA is 93.2% in IRIS dataset and 94.3% and 93.8% in Glass and Wine datasets, respectively. Compared with the study algorithm, the average clustering accuracy of the FCM algorithm in the IRIS, Glass, and Wine datasets is 24.3%, 22.8%, and 25.2% lower, respectively. In Figure 6(c), the average clustering accuracies of the DBSCAN algorithm in the three datasets of IRIS, Glass, and Wine are 74.8%, 71.5%, and 76.5%, respectively. In conclusion, it is evident that KMA outperforms the other two algorithms in terms of both clustering accuracy and clustering effect when applied to sample data.
Statistical analysis results.
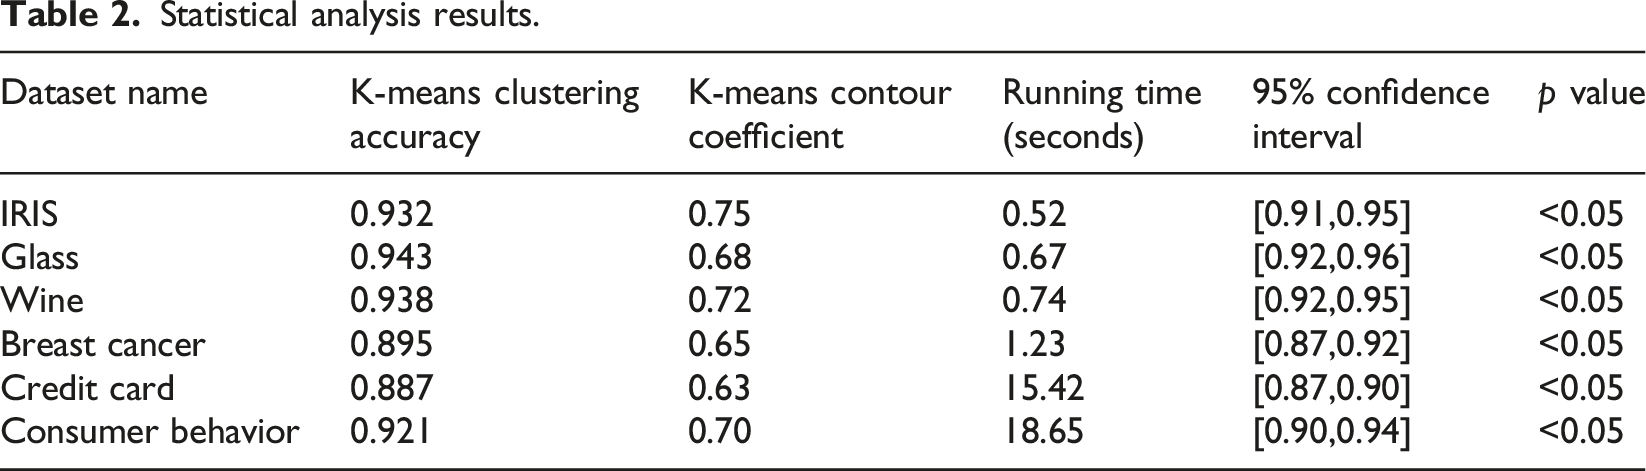
It can be known from Table 2 that, in terms of running time, the K-means clustering algorithm based on the MapReduce framework shows good scalability when dealing with large-scale real data sets such as Credit Card and Consumer Behavior. Through the calculation of the 95% confidence interval, it can be seen that the clustering accuracy of the K-means algorithm has high reliability. The narrow confidence interval indicates that the fluctuation of the result is small. On the Consumer Behavior dataset, although the clustering accuracy of the K-means algorithm is relatively high, compared with the low-dimensional dataset, the accuracy slightly decreases, indicating that when dealing with high-dimensional sparse data, the K-means algorithm may be affected by the feature dimension and data sparsity.
Evaluation of MapReduce-based consumer behavior prediction system
To verify the industry applicability of the consumer behavior analysis system, the research took the new retail industry as the scenario and selected the consumption data of 3200 members of a certain chain supermarket from October to November 2022 for investigation. This dataset includes order records from online apps and payment data from offline stores. Initially, Figure 8 presents the comparison findings between the research system and the two systems based on FCM and DBSCAN for CB. Consumer behavior analysis.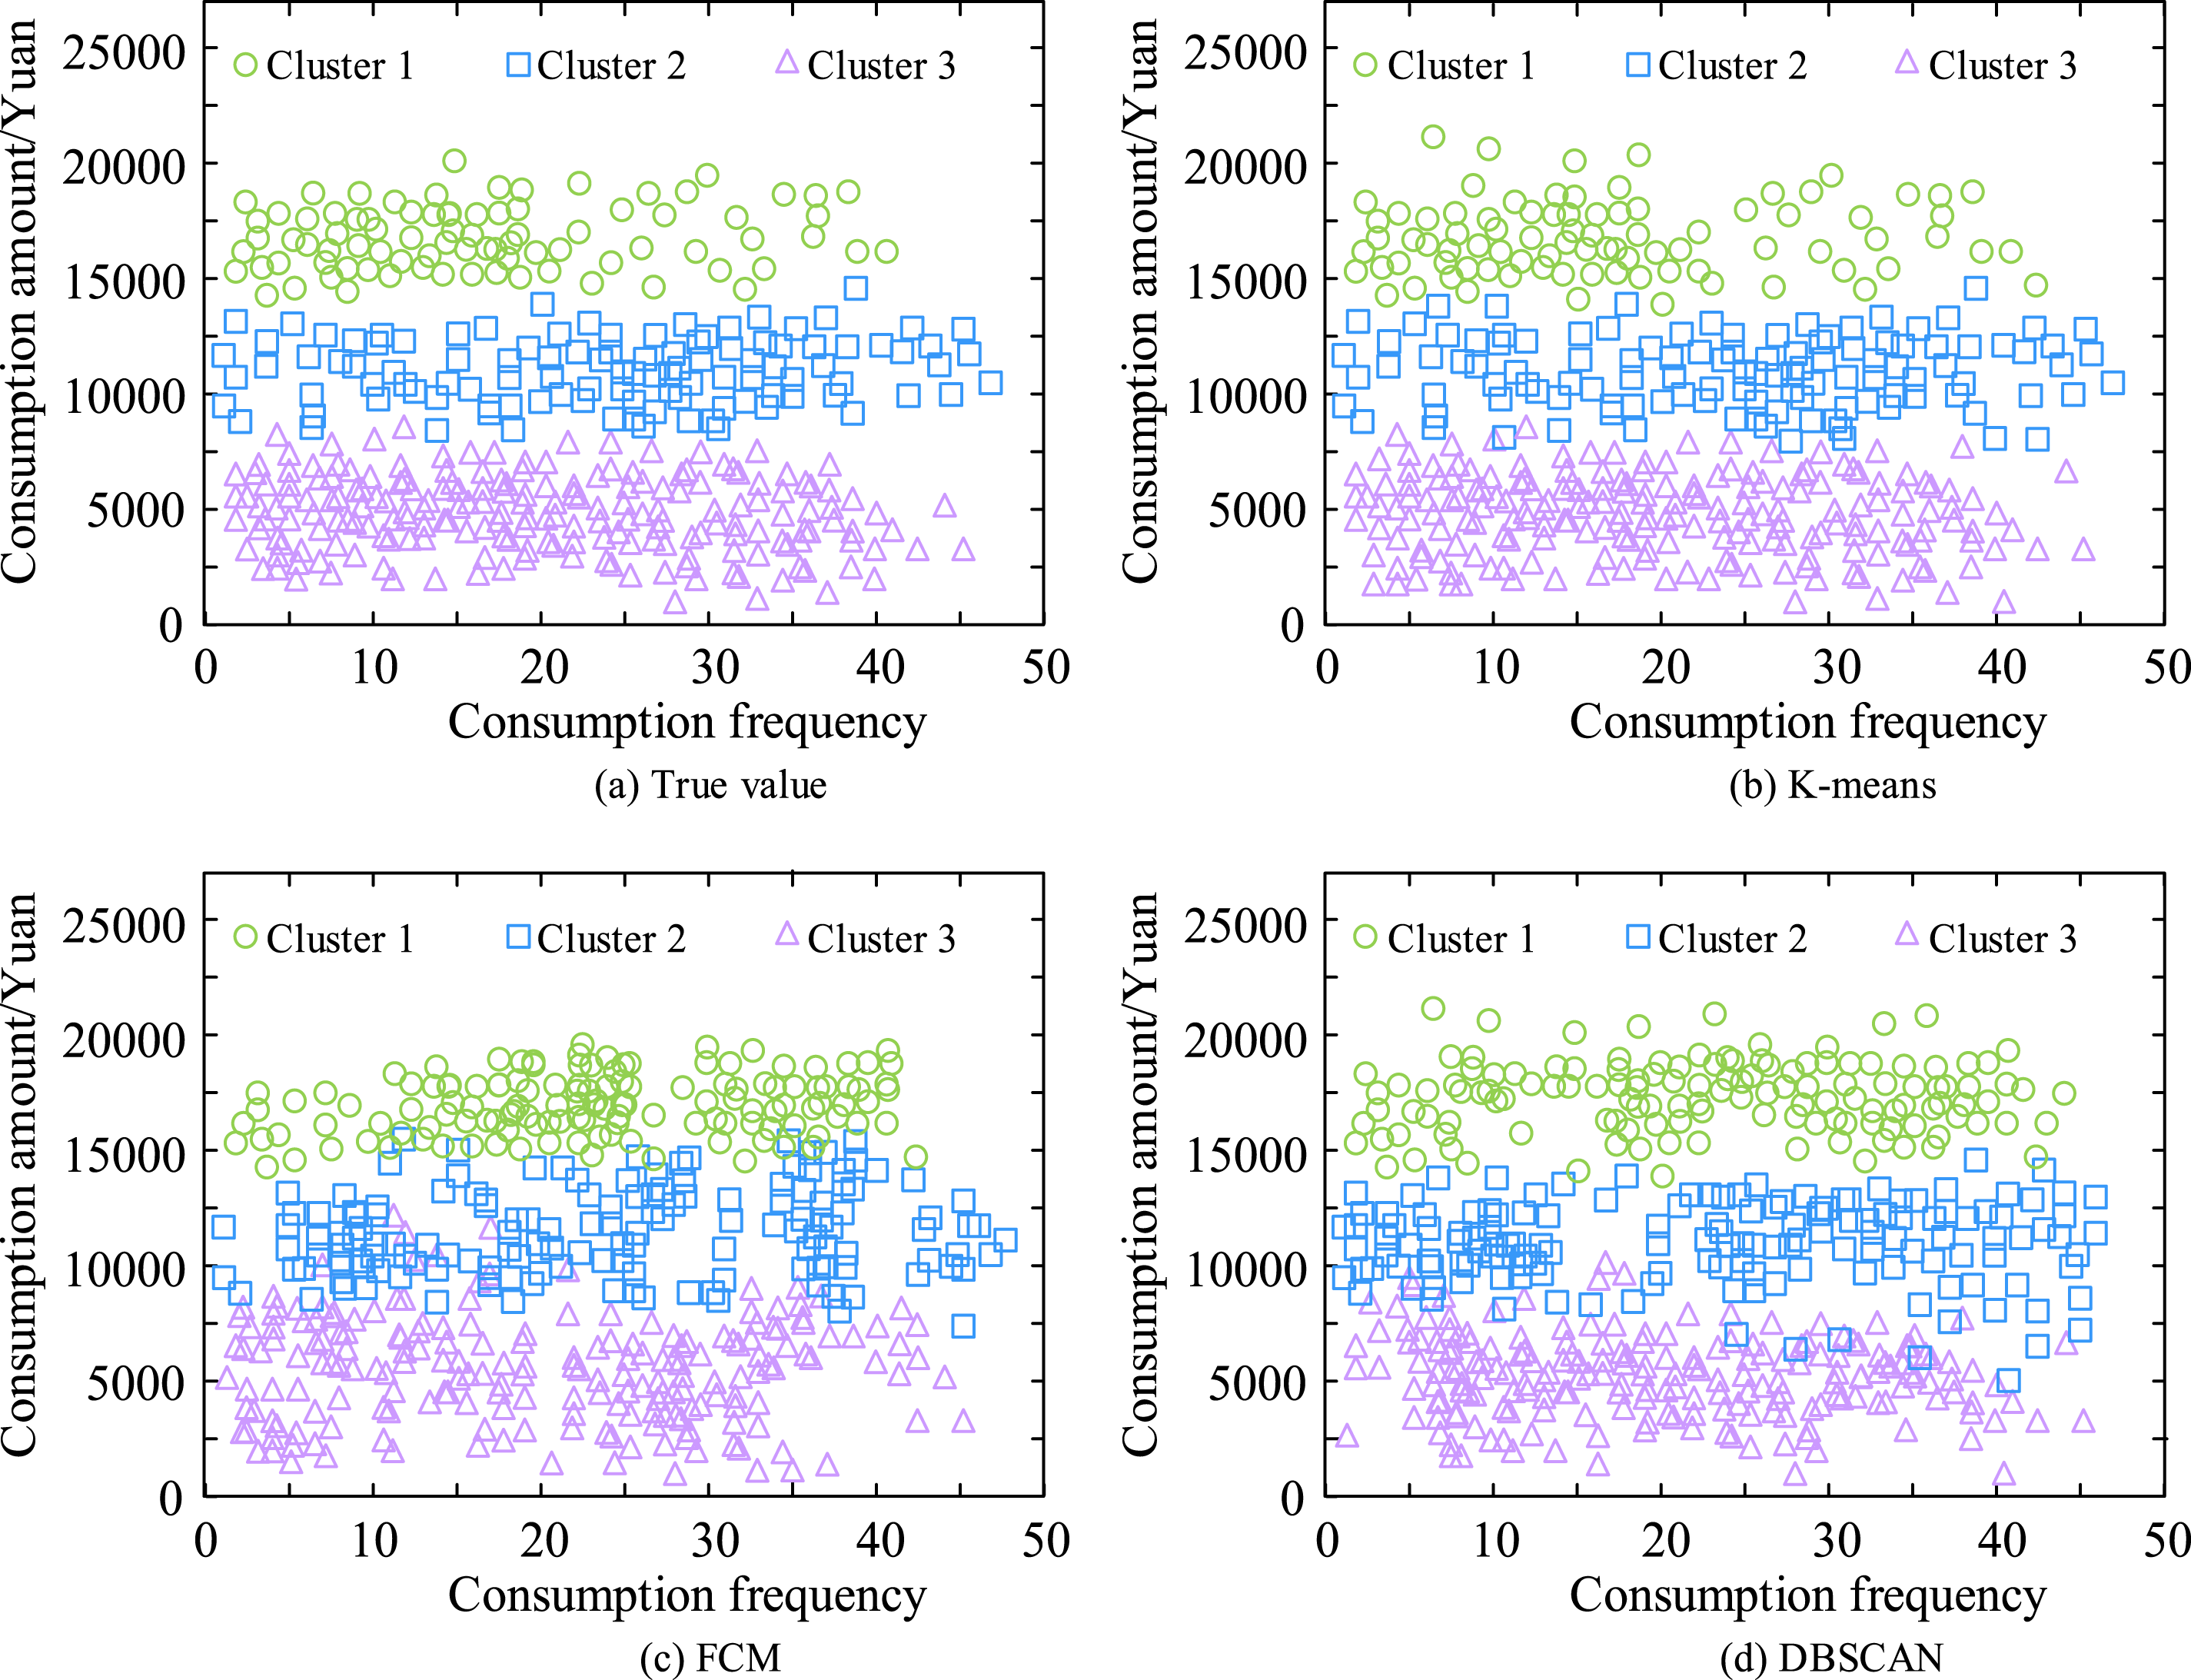
Figure 8(a)–(d) show the real classification of the number of times a consumer spends and the amount of money he spends, the classification based on K-means, and the classification based on FCM and DBSCAN, respectively. In Figure 8(a), the consumers are classified into three clusters based on their consumption behavior during 2 months. Among them, consumers belonging to cluster 1 have their total amount of spending between 15,000 yuan and 20,000 yuan, and the number of spending times is concentrated within 20. Consumers in Cluster 2 spent between $8000 and $15,000. Consumers in Cluster 3 spent less than $5,000, and the number of times they spent was more even. In Figure 8(b), the system based on the KMA basically agrees with the real value for the analysis of CB. Among them, the users of cluster 1 have a 99.7% agreement between their consumption behavior and the real values, which is 24.5% and 26.7% higher than the agreement of the systems based on FCM and DBSCAN, respectively. The agreement between the consumption behaviors and the true values of the users of Cluster 2 and Cluster 3 under the research system is 99.7% and 99.8%, respectively, which is still higher than the other two systems. Next, based on the results of CB analysis, consumers were classified into classes using the research system, and the classification results are shown in Figure 9. Customer classification.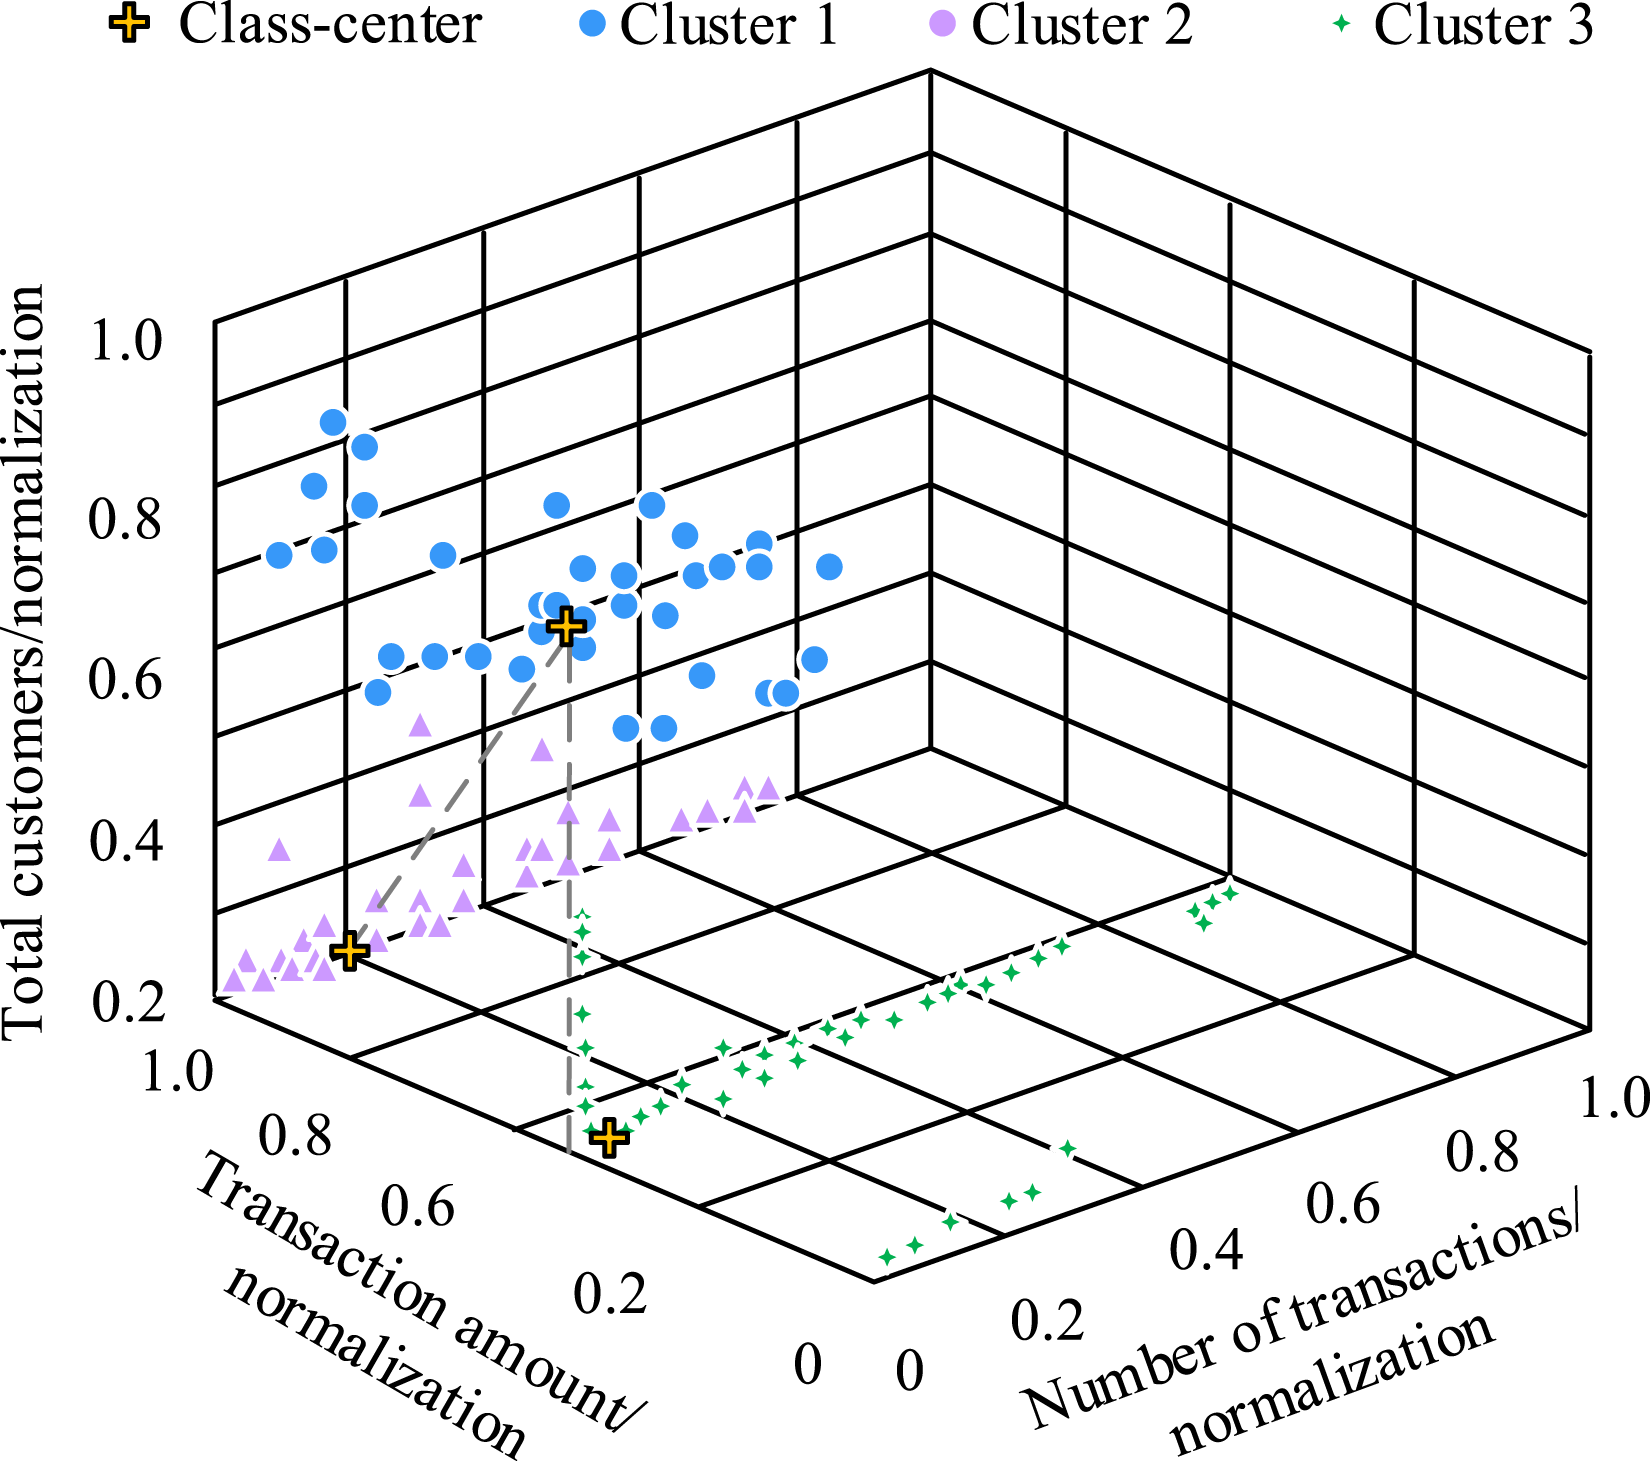
After normalizing the transactions, total transactions and transaction amount of the consumers, the data is clustered and analyzed using MapReduce-based K-means. The results show that finally the consumers are categorized into three classes based on their transaction frequency and transaction amount. Among the consumers in cluster 1, the total transaction amount is in the range of 0.62–0.82, the transaction frequency is between 0.41 and 0.72, and the number of transactions is between 0.72 and 0.94, which shows that the consumers in this cluster belong to the group of moderately active and high consumption. Consumers in Cluster 2 have a transaction frequency that is primarily concentrated in the range of 0.13–0.32, a transaction volume that is primarily concentrated in the range of 0.21–0.28, and a transaction count that is all above 0.90. It is evident that the consumers in cluster 2 are members of the low-consumption and low-activity category. Consumers in Cluster 3 tend to focus their transaction frequency in the range of 0.24–0.54; the number of transactions in the range of 0.55–0.63; and the transaction amount in the range of 0.30 or less. As can be observed, the consumers in cluster 3 are modest consumption and somewhat active. Then according to the number of transactions on the sample data within 2 months of the division of consumer traffic, the division results are shown in Figure 10. Customer traffic division.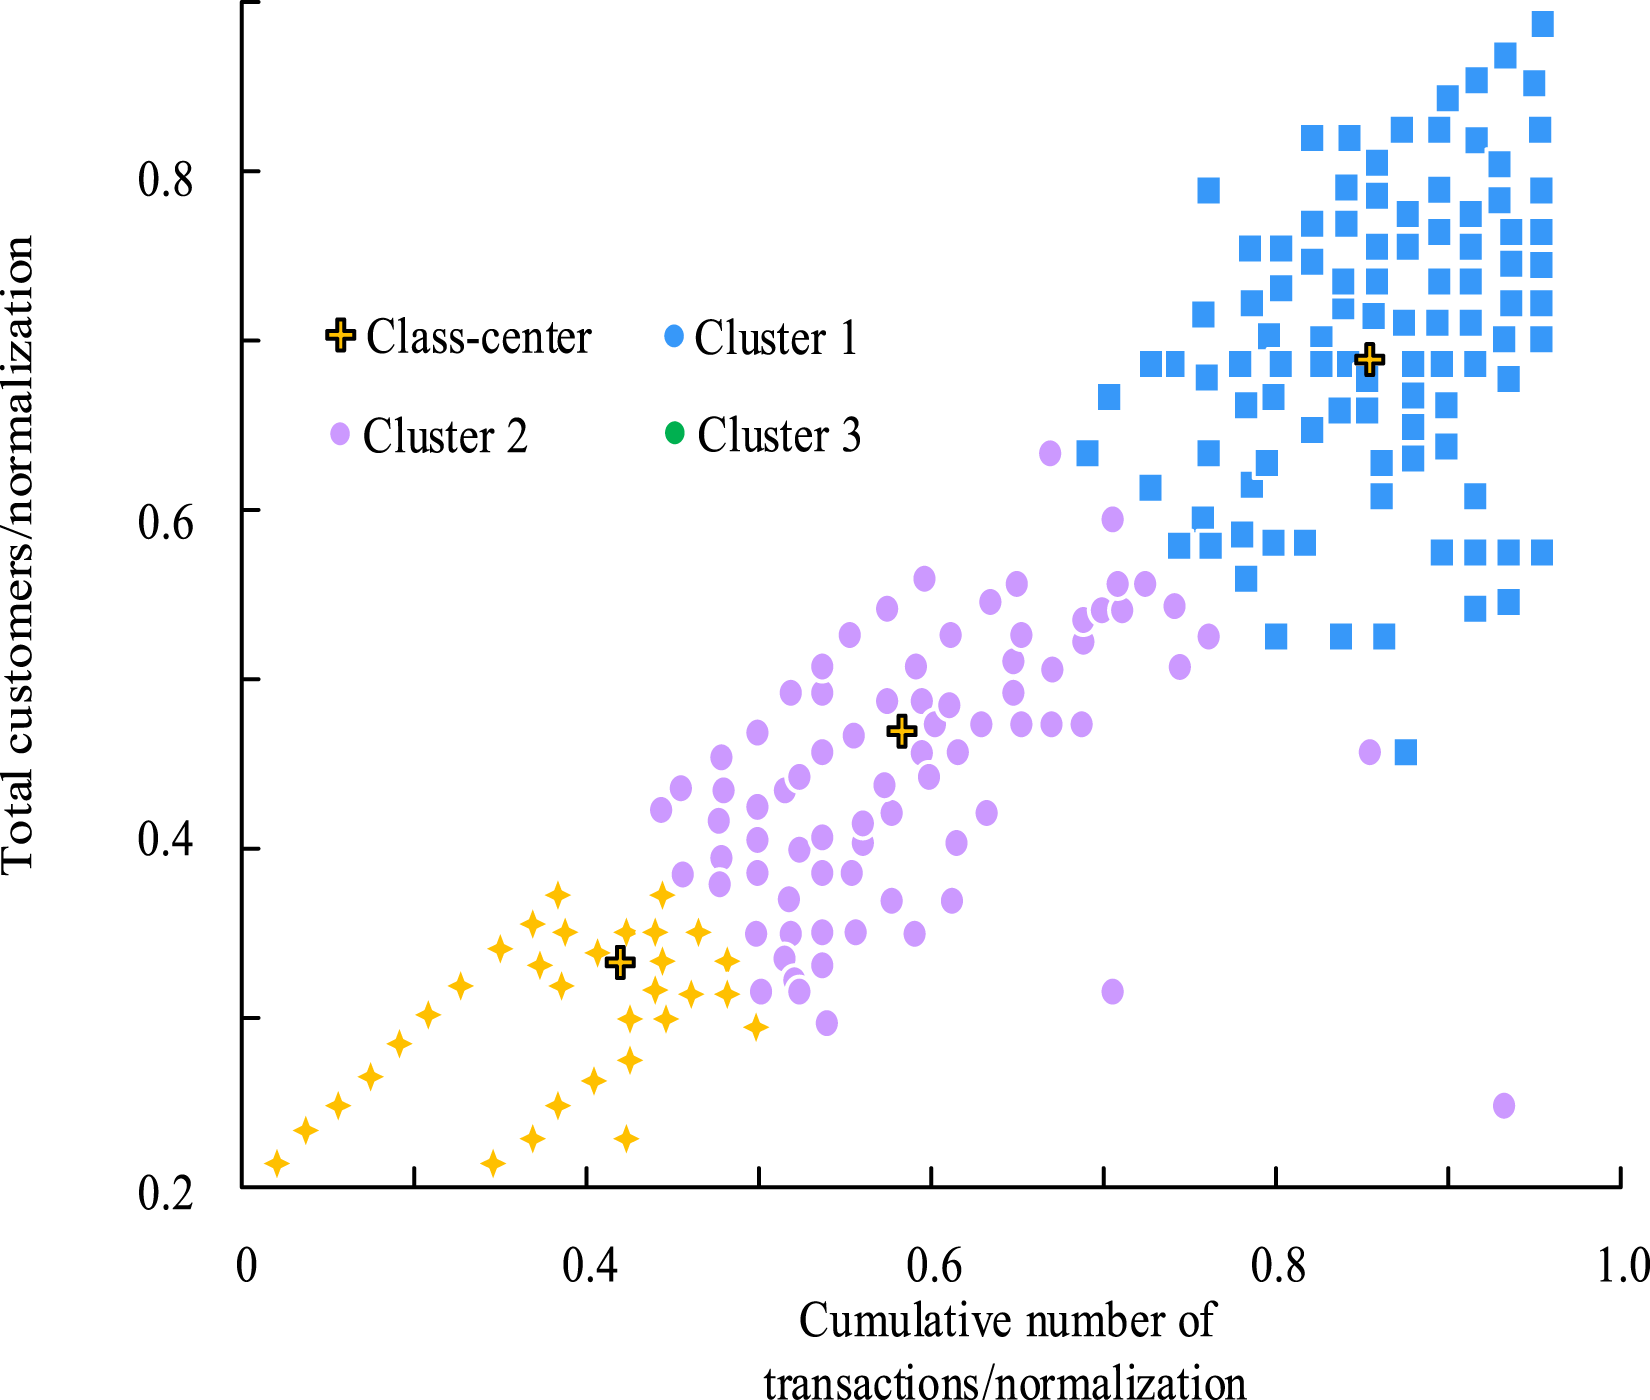
The cumulative number of transactions and the number of consumers within 2 months were also normalized and clustered using the research system, and the results show that the same three clusters of consumer transaction characteristics emerged. Cluster 1 is closest to the top right, with its cumulative number of transactions ranging from 0.69 to 0.94 and the number of consumers concentrated between 0.65 and 0.81. Cluster 2’s cumulative number of transactions and number of consumers are mainly concentrated between 0.36 and 0.57. Cluster 3 is closest to the bottom left and its cumulative number of transactions is mainly concentrated between 0.42 and 0.57 and the number of consumers is mainly concentrated between 0.28 and 0.38. Finally, the clustering efficiency of the system is compared and analyzed. And Figure 11 displays the outcomes. Runtime comparison.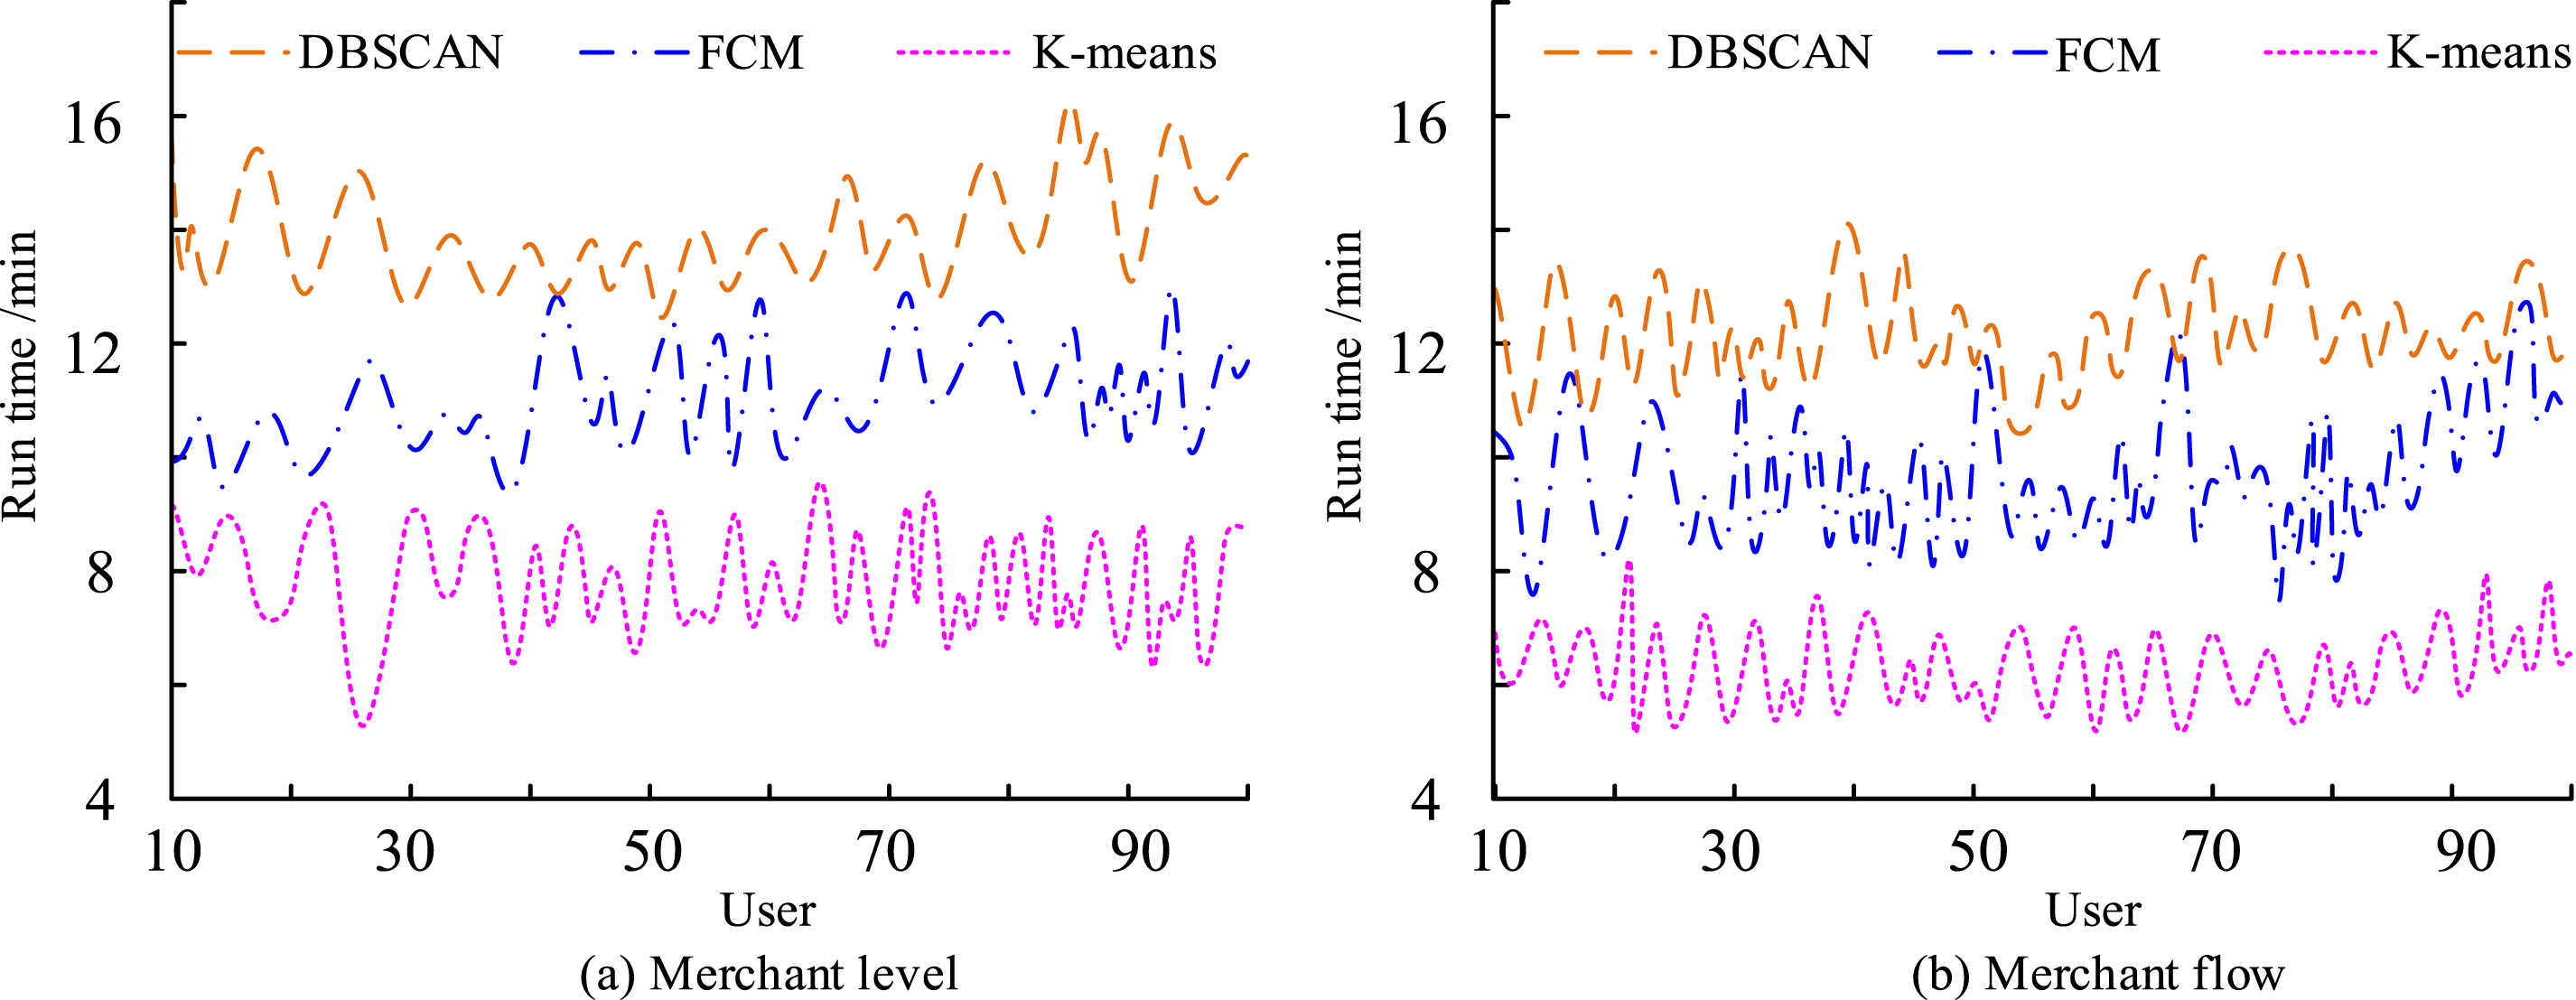
Figure 11(a) and (b) show the comparison of the clustering runtime for consumer class and consumer flow, respectively. In Figure 11(a), the runtime of MapReduce-based KMA is stable between 6 min and 9 min with the increase of the number of consumer samples, while the runtime of MapReduce-based FCM algorithm and DBSCAN algorithm also shows an increasing trend with the number of consumers. And compared to the other two algorithms, the runtime of the research proposed method is lower. This can also be proved in Figure 11(b), where the average running time of the proposed method is 6.54 min, which is 4.22 min and 8.21 min less than that of the MapReduce-based FCM algorithm and DBSCAN algorithm, respectively, for the comparison of the clustering time of the consumer traffic. KMA based on MapReduce can accurately analyze the behavior of consumers and accurately analyze their consumption flow and consumption level based on big data.
Result discussion
Aiming at the inefficiency problem of traditional clustering algorithms when dealing with high-dimensional and large-scale consumer data, a K-means clustering algorithm based on the MapReduce framework is proposed for consumer behavior prediction. This algorithm utilizes the MapReduce framework to decompose large-scale datasets into multiple small tasks and allocate them to different computing nodes for parallel processing, thereby significantly reducing computing time and resource consumption. The K-means clustering algorithm achieves efficient classification of consumer behavior data by minimizing intra-cluster differences and maximizing inter-cluster differences. The research will be discussed from four dimensions: algorithm performance, comparative advantages, shortcomings and future improvements.
The experimental results show that on the IRIS, Glass and Wine datasets, the Mahalanobis Distances of K-means is 1.32–1.45, which is significantly lower than that of FCM and DBSCAN, indicating that its clustering results have better compactness and separability. On the IRIS dataset, the average clustering accuracy of K-means is 93.2%, while the average clustering accuracies of FCM and DBSCAN are 68.9% and 74.8%, respectively. The K-means clustering algorithm can effectively achieve efficient classification of data by minimizing intra-cluster differences and maximizing inter-cluster differences.
Compared with traditional clustering methods, the K-means clustering algorithm achieves a breakthrough in computational efficiency through the MapReduce framework. When dealing with the task of consumer grade classification, the running time of the algorithm is stable at 6–9 minutes, which is 4.22 minutes and 8.21 minutes lower than that of FCM and DBSCAN, respectively. Distributed computing distributes the computational complexity of O (tkn) among multiple nodes, enabling the processing time of 284,807 credit card transactions to be controlled within 15.42 seconds. By replacing the Euclidean distance with the Mahalanobis Distances, the problem of “dimensionality disaster” in high-dimensional data has been effectively alleviated. The parallel particle swarm optimization algorithm of Shang et al. And the multi-threaded PSO-K-Means of Wang both utilize MapReduce to improve efficiency, but do not involve the improvement of distance measurement for high-dimensional data. The Catla project of Chen’s team offers automated tuning, but the research results focus more on algorithm-level improvements. The research integrates algorithm optimization of Mahalanobis Distances in the distributed computing framework, while the literature focuses on the performance tuning of the framework itself.
Although the research algorithm performed well on the experimental dataset, the following limitations still exist. First, there is the limitation of data adaptability. The experimental data set is mainly based on structured consumption records. The processing ability for unstructured data, such as user comments and social media feedback, is insufficient. The generalization ability in complex consumption scenarios needs to be verified. Second, the feature dimension is single. The model does not fully consider external variables such as regional differences and socio-economic backgrounds of consumers, which may lead to deviations in the clustering results. Finally, there is insufficient coverage of dynamic scenes. The research algorithm relies on historical data for static clustering, making it difficult to capture the dynamic changes of consumer behavior in real time.
To deepen the practicality and security of the research results, future research can be carried out from three dimensions: data security, feature dimension expansion and real-time performance optimization. At the data security level, it is proposed to introduce cutting-edge technologies such as homomorphic encryption and federated learning to build a multi-level privacy protection system, ensuring the confidentiality and integrity of consumer data throughout its entire life cycle, including collection, transmission, and analysis. In terms of feature dimension expansion, it is planned to integrate multi-source heterogeneous data and construct high-dimensional consumer portraits through knowledge graph technology. Combining transfer learning with multimodal fusion algorithms, the potential correlations among cross-dimensional data are explored to enhance the depth and comprehensiveness of consumer behavior analysis. Aiming at the bottleneck of the real-time performance of the algorithm, streaming computing frameworks such as Apache Flink can be introduced to reconstruct the data analysis process, achieving real-time intake, processing and feedback of data.
Conclusion
In response to the inability of previous DMAs to analyze data while focusing on data privacy protection, the study optimizes traditional data mining techniques on the basis of MapReduce and effectively analyzes and clusters CB data by introducing the KMA. After the experimental analysis, the results revealed that K-means has a better clustering effect in the three datasets of IRIS, Glass, and Wine with Mahalanobis distances of 1.32, 1.24, and 1.45, respectively. Compared with the research algorithm, the average clustering accuracy of FCM algorithm in the three datasets of IRIS, Glass, and Wine was 24.3%, 22.8%, and 25.2% lower, respectively. The system based on the KMA basically agreed with the real value of the consumer’s behavior analysis, in which the users of cluster 1 had a 99.7% agreement between their consumption behavior and the real value, which was 24.5% and 26.7% higher than the agreement of the system based on the FCM and DBSCAN, respectively. Consumers in Cluster 1 had total transaction amounts in the range of 0.62–0.82, transaction frequencies in the range of 0.41–0.72, and number of transactions in the range of 0.72–0.94, which shows that the consumers in this cluster belong to the group of moderately active and high consumption. To sum up, the algorithm optimization scheme based on MapReduce and K-means proposed in the research, through the deep integration of distributed computing and privacy protection mechanisms, not only effectively breaks through the performance bottleneck of traditional algorithms, but also builds a data security protection barrier, achieving a dual improvement in the efficiency and privacy protection of consumer behavior analysis. The shortcoming of this study is that the regional differences in consumers were not analyzed, which can be followed up by analyzing the differences in CB in different regions based on the address.
Footnotes
Funding
The author(s) disclosed receipt of the following financial support for the research, authorship, and/or publication of this article: The research is supported by Hubei Provincial Education Science Planning Project, Research on Generative Teaching Design Based on OBE Concept and Cognitive Load Theory (No. 2021GB074); The Ministry of Education’s Collaborative Education Project between Industry and Education, and the Excellent Teacher Program for the Integration of Mathematics and Reality in Electrical and Electronic Experiments, Project Number 231106395290408.
Declaration of conflicting interests
The author(s) declared no potential conflicts of interest with respect to the research, authorship, and/or publication of this article.