




Abstract
With smart cities’ rapid development, Internet of Things (IoT) technology applications have become widespread. However, significant data gaps in smart city IoT systems often lead to inaccurate analytics and decision-making. This study proposes a novel imputation model using an improved Mahalanobis distance algorithm. The research first examines this improved algorithm, and then analyzes its performance in filling smart city IoT missing data. Results show that at a 10% missing rate, the proposed model achieves the lowest misjudgment rate (0.45), outperforming ARBI (0.90) and RFI (0.95) models. It also demonstrates the lowest error rate at 5% (0.32) and maintains superior performance at 30% missing data (error rate: 0.48). Compared to similar models, this approach shows highest accuracy in missing data imputation, proving its effectiveness and reliability for smart city IoT applications.
Introduction
In recent years, with the rapid development of Internet of Things (IoT) technology, the construction of smart cities has become one of the focuses of many urban developments.1,2 Through the use of IoT devices and sensors, smart cities are able to collect and transmit huge amounts of data in real time to provide smarter and more efficient city management and services.3,4 However, due to various reasons, including equipment failure, communication interruption and data loss, IoT still has some missing problems in data collection.5,6 In the context of IoT data, Mahalanobis Distance (MD) comes into being, which is a statistical distance based on data covariance matrix to measure the similarity between data points.7,8 The statistical properties and assumptions of MD are extremely important in the context of IoT data. IoT data is often characterized by high dimensionality, multivariable and complex correlation, and MD can better capture these complex correlations by considering the covariance matrix of the data set, thus improving the accuracy of data filling. In IoT data, the hypothesis may not always be completely valid, because the actual data may be affected by a variety of factors and show different distribution characteristics, while the hypothesis of MD is that the data follows a multivariate normal distribution, which makes MD still has high practicability and effectiveness in data filling. Therefore, the research aims to improve the filling algorithm of missing data in smart city IoT to improve the accuracy and reliability of data filling. Specifically, the research proposes a filling algorithm for missing data by combining the traditional K-nearest neighbor algorithm and MD measurement. In the algorithm design, the research fully considers the characteristics of space and time, and introduces the sliding time window algorithm to capture the dynamic pattern of data in the time series and spatial distribution, so as to accurately predict and fill the missing data in the smart city IoT, so as to ensure the integrity and reliability of data. The results of this study will contribute to the data analysis and decision support of smart cities, and improve the management and service level of smart cities.
The research is mainly divided into five sections. The first section is literature review, analyzing the advanced research results. The second section is the construction of the data filling model of the IoT based on the improved Markov distance k-nearest neighbor algorithm. The third section is the analysis of the results of filling and improving model for the missing data of smart city IoT. The fourth section is the research conclusion, through in-depth analysis of I-NMKNN and other models ARBI and RFI, to highlight the characteristics and application effects of the research model. The fifth section summarizes the research results, clearly points out the optimization effect of the improved model in data filling, and looks forward to its future optimization direction.
Related works
In the construction of smart cities, the IoT technology plays an important role, through the connection of various devices and sensors, for city management and services to provide a large number of real-time data. Numerous experts and scholars are conducting research in the field of missing data in smart city IoT. To solve the response problem of the semi-parametric model with uncertain missing mechanism and the exponential family model with response conditional density, Chen and Diao proposed a “comprehensive” density method based on the linear “carrier” density, and conducted empirical analysis on the method. The experimental results showed that when the data missing rate of this research method reached 10%, Missing values could still be accurately predicted and filled, and the prediction error rate was only 2.5%. 9 To solve the problem of missing data in process tracking, An et al. proposed an indirect test system based on causal mechanism, and conducted an empirical analysis on the system. The experimental results showed that the non-context data generated by the research system on micro-basis provided a credible window for the study of the difficult mechanism, with strong adaptability. 10 Tang and Ju innovated an optimized Akaike Information Criterion (AIC) and punishment method to address the challenges of missing data in economics, sociology, and biomedicine. Through empirical analysis, the efficiency and stability of this method in dealing with data missing were successfully verified, thus enhancing the research depth and application breadth in these fields. 11 To solve the problem of missing data in data analysis, Abiri et al. proposed a combination algorithm based on binary, classification and continuous attributes, which randomly damaged the complete data to different degrees, and then compared the estimated value with the original value. The experimental results showed that the developed autoencoder obtained the smallest error in all the initial data damage ranges. The highest accuracy was 95%. 12 Aiming at the pain point of abnormal data caused by the vulnerability of IoT devices to attacks, Arafah M et al. proposed a synthetic attack detection model based on denoising autoencoders and Wasserstein generative adversarial networks. Experimental results showed that this model could accurately identify abnormal data in the network intrusion detection scenario. 13
Contents of relevant research works.
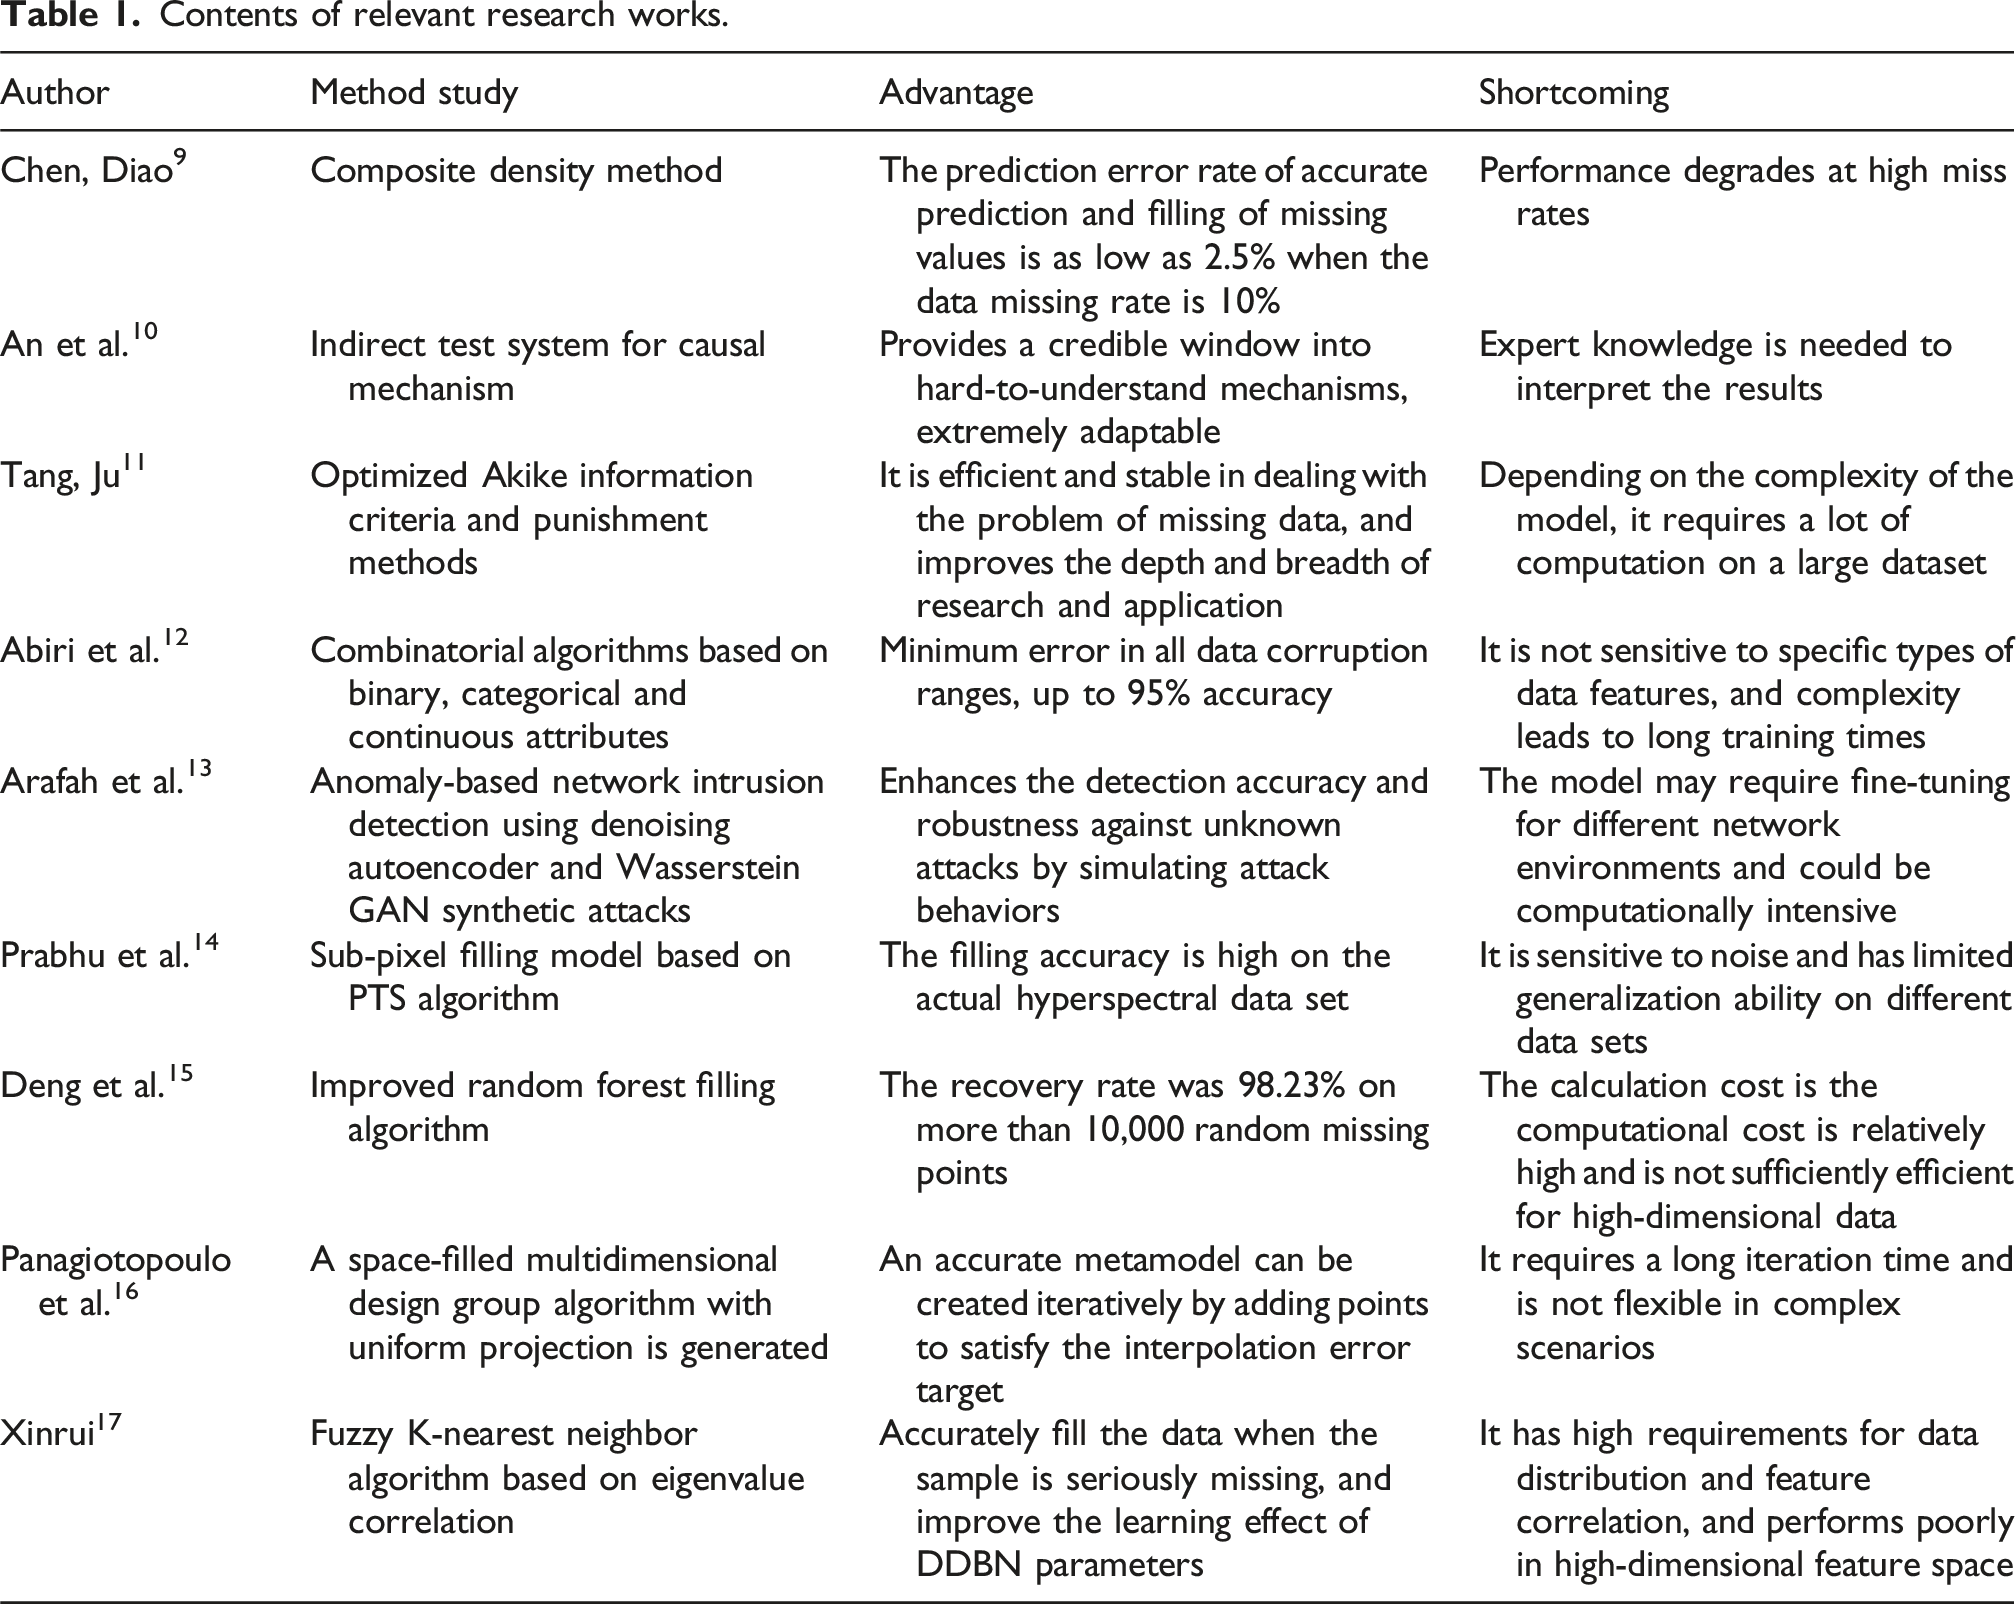
To sum up, at present, many domestic and foreign scholars have carried out relatively rich research and analysis in the field of missing data of smart city IoT. However, these studies often lead to inaccurate filling results because they ignore the intrinsic correlation and distribution characteristics of the data. The proposed algorithm comprehensively considers the spatio-temporal characteristics of data and introduces the sliding time window algorithm, which can more accurately capture the patterns of data in time series and spatial distribution, thus improving the accuracy of data filling. Therefore, the research breaks through the limitations of the previous qualitative research and has strong potential application value.
Construction of IoT data imputation model based on I-NMKNN
MD means the data covariance distance. The concept is put forward by Indian statistician Mahalanobis. This study proposes an improved algorithm named the Improved New Mahalanobis Distance K-Nearest Neighbor (I-NMKNN). Firstly, the similarity between data points is calculated based on the improved MD, and k neighbor points that are most similar to the target data points are selected. Then, the weighted average or interpolation is performed based on the values of these neighbor points and their weights to obtain the filling values of the target data points. Finally, through the process of iteration and optimization, the filling value and parameter settings are constantly adjusted to achieve the best filling effect.
A filling algorithm based on I-NMKNN
Univariate missing pattern and multivariate missing pattern table.
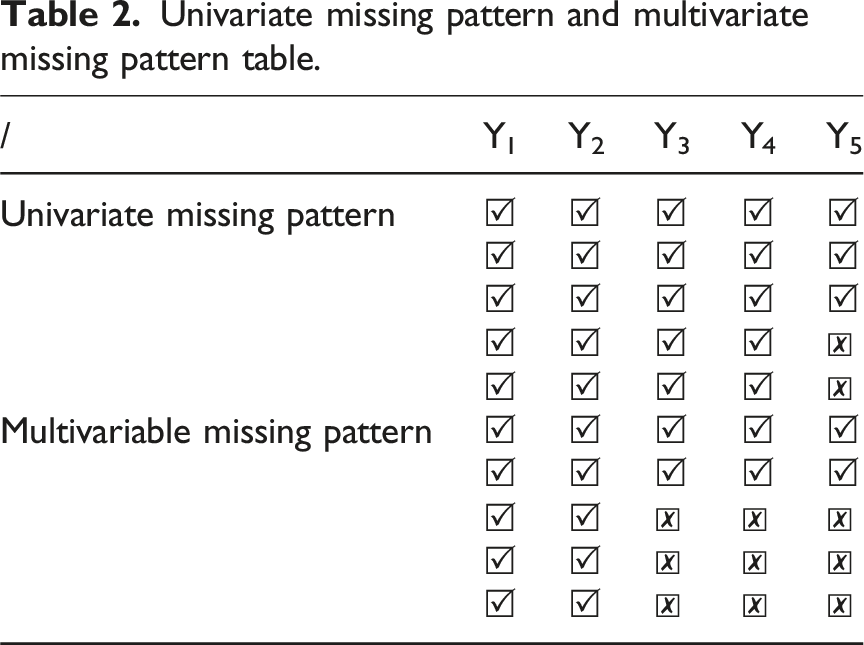
From Table 2, univariate missing pattern refers to the presence of missing values in only one variable in all data or the studied dataset, while the data of other variables or attribute dimensions are complete.
19
When dealing with completely random missing data, simple imputation like mean imputation or mode imputation has the capability to be utilized to accomplish the missing values filling.
20
The expression for completely random missing is shown in equation (1). MD point plot.
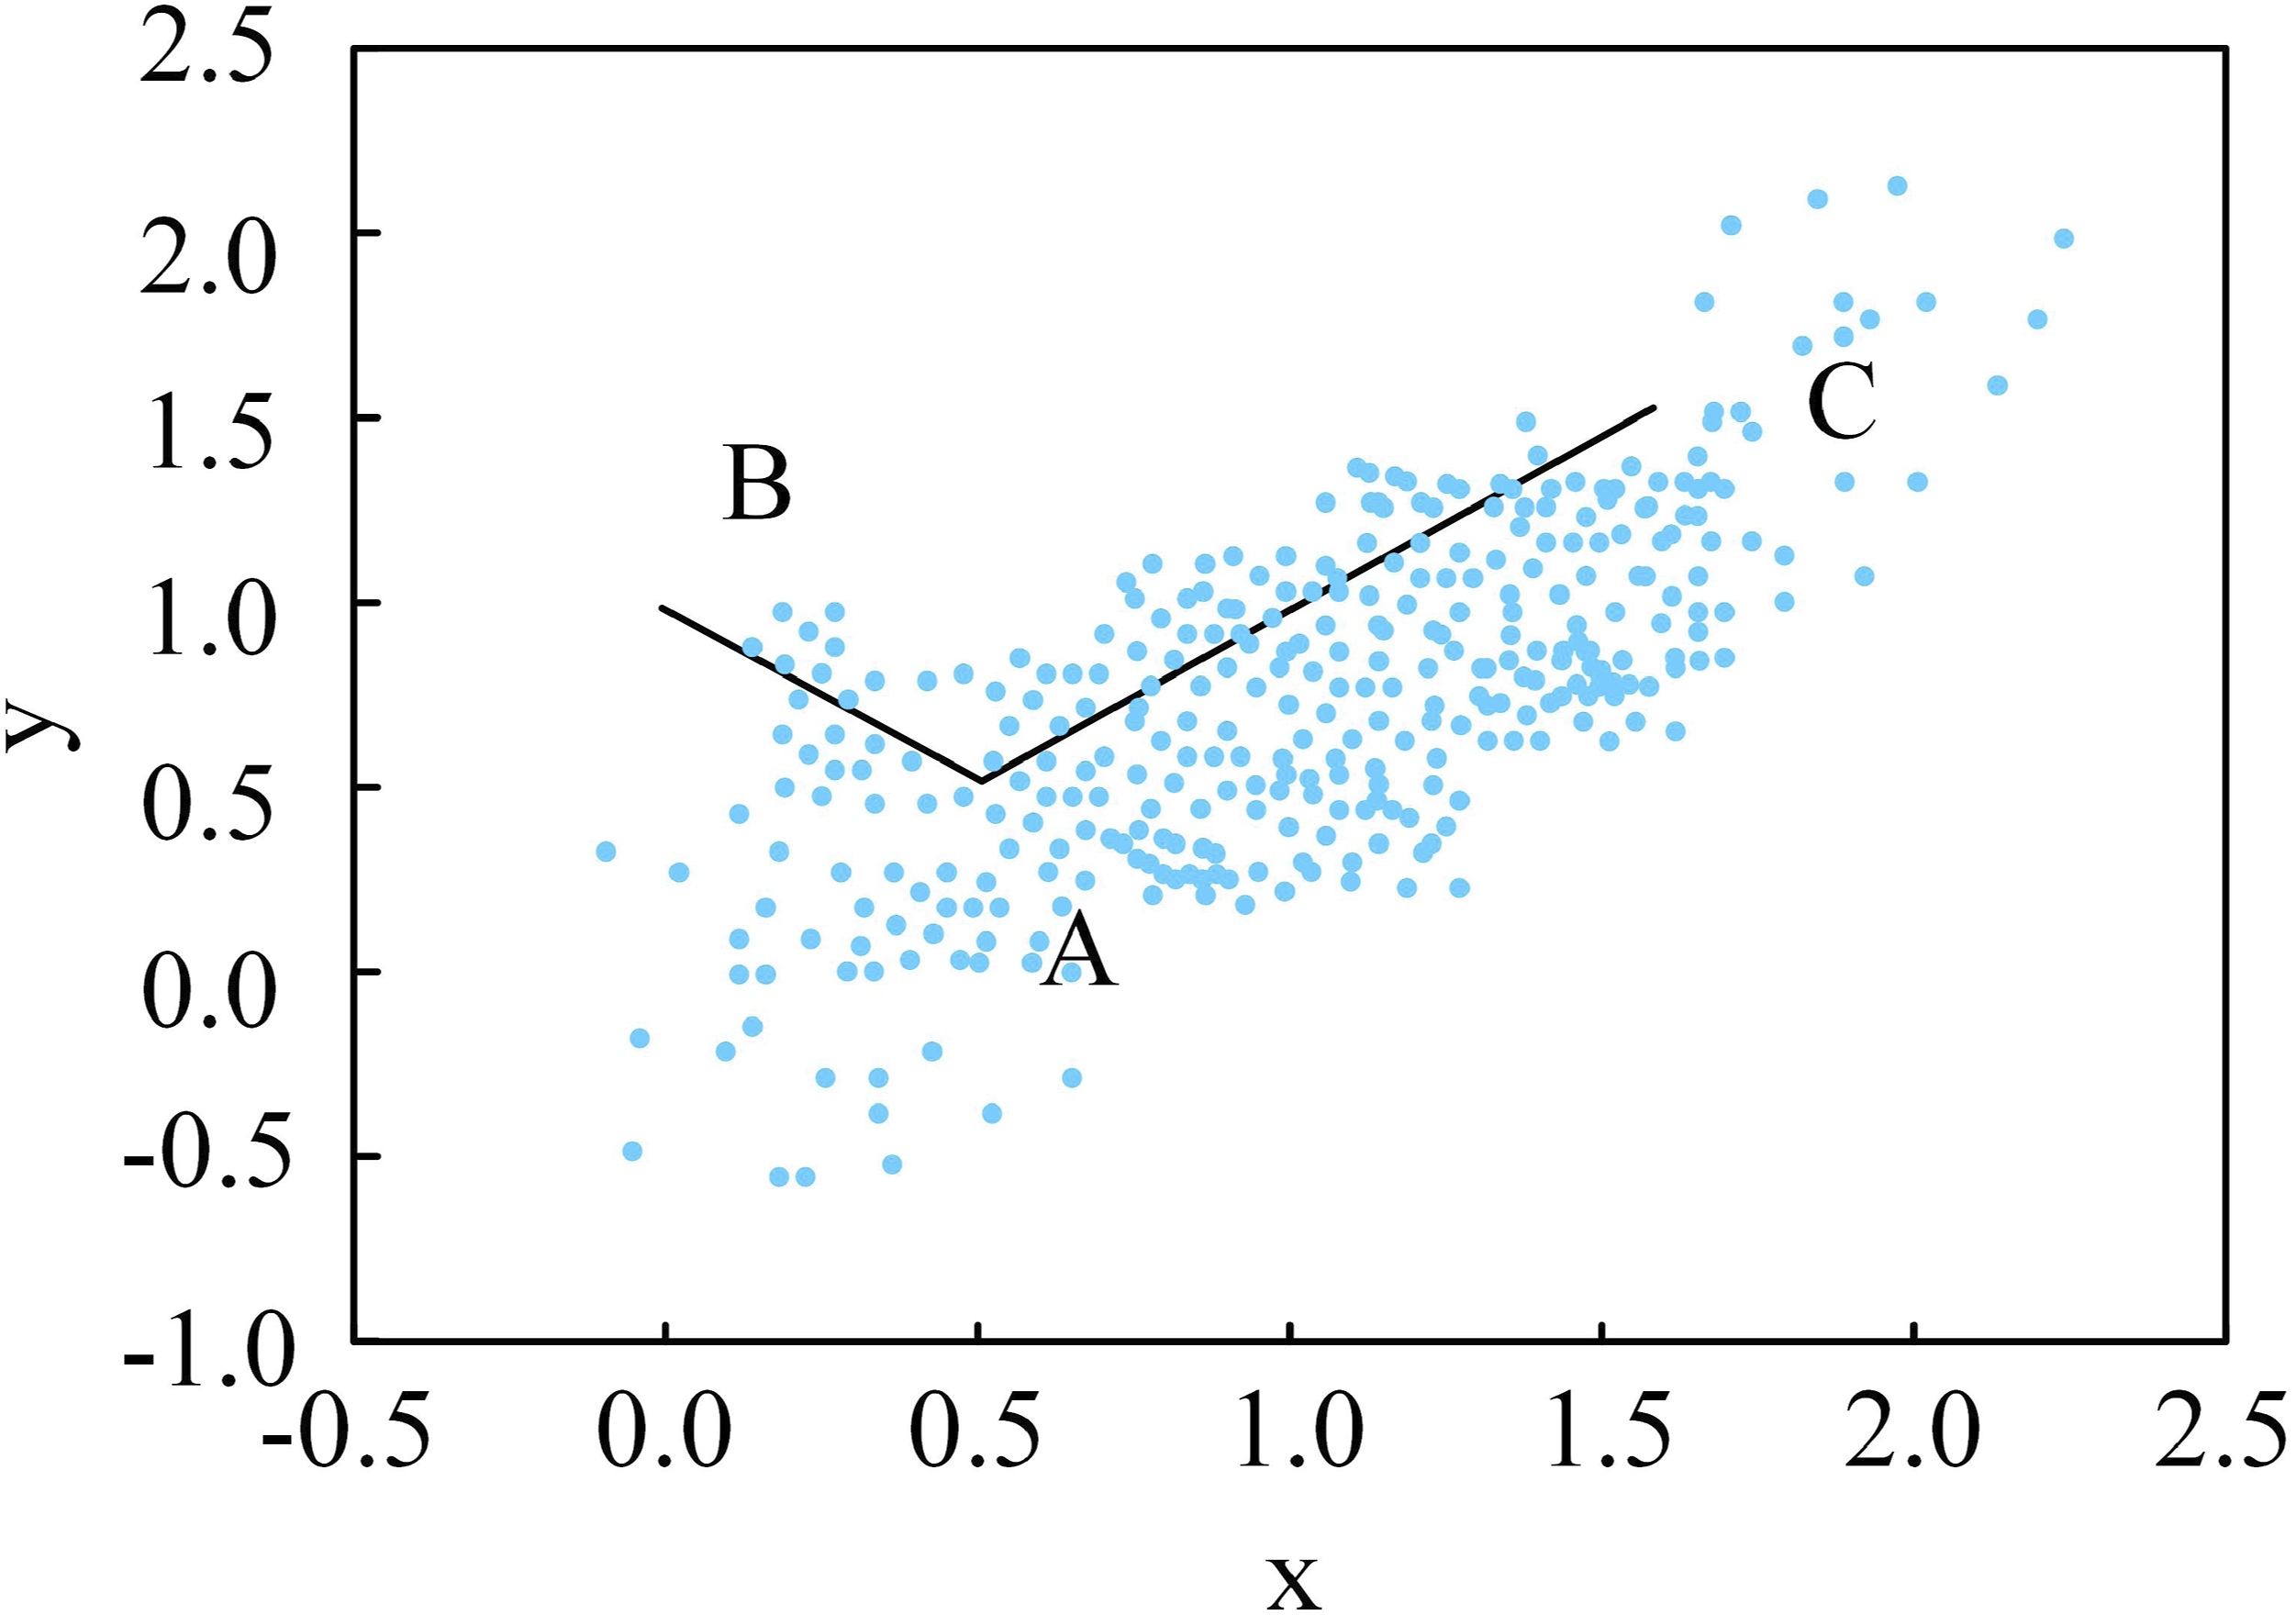
From Figure 1, under the measurement of Euclidean distance, the length of line segment AC is greater than the length of line segment AB. This is because points A and C belong to the same category, while point B is an outlier in that category. According to the distance rule within the category, the distance from B to A should be longer than the distance from C to A. From Figure 1, the coordinates of A are (0.5, 0.5), B is (0, 1), and C is (1.5, 1.5). The covariance of AC and AB is given in equation (2).





The weighted coefficient of the MD refers to assigning different weights to different dimensions or features when calculating the MD. These weights can be determined based on specific application scenarios and requirements to adjust the importance of different dimensions in calculating the MD. The formula for calculating the weighted coefficient of the MD is given in equation (8).
The flowchart of the NMKNN filling algorithm is shown in Figure 2. NMKNN filling algorithm flow chart.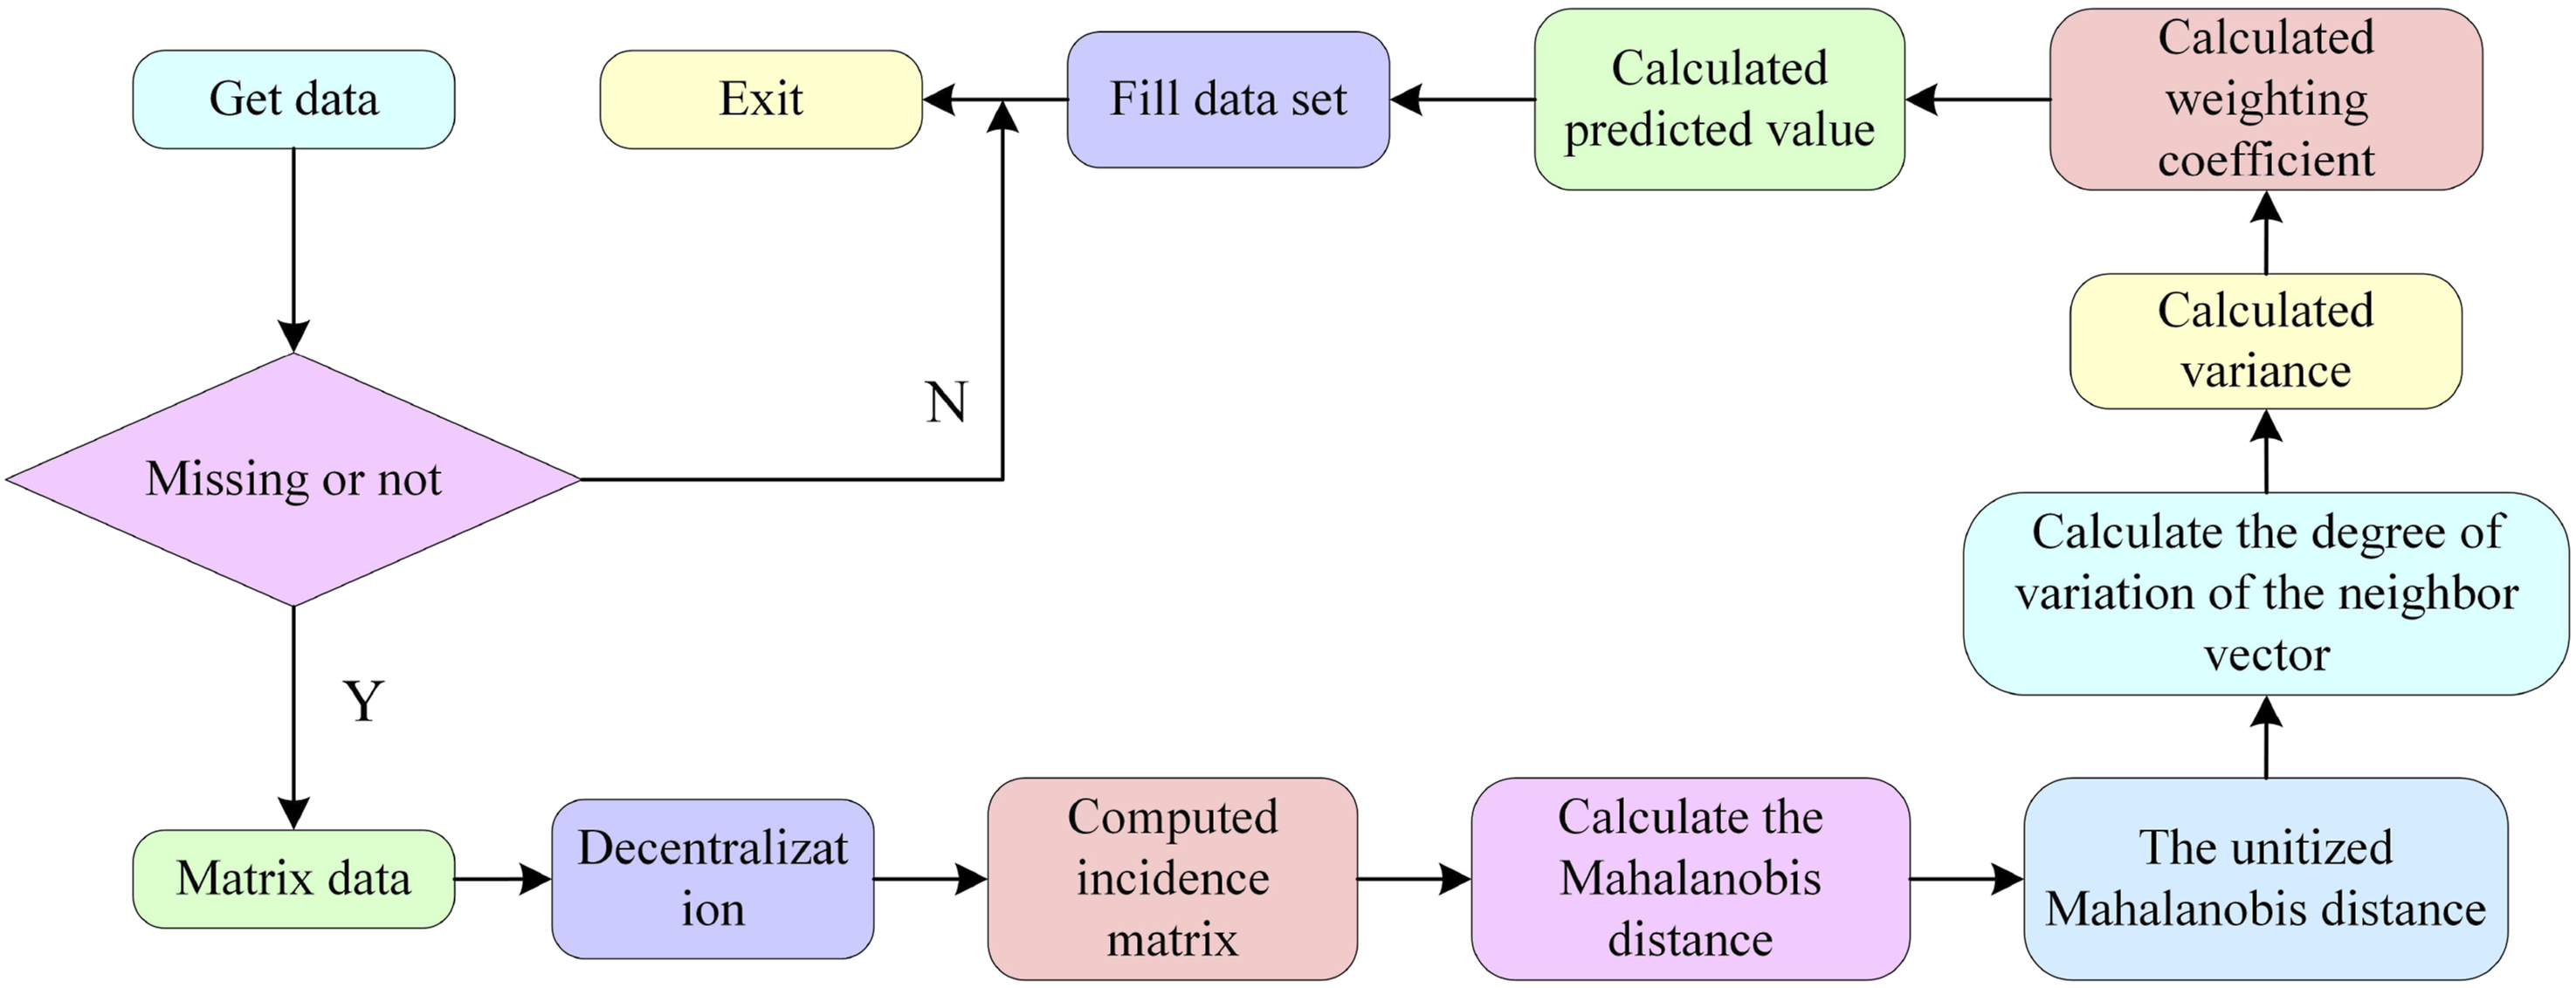
According to Figure 2, firstly, it is necessary to acquire data and check for the presence of missing values. Secondly, the study involves matrix representation the data and performing data centering. Next, the correlation matrix is computed, followed by the calculation of MD. Subsequently, the dissimilarity is calculated based on existing data and model predictions. Finally, completing this process provides a systematic approach from data acquisition to computing predictions and filling the dataset. This procedure enhances the understanding and handling of crucial features in the data, such as missing values, correlation, and dispersion.
Parallelization of IoT data imputation model based on sliding time window algorithm
The sliding time window algorithm is employed for processing time series data. Its fundamental concept involves statistically analyzing data within a fixed time window, sliding forward as time progresses, and performing analysis on new data.
21
In this research, the sliding time window algorithm is integrated into the NMKNN algorithm to enhance its efficiency and performance. The study calculates weights, for instances, of the sliding time window, assuming an instance Cluster structure.




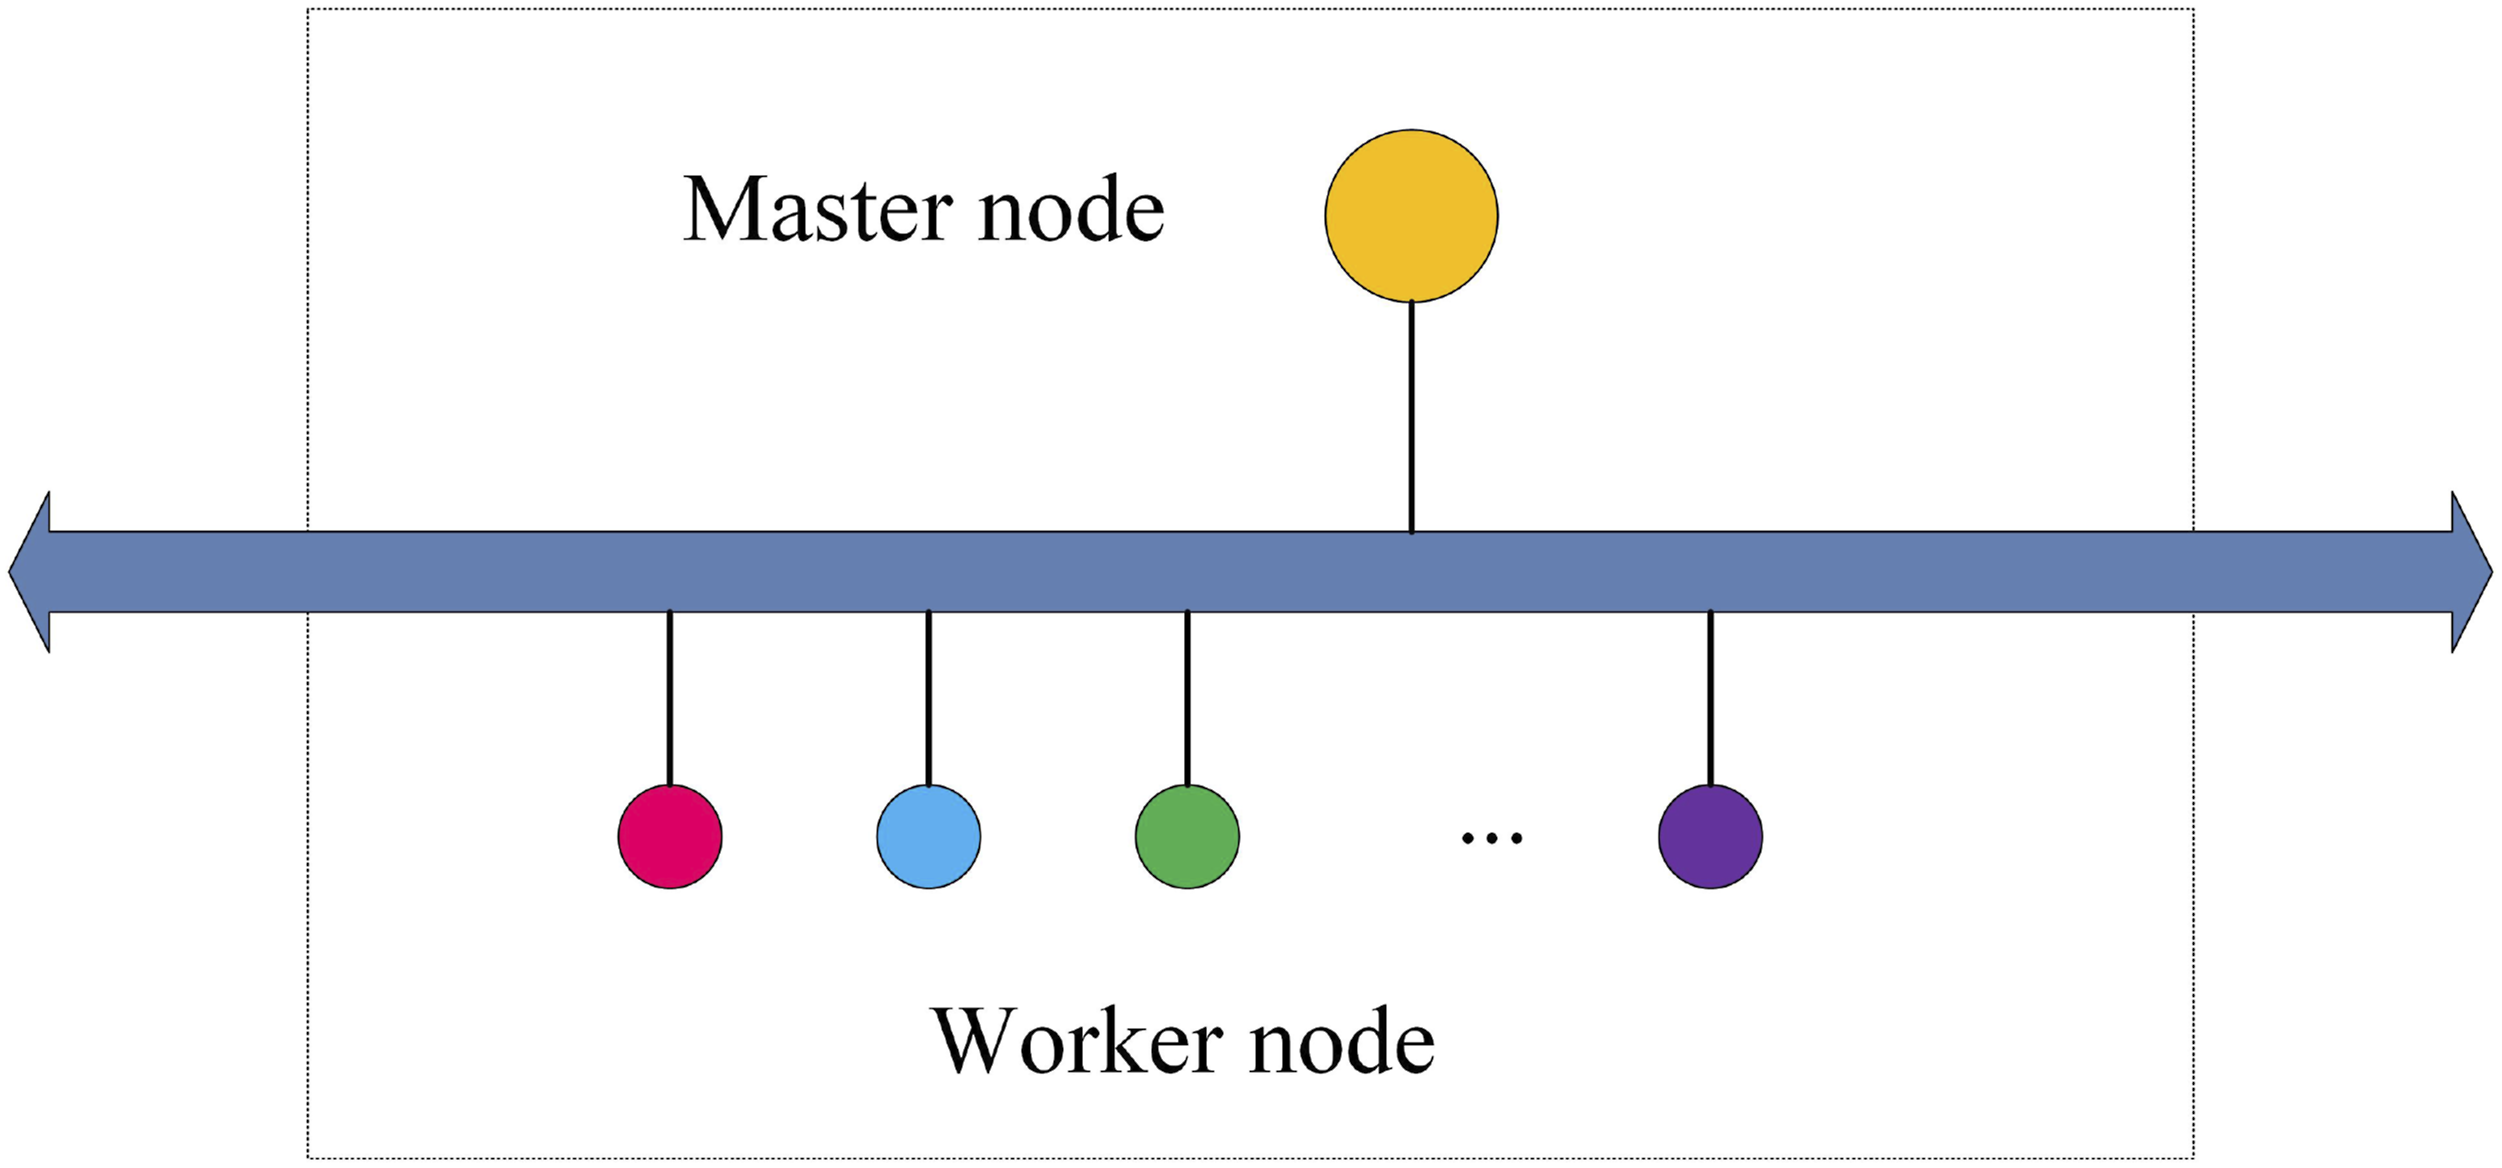
From Figure 3, a cluster consists of multiple computer nodes connected through a network, forming a collaborative working system. Additionally, communication occurs between nodes in the cluster, employing technologies and strategies such as load balancing, resource sharing, high availability, and fault tolerance. The operational principle of a cluster is illustrated in Figure 4. Working principle of the cluster.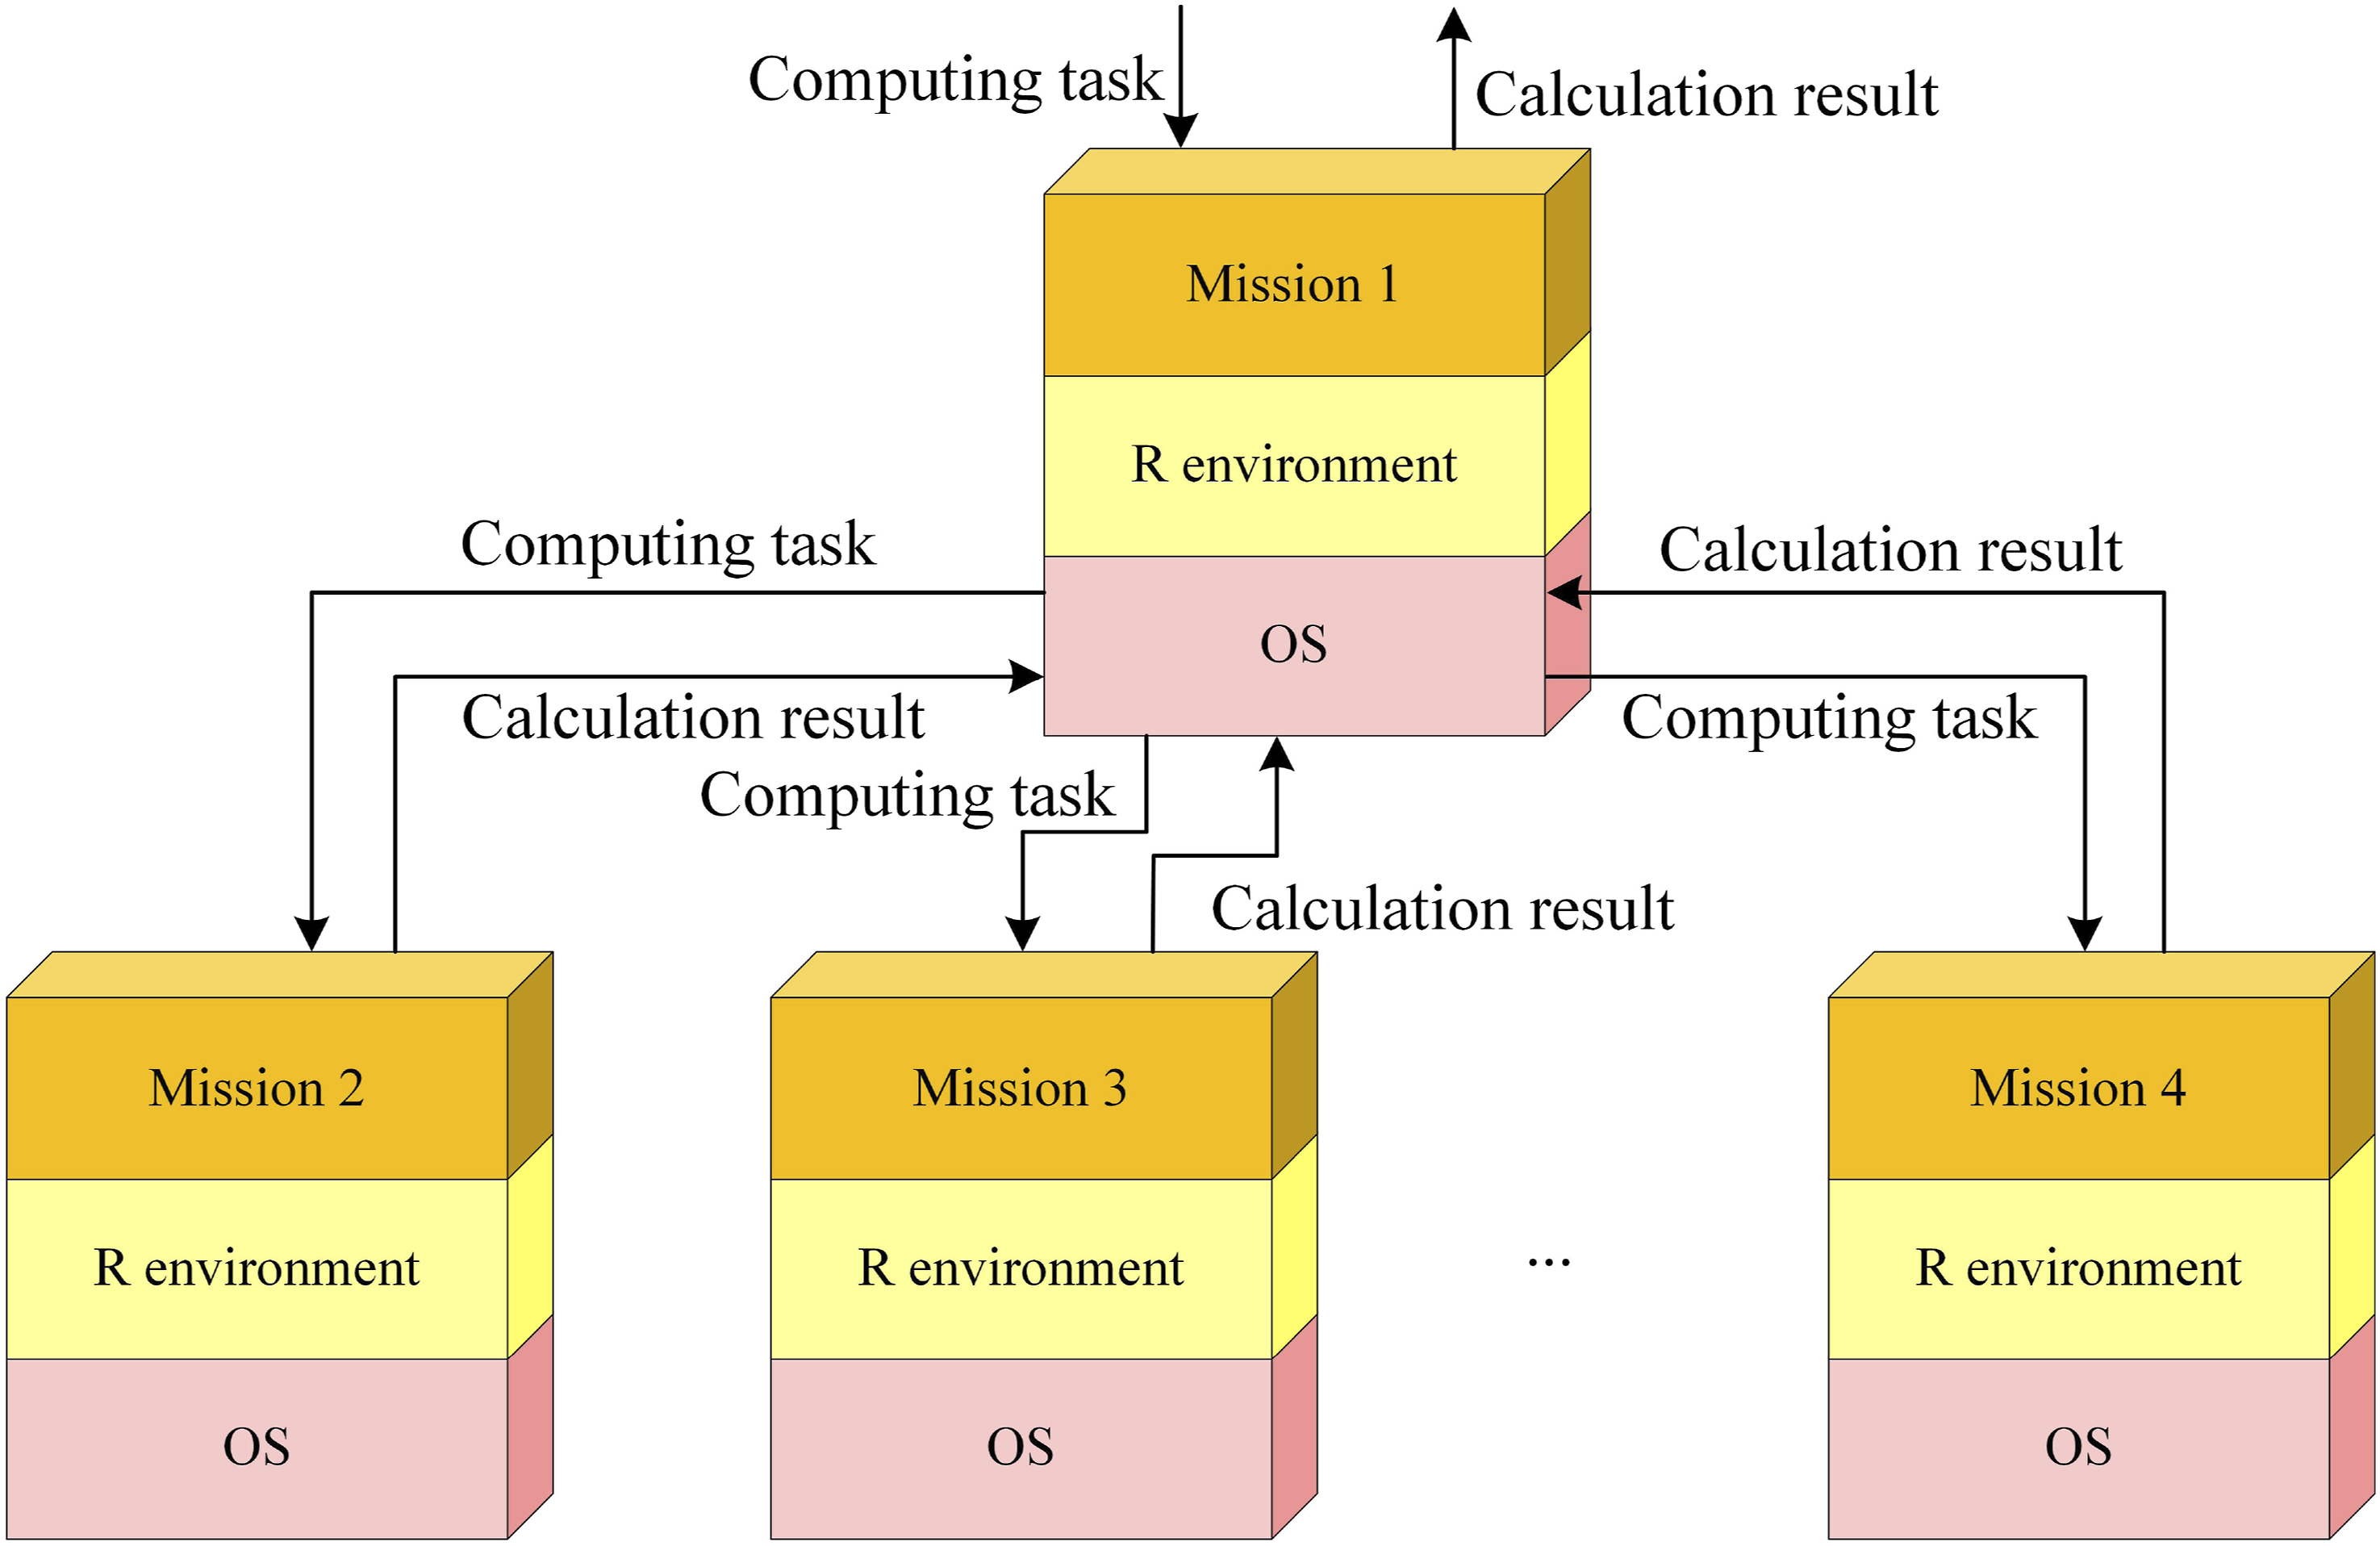
Figure 4 shows that the cluster delivers tasks as executable files, and the scheduler considers task complexity, priority, and computing node load when assigning tasks. The core functionality in the cluster is task scheduling, responsible for managing and coordinating task execution and resource allocation on computing nodes. Once all computing nodes complete their tasks, the scheduler collects the results from each node and merges them into a final result. The missing rate of a filling model serves as a crucial metric for evaluating its performance, as it directly mirrors the model’s capability to ensure completeness and accuracy when imputing missing data. Compared with other potential indicators, the missing rate indicator is intuitive and easy to understand, and it can directly quantify the effectiveness of the model in filling in the missing data. For the I-NMKNN model in particular, the miss rate indicator can capture its performance. Since the I-NMKNN model predicts and fills missing data by optimizing the new MD algorithm and combining the K-nearest neighbor method, the missing rate directly reflects the model’s ability to find similar data points and make accurate predictions. The lower miss rate indicates that the I-NMKNN model can more accurately find data points that are similar to the missing data and make reliable predictions and fillings accordingly. The formula for calculating the missing rate is given in equation (14).

Analysis for filling missing data in smart city IoT
The research initially conducted optimization experiments on the I-NMKNN algorithm data to ensure the accuracy of subsequent experiments. Subsequently, the study focused on the results analysis of the smart city IoT data filling model based on the I-NMKNN algorithm. Experimental results showed that the research model performed exceptionally well in IoT data filling, demonstrating outstanding performance.
Performance comparative study of filling improvement algorithm based on NMKNN
The dimensionality K of the feature space determines the distribution of data in the feature space, the dimensionality q of the feature subspace determines the size of each feature subspace, and the number M of individual models in the ensemble learning framework determines the number of models in the ensemble learning framework. For this purpose, the study optimized these three parameters in the SRBCT dataset, which contains 83 samples and covers 2308 gene expression characteristics, and is mainly used to distinguish the four subtypes of small round blue-cell tumors. The experimental results are shown in Figure 5. I-NMKNN algorithm and parameter K, q, M change trend graph. (a) Building energy consumption-cost of cladding. (b) Building energy consumption-cost of cladding. (c) Building energy consumption-cost of cladding.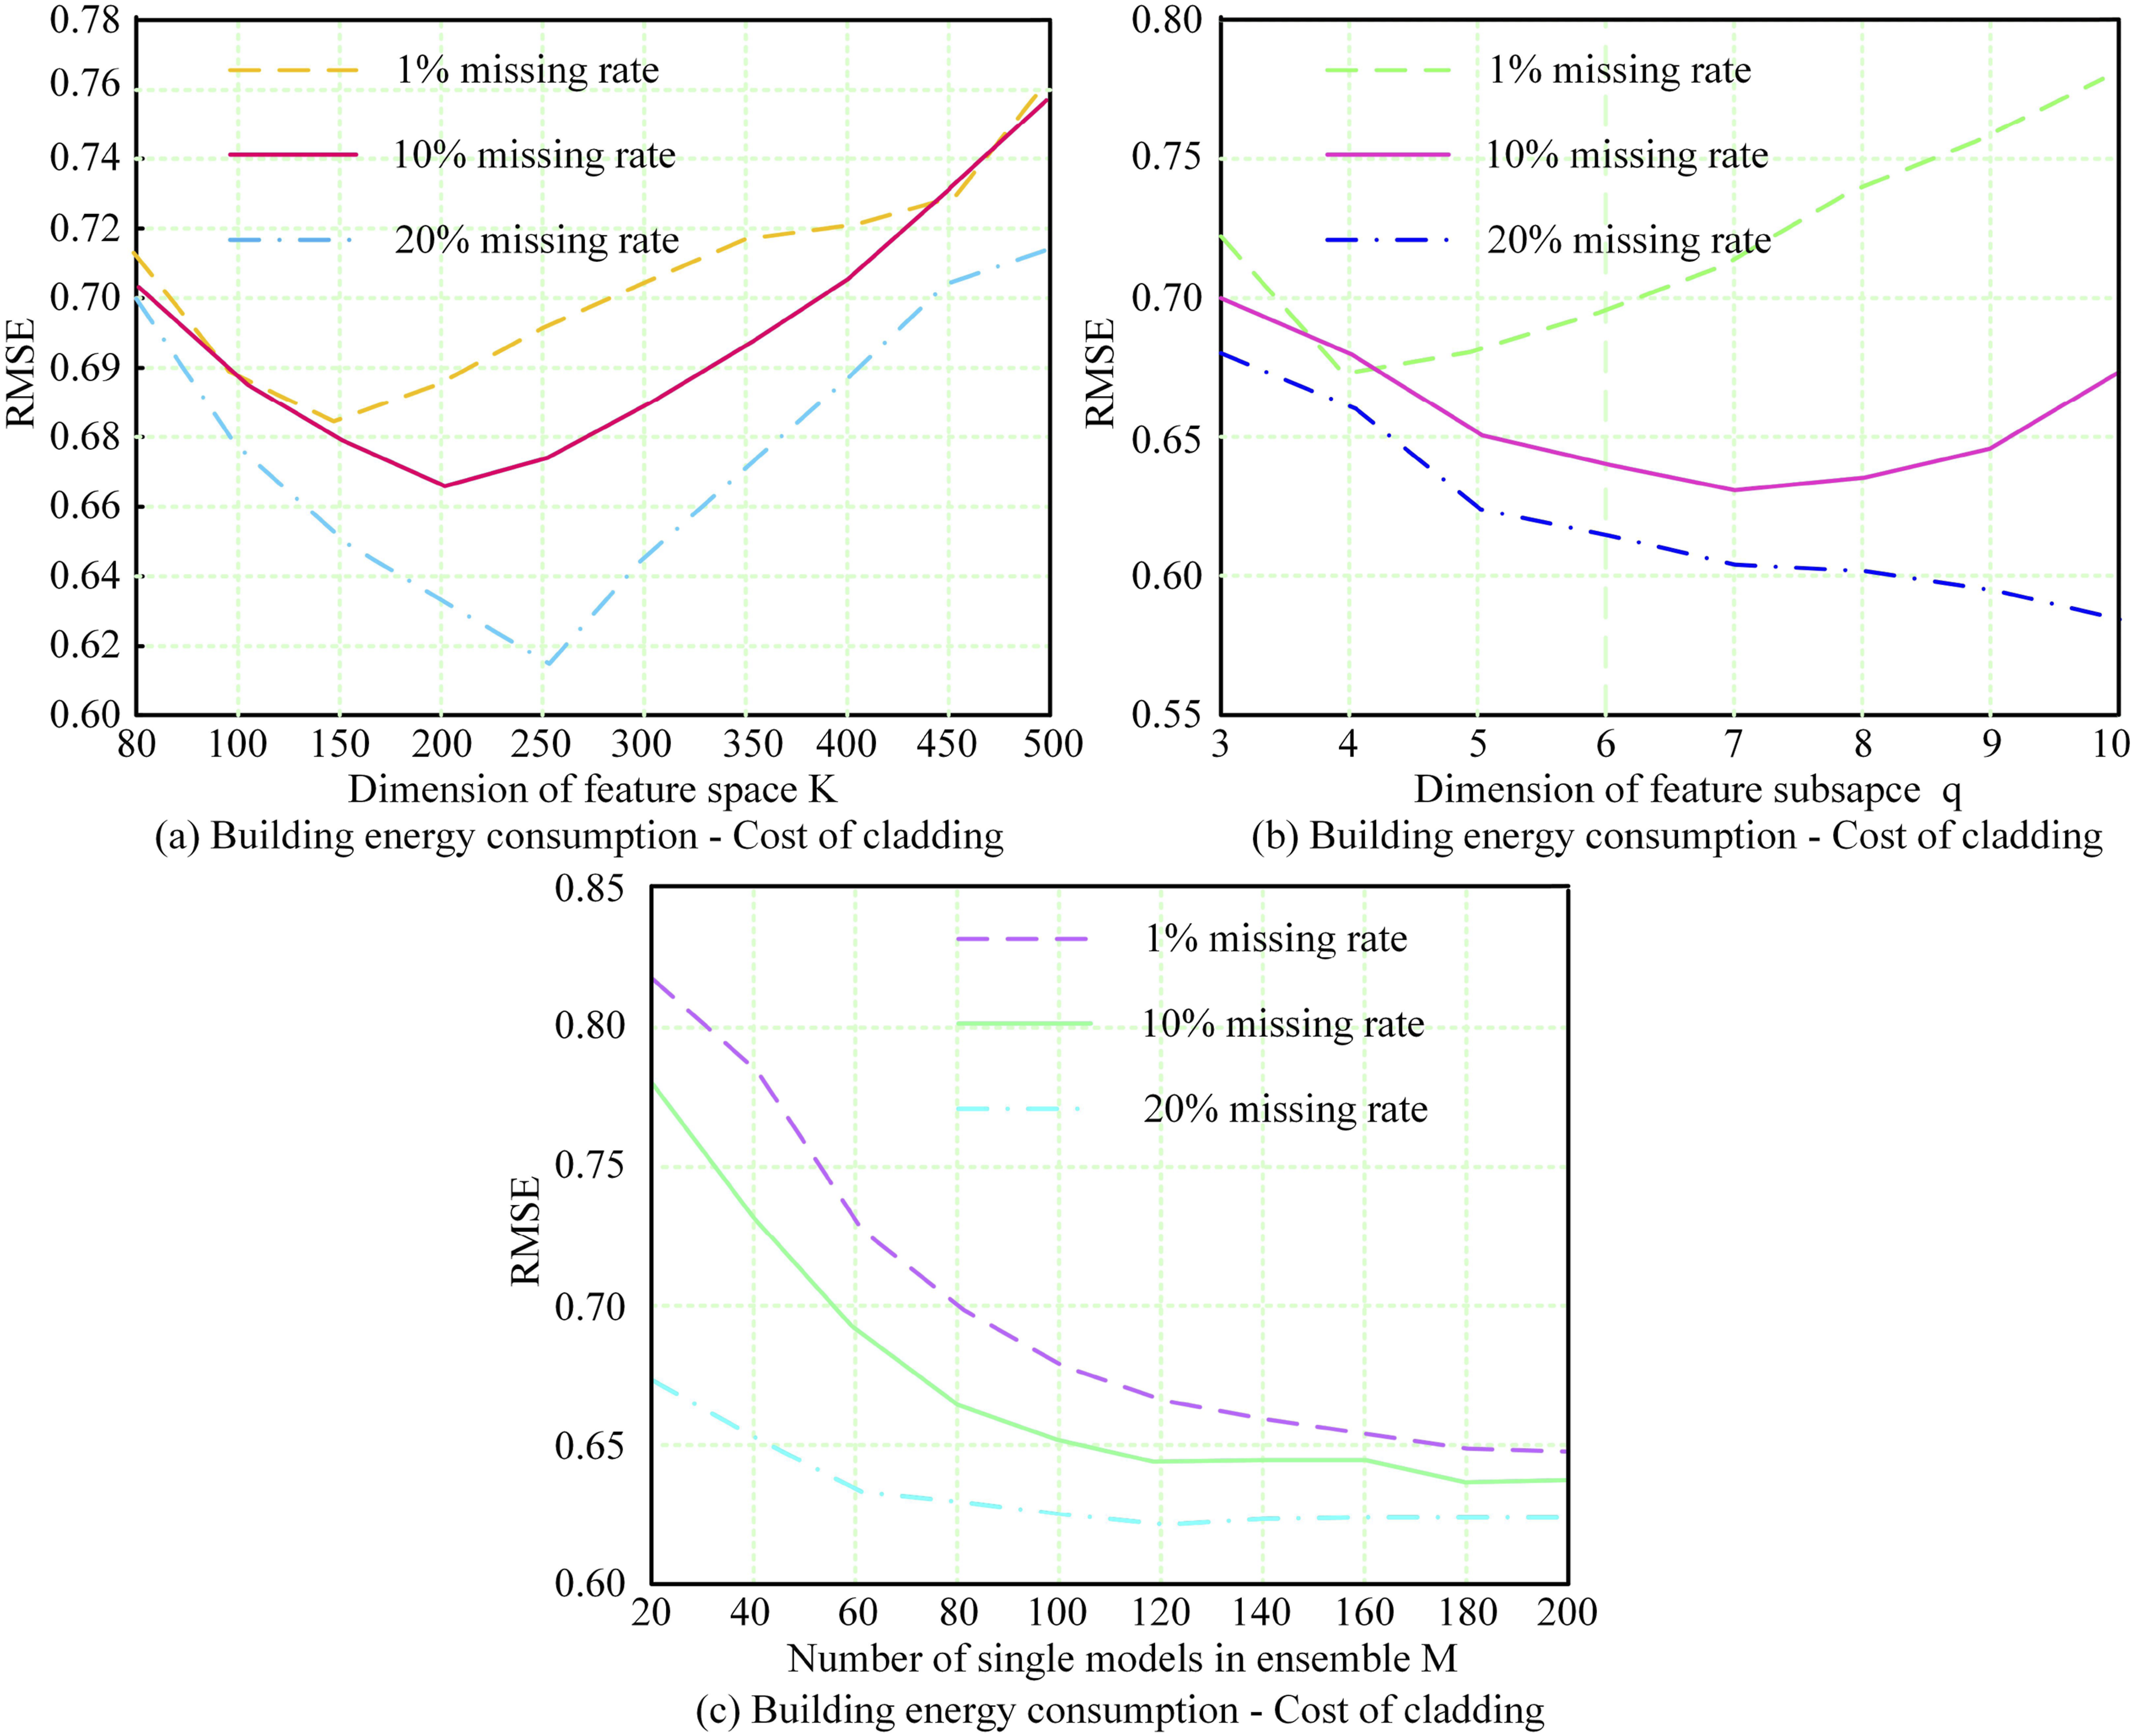
Figure 5(a) indicates the RMSE of the research algorithm with the variation of parameter K. At a missing rate of 1%, when K was set to 250, the RMSE of the research algorithm reached the lowest point, which was 0.618. Figure 5(b) shows the RMSE of the research algorithm with the variation of parameter q. According to Figure 5(b), with q set to 10 and a missing rate of 1%, the RMSE of the research algorithm reached its minimum value, which was 0.58. Figure 5(c) illustrates the RMSE of the research algorithm with the variation of parameter M. From Figure 5(c), at a missing rate of 1%, when the value of parameter M was 120, the RMSE of the research algorithm reached the lowest and stabilizes at 0.625. In conclusion, the study set the values of K, q, and M to 250, 0.58, and 120, respectively. The NMKNN algorithm introduced a sliding time window algorithm, and the value TW of the sliding time window had a significant impact on the algorithm’s performance. To find the optimal value of the sliding time window, the study conducted 100 random experiments on the Sudden, Incremental, and Electricity datasets. Among them, the Sudden dataset consists of 12 data blocks, and each data block contains 50 instances; The Electricity dataset contains 8 features, among which 7 are continuous attributes and the remaining 1 is a discrete attribute. The experimental results are shown in Figure 6. RMS error curves of I-NMKNN algorithm for different TW in different data sets. (a) Study the root-mean-square error curves of different TWS of the algorithm in the sudden dataset. (b) Study the root-mean-square error curves of different TWS of the algorithm in the incremental dataset. (c) Study the root-mean-square error curves of different TWS of the algorithm in the electricity dataset.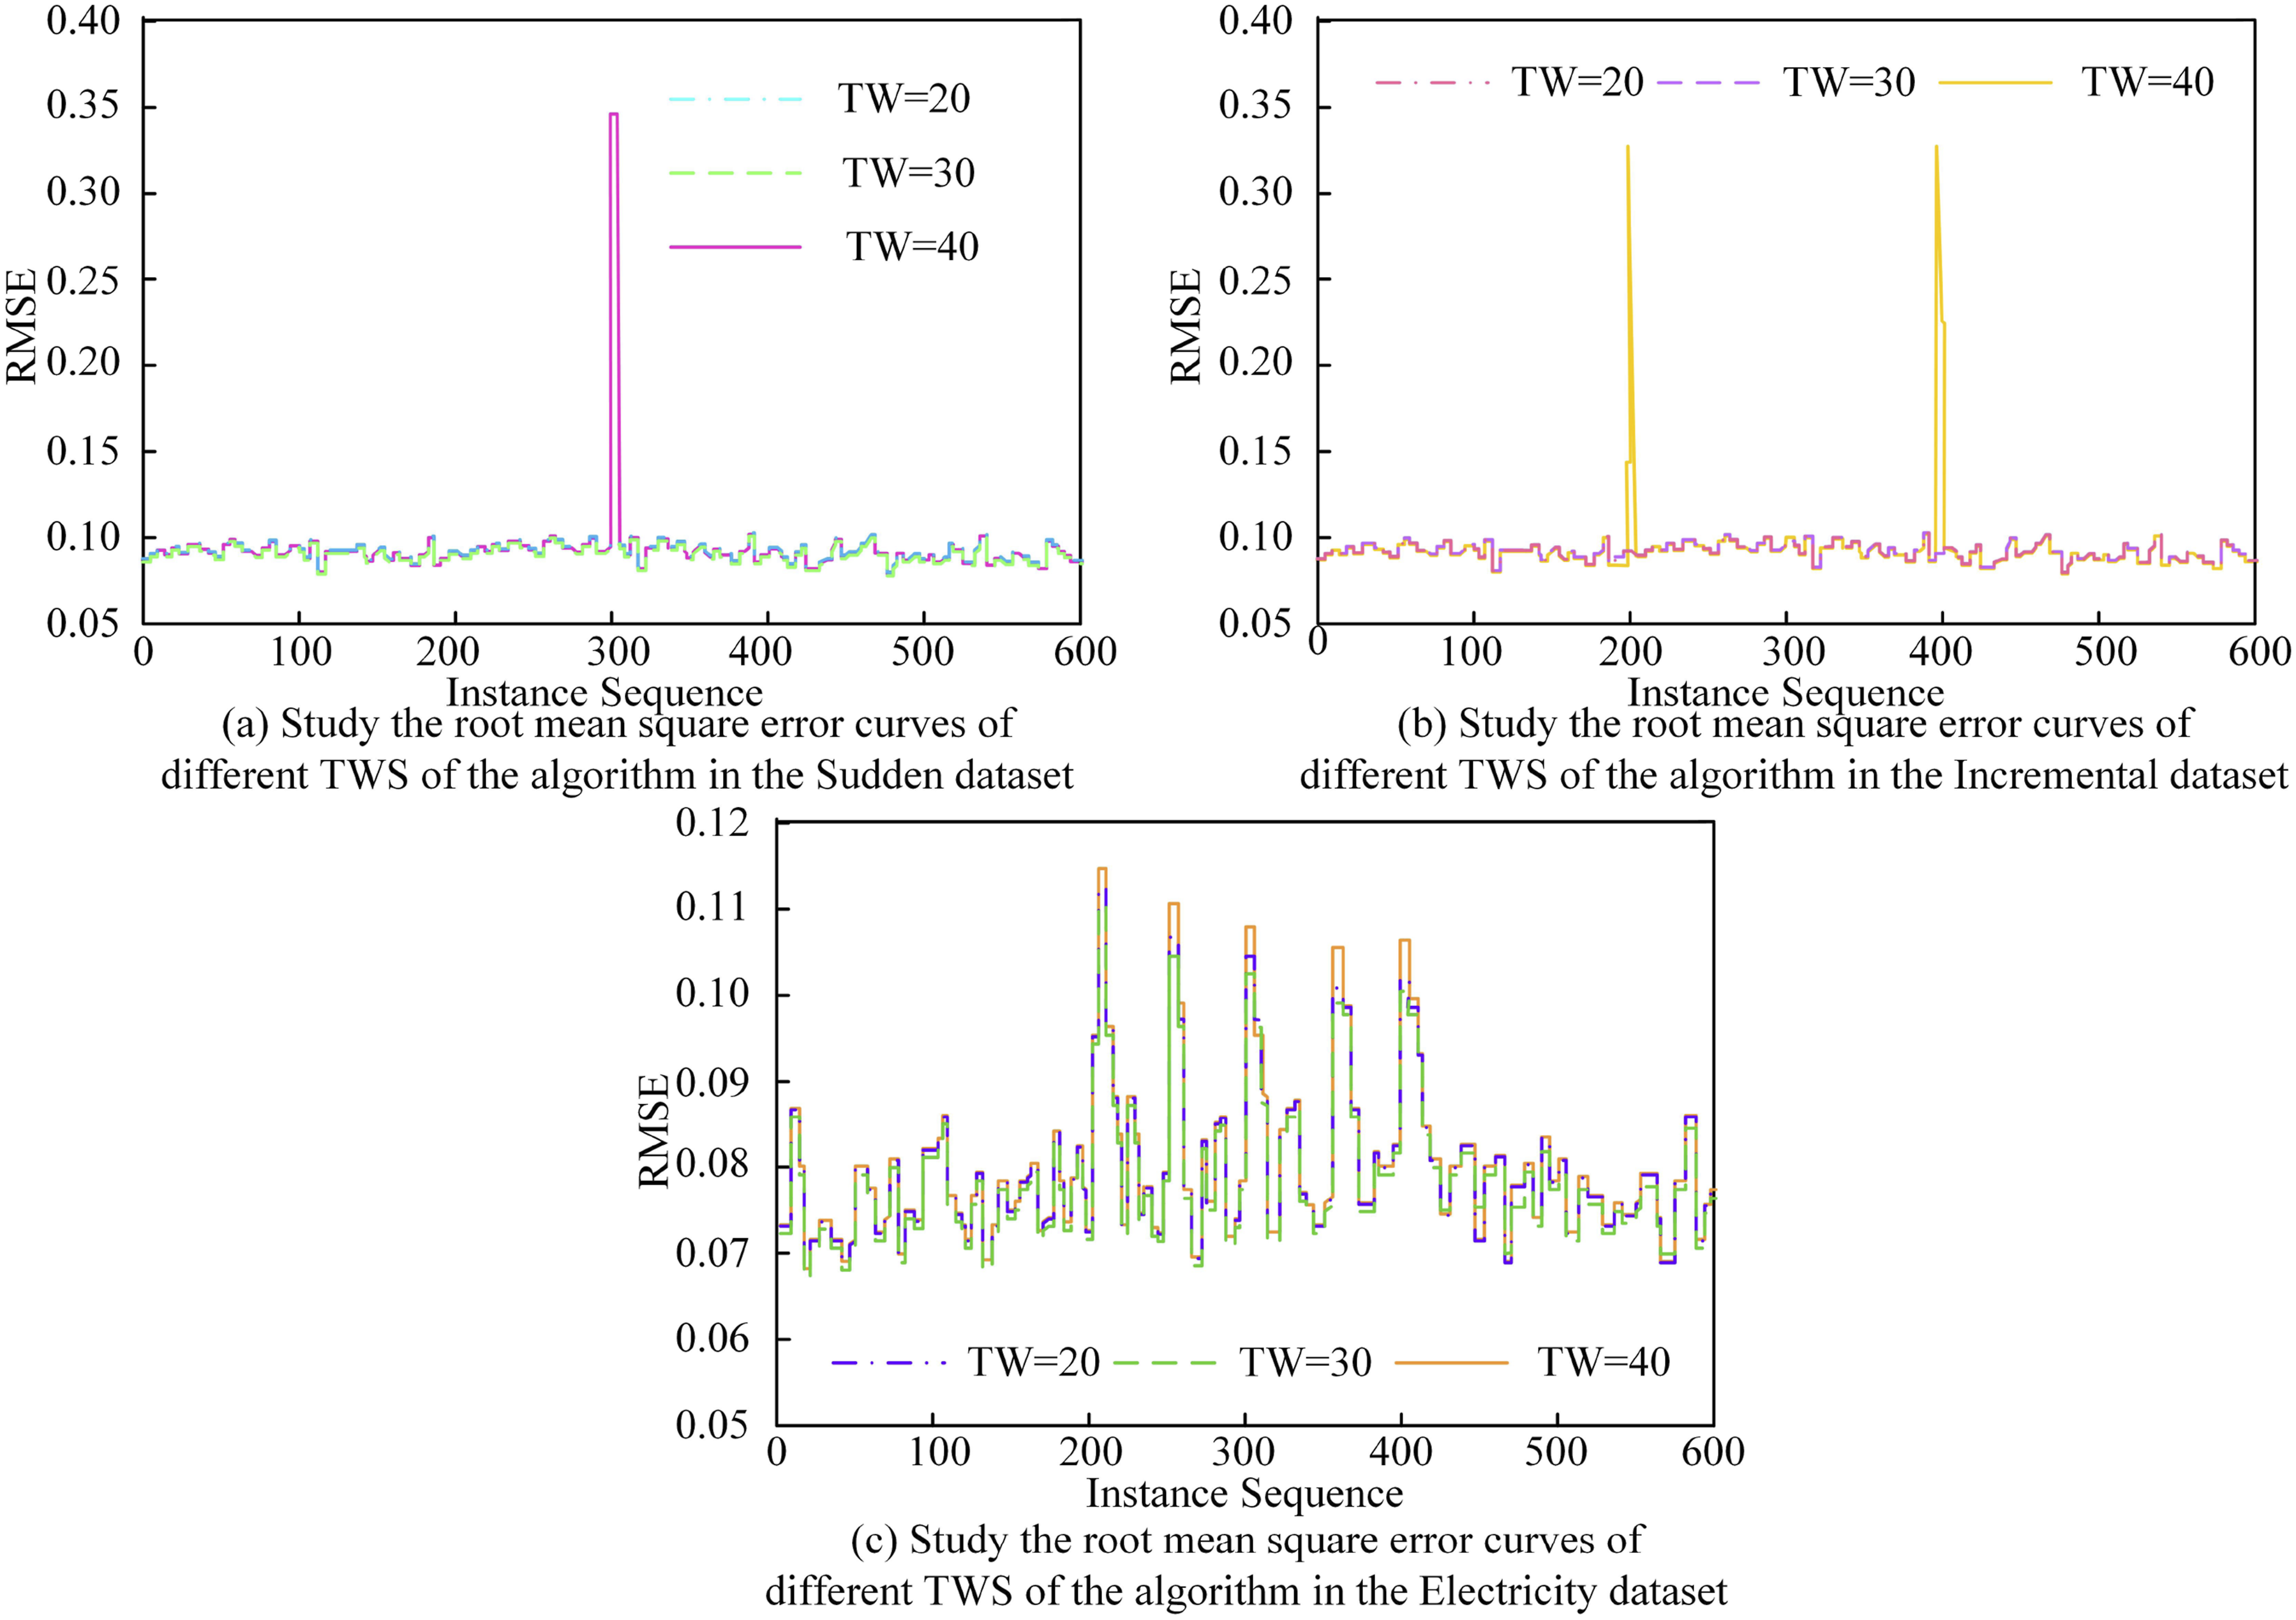
Figure 6(a) presented the RMSE curves of the research algorithm for different values of the sliding time window (TW) in the Sudden dataset. From Figure 6(a), when the TW was set to 20, the RMSE curve of the research algorithm reached its lowest state, stabilizing around 0.08. Figure 6(b) revealed that with a TW of 20, the RMSE curve fluctuated around 0.09, while for TW equal to 30, the RMSE curve fluctuated around 0.10. Moving on to Figure 6(c), it illustrated the RMSE curves of the research algorithm in the Electricity dataset for various TW values. When TW was set to 20, the RMSE curve fluctuated between 0.068 and 0.111. This analysis suggested that, for more reliable experimental results, the research set the TW value to 20.
Figure 7(a) displayed a comparison of running times with segmentation units of 5, 10, and 20. As shown in Figure 7(a), as the number of nodes increased to 2, the algorithm transitioned to parallel operation, significantly reducing the required time. Further increasing the node count beyond 3 resulted in a substantial decrease in the algorithm’s operating time. Figure 7(b) presents the running time comparisons with segmentation units of 100 and 200. The algorithm with a segmentation unit of 100 took 500s to operate with one node, while the one with a segmentation unit of 200 took 100 seconds. Figure 7(c) depicted running time comparisons with a segmentation unit of 400. For the research algorithm with a segmentation unit of 400, the operating time was 540s with one node. As the node count increased to 4, the algorithm’s operating time decreased to 270s, resulting in a total reduction of 270s. I-NMKNN algorithm running time graph for different segmentation units. (a) Research algorithms on sudden data sets for different TW root-mean-square error curves. (b) Research algorithms on incremental data sets for different TW root-mean-square error curves. (c) Research algorithms on electricity data sets for different TW root-mean-square error curves.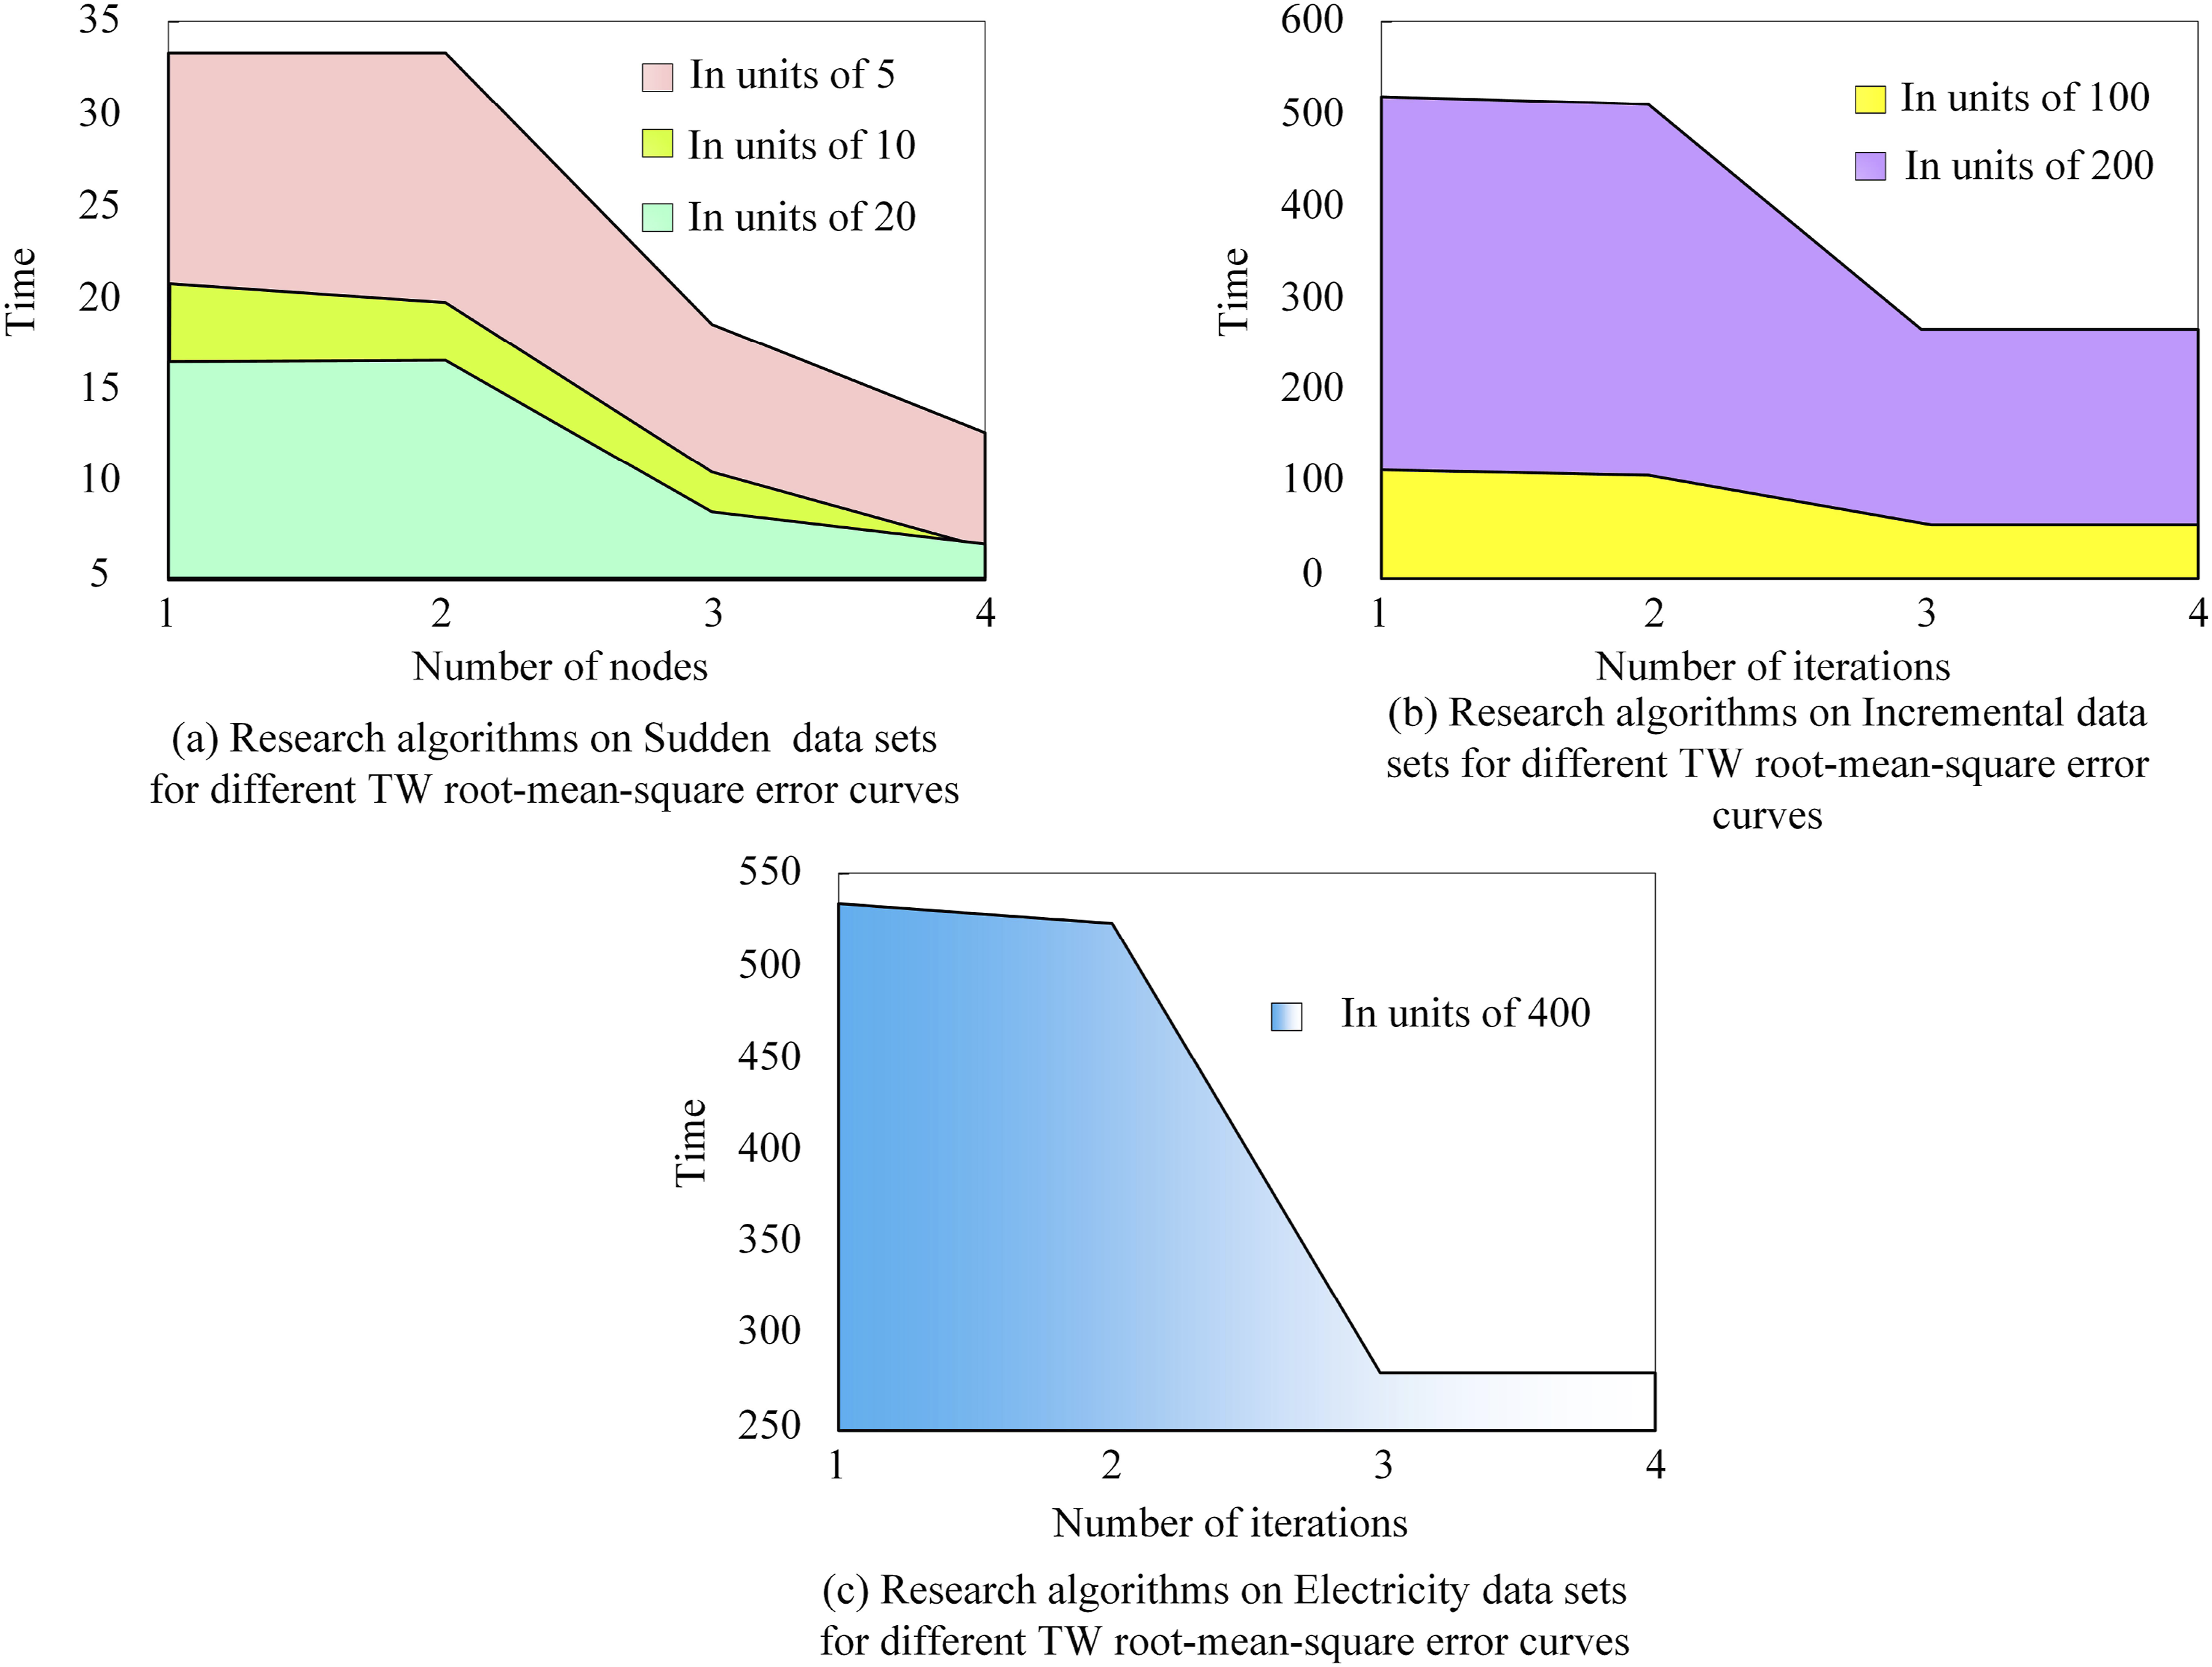
Analysis of the smart city IoT data filling model based on the I-NMKNN algorithm
MSE values of different models with different loss rates.
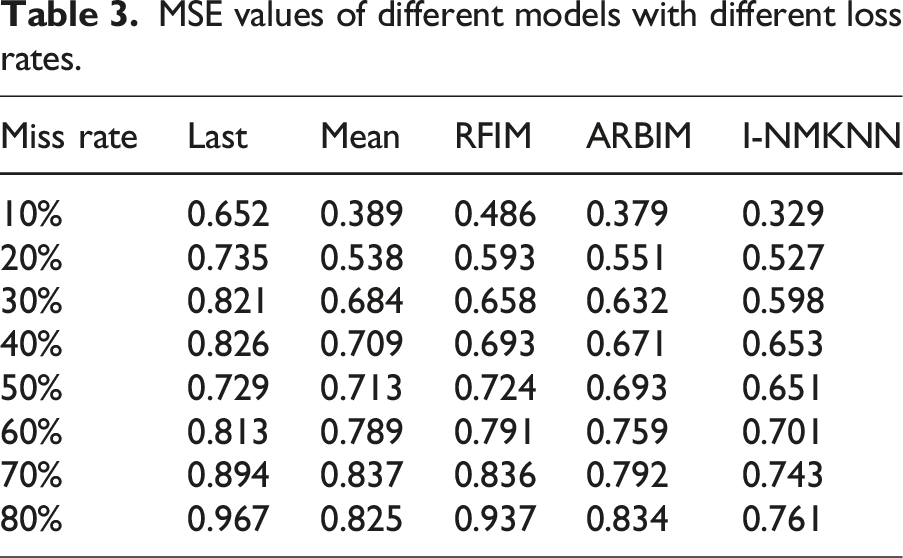
Table 3 reveals that I-NMKNN had the lowest MSE values at missing rates of 10%–80%, with values of 0.329, 0.527, 0.598, 0.653, 0.651, 0.701, 0.743, and 0.761, respectively. Compared to similar models, it demonstrated better performance. The graph in Figure 8 illustrates the comparison of model missing rates and imputation accuracy under different missing quantities. Comparison of model deletion rate and filling accuracy under different deletion quantities. (a) Comparison chart of the deletion rates of the three models under different deletion amounts. (b) Deletion ratio filling accuracy of different models.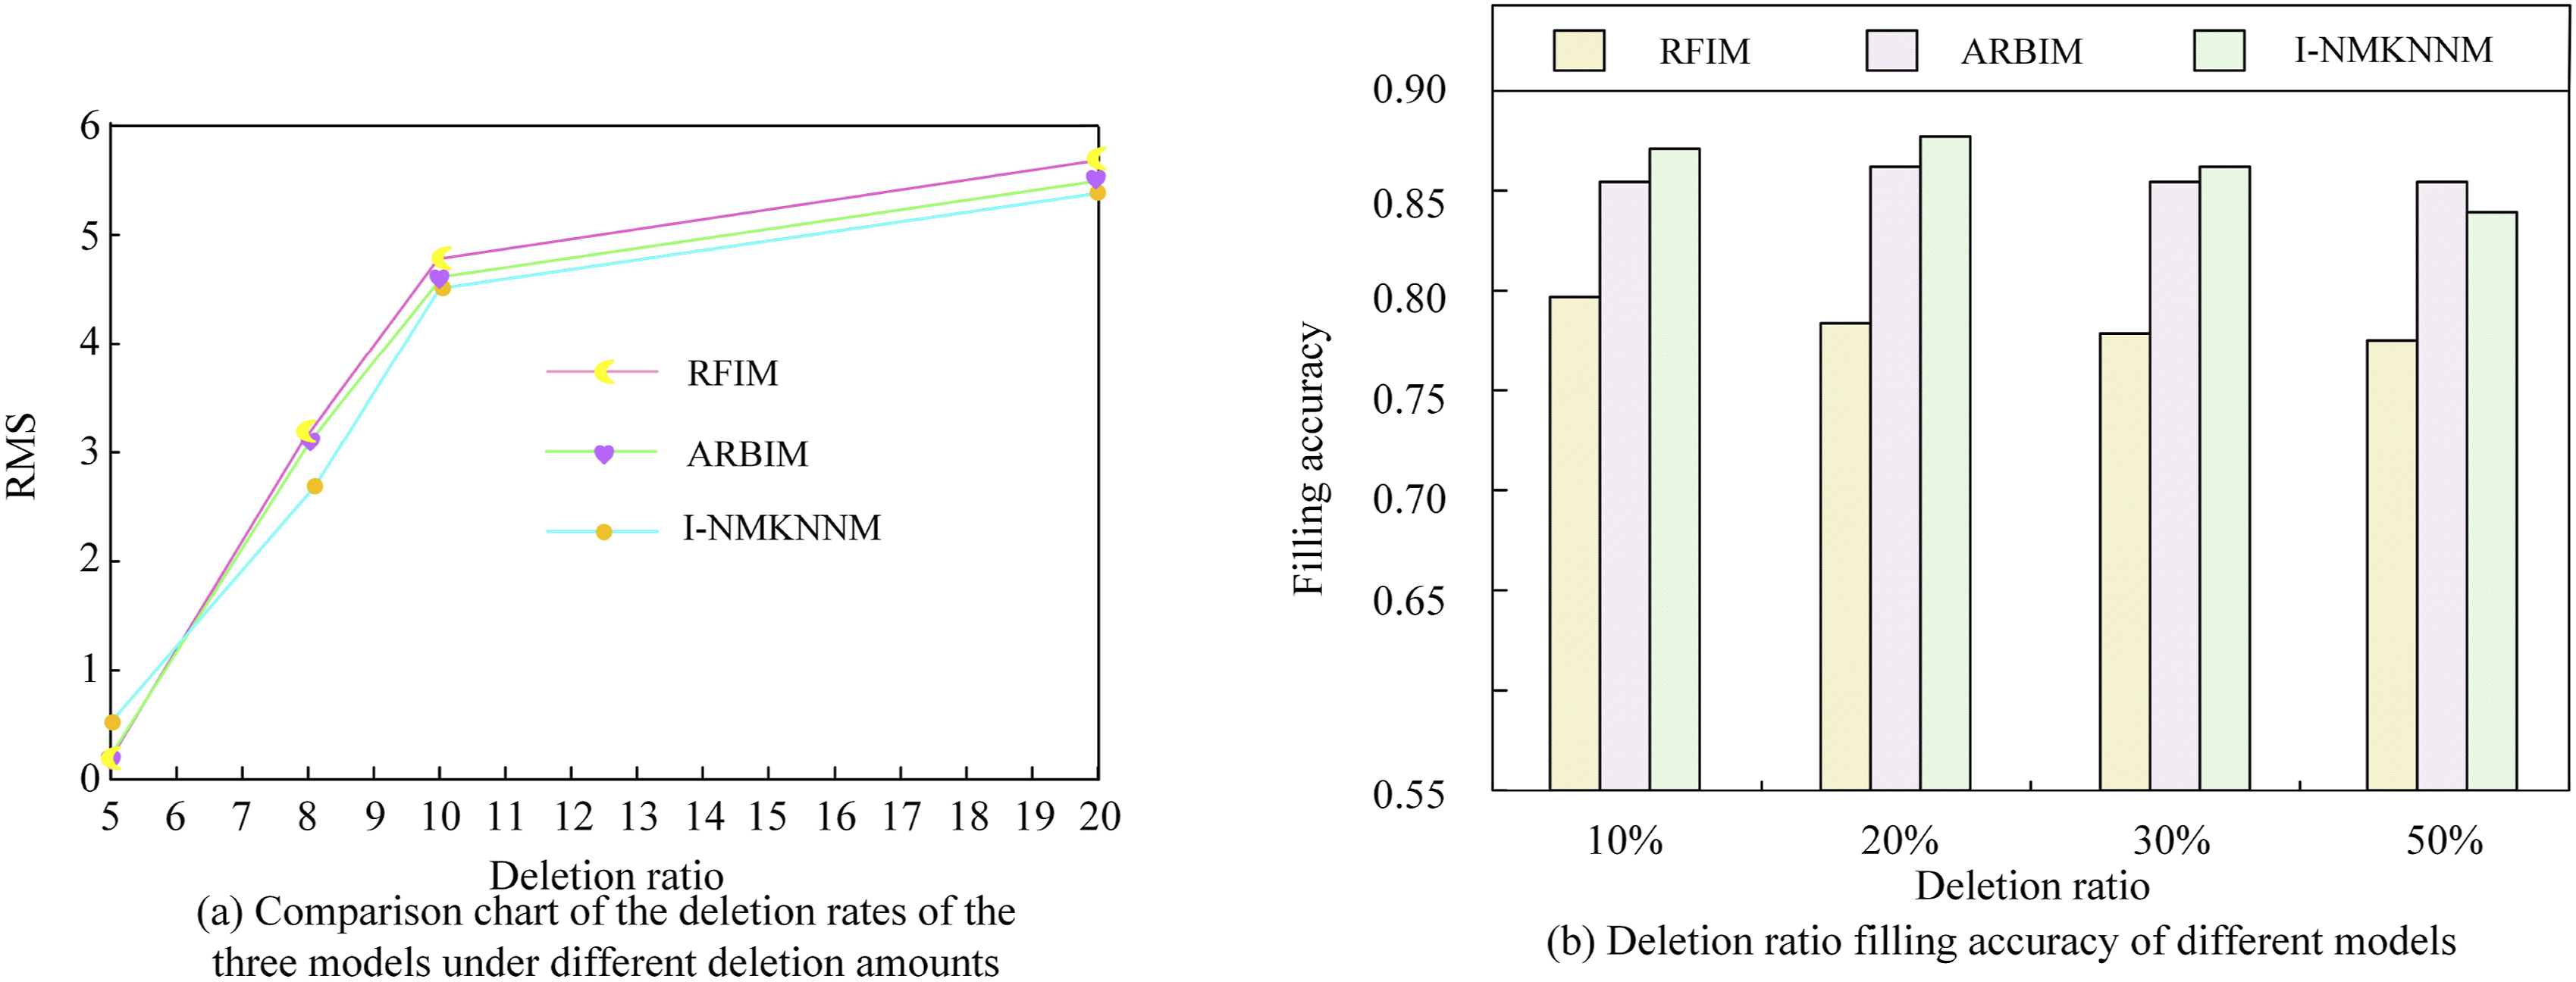
Figure 8(a) depicts the missing rate comparison graph of the three models under different missing quantities. In Figure 8(a), with an increase in the missing ratio, the RMS values of all three models showed an increasing trend. In comparison to the other two models, the research model achieved the lowest RMS value at a missing ratio of 5, which was 0.28. When the RFIM model had a missing ratio of 20, the RMS value was highest at 5.72. Figure 8(b) shows the missing rate comparison graph of the three models under different missing quantities. The research model had the lowest imputation accuracy at a 10% missing ratio, which was 0.89. Figure 9 illustrates the comparison of model imputation misjudgment rates under different missing ratios. Comparison of model filling error rate under different miss rates.(a) Comparison of error rate of model filling when the missing rate is 10%. (b) Comparison of error rate of model filling when the missing rate is 20%. (c) Comparison of error rate of model filling when the missing rate is 30%. (d) Comparison of error rate of model filling when the missing rate is 40%.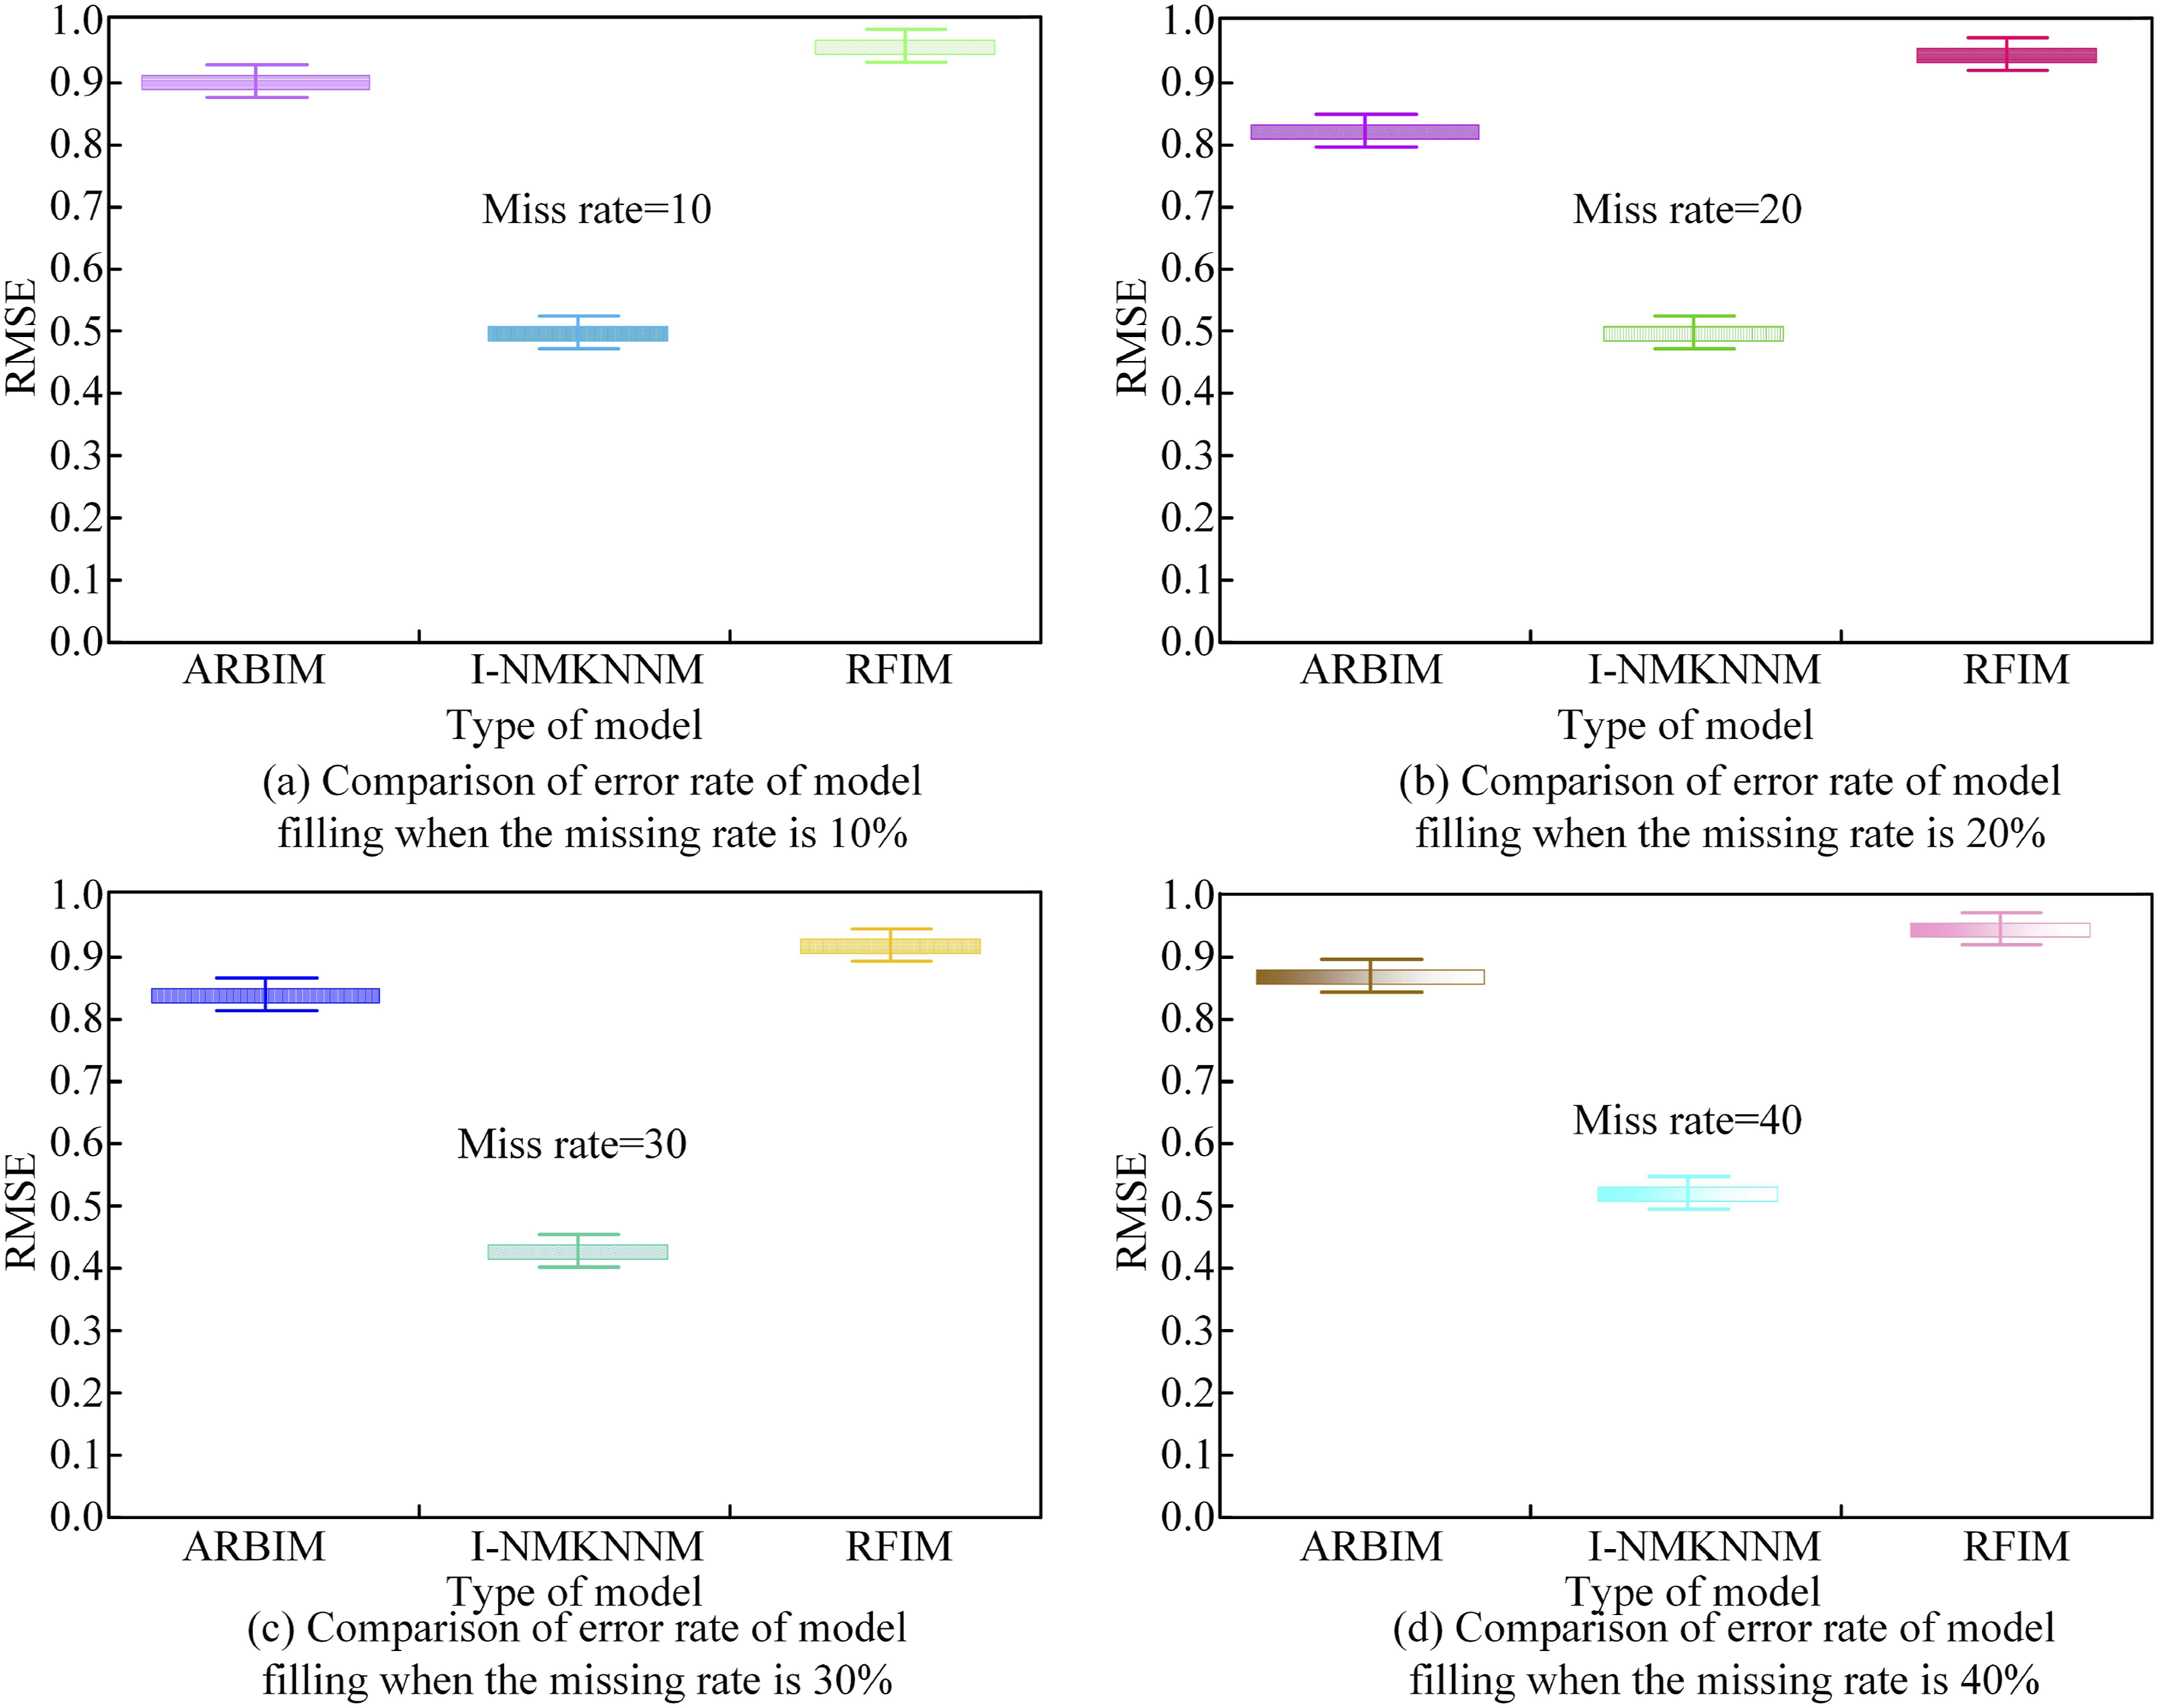
Figure 9(a) illustrates the imputation misjudgment rates of different models at a missing rate of 10%. In Figure 9(a), under a 10% missing rate, the research model had the lowest imputation misjudgment rate at 0.45. Figure 9(b) presents the imputation misjudgment rates of different models at a missing rate of 20%. The research model had the lowest imputation misjudgment rate at 0.48. Figure 9(c) shows the imputation misjudgment rates of different models at a missing rate of 30%, revealing that under a 30% missing rate, the research model had the lowest imputation misjudgment rate at 0.47, followed by the ARBIM model at 0.89, and the RFI model had the highest imputation misjudgment rate at 0.94. In Figure 9(d), at a missing rate of 40%, the research model had the lowest imputation misjudgment rate at 0.55, surpassing similar models. The comparison graph of model imputation error rates under different missing conditions is shown in Figure 10. Comparison of filling error rates of different models under different missing conditions.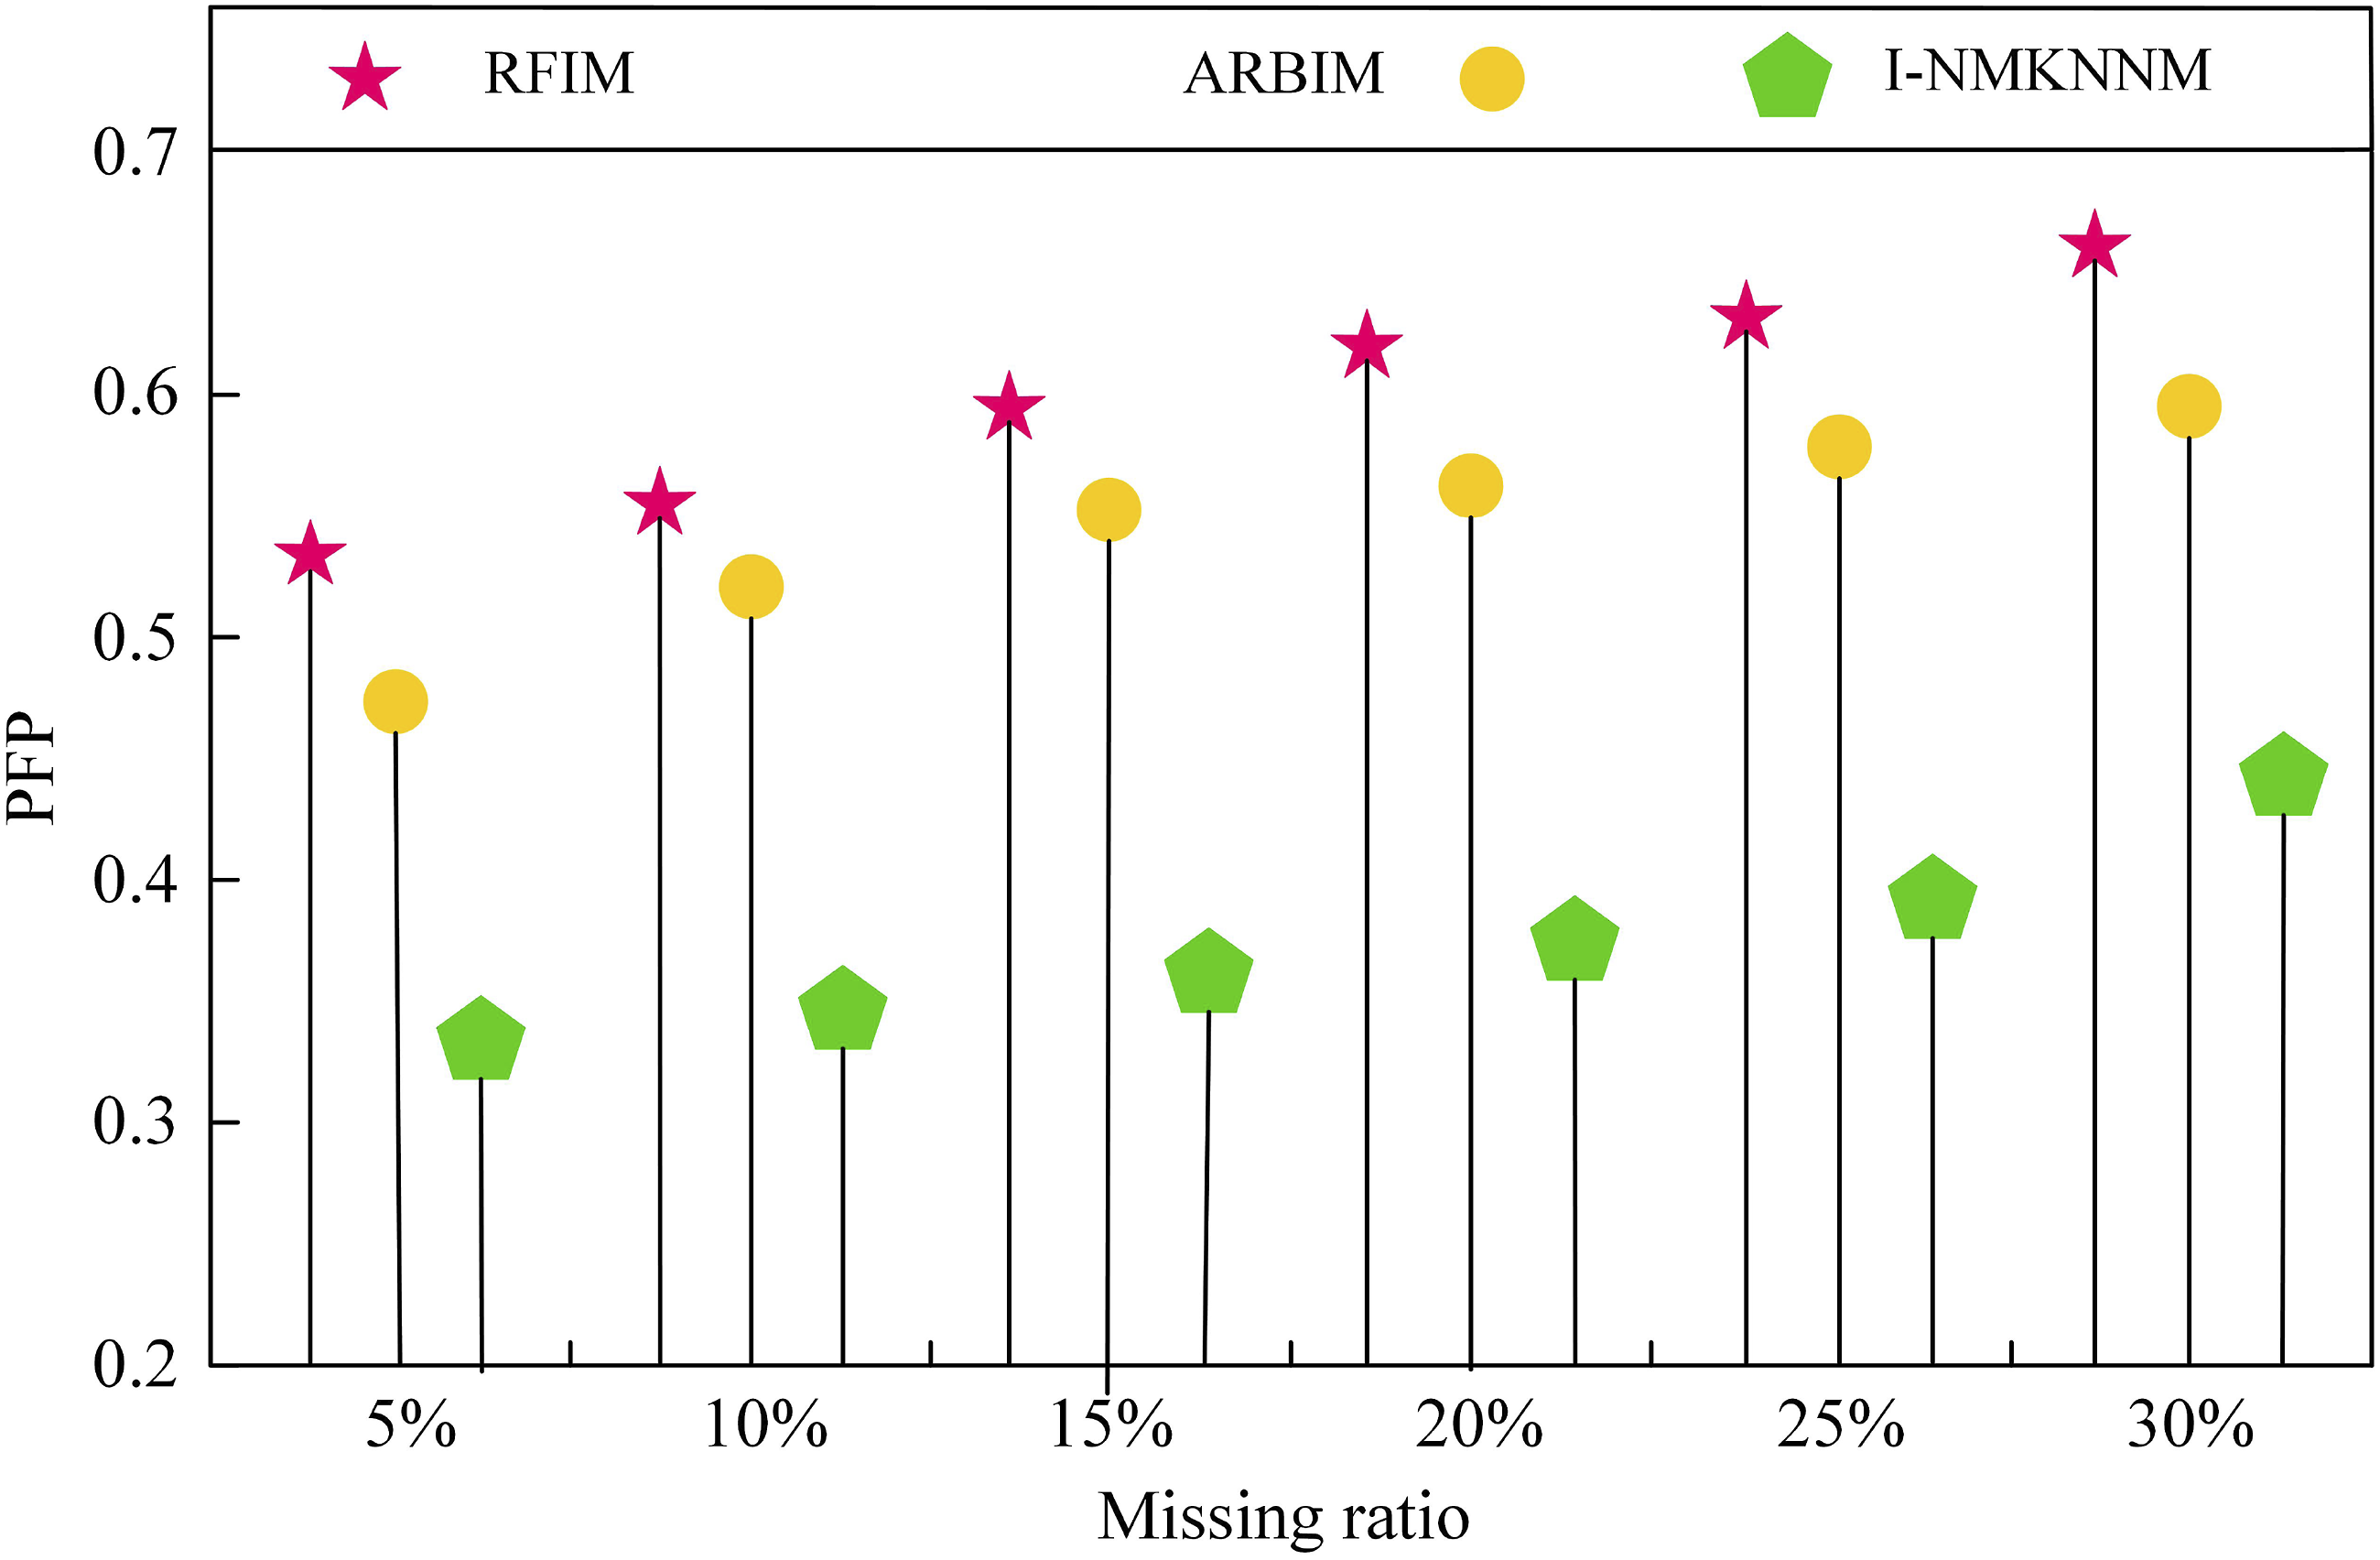
From Figure 10, at a 5% imputation error rate, the research model showed an imputation error rate of the lowest, only 0.32. The research model performed best at a 10% imputation error rate, with an error rate of 0.37, while the RFI model had the highest error rate at 0.60. At a 15% imputation error rate, the research model had the lowest error rate at 0.40, while the RFI returned the highest error rate at 0.65. At a 20% imputation error rate, the research model had the lowest error rate at 0.42, and the RFI returned the highest error rate at 0.68. At a 25% imputation error rate, the research model had the lowest error rate at 0.45, outperforming similar models. At a 30% imputation error rate, the research model returned the lowest error rate at 0.48, while the RFI returned the highest error rate at 0.74.
Discussion
With the rapid development of IoT technology, the construction of smart cities has become an important direction of modern city development. In smart cities, IoT devices provide city managers with unprecedented decision support by collecting and processing large amounts of data in real time. However, the problem of missing IoT data has always been one of the challenges to be faced in the construction of smart cities. Therefore, aiming at the problem of filling missing IoT data in smart cities, a smart city IoT data filling model based on I-NMKNN algorithm was proposed. By comprehensively considering the covariance matrix and sliding time window of the data set, the model could more accurately capture the similarity and time correlation between data points, thus improving the accuracy of data filling.
The missing rate, filling accuracy rate, filling error rate and filling error rate of various models under different missing amount were studied. The experimental results showed that the I-NMKNN model showed excellent performance under different data loss rates after experimental verification on RDD data sets. Specifically, when the data missing rate increased from 10% to 80%, the MSE values of the I-NMKNN model were 0.329, 0.527, 0.598, 0.653, 0.651, 0.701, 0.743, and 0.761, respectively, which were much lower than the MSE values of the ARBI model and the RFI model. This data comparison clearly showed that the I-NMKNN model had higher accuracy and stability when filling in missing data. Especially when the data missing rate was as high as 80%, the I-NMKNN model could still maintain a low MSE value, showing its strong robustness, which was consistent with the results obtained by Xu et al. in the multi-fault diagnosis method based on improved SMOTE data. 22 With the gradual increase of data missing rate, the RMS values of the three models increased. The I-NMKNN model could obtain a lower RMS value when the data miss rate was low, and maintains a lower RMS value in the whole range of the miss rate. Taking the deletion rate of 5% as an example, the RMS value of the I-NMKNN model was 0.28, which was much lower than the RMS value of the ARBI model and the RFI model under the same deletion rate. This data comparison showed that the I-NMKNN model had a higher accuracy when filling in missing data, especially when the missing rate was low, and its accuracy was most significant, which was similar to the conclusion obtained by Zhu et al. in the study of dynamic alignment robust adaptive Kalman filtering for strapdown inertial navigation system. 23 The filling error rate and filling error rate of I-NMKNN model were significantly lower than that of ARBI and RFI model under different missing rates. Taking the case of 20% missing rate as an example, the filling misjudgment rate of I-NMKNN model was 0.48, while that of ARBI model and RFI model was 0.89 and 0.94, respectively. Similarly, the I-NMKNN model performed well when it came to filling error rates. In the case of 5% filling error rate, the I-NMKNN model’s filling error rate was only 0.32, which was much lower than the RFI model’s 0.60. The sliding time window mechanism introduced by the I-NMKNN model could dynamically capture the local features and changing trends of the data in the time dimension, enhance the perception ability of the dynamic context, and enable the model to conduct more accurate filling predictions based on the distribution and patterns of the recent data when dealing with missing data. This conclusion was similar to the conclusion obtained by Pang et al. in the MD time dependent study on anomaly detection of multivariable spacecraft telemetry sequences. 24
Although the I-NMKNN model performed well in the current experiment, the selection of the λ value may introduce the risk of overfitting. To mitigate this risk, cross-validation was introduced during the model training process to determine the optimal λ value. By evaluating the performance of the model under different λ values on an independent validation set, the λ value that could balance the bias and variance and thereby minimize the validation error was selected. Future work can further explore adaptive regularization methods, which can dynamically adjust the λ value according to the characteristics of the data, thereby achieving better performance under different datasets and missing rate conditions. The I-NMKNN model mainly relied on the K-nearest neighbor algorithm and performed poorly when dealing with data with complex nonlinear relationships. Future research can consider combining I-NMKNN with other nonlinear models, such as neural networks or support vector machines, to improve the processing ability of nonlinear data.
To sum up, the proposed smart city IoT data filling model based on I-NMKNN model achieved significant improvement effect. The model improved the accuracy and stability of data filling by comprehensively considering the statistical characteristics and time correlation of data, and provided an effective solution for smart city IoT data processing.
Conclusion
In the present study, a comprehensive research endeavor was initiated to tackle the challenge of missing data within the realm of IoT applications for smart cities. An enhanced filling algorithm grounded in the NMKNN approach was subsequently proposed. Experimental results indicated that, with a sliding TW set to 20, the research algorithm’s RMSE curve exhibited the lowest and most stable state, approximately at 0.08. As the TW increased to 30, the RMSE curve showed subtle fluctuations around 0.09. Further increasing the TW to 40 resulted in a significant fluctuation in the research algorithm’s RMSE curve, reaching its peak value at 0.35. The research model demonstrated the lowest imputation misjudgment rate of 0.45 at a missing rate of 10%. At a missing rate of 20%, the imputation misjudgment rate for the research model was 0.48, while at a missing rate of 30%, it was 0.47. Even at a missing rate of 40%, the research model’s imputation misjudgment rate remained low at 0.55, significantly lower than other models of the same kind. Additionally, at 5% and 30% imputation error rates, the algorithm’s imputation error rates were the lowest at 0.32 and 0.48, respectively. Compared to similar filling models, the research model exhibited the highest imputation accuracy. In summary, the enhanced NMKNN filling model effectively increased the imputation rate for missing data in smart city IoT. The research also parallelized the algorithm from a clustering perspective, suggesting potential avenues for further optimizing the performance of the data filling algorithm in the future.
ORCID iD
Guifang Shen https://orcid.org/0009-0002-4768-107X
Footnotes
Funding
The author disclosed receipt of the following financial support for the research, authorship, and/or publication of this article: The research is supported by: Key scientific research funding project of Henan colleges and universities in 2025, Research on the Innovation and System of Talent Training Model for Two-way Empowerment of Artificial Intelligence and Education in Higher Vocational Colleges, No. (25A880018); 2021 Henan Province Higher Education Teaching Reform Research and Practice Project, Research and Practice of Skilled Talent Training with Skilled Units as Core Under the Integrated Multi-Framework, No. (2021SJGLX914).
Declaration of conflicting interests
The author declared no potential conflicts of interest with respect to the research, authorship, and/or publication of this article.