
Abstract
Traditional equipment manufacturing training methods face many problems, such as high resource consumption, high safety risks, time and space limitations, difficulty in personalized teaching, and incomplete evaluation. This article aims to develop an intelligent international equipment manufacturing training platform by combining deep learning and virtual reality (VR) technology to address these issues. Firstly, the virtual reality technology was utilized to create immersive virtual environments, reducing reliance on physical equipment and venues, lowering costs and resource consumption, while eliminating security risks in real operations. Students could conduct practical training anytime and anywhere in a virtual environment, overcoming the limitations of traditional training in terms of time and space, and enhancing the flexibility and convenience of learning. Then, through deep learning algorithms CNN (convolutional neural network) and RNN (recurrent neural network), the platform could analyze students’ operational data in real-time and provide personalized feedback and guidance. The teaching content and difficulty were adjusted according to the learning progress and performance of the students, ensuring that each student can have a suitable learning experience. In addition, deep learning algorithms could automatically evaluate students’ operational skills and learning effectiveness, and generate detailed evaluation reports, making the evaluation process more objective and fair, and avoiding the influence of subjective factors. The training platform developed in this article could also simulate complex equipment manufacturing scenarios and troubleshooting processes, allowing students to significantly improve their scores in operational accuracy, efficiency, fault recognition ability, and problem-solving ability. The average improvement percentage of students in various evaluation indicators was about 43.83%. Through the development and evaluation of this platform, this article aims to significantly improve the efficiency, safety, and learning effectiveness of equipment manufacturing training, providing an innovative solution for international equipment manufacturing training.
Keywords
Introduction
With the rapid development of the global manufacturing industry, the demand for high-quality equipment manufacturing talents is increasing day by day. However, traditional equipment manufacturing training methods face many challenges, mainly manifested in the following aspects. Firstly, traditional practical training requires a significant amount of resources, including materials, equipment, and human resources, resulting in high costs. Secondly, safety risks are prominent, as students are prone to accidents while operating large mechanical equipment, posing a threat to personal safety. In addition, traditional practical training is greatly limited by time and space, often requiring specific locations and times for flexible arrangements. The difficulty of personalized teaching is also a major problem, as different students have differences in their operational level and learning progress, and traditional training methods are difficult to provide targeted personalized guidance. Finally, the evaluation is not comprehensive. Traditional training evaluation methods often rely solely on the observation and subjective judgment of instructors, lacking quantitative objective data support, making it difficult to comprehensively and accurately evaluate the learning effectiveness of students.
These problems seriously affect the efficiency and effectiveness of practical training, and constrain the quality of talent cultivation in equipment manufacturing. Therefore, how to improve the quality and efficiency of equipment manufacturing training has become an important issue that urgently needs to be addressed. To this end, this article proposes an innovative solution, which is to develop and evaluate a deep learning-based virtual reality international equipment manufacturing training platform. The development of this platform aims to address issues such as resource consumption, security risks, time and space limitations, difficulty in personalized teaching, and incomplete evaluation in traditional training methods.
In recent years, many scholars and research institutions have been committed to solving various problems in the application of virtual reality in practical training. Xiong et al. 1 used holographic optical elements to study how this equipment can help improve AR (augmented reality) and VR (virtual reality) performance, and described and analyzed in detail some of the most advanced architectures, looking forward to the potential development and research directions of these photonic equipment in future AR and VR displays. Fitria reviewed the application of AR and VR in education, especially in the teaching process, and indicated in the analysis that AR and VR are solutions for teachers and students as media in the teaching process. 2 AR uses image elements, sound effects, or text to beautify existing reality. VR creates a new simulation environment that presents specific themes to students in an engaging, interactive, and experiential way. Abich 3 reviewed the research on the effectiveness of training using virtual reality technology. The objective of the review was to identify knowledge, skills, and abilities that had been effectively trained or enhanced through VR from a domain agnostic perspective, and provide recommendations to support the use of VR training systems to achieve training outcomes. Mossel 4 launched the VROnSite platform, which supported immersive training for on-site team leaders of emergency units. With the functionality of this platform, the gap in existing technology for emergency personnel training was filled. Rogers 5 described the current status, future directions, and existing limitations of combining virtual reality and machine learning for surgical training. Combining fully immersive simulation environments with machine learning analysis provides real-world training opportunities in a safe atmosphere, away from the possibility of harm to patients. However, existing research still has shortcomings in personalized guidance and objective evaluation.
This article achieved this goal through the following steps: firstly, a highly realistic virtual reality environment was constructed to simulate complex equipment manufacturing operations.6,7 Students can practice operations in a virtual environment without the need for actual equipment and materials, significantly reducing resource consumption and security risks.8,9 Secondly, the deep learning algorithm CNN was utilized to analyze real-time operational data of students. These algorithms can extract various features from the students’ operation process, such as operation accuracy, speed, and consistency, and provide personalized guidance and suggestions,10,11 helping students correct errors in a timely manner and improve their skill level. Finally, a detailed evaluation report was generated through an intelligent evaluation system. This evaluation system combines the analysis results of deep learning algorithms and can provide multidimensional, data-driven evaluation reports,12,13 including overall performance of students, advantages and disadvantages in operation, improvement suggestions, etc., providing comprehensive feedback for students and instructors.
The research results of this article significantly improve the efficiency, safety, and learning effectiveness of equipment manufacturing training, providing an innovative solution for international equipment manufacturing training. By combining virtual reality and deep learning technology, a more flexible, secure, and efficient training mode can be achieved to assist in the cultivation of equipment manufacturing talents.
Design and construction of virtual reality environment
In the process of developing a virtual reality international equipment manufacturing training platform that deeply integrates deep learning, the design and construction of the virtual reality environment is the core link, which directly affects the immersion, learning experience, and training effectiveness of students. This study first conducts an in-depth investigation into the training needs in the international equipment manufacturing field, clarifying the types of equipment, operating procedures, safety standards, and common fault simulation scenarios that the training platform needs to cover. Based on these requirements, the overall framework of the virtual environment is planned in detail, including the following implementation details: in terms of scene layout, modular design is adopted, and multiple customizable training scenes are created according to different equipment types and operation processes; in terms of interaction mode, gesture recognition and voice control functions are integrated, allowing students to interact with virtual equipment in a natural way; in terms of information presentation, a multi-level visual interface is designed, combined with real-time data feedback and virtual auxiliary prompts, to help students obtain real-time guidance during the operation process. In addition, in order to enhance teaching effectiveness, dynamic simulated fault scenarios and safety inspection mechanisms are integrated into each scenario, allowing students to learn how to deal with unexpected problems in a realistic environment. Through the design and implementation of these details, it is ensured that the virtual environment can not only simulate the real work environment in all aspects, but also effectively enhance students’ operational skills and safety awareness.14,15
3D modeling and scene construction
When building a deep learning-based virtual reality international equipment manufacturing training platform, the professional 3D modeling tool 3ds Max is utilized to provide a detailed and accurate reproduction of the real working environment in the equipment manufacturing industry. During the modeling process, strict adherence is made to the actual dimensions, appearance features, and material details of the equipment, while further refinement is carried out for complex scenes in actual work. In addition to routine equipment operations, complex work scenarios such as emergency maintenance scenarios, equipment failure simulations, emergency shutdown handling, and multi-equipment linkage troubleshooting are also integrated to enhance the authenticity and challenge of practical training. To enhance the immersion of students, special emphasis is placed on the fine simulation of physical properties, including the inertia of equipment motion, force feedback, and real-time transformation of environmental sound effects, striving to create an immersive experience in the virtual environment. Afterward, using industry-leading game engines such as Unity or Unreal Engine, carefully crafted models are integrated into a virtual scene that is both close to the actual production process and easy for students to operate. This scene not only covers meticulous workshop layout, orderly arrangement of equipment, and highly realistic lighting effects, but also specifically designs different process flows and task scenarios, such as the assembly process of complex workpieces, emergency handling operations, etc., thereby optimizing and improving the effectiveness of practical training in all aspects. 16
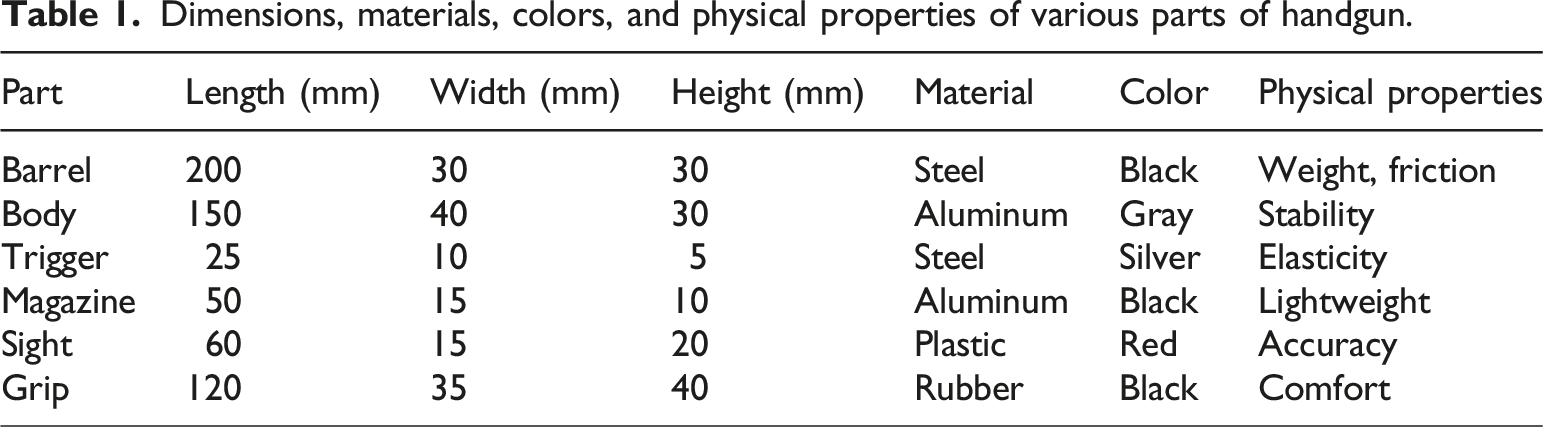
Dimensions, materials, colors, and physical properties of various parts of handgun.
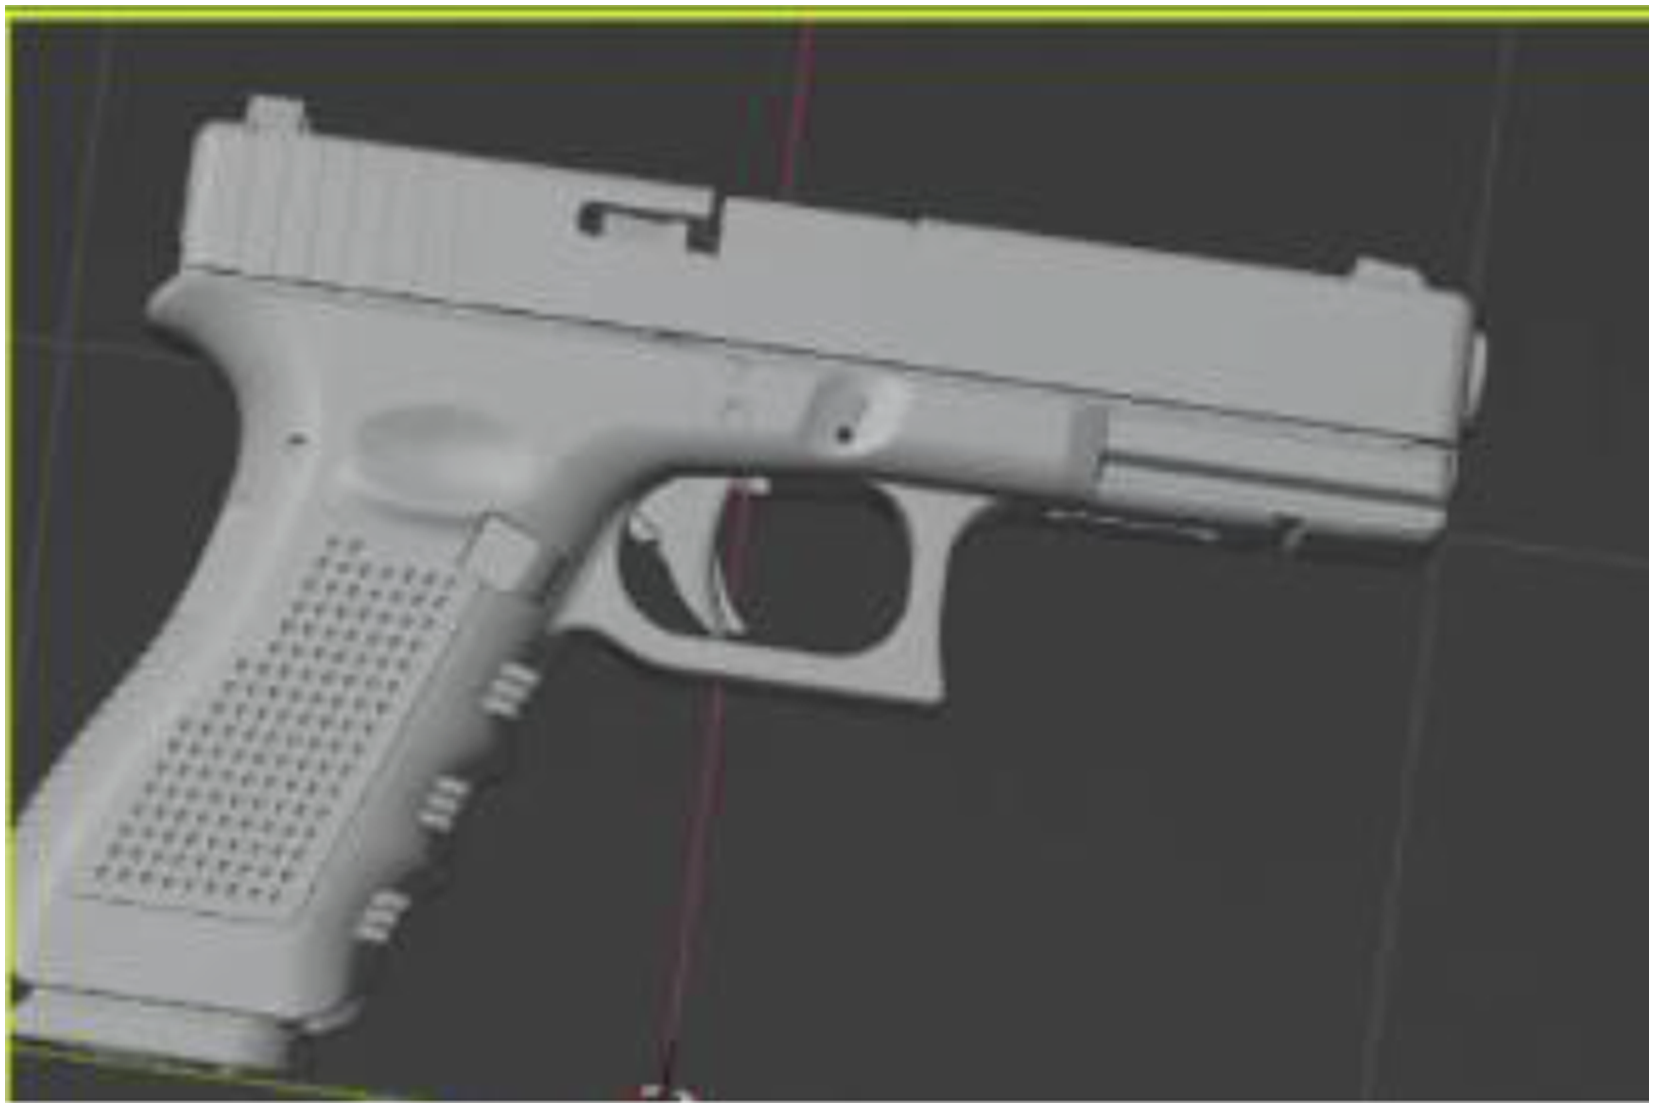
3D modeling of handgun.
To achieve natural interaction between students and virtual environments, this article designs multiple interaction mechanisms. By utilizing VR controllers, headsets, and other equipment, combined with gesture recognition, voice control, and other technologies, students can operate virtual equipment as if they are in a real environment. By simulating button presses, knob rotations, and other actions, students can control the equipment’s start, stop, parameter adjustments, and more. To enhance the user experience, more interactive elements are added, such as tactile feedback and visual prompt systems, to ensure that students can feel more authentic feedback during operation. At the same time, the Unity’s advanced PhysX physics engine is integrated to accurately simulate the interactions between equipment, including physical phenomena such as gravity, collision, and friction. By finely adjusting these physical parameters, the motion pattern of the equipment in the virtual environment is made as consistent as possible with the real world, thereby enhancing the immersion and authenticity of the operation in the virtual environment, and improving the learning effect of the students.
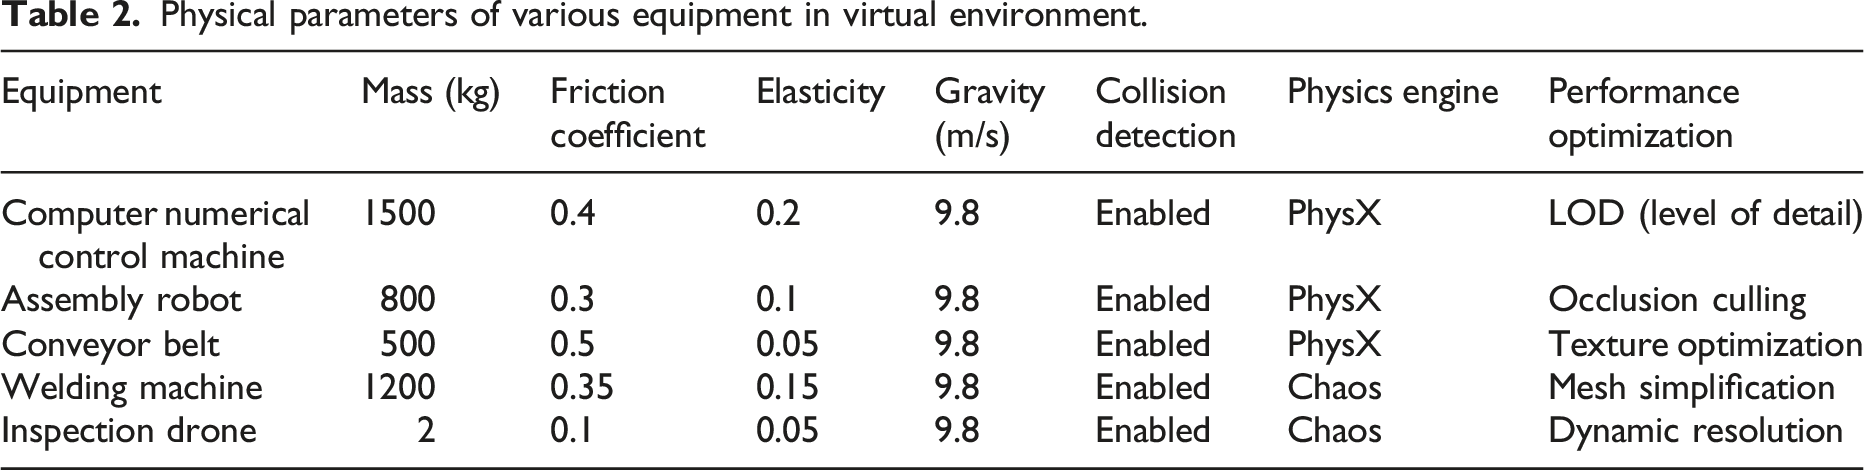
Physical parameters of various equipment in virtual environment.
Security and fault tolerance mechanism
Considering the security issues during the training process, strict and detailed security checks and fault tolerance mechanisms are set up in the virtual environment. The system identifies potential security risks by monitoring students’ operational behavior and environmental status in real-time. For dangerous operations (such as entering a hazardous area without wearing protective equipment), the system immediately triggers a multi-level warning mechanism, first reminding students to pay attention through visual and sound effects, and then automatically suspending the relevant operations according to the specific situation. In addition, the fault tolerance mechanism includes allowing learners to perform simulated corrective actions after safety prompts, and assisting them in completing tasks correctly through virtual guidance. These measures ensure that students can learn in a controlled and secure virtual environment, reducing the risks that may be encountered during the training process. Sensors are used to monitor the movements and positions of students. When a student attempts to perform a dangerous operation, the system immediately issues a warning and prevents the operation. Real-time location tracking is the key to ensuring students’ correct positioning in virtual environments, which can be achieved through technologies such as GPS (Global Positioning System), UWB (Ultra-Wideband), infrared tracking, etc.
Figure 2 shows a bar chart comparing the accuracy of GPS, UWB, and infrared tracking technologies at different time points using data. The horizontal axis represents time, from 1 to 10 time points, used to display accuracy data for different time periods; the vertical axis represents accuracy, measured in percentage (%), which measures the performance of each tracking technique at a specific point in time. From Figure 2, it can be seen that the GPS accuracy (blue bar) fluctuates between 60 and 80%. The UWB accuracy (orange bar) fluctuates between 70 and 90%. The tracking accuracy (yellow bar) fluctuates between 85 and 95%. The data changes indicate that the accuracy of GPS fluctuates randomly and has a low range, indicating that its accuracy at different time points is not stable and has certain fluctuations. The accuracy range of UWB is relatively high, but there are still fluctuations, showing higher accuracy than GPS, but slightly less stability. The accuracy of infrared tracking technology fluctuates less and has the highest range, indicating that its accuracy at different time points is not only higher, but also more stable. Based on this analysis, infrared tracking and other technologies are selected to ensure that students can accurately locate themselves in the virtual environment. Accuracy of GPS, UWB, and infrared tracking.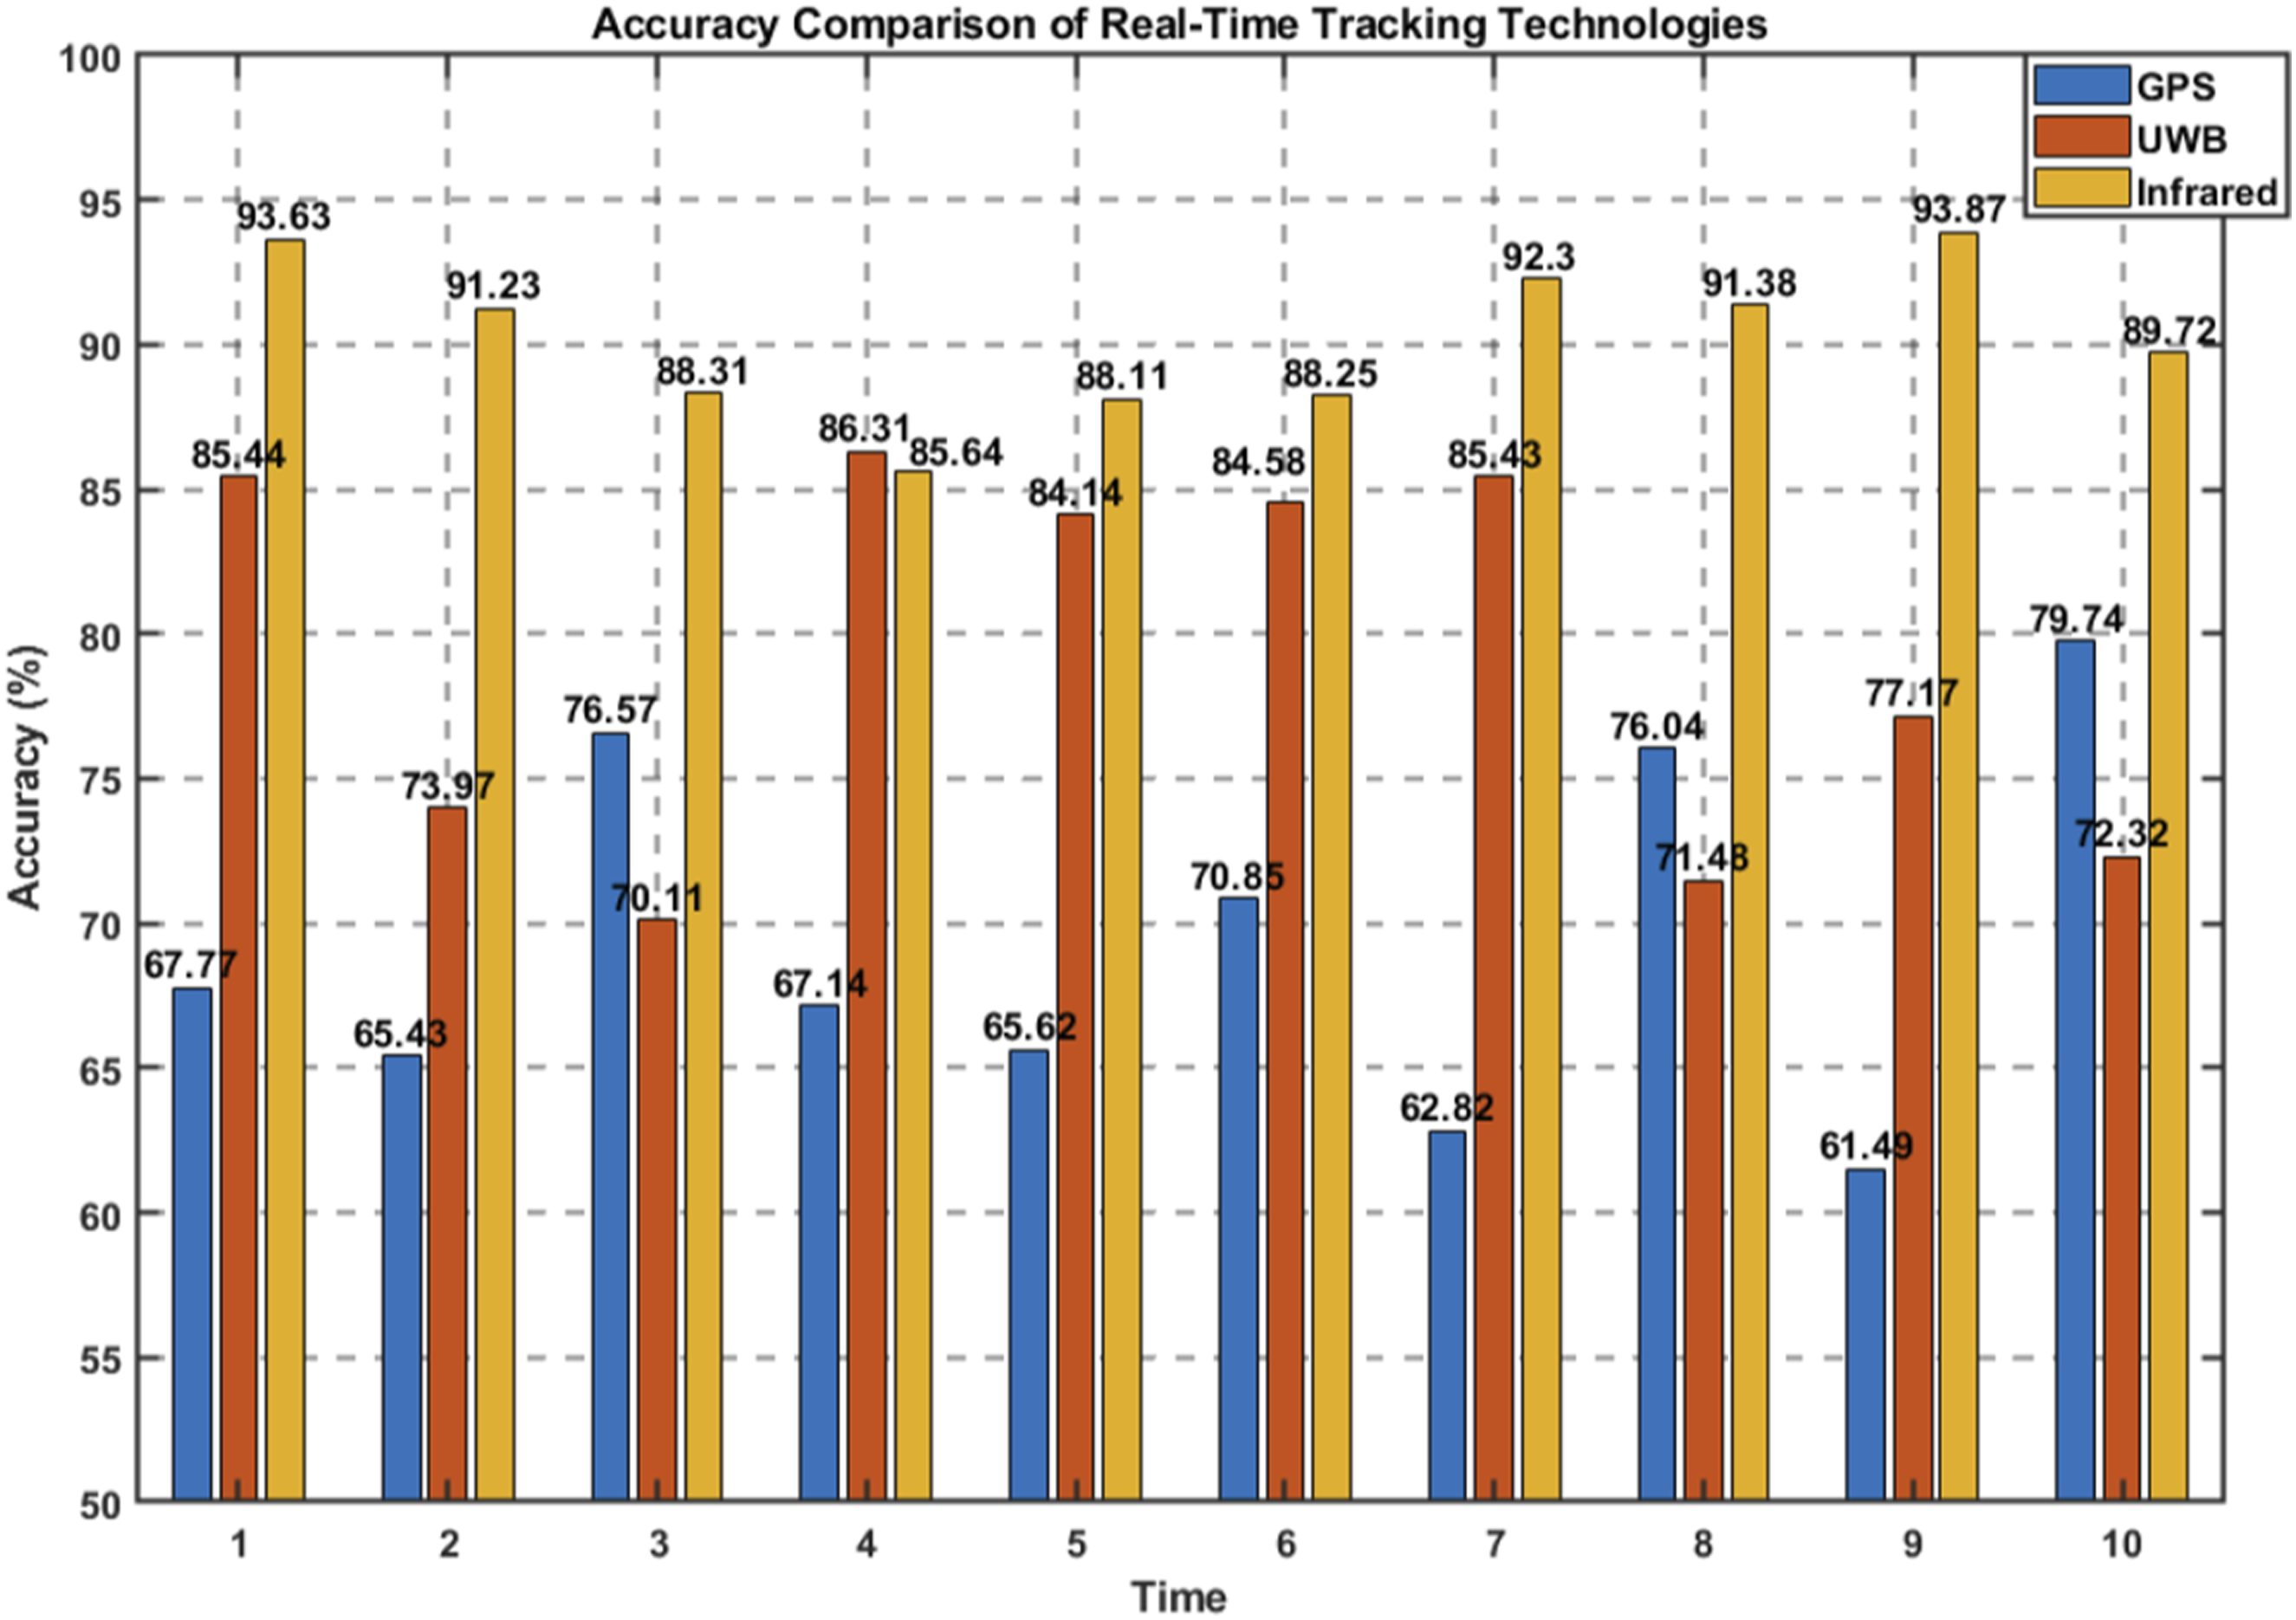
Application of deep learning algorithms
In the virtual reality international equipment manufacturing training platform based on deep learning, the application of deep learning algorithms is the key to improving the platform’s intelligence level, achieving personalized teaching and automatic evaluation.
Data collection and preprocessing
Firstly, a comprehensive data collection system is established to capture real-time operational behavior data of students in the virtual environment, including but not limited to operation sequences, timestamps, equipment status changes, error occurrences, etc. In order to ensure data quality, strict data cleaning and preprocessing processes are implemented, including removing noisy data, handling missing values, data standardization, etc., providing high-quality datasets for subsequent algorithm training. 18
Figure 3 shows the comparison between the raw data and the cleaned data. The horizontal axis (X-axis) represents time, in units of time points, from 1 to 100; the vertical axis (Y-axis) represents data values, measured in simulated numerical changes. The red curve represents the raw data, which includes noise and missing values. The blue curve represents the data after cleaning. The cleaning process includes filling missing values and removing noise. Missing values are filled in using linear interpolation method, while noise is smoothed using moving average method. It can be clearly seen that the cleaned data is smoother than the raw data, with missing values effectively filled in, making the data more continuous and stable, suitable for further analysis and processing. Process diagram of data collection, cleaning, and standardization.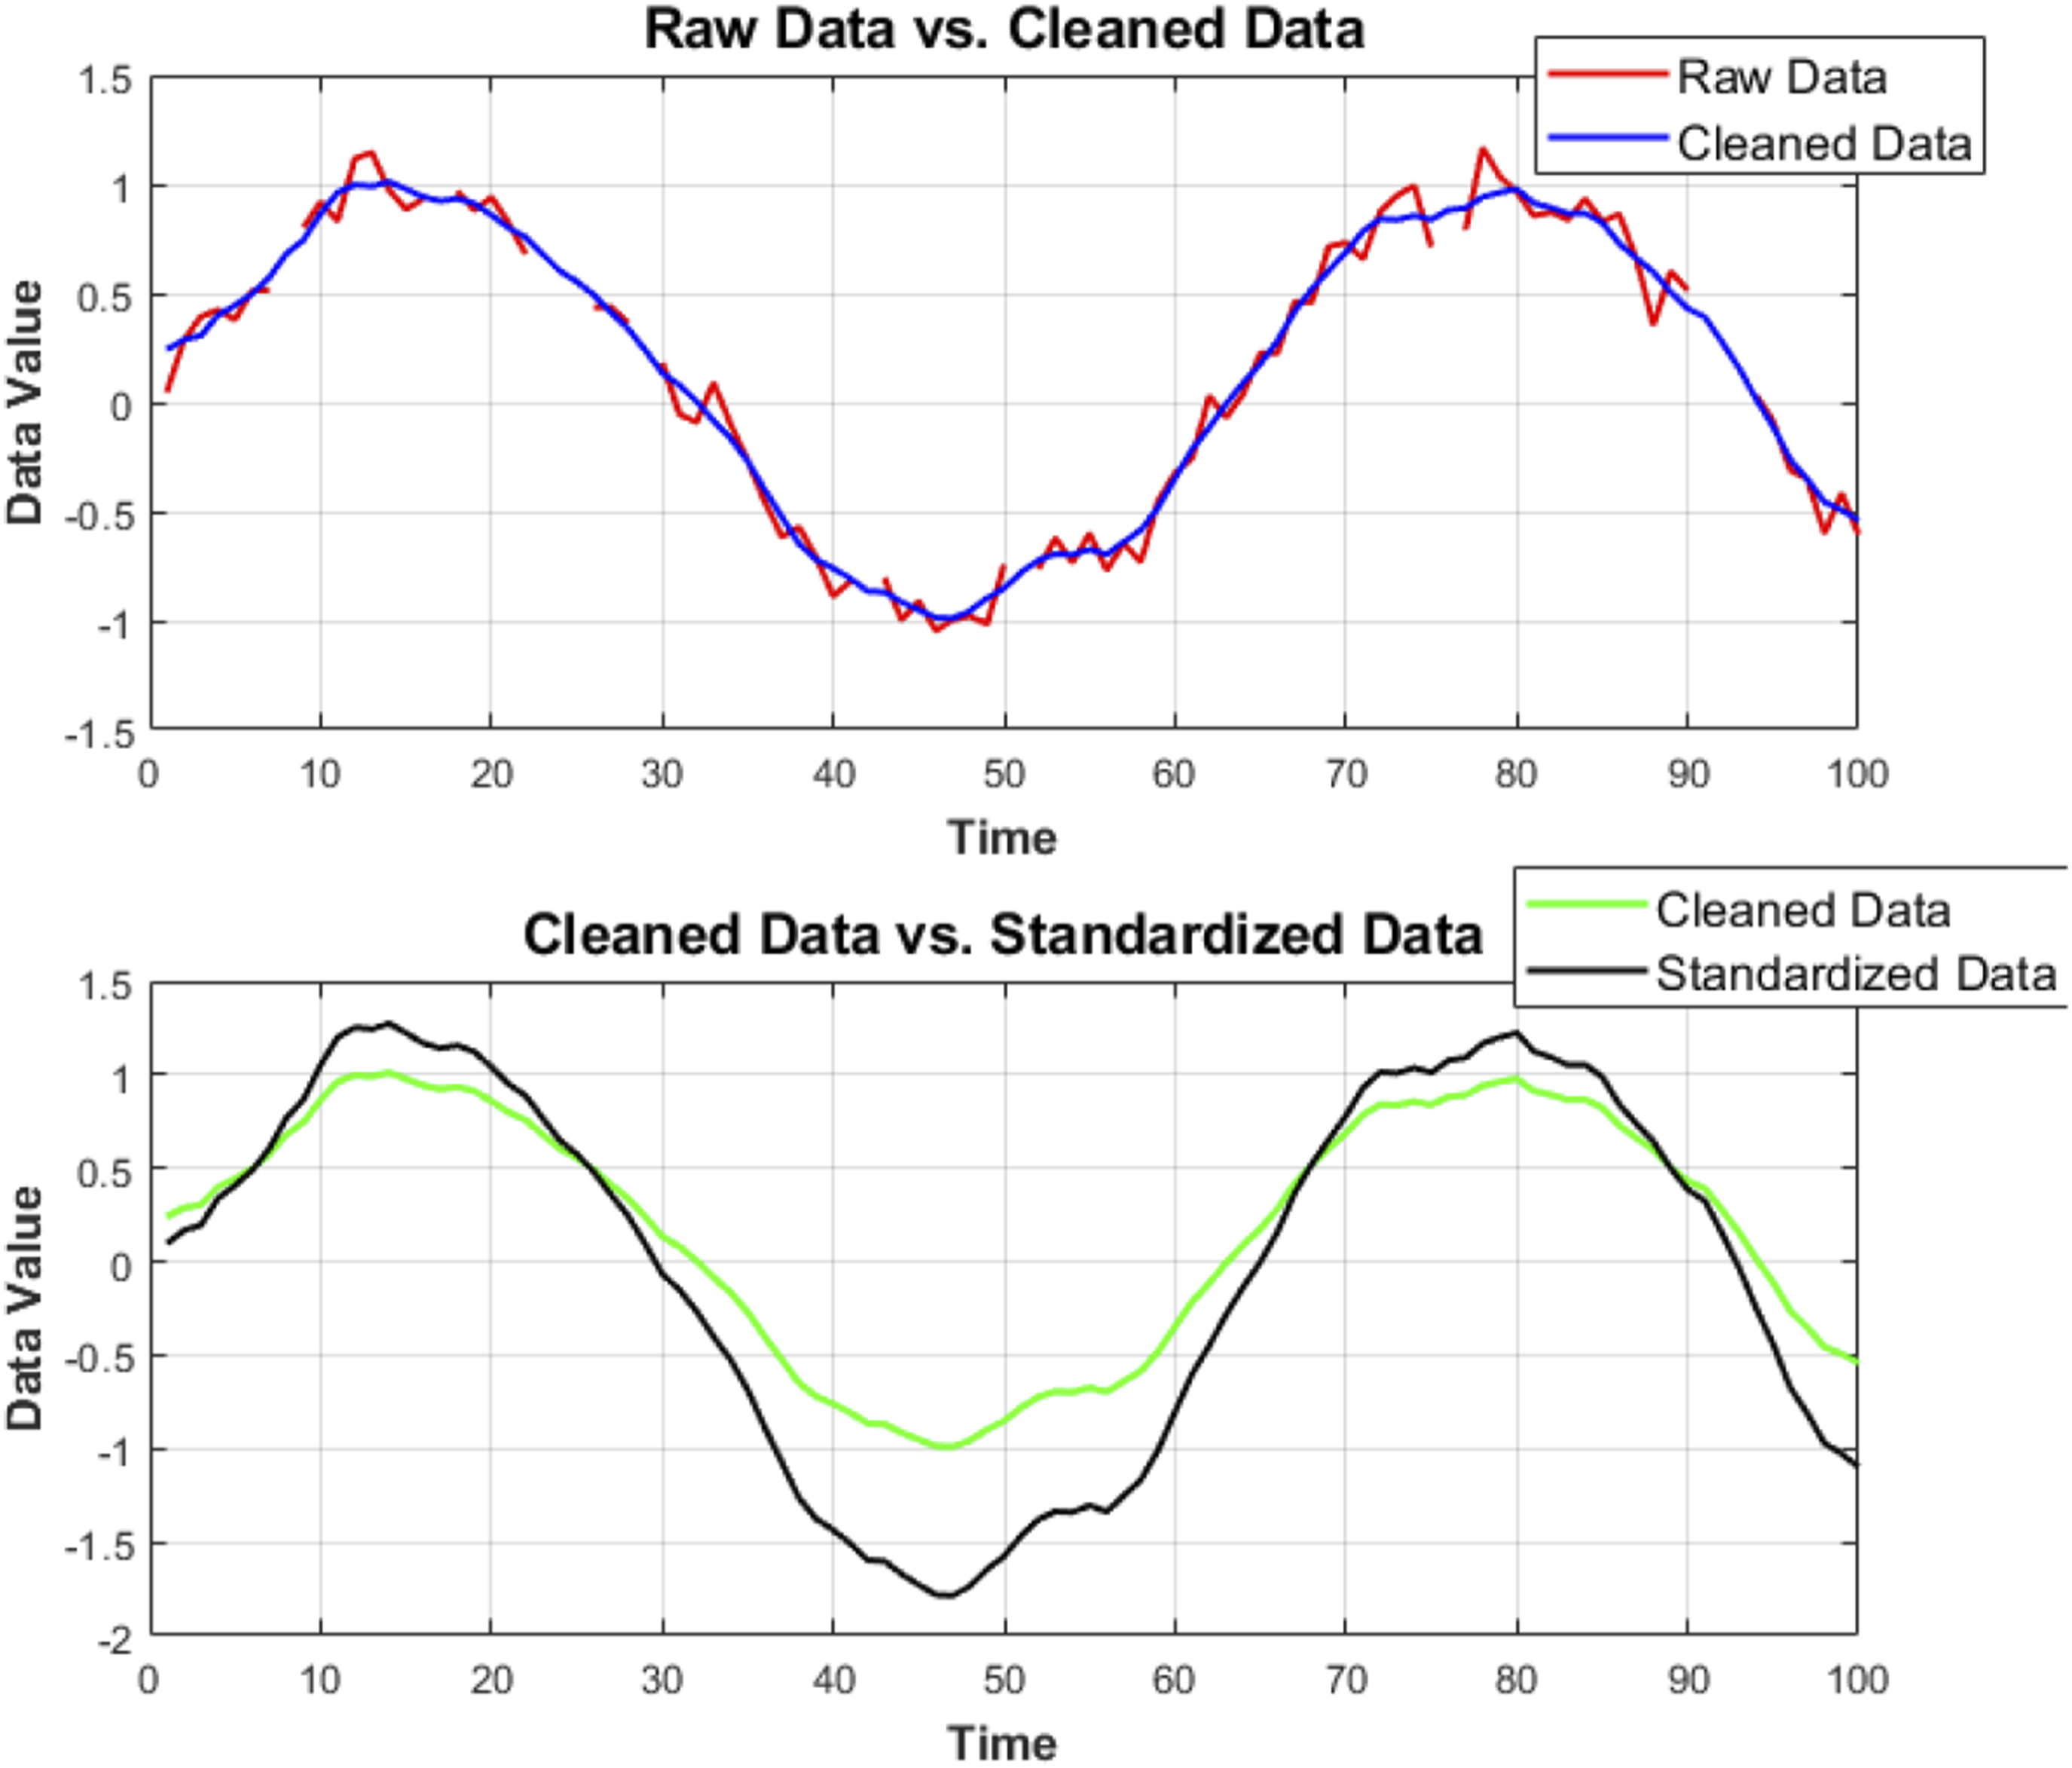
Figure 3 shows a comparison between cleaned data and standardized data. The horizontal axis (X-axis) represents time, in units of time points, from 1 to 100; the vertical axis (Y-axis) represents the data value, with a unit of numerical variation. The green curve represents the cleaned data, which has been processed by filling in missing values and removing noise. The black curve represents the standardized data. The standardization process adjusts the cleaned data to a range with a mean of 0 and a standard deviation of 1, achieved through formula (1). Figure 3 and formula (1) demonstrate the effect of data standardization. The standardized data distribution is more uniform, eliminating the influence of data dimensions and helping to improve the training effectiveness of the algorithm and the performance of the model.
Selection and training of deep learning models
Multiple deep learning models are selected and optimized for the specific needs of equipment manufacturing training, including convolutional neural network (CNN), recurrent neural network (RNN) and its variant LSTM (long short-term memory), as well as attention mechanism models. In specific task applications, CNN is mainly used for processing image and video data, such as evaluating students’ hand-eye coordination ability and operational accuracy; RNN and LSTM perform well in analyzing time series data during student operations, identifying operational habits, predicting operational trends, and detecting potential issues; the attention mechanism model effectively captures key operational features in complex scenes, improving the accuracy and efficiency of analysis. Through the comprehensive application of these models, the training platform can more comprehensively and accurately evaluate the skill level of students and provide personalized improvement suggestions. The CNN model is used to extract spatial features during the operation process, such as hand movement trajectories, equipment state changes, etc.19,20 RNN and LSTM models are used to capture temporal dependencies in operation sequences, in order to gain a deeper understanding of learners’ operational logic and processes. RNN is suitable for processing shorter sequence data, while LSTM effectively solves the long-term dependency problem by applying gating mechanisms, enabling it to maintain important information in long sequences. The combination of these two models can more accurately analyze students’ operational patterns and skill development. Attention mechanism is used to enhance the model’s attention to key operations or error points, improving the accuracy and pertinence of evaluation. 21
During the model training phase, supervised learning is adopted to train the model using a carefully annotated dataset. Through multiple iterations and parameter adjustments, the model is continuously optimized to achieve the best performance indicators. To further improve training efficiency and model performance, it is planned to apply a more advanced optimization algorithm, Adam optimizer, which can adaptively adjust the learning rate and help the model converge to a better solution faster, thereby enhancing the model’s generalization ability and practical application effectiveness.
Figure 4 shows the variation of loss values during the training process of different deep learning models to evaluate the training effectiveness and optimization process of the models. The horizontal axis represents the epochs of training, which is the number of times the model is trained on the dataset. The vertical axis represents the training loss value (Loss), which is the measure of the model’s loss after each round and usually reflects the model’s prediction error. Comparison of training process.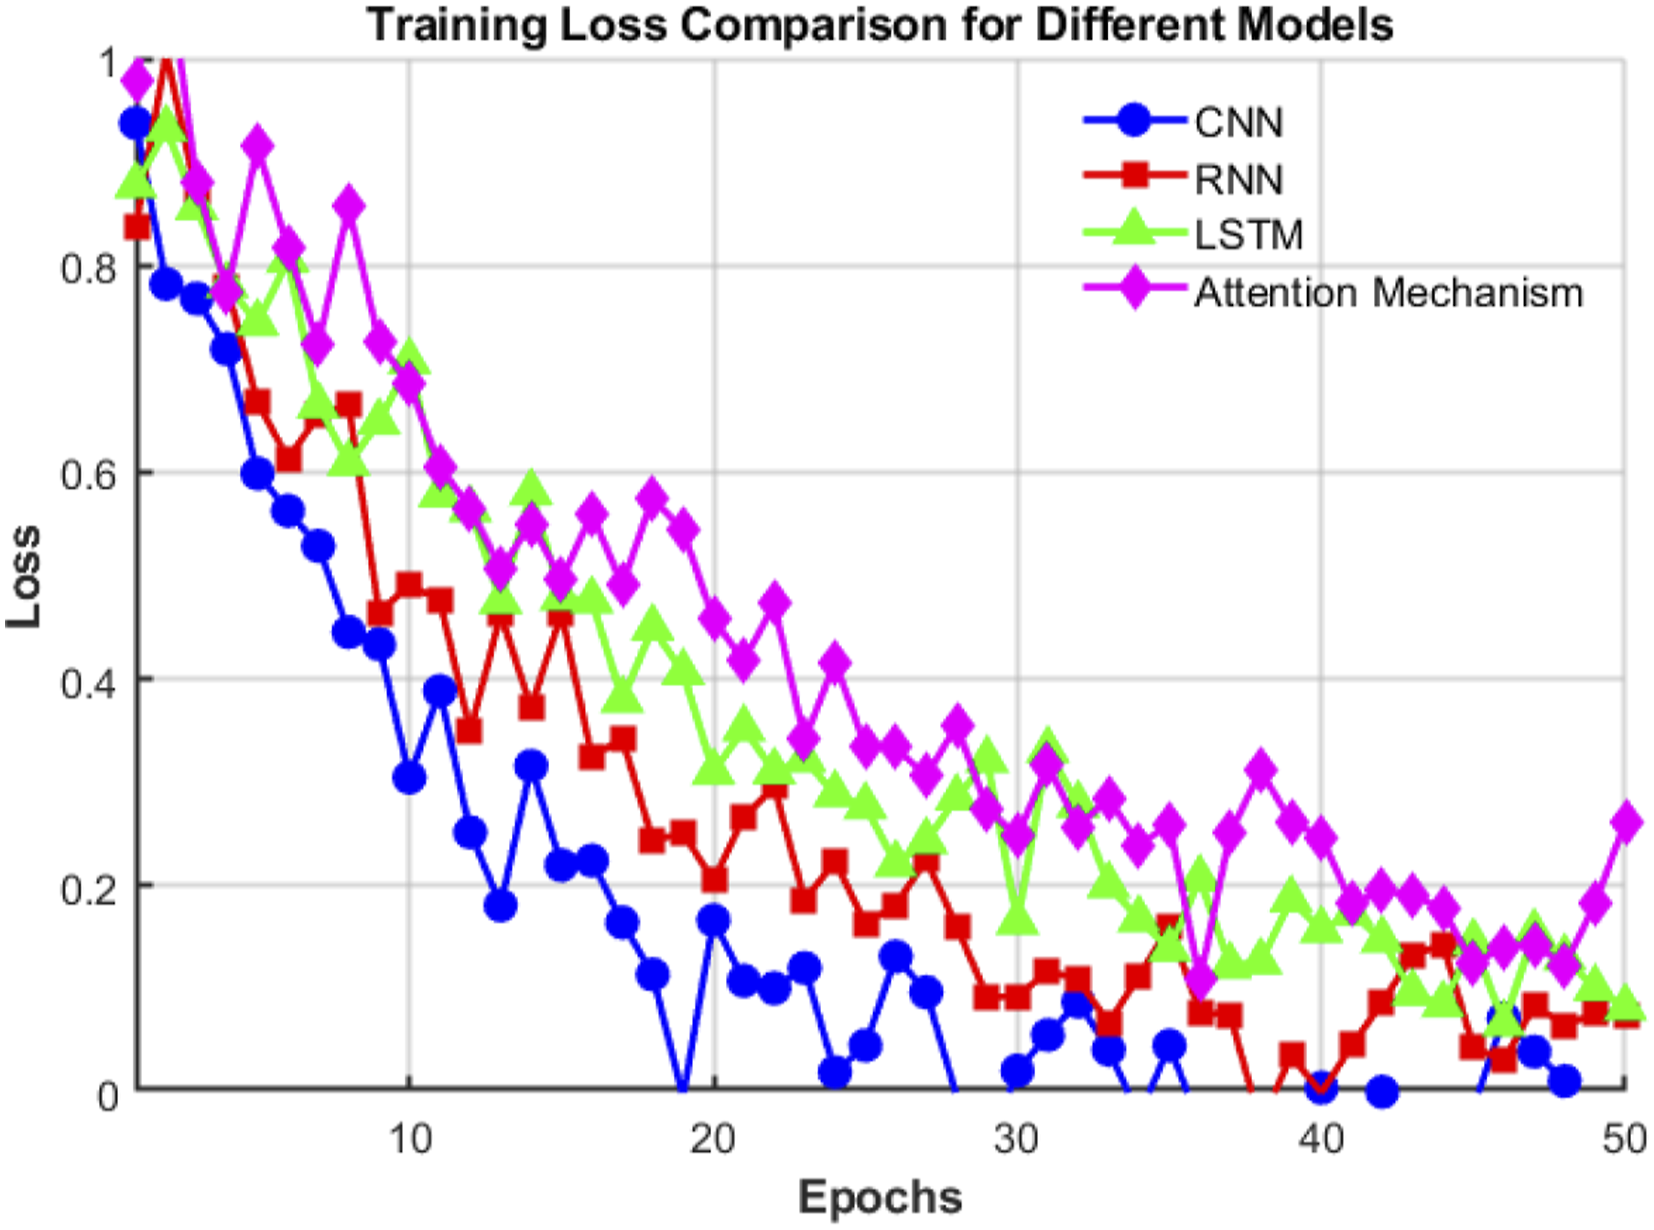
Convolutional neural network (CNN): in the early stages of training, the loss value of the CNN model is 0.93, and as the training progresses, the loss value gradually decreases. The loss value of the CNN model decreases rapidly in the initial stage, demonstrating good convergence and learning ability. The decrease in magnitude in the later stage indicates that the performance of the model tends to stabilize. Recurrent neural network (RNN): the loss value of the RNN model is initially 0.82 and gradually decreases as training progresses, with a loss value of 0.08 in the 50th round. The decreasing trend of loss values in RNN models is slightly slower than that in CNN. LSTM Network: the LSTM model has an initial loss value of 0.89 and a loss value of 0.09 by the 50th round. The loss value of the LSTM model changes smoothly, demonstrating its advantage in capturing long-term dependencies. Attention mechanism model: the initial loss value of this model is 0.98. During the training process, the loss value gradually decreases and finally drops to 0.23 in the 50th round. The decrease in loss value of the attention mechanism model is relatively small, indicating that the model performs average in focusing on key operations and error points.
During the training process, the loss values of all models show a decreasing trend, indicating that as the training epochs increase, the fitting ability of the models on the data gradually improves. CNN and recurrent neural networks show a rapid decrease in loss values during the early stages of training, demonstrating their strong learning ability. These changes indicate the convergence and learning ability of the models: the loss values of CNN models and recurrent neural networks decrease rapidly in the early stages, indicating that they have good initial convergence in data learning and feature extraction. After iterative analysis, CNN is selected as the main deep learning model for equipment manufacturing training, mainly based on its outstanding performance in image and video data processing, especially in feature extraction and classification accuracy. RNN, as an auxiliary model, benefits from its advantages in processing time series data and capturing dynamic changes during the operation process, making it suitable for analyzing the time-dependent patterns of students’ operating habits and skill levels.
Automatic evaluation and report generation
Deep learning algorithms also play an important role in automatic evaluation. This article designs an evaluation index system that covers multiple dimensions such as operational accuracy, efficiency, and safety, such as the correct execution rate of operational steps, task completion time, and compliance with equipment safety regulations.22,23 By comprehensively analyzing the operational data of students through the model, the system can automatically calculate the scores of students on each specific evaluation indicator. For example, the system evaluates the accuracy (such as whether the operation steps are correct), efficiency (such as the time required to complete the task), and safety (such as whether they comply with safety operating procedures) of students when performing specific operations. Based on these data, the system generates a detailed evaluation report, which not only includes the overall performance rating of the students, but also deeply analyzes their strengths and weaknesses, providing specific improvement directions for the students, and also providing teaching references for teachers to better adjust the teaching content accordingly.
Figure 5 shows the performance of two students on 10 evaluation metrics, including operational accuracy, efficiency, safety, consistency, speed, adaptability, precision, coordination, innovation, and decision-making ability. The radius axis from 0 to 100 represents the score range. From Figure 5, it can be seen that the specific scores of the two students on each indicator are marked on the radar chart and displayed with text labels for intuitive comparison. Among them, the left student scores 90 for operational accuracy, 80 for efficiency, 85 for safety, 70 for consistency, 88 for adaptability, 92 for accuracy, 85 for coordination, 77 for innovation, 82 for decision-making ability, and 75 for speed. These scores indicate the performance level of the students in different aspects. Overall, the students on the left have shown outstanding performance, particularly in terms of operational accuracy and precision. Students can further enhance their abilities in consistency and innovation to comprehensively improve their overall quality. The system can develop more targeted training plans for students based on this data to help them make greater progress in weak areas and maintain their strengths. Radar chart of student evaluation index scores.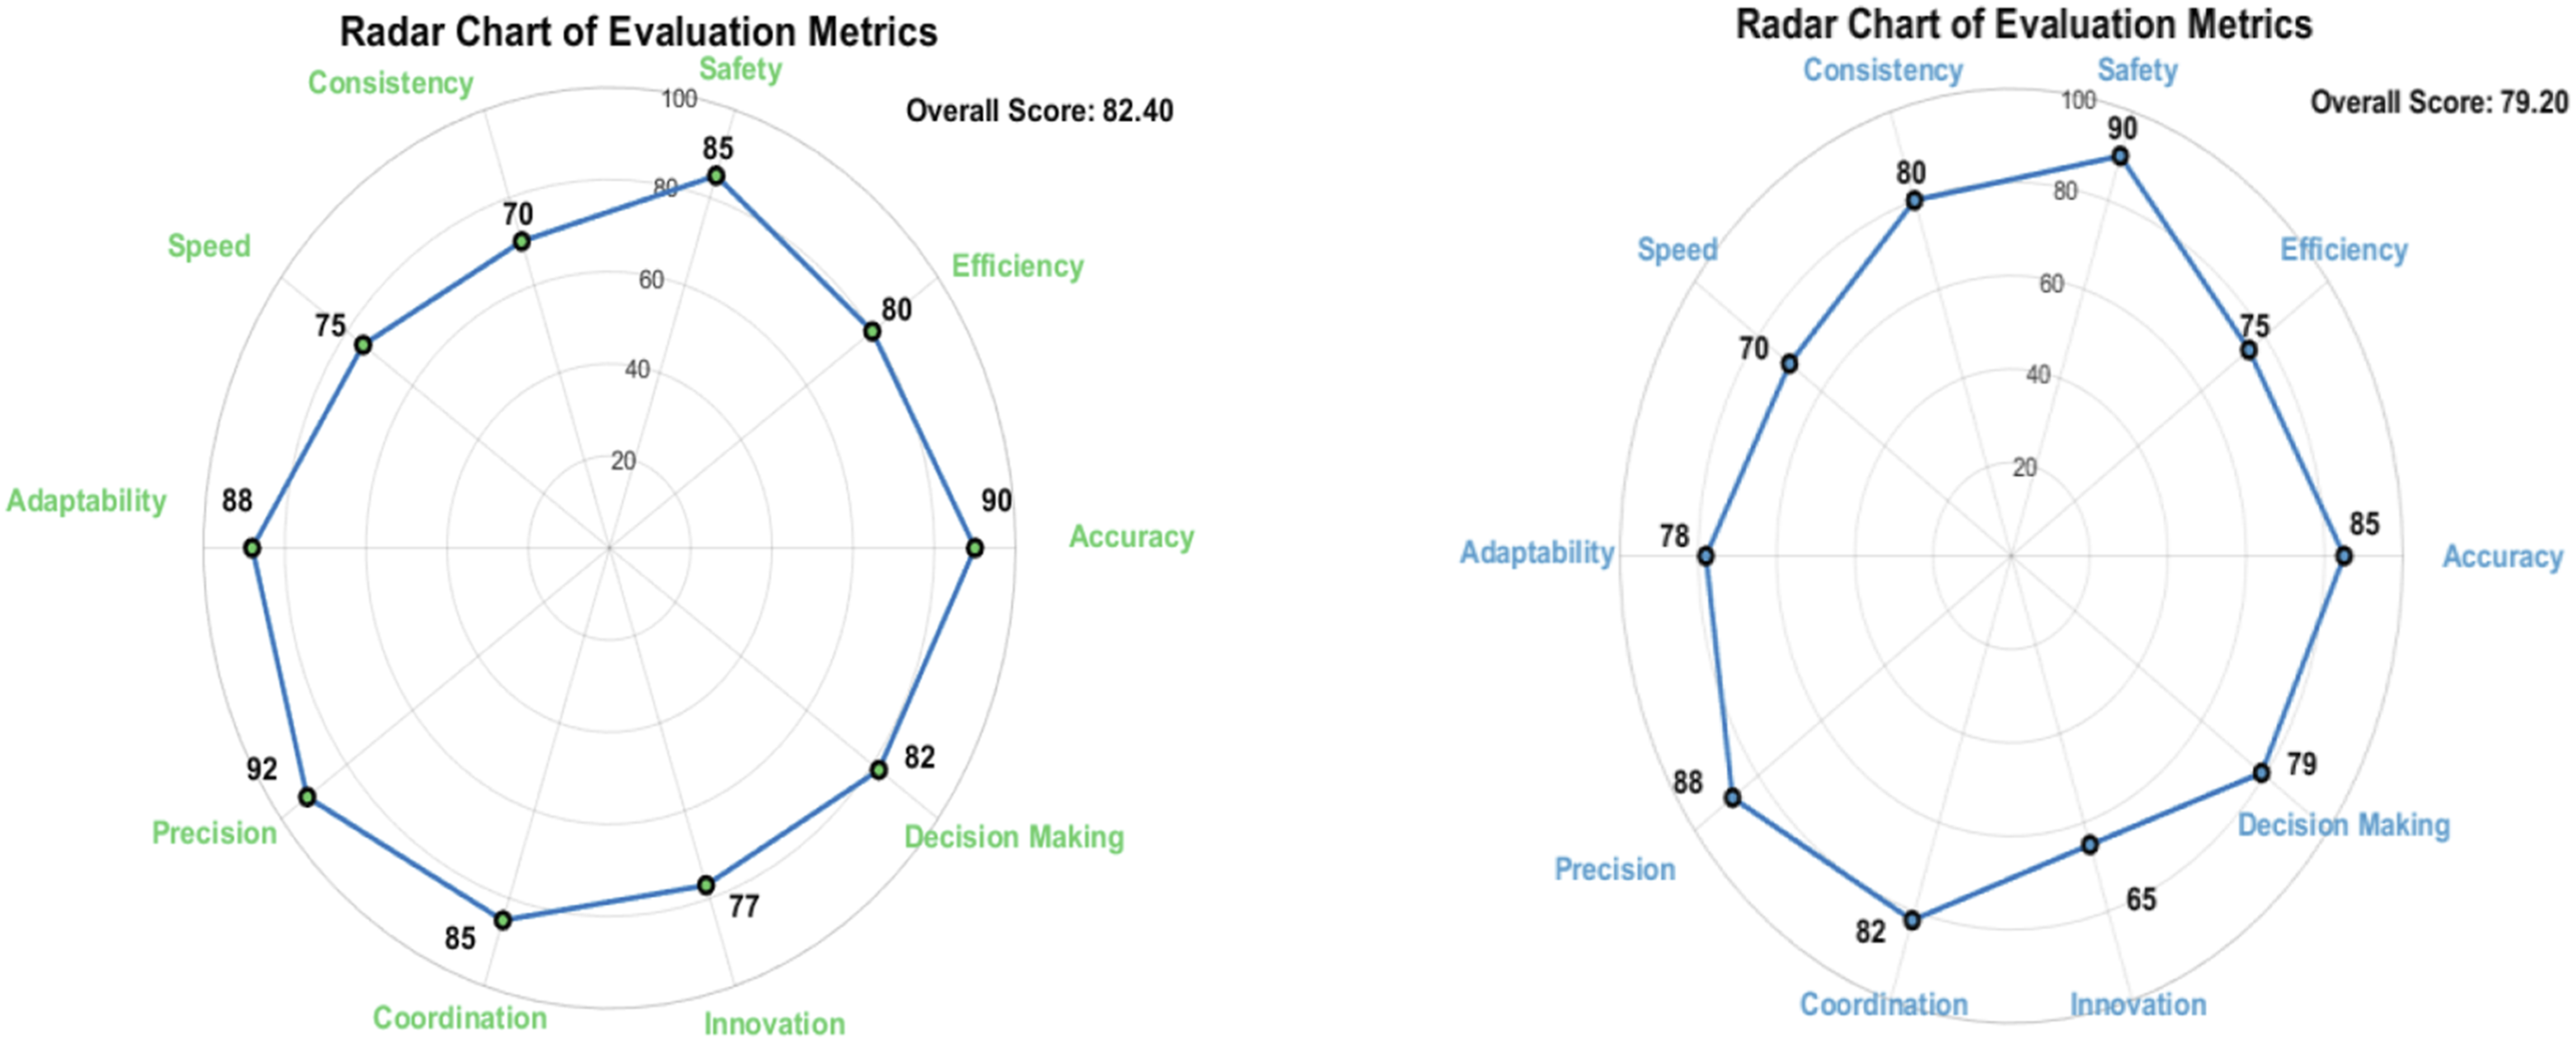
Development of intelligent evaluation system
In the virtual reality international equipment manufacturing training platform based on deep learning, the development of an intelligent evaluation system is a key link to ensure the quantification of learning effectiveness and the accuracy of feedback. The system utilizes deep learning algorithms to analyze students’ operational data, evaluate their performance from multiple dimensions, quantify various skill levels, and provide personalized improvement suggestions. In this way, the evaluation system not only improves the objectivity and accuracy of the assessment, but also provides targeted feedback to students to help them improve their skills more effectively.
Construction of evaluation indicator system
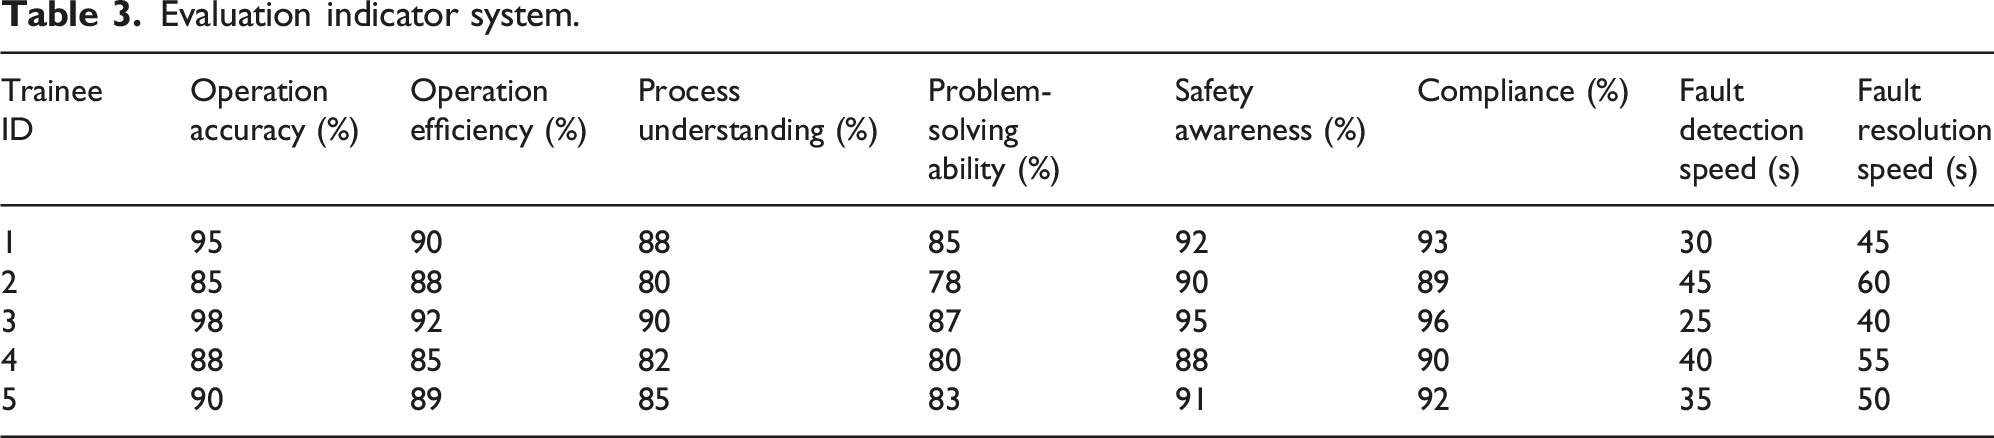
Firstly, based on the core skill requirements and teaching objectives of equipment manufacturing training, a comprehensive and detailed evaluation index system is constructed, which covers multiple dimensions such as operational skills, process understanding, problem-solving ability, and safety awareness.24,25 Each dimension is further subdivided into several specific indicators, such as operational accuracy, efficiency, compliance, fault identification and elimination speed, etc.
Evaluation indicator system.
Application of deep learning models in evaluation
Firstly, the classification and regression models in deep learning are used to deeply mine and analyze the operational data of the students. By training these models, it is possible to identify the performance levels of learners on different skill indicators and provide corresponding ratings.26,27 The reason for choosing the CNN model to process video data is mainly due to its significant advantages in feature extraction. CNN excels at automatically extracting spatial and temporal features from videos, effectively identifying students’ hand-eye coordination and fine motor skills. Specifically, CNN extracts local features from images through convolution operations and reduces computational complexity and feature dimensionality through pooling operations, thereby enhancing the model’s attention to important features and improving processing efficiency. These features make CNN superior in processing complex visual data, where the convolution operation is:
Among them,
The pooling operation is:
Among them, the maximum pooling operation
Loss function: for classification tasks, cross entropy loss function can be used:
Among them, 
Among them, 
Among them, 
By discussing formulas (2)–(7), how to construct and evaluate deep learning models for analyzing student operational data can be rigorously described. These formulas cover the basic units of the model, as well as the loss functions and evaluation metrics used to optimize and evaluate the performance of the model.
Overall performance and rating of students.
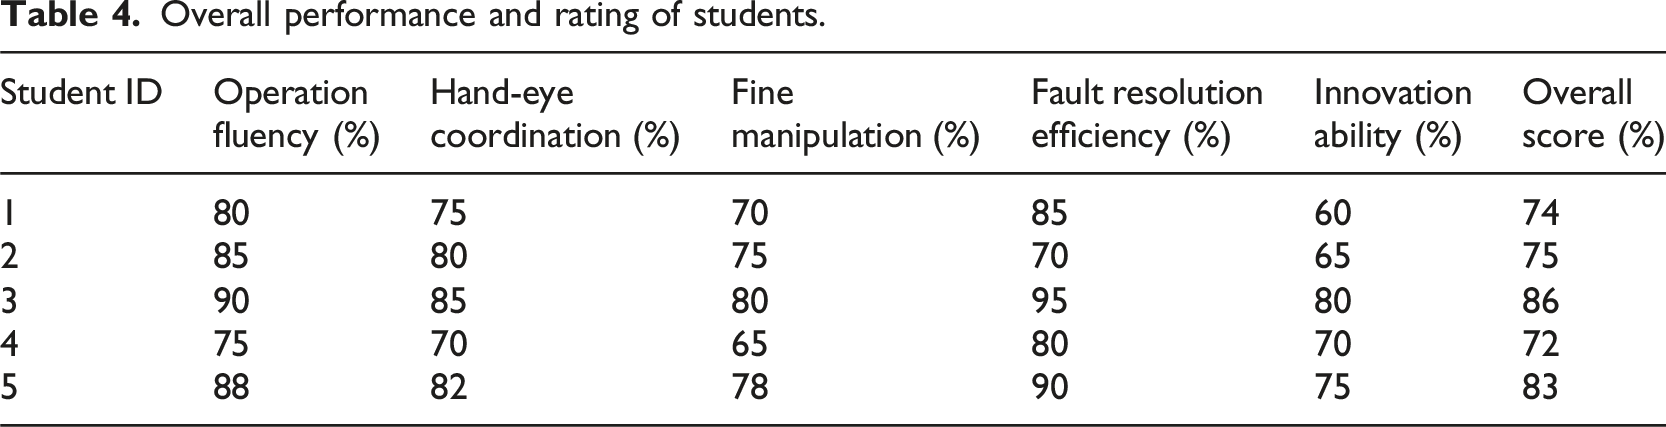
In terms of skill level assessment, the LSTM model is used to analyze the operational fluency of students, and it is found that student 003 has the highest operational fluency, at 90%. The hand-eye coordination ability is evaluated by processing video data using a CNN model, and student 003 still performs the best, reaching 85%. In terms of fine operation ability, student 003 scores 80%, indicating a strong level of fine operation skills. In the assessment of problem-solving ability, students need to solve faults in a reinforcement learning simulation environment and record their fault solving efficiency. Among them, student 003 has the highest efficiency, at 95%. In addition, the evaluation of innovation ability is analyzed through deep learning models, and the innovation ability score of student 003 is 80%.
In the comprehensive evaluation and report generation, the system uses multi-objective optimization algorithms to weight and synthesize various evaluation results. Student 003 has the highest overall score of 86%. The detailed evaluation report also includes the specific performance of the students on each individual indicator. For example, the fault resolution efficiency of student 001 is 85%, but their innovation ability is relatively low, only 60%. Through these data and evaluation results, it can comprehensively reflect the skill level and problem-solving ability of the students, and provide targeted improvement suggestions to enhance the overall teaching effectiveness and practical operation ability of the students.
Integration testing and system evaluation of the practical training platform
In the development process of a deep learning-based virtual reality international equipment manufacturing training platform, the integration and testing of the platform are key links to ensure the collaborative work, stable performance, and good user experience of various functional modules. The module division of the platform includes virtual reality environment module, deep learning algorithm module, intelligent evaluation system module, and user interaction interface module. The virtual reality environment module is responsible for creating realistic virtual scenes; the deep learning algorithm module is used to process and analyze student operation data; the intelligent evaluation system module comprehensively evaluates the performance of students and generates feedback; the user interaction interface module provides an interaction interface with the system. Each module is independently developed and communicates and exchanges data through pre-defined interfaces. These interfaces follow unified standards and specifications to ensure compatibility and scalability between modules. However, during the integration process, several specific challenges are encountered, such as inconsistent data formats between different modules and interface communication delays. To address these issues, interface adapters and optimization algorithms are employed to ensure smooth data flow and collaborative functionality between modules. 28 In the integration process, this article uses advanced dependency management tools (such as Maven or Gradle) to manage the dependency relationships between modules, ensuring that there are no version conflicts or missing dependencies during the integration process. These tools can automatically parse and download the required dependencies, simplifying the integration process. In addition, version control systems such as Git are used to record every integrated change facilitates tracking, backtracking, and quick problem fixing, significantly improving the efficiency and stability of integration.
In order to improve integration efficiency, the platform has applied automated integration tools such as Jenkins and GitLab CI/CD, and used continuous integration/continuous deployment (CI/CD) systems. These tools can automate processes such as building, testing, and deploying. For example, Jenkins can automate the running of test scripts, detect code changes, and validate their impact on existing functionality, while GitLab CI/CD allows for multi-team parallel development and real-time integration of new code changes. Through these tools, problems in the integration process can be detected and reported in a timely manner, significantly reducing manual intervention and integration time, while also improving integration quality and efficiency.29,30
In Figure 6, the horizontal axis represents the integration stage, covering seven steps, while the vertical axis represents the time required for each stage (in minutes) and the corresponding error. The data shows a comparison of the time required for manual integration and automated integration at each integration stage. For example, in the “Build” phase, the time for manual integration is 30 min, while the time for automated integration is 10 min. The error of manual integration is 2 min, and the error of automated integration is 1 minute. The data shows that in all stages, the automated integration significantly reduces the required time and has relatively small errors. This reflects that automated integration has significant advantages in efficiency and accuracy compared to manual integration. Specifically, as the integration phase progresses, the automated system can not only significantly reduce the completion time of each stage, but also reduce time fluctuations (errors), indicating that the automated integration improves the overall efficiency and stability of the integration process. Comparison of time required for manual integration and automated integration.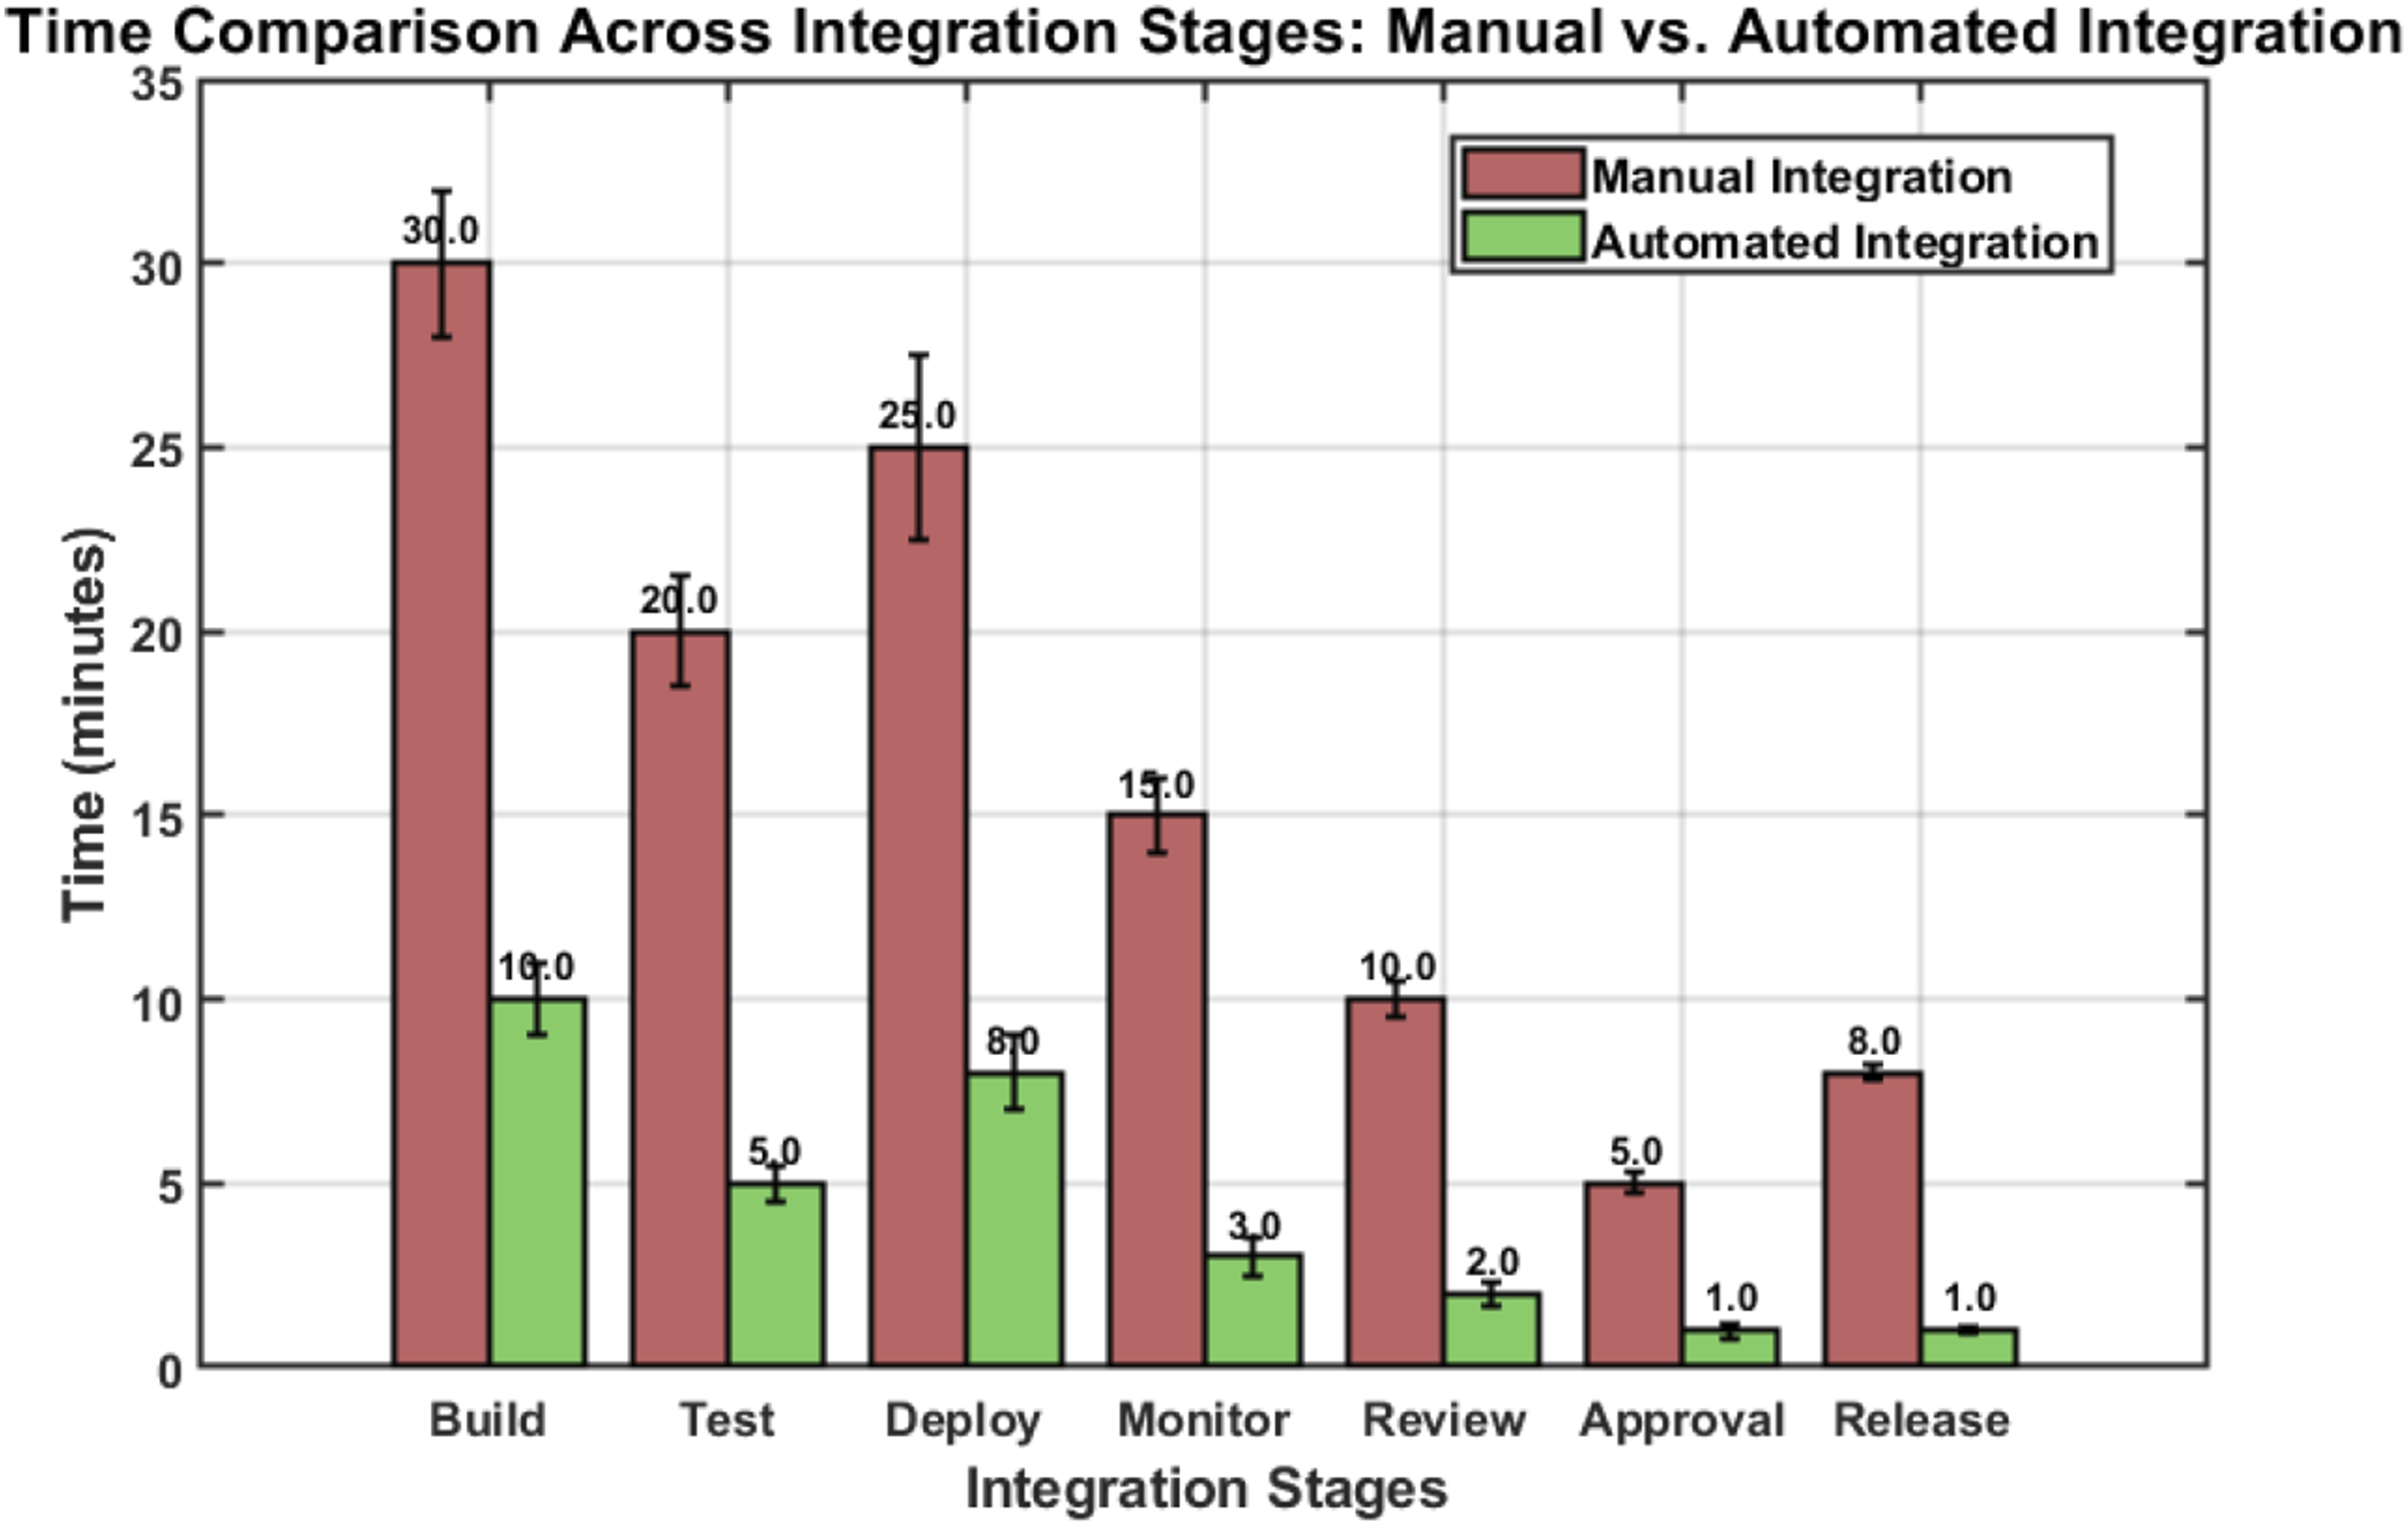
Testing methods and processes
Before module integration, unit testing is conducted first. The developers of each module are responsible for writing test cases to comprehensively test the functionality, performance, boundary conditions, and other aspects of the module. Unit testing uses automated testing frameworks such as JUnit and pytest to ensure accuracy and reproducibility of testing. The coverage rate of unit testing reaches 95%, significantly reducing the occurrence rate of internal errors in the module. After module integration, integration testing is conducted, focusing on verifying whether the interfaces between modules are correct, whether data exchange is smooth, and whether the functions work together as expected. Integration testing designs multiple scenarios to simulate different user operations and environmental changes, such as high concurrency access and sudden exception handling. During the system testing phase, target users are invited to participate in the testing and their feedback is collected. The testing content includes platform performance, user experience, interface friendliness, etc. User feedback can indicate whether the platform’s operational fluency and response speed meet expectations. In addition, stress testing and compatibility testing are conducted, and based on the results, the platform is analyzed to maintain stability under various concurrent user scenarios, with good compatibility across different operating systems and browsers. Based on these results, the platform is optimized and adjusted to further improve overall performance and user experience.
Performance testing is used to evaluate the performance of the platform under high loads. Performance testing tools such as JMeter and LoadRunner are used to simulate multi-user concurrent access and large data processing scenarios, and monitor key indicators such as platform response time, throughput, and resource utilization. Through these tests, it is ensured that the platform can meet the performance requirements in actual use and maintain stability under high loads.
The left figure in Figure 7 shows the response time of the platform under different concurrent user numbers, using logarithmic scales to display data changes and adding error bars to show data fluctuations. The horizontal axis (X-axis) represents the number of concurrent users, ranging from 10 to 5000, using a logarithmic scale. The vertical axis (Y-axis) represents the response time in seconds, ranging from 0.1 s to 2 s, using a logarithmic scale. The blue curve and blue marked points represent response time. The blue error bar represents the 10% error range of the response time. These data points show an upward trend in response time as the number of concurrent users increases. Especially during the growth process from 10 to 500 concurrent users, the response time gradually increases. Then, as the number of concurrent users continues to increase to 50 or more, the response time significantly increases. When the number of concurrent users is small, the response time is short and the system can quickly respond to user requests. As the number of concurrent users increases, the response time gradually increases, and the performance of the system under high load begins to decline. When the number of concurrent users reaches 50 or more, the response time significantly increases, indicating that the system may encounter bottlenecks under extremely high loads and the efficiency of processing requests may decrease. This trend reflects the performance of the platform under different load conditions, as well as its ability to handle high concurrency user access. The error bar displays the fluctuation range of response time under different concurrent user numbers. Response time and throughput under different concurrent user numbers.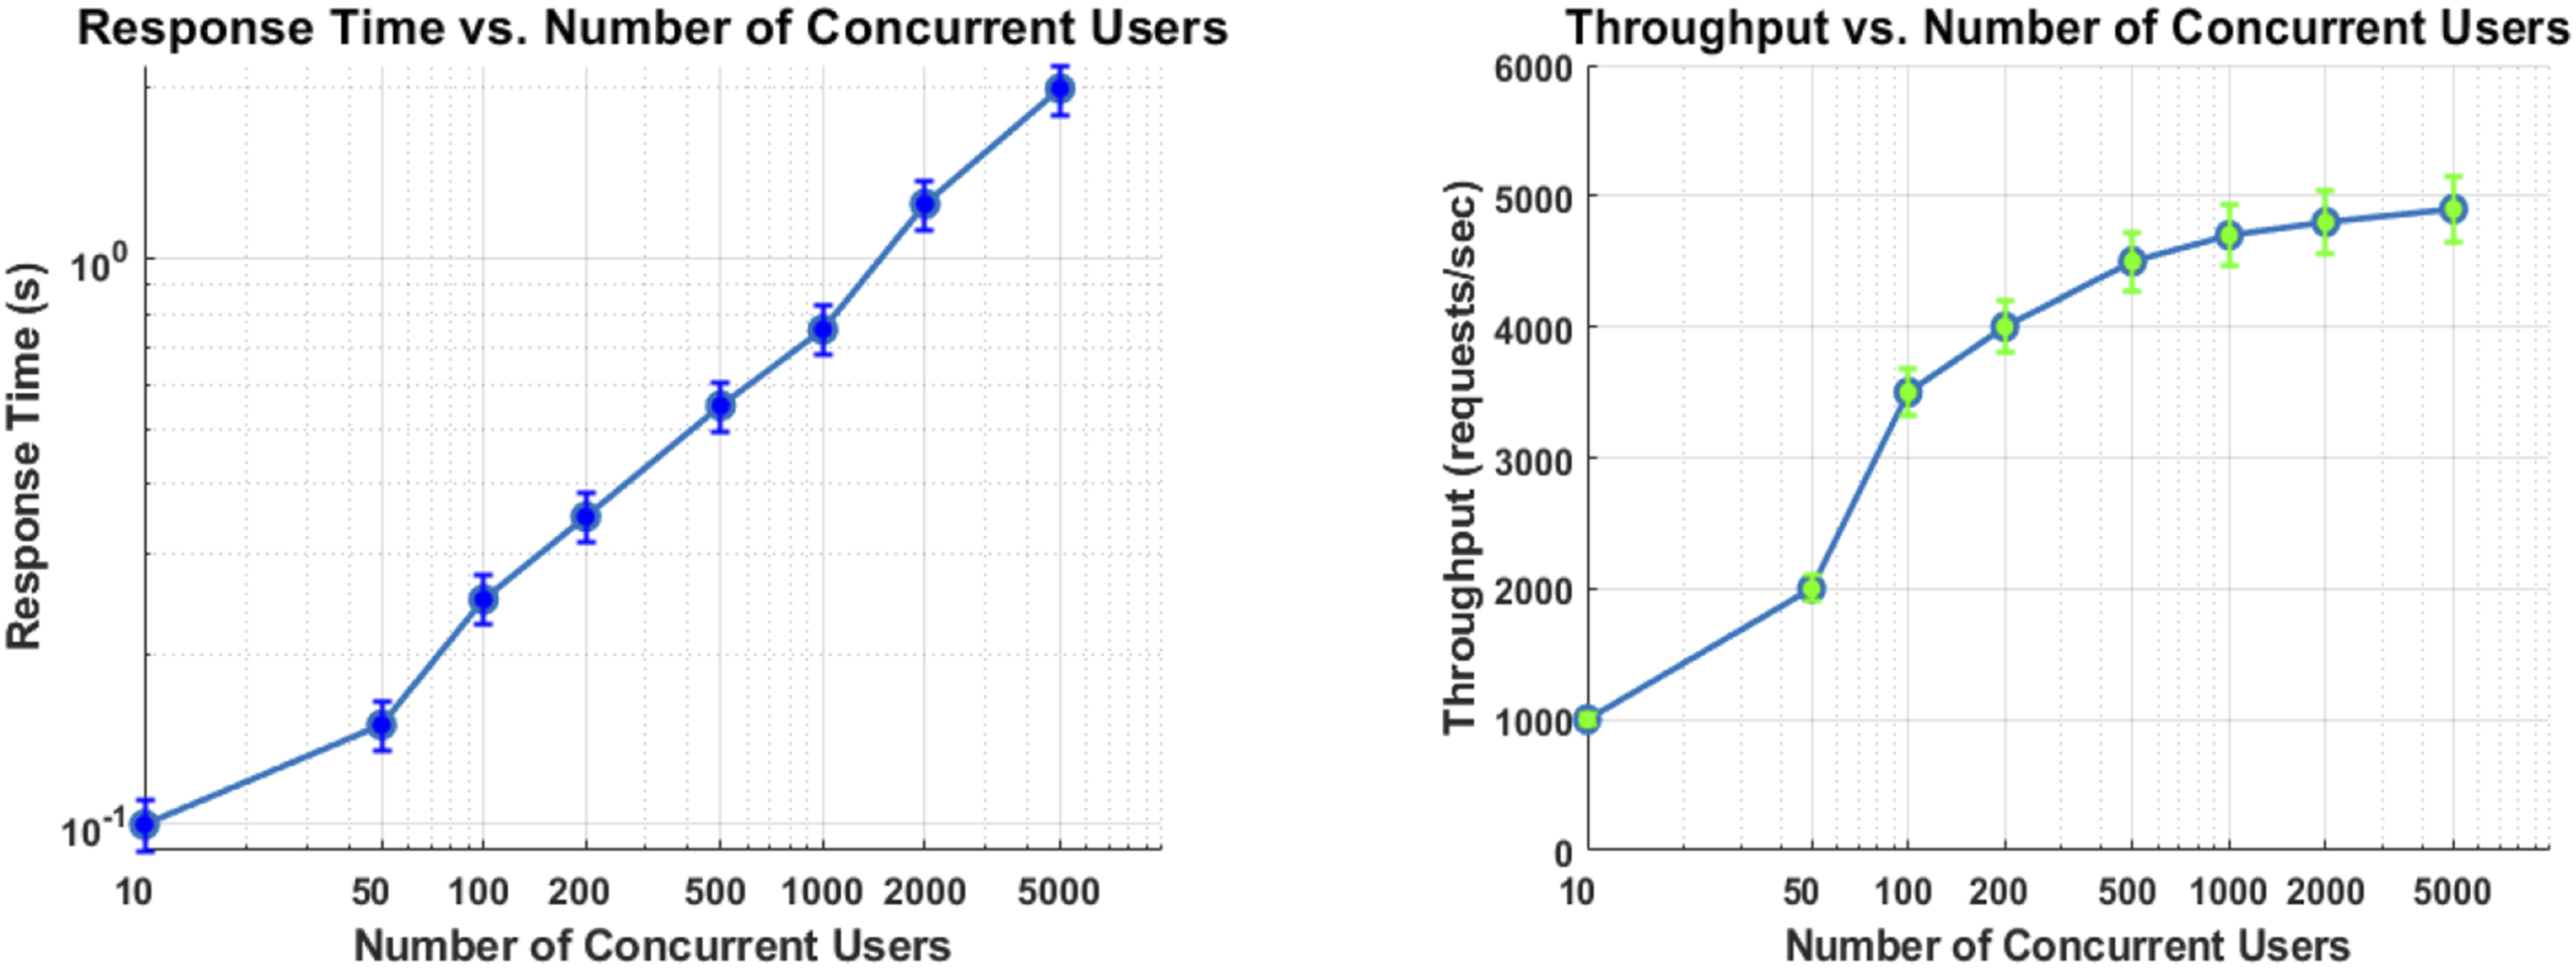
The right figure of Figure 7 shows the throughput of the platform under different concurrent user numbers, using logarithmic scales to display data changes and adding error bars to show data fluctuations. The horizontal axis (X-axis) represents the number of concurrent users, ranging from 10 to 5000, using a logarithmic scale to more clearly display data changes. The vertical axis (Y-axis) represents throughput, measured in requests per second, ranging from 1000 to 6000. The green curve and green markers represent throughput. These data points show an upward trend in throughput with the increase of concurrent users. Especially during the growth process from 10 to 100 concurrent users, the throughput shows a rapid upward trend. Then, as the number of concurrent users continues to increase to 500 or more, the growth rate of throughput slows down and approaches saturation.
Figure 8 shows the changes in CPU and memory usage of the system at different time points, with minutes as the horizontal axis and the percentage of CPU and memory usage as the vertical axis. The lines connecting the data points show the trend of usage over time. The horizontal axis (X-axis) represents time (minutes), ranging from 0 to 100, with one data point every 10 min. The vertical axis (Y-axis) represents the resource utilization rate (percentage). Changes in CPU and memory usage of the system at different time points.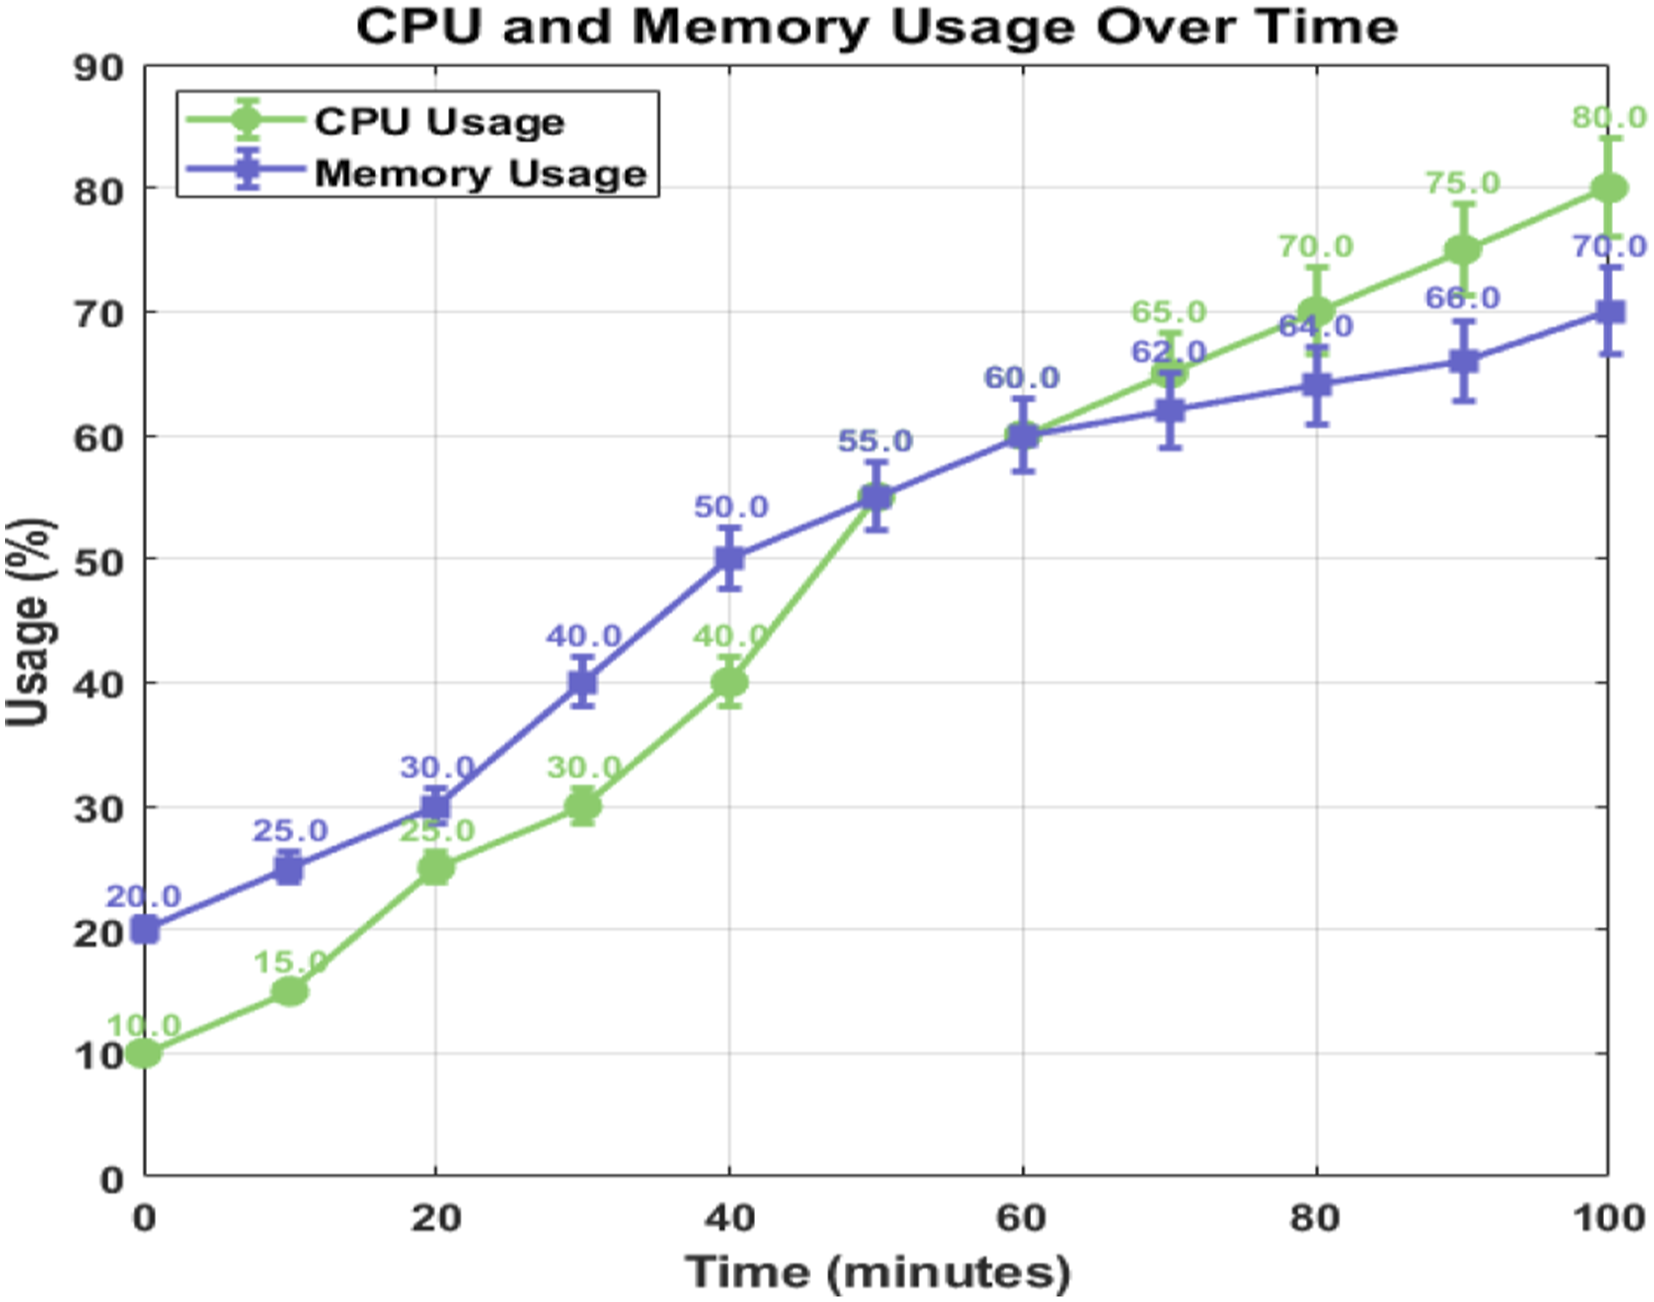
Over time, the usage of CPU and memory shows an upward trend, with CPU usage gradually increasing from 10% to 80% and memory usage increasing from 20% to 70%. The line trend indicates that as the system processes more tasks and higher loads, the usage of CPU and memory increases accordingly, reflecting the performance of the system in high load scenarios. However, the test results also show that there are performance bottlenecks in the system under high load conditions, such as when the CPU usage approaches 80%, the response time begins to significantly increase. To address these issues, a thorough analysis of bottlenecks is conducted and the performance and reliability of the system are improved by optimizing algorithms and code, increasing hardware resources, and other means. Through strict integration and testing processes, it ensures that the various functional modules of the deep learning-based virtual reality international equipment manufacturing training platform can work together, have stable performance, and provide a good user experience. The problems discovered during the testing process are promptly resolved, and the overall quality and reliability of the platform are significantly improved.
Virtual reality environment assessment
User and expert ratings of indicators.
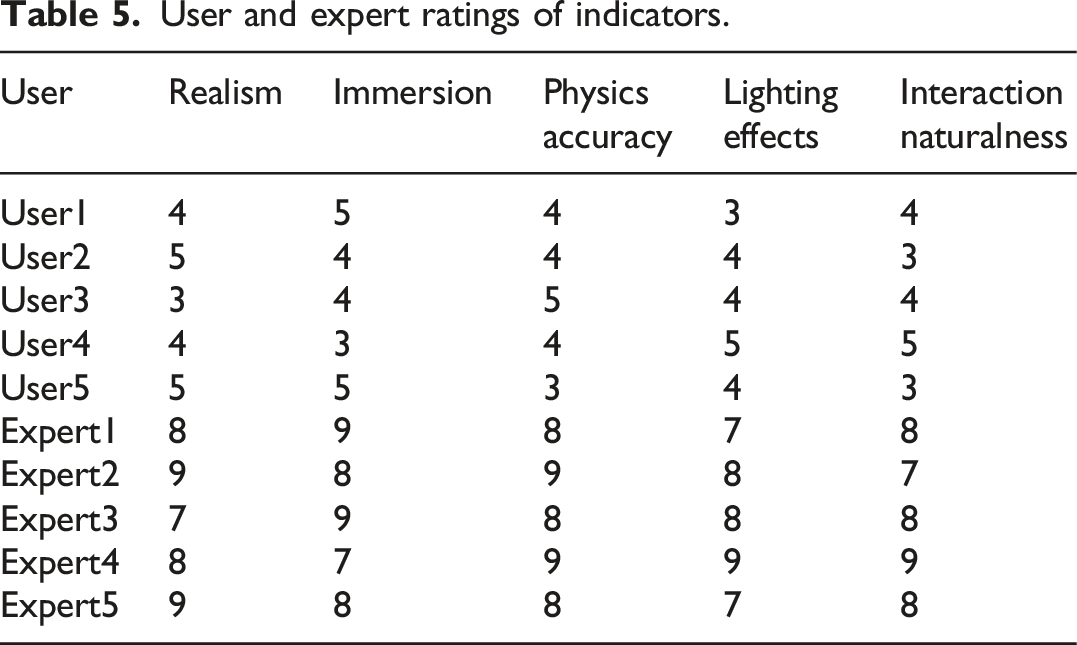
In this study, the performance of virtual environments is evaluated through questionnaire surveys and expert reviews. Five users rate the virtual environment based on five aspects: realism, immersion, physical simulation accuracy, lighting effects, and natural interaction. The rating range is 1–5 points, with a rating range of 3–5 points. Five experts score based on their professional knowledge, with a range of 1–10 points. Experts are also quite positive about the overall performance of virtual environments, scoring 9 out of 10 on multiple indicators, with an overall score ranging from 7 to 9. Overall, user and expert ratings indicate that virtual environments perform well in terms of realism and immersion.
System stability and response speed
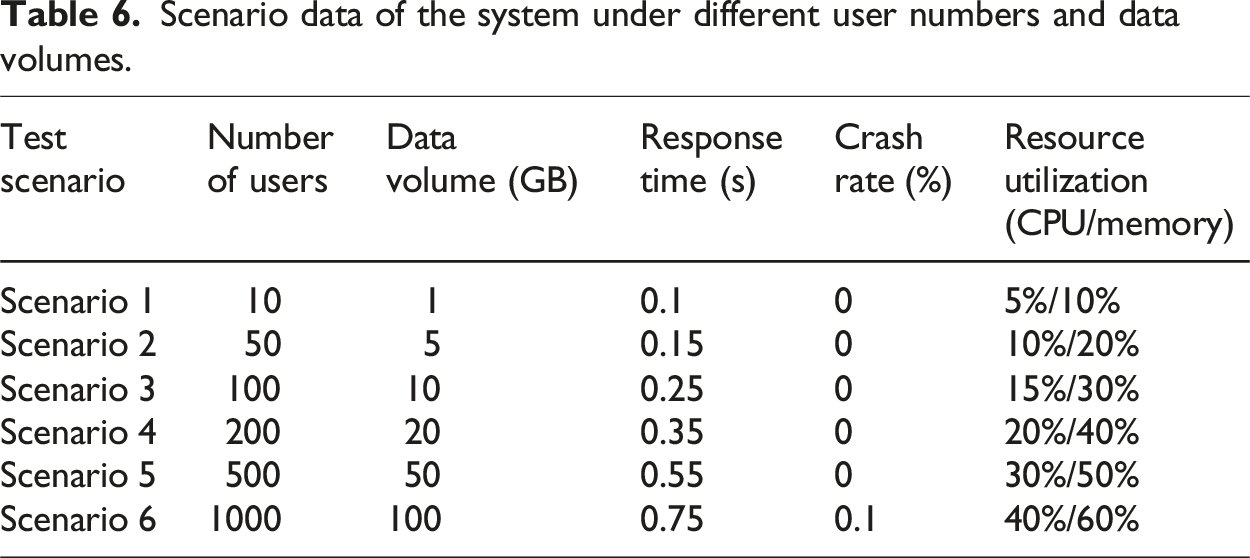
Evaluation method: through stress testing and long-term running tests, multi-user concurrent access and large data processing scenarios are simulated, and key indicators such as system response time, crash rate, and resource utilization are monitored. During the testing process, the response time of the system slightly increases under high load; the crash rate remains within an acceptable range; the resource utilization gradually approaches saturation. Based on the test results, it is recommended to further optimize the memory management and load balancing mechanism of the system to improve its stability and performance under extreme conditions. 33
Scenario data of the system under different user numbers and data volumes.
Evaluation indicators for teaching effectiveness
Knowledge mastery level and skill improvement effect.
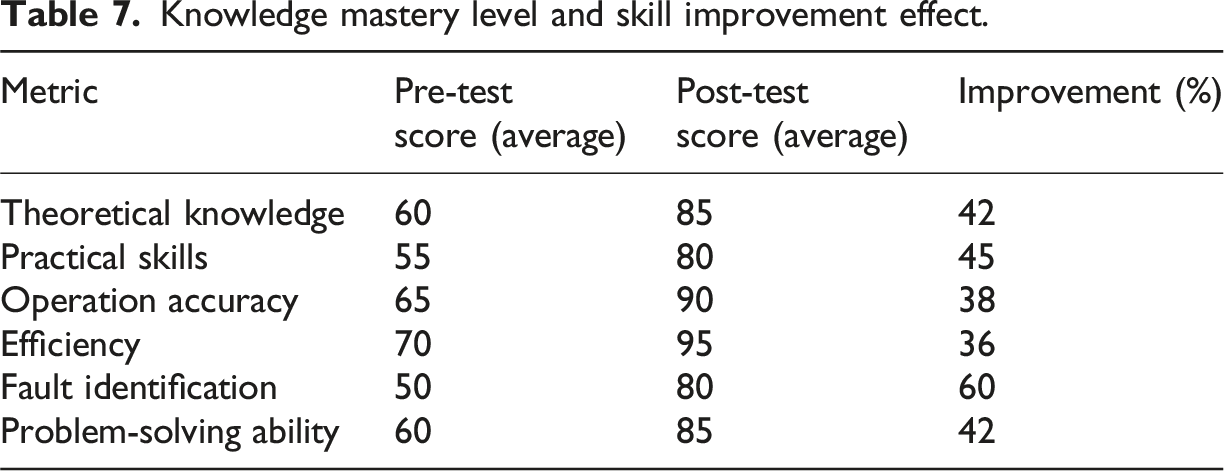
In Table 7, six main evaluation indicators are listed. Each indicator displays the average score and improvement percentage of students before and after using the platform. For example, the average score of students in theoretical knowledge increases from 60 to 85, an increase of 42%; in terms of practical skills, it increases by 45% from 55 to 80. The scores for operational accuracy, efficiency, fault recognition ability, and problem-solving ability have also shown significant improvement. Therefore, the average improvement percentage of students in various evaluation indicators is about 43.83%. Based on the data, the level of teaching effectiveness can be evaluated.
Conclusions
This article successfully combined deep learning and virtual reality technology to develop an international equipment manufacturing training platform, which reduced training costs and safety risks through an immersive virtual environment, and achieved personalized teaching and automatic evaluation. The platform not only enhanced students’ learning flexibility and skill mastery, but also verified its teaching effectiveness through a scientific evaluation system. However, there is still room for improvement in complex scene simulation and deep interaction on current platforms. In the future, algorithms can be further optimized and teaching content can be enriched to enhance user experience and promote the widespread application and in-depth development of this training platform in the international equipment manufacturing training field.
Footnotes
Funding
The authors disclosed receipt of the following financial support for the research, authorship, and/or publication of this article: This article is supported by: 2023 Higher Education Quality Engineering Project “Anhui Baima Business Operation Management Co., LTD., Hefei University of Economics” (Project No.: 2023xqhz101).
Declaration of conflicting interests
The author declared no potential conflicts of interest with respect to the research, authorship, and/or publication of this article.