




Abstract
In traditional overhead transmission line fault monitoring, traveling wave signals are not captured in time and the processing accuracy is insufficient, which seriously restricts the accuracy of fault location and the efficiency of power grid operation and maintenance. To address this problem, this paper constructs a real-time traveling wave monitoring system based on the Internet of Things (IoT) and cloud computing architecture and builds an efficient data processing link through the end-edge-cloud collaborative mechanism. The perception layer uses low-power IoT terminals to collect high-frequency electrical disturbance data. The edge layer deploys lightweight AI (Artificial Intelligence) models to extract signal features and trigger anomalies, significantly reducing the cloud load through localized preprocessing. The cloud relies on a distributed timing analysis engine to achieve deep fusion and precise positioning of multi-source data. Experimental results show that the accuracy of the designed system in 5G environment is 98.6% in traveling wave recognition; the fault location error is 110 m; the real-time response delay is only 28 milliseconds. It meets the monitoring requirements of high-precision and high real-time performance. The end-edge-cloud collaborative mechanism proposed in this paper provides a stable and efficient technical path for transmission line status perception and intelligent fault handling.
Keywords
Introduction
As the power system continues to develop toward intelligence and high reliability, the real-time status monitoring of overhead transmission lines plays an increasingly prominent role in ensuring the safe operation of the power grid. Among various monitoring technologies, traveling wave monitoring has shown important application value in fault location and fault identification due to its high timeliness and high precision.1,2 Existing systems generally face the bottleneck of insufficient real-time performance: traditional synchronous sampling devices rely on centralized processing architectures, and their end-to-end response delays usually exceed 200 milliseconds, which is difficult to meet the needs of rapid fault location; although the distributed monitoring solution based on the Internet of Things has improved the data collection density, it is limited by long-distance transmission and cloud processing links, and the average delay is still as high as 150–180 milliseconds. Such delay defects directly lead to the lag in fault signal capture, which seriously affects the efficiency of power grid fault isolation.3,4 In addition, when facing complex electrical disturbance scenarios, the signal discrimination accuracy is limited, and it cannot meet the real-time and robustness requirements of large-scale transmission networks for status monitoring.5,6 Traditional methods mostly use threshold discrimination strategies based on voltage and current changes or time-frequency analysis methods such as short-time Fourier transform and wavelet analysis to process traveling wave signals. However, these methods have poor stability under noise interference conditions and limited feature extraction capabilities for non-stationary signals.7,8 Although centralized computing platforms have strong processing capabilities, they are highly dependent on communication resources and response time and are not suitable for fast fault response scenarios.9,10 Although the development of Internet of Things technology has achieved high-density deployment of sensor nodes at the front-end acquisition layer, it still faces problems such as large data upload delays and long processing links.11,12 Existing signal recognition methods based on traditional machine learning have the problem of heavy reliance on manual extraction in feature learning and lack the ability to model signal time series dynamics, which limits the overall recognition accuracy and system practicality.13,14 There are still challenges in building a real-time traveling wave monitoring system with high sampling rate, high data processing efficiency and stable recognition capabilities. It is necessary to achieve efficient collaboration and technical integration between the perception layer, computing layer, and communication layer to break through the bottleneck of the current system in fault recognition accuracy and processing timeliness.15,16
In the context of the continuous development of smart grids, the traveling wave monitoring technology of overhead transmission lines has gradually evolved toward non-contact, high-precision, and multi-terminal fault identification. Chen proposed a non-contact intelligent measurement method based on magnetic field sensors and conductor geometric parameters. Through simulation and scaled-down experiments, it was verified that only three sensors can be used to achieve high-precision measurement of the current of each phase of the overhead line. 17 This type of non-contact measurement method not only improves the measurement flexibility but also lays a good foundation for the precise extraction and processing of subsequent event traveling wave signals.18,19 Hudomalj et al. proposed a new online positioning method based on complex continuous wavelet transform. By simultaneously determining the frequency-related traveling wave propagation characteristics from the event traveling wave measurement, the transmission line event positioning is improved. Its accuracy is evaluated in the simulation based on the IEEE 39-node system frequency-related transmission line model. Under different test conditions, this method has high relative positioning accuracy. 20 However, in complex power grid structures, relying solely on the traveling wave propagation characteristics is still difficult to meet the needs of high-precision identification of multi-source faults. Therefore, the introduction of multi-physical quantity fusion has become one of the key research directions. 21 Ayambire et al. used a tunnel magnetoresistive sensor to non-contactly detect the traveling wave flux density, combined with an adaptive mathematical morphology function to construct a fault flux ratio matrix and a characteristic matrix, and achieved accurate identification of fault areas, branches and locations in multi-terminal transmission networks, and verified its high robustness and accuracy under different fault conditions. 22 The above method has made certain breakthroughs in non-contact measurement, positioning accuracy, and multi-terminal fault identification, but there are still problems such as insufficient adaptability to actual projects, sensor deployment costs, and real-time processing efficiency that need to be further resolved.
In the field of power system monitoring, the integration of the Internet of Things, Artificial Intelligence, 23 and cloud computing is constantly promoting the improvement of the level of intelligence and becoming a key means to support multi-scenario monitoring and efficient management. Hashmi et al. designed a smart grid energy management system based on the Internet of Things and cloud computing, using embedded hardware to monitor user electricity consumption data in real time, and combined cloud analysis and visualization technology to generate load curves, providing data support for demand-side management strategies to optimize energy distribution efficiency. 24 This system architecture that integrates the Internet of Things perception layer and cloud intelligent computing has gradually become a key technical path to solve the problems of real-time perception and accurate decision-making in complex energy systems.25,26 Emamian et al. proposed an intelligent monitoring system based on cloud computing and the Internet of Things. They used machine learning technology to detect faults and predict power for photovoltaic power stations. They achieved high-precision output power prediction and fault classification through LSTM (Long Short-Term Memory) integrated neural networks and integrated learning models.27,28 With the continuous integration of deep learning technology and industrial Internet of Things architecture, the abnormality recognition and prediction capabilities of cross-domain complex systems have been significantly enhanced. 29 Caiazzo et al. proposed an AI-driven intelligent monitoring platform based on the Internet of Things and cloud assistance. By combining control charts, autoencoders, LSTM, and fuzzy reasoning systems to detect and classify abnormalities in intelligent manufacturing systems, they achieved real-time monitoring of production status and accurate positioning and risk assessment of abnormal events, providing a new solution for the transformation of intelligent manufacturing systems to Industry 5.0. 30 The above studies have demonstrated the great potential of the Internet of Things and cloud computing in different scenarios, but the current systems generally have problems such as complex deployment, poor cross-domain adaptability, and insufficient support for edge computing, which limits their promotion and application in a wider range of power system environments.
In view of the shortcomings of existing traveling wave monitoring systems in terms of real-time performance, processing efficiency, and complex disturbance recognition capabilities, this paper constructs a three-layer collaborative architecture based on the Internet of Things and cloud computing. In the perception layer, high-density, low-power sensor terminals are deployed to realize high-frequency signal acquisition; the edge layer uses lightweight models to complete feature extraction and event triggering to reduce redundant data transmission; the cloud uses a distributed timing analysis engine to fuse multi-source heterogeneous data to optimize fault mode recognition and positioning accuracy. The system innovatively integrates the end-edge-cloud resource collaborative scheduling mechanism, combines 5G enhanced communication links with asynchronous data alignment strategies, and breaks through the delay and bandwidth limitations of traditional centralized architectures. The design realizes the structured linkage of data acquisition, feature compression, and deep analysis, providing a high real-time, low-communication load solution for the intelligent monitoring of overhead transmission lines.
System architecture
Collaborative monitoring architecture
To achieve high-precision, real-time monitoring and intelligent analysis of traveling wave signals in overhead transmission lines, this system adopts a hierarchical end-edge-cloud collaborative architecture. This architecture enables the integration of sensing, computing, and analysis across different system levels, facilitating comprehensive situational awareness and fault diagnosis in complex power transmission environments. Specifically, the system architecture is composed of three functional layers arranged from bottom to top: the IoT perception layer, the edge computing layer, and the cloud-based analysis platform. These layers are interconnected through a high-reliability, low-latency communication network (e.g., 5G or optical fiber), forming a closed-loop data interaction and task coordination mechanism that ensures seamless data flow and responsive event handling across the entire monitoring chain.
The IoT perception layer, deployed along transmission line corridors, consists primarily of distributed low-power, high sampling rate electrical disturbance sensing terminals. These terminals continuously monitor high-frequency electromagnetic transient signals, enabling the capture of traveling wavefronts associated with faults or disturbances. To improve data quality and transmission efficiency, each terminal incorporates localized preprocessing capabilities such as noise suppression, baseline correction, and preliminary data framing, thus reducing the computational burden on downstream components. The edge computing layer is typically installed in tower base stations or nearby access terminal enclosures. It receives preprocessed data from the perception layer and performs real-time signal feature compression, waveform pattern extraction, and abnormal event detection using a pre-deployed lightweight convolutional neural network (CNN) model. This localized intelligence allows for low-latency response to critical events and reduces the volume of data that must be transmitted to the cloud, optimizing overall bandwidth usage and enhancing system responsiveness. The cloud platform analysis layer serves as the central hub for in-depth data processing and intelligent decision-making. Data streams transmitted via high-speed 5G links are aggregated and processed using a temporal fusion model built on attention mechanisms. This model supports multi-source asynchronous data alignment, contextual semantic modeling, and adaptive learning across variable time scales. Core analytical functions at this layer include fault waveform classification, precise fault location estimation, and predictive modeling of system operating states. Through continuous learning and cross-scenario generalization, the cloud platform facilitates adaptive model updates and enhances the long-term robustness and scalability of the entire monitoring system. The complete system architecture, including the functional modules and their data flow relationships, is illustrated in Figure 1. Overall architecture of real-time traveling wave monitoring system for overhead transmission lines.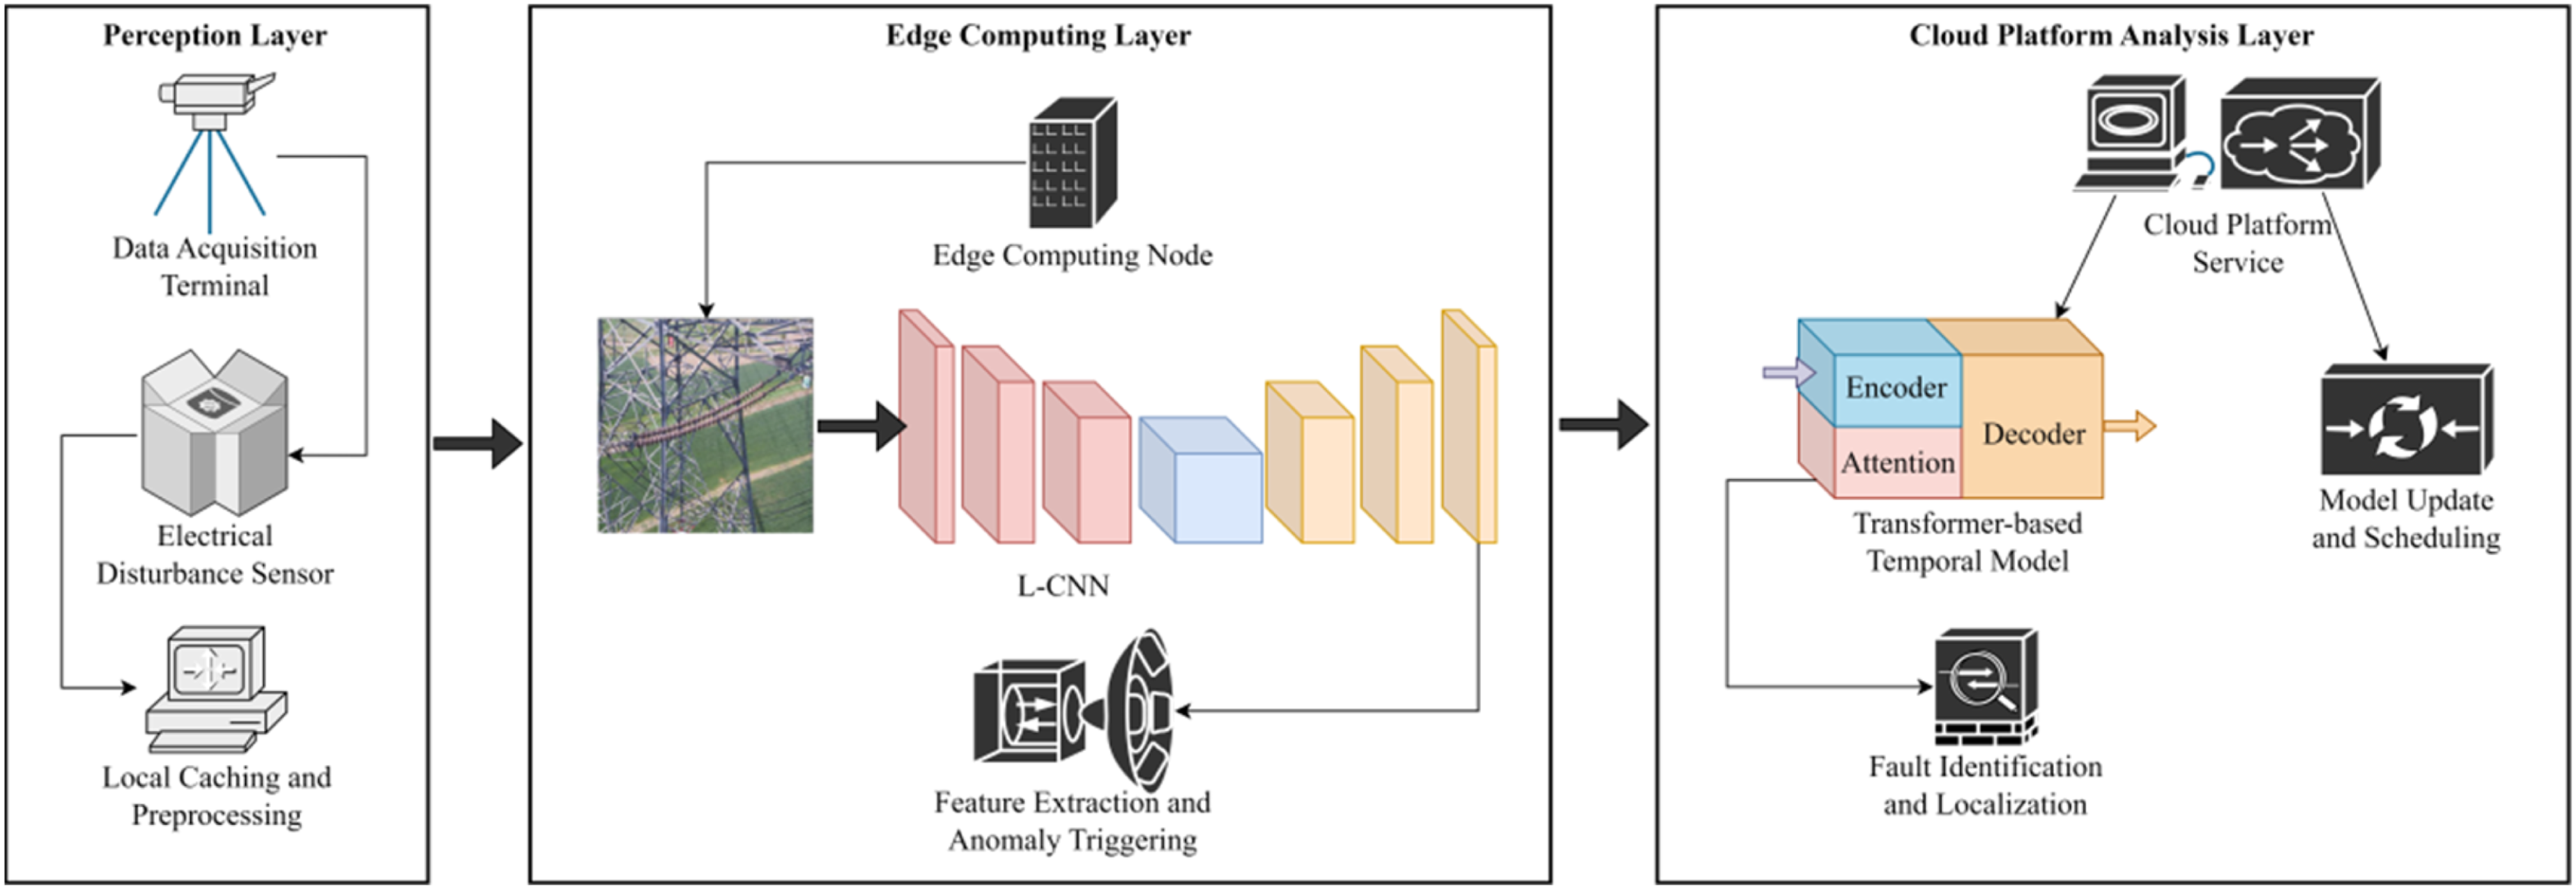
The data acquisition terminal in the perception layer integrates highly sensitive voltage and current disturbance sensors, supports ultra-high-frequency sampling, and uses edge caching and periodic upload mechanisms to ensure data integrity. A distributed deployment solution is adopted between terminal nodes to achieve full-line signal coverage by locating the optimal observation point, and maintain sampling timing consistency with the help of a time synchronization protocol. The edge computing node embeds a lightweight convolutional neural network (L-CNN) model for traveling wave recognition, which achieves efficient operation in a resource-constrained environment through parameter pruning and quantization compression. The edge node has an event-level trigger mechanism, which quickly generates instruction tags and uploads corresponding fragment data after judging the disturbance characteristics, reducing invalid communication traffic.
The cloud platform builds an operation and maintenance analysis environment with a containerized microservice structure, receives events and data reported by the edge, and dynamically models time series features through the built-in Transformer structure to improve the accuracy of fault pattern recognition under long-range dependencies. In asynchronous data processing scenarios, the platform coordinates the timing differences of data from different nodes through sequence alignment and attention weight adjustment mechanisms to enhance the overall analysis capabilities of the system under complex interference backgrounds. The platform supports model iteration and remote parameter delivery mechanisms, and updates edge model weights through periodic scheduling to achieve a continuously optimized data processing closed loop.
Each layer of the system builds a high-speed data channel through the 5G communication module, and adopts the message queue and cache pool strategy to ensure the link stability and communication timeliness. The task scheduling strategy is uniformly issued by the cloud platform, defining the data upload window, model trigger threshold and abnormal feedback channel. The edge and terminal nodes perform data collection, identification and reporting tasks according to the scheduling instructions. The three-layer structure realizes physical isolation and logical coordination in the architecture to ensure system stability, maintainability, and engineering deployability. This architecture realizes efficient hierarchical processing capabilities while ensuring real-time acquisition, providing a solid technical foundation for subsequent traveling wave fault identification and precise positioning.
High-frequency signal acquisition and IoT transmission optimization
When a transmission line is subjected to an electrical disturbance (such as a short circuit, grounding fault, lightning strike, or switching operation), a high-frequency electromagnetic transient signal is instantly generated at the fault point and propagates in both directions along the conductor in the form of a traveling wave. This traveling wave signal is characterized by sudden changes in voltage and current, forming high-frequency pulses that travel at a speed close to the speed of light (approximately 2 × 10⁸ m/s). During propagation, the wave undergoes reflection and refraction at discontinuities such as substations, tower grounding points, and line junctions. Such signals typically exhibit a wide frequency spectrum ranging from 30 kHz to 300 kHz, which is significantly higher than the power frequency signals (50/60 Hz). They can cover tens to hundreds of kilometers within an extremely short time frame. Therefore, traveling wave signals are capable of capturing the earliest moment of fault occurrence and serve as critical information sources for fault location and identification. In order to accurately capture high-frequency traveling wave signals and suppress electromagnetic interference, the acquisition module uses a three-phase coupled capacitive voltage sensor and a Rogowski coil high-frequency current transformer, whose frequency response range covers 10 kHz to 1 MHz, and the dynamic signal-to-noise ratio is not less than 70 dB. The sensor housing adopts an electromagnetic shielding coating design, combined with a differential signal input mode, to effectively suppress common-mode noise and power frequency harmonic interference. Here, the sampling frequency of the acquisition module is set to 500 kHz, the signal time window length is 5 ms, and the total number of sampling points in a single window is 2500 points. The terminal node is designed based on the STM32H7 microcontroller, with an operating power consumption as low as 0.5 W, and supports switching between solar power supply and sleep mode. The deployment density is 20/km2, covering key observation points along the entire line, and sub-microsecond time synchronization between nodes is achieved through the IEEE 1588 protocol to ensure the timing consistency of high-frequency signal sampling. The collected image is shown in Figure 2. Image acquisition examples.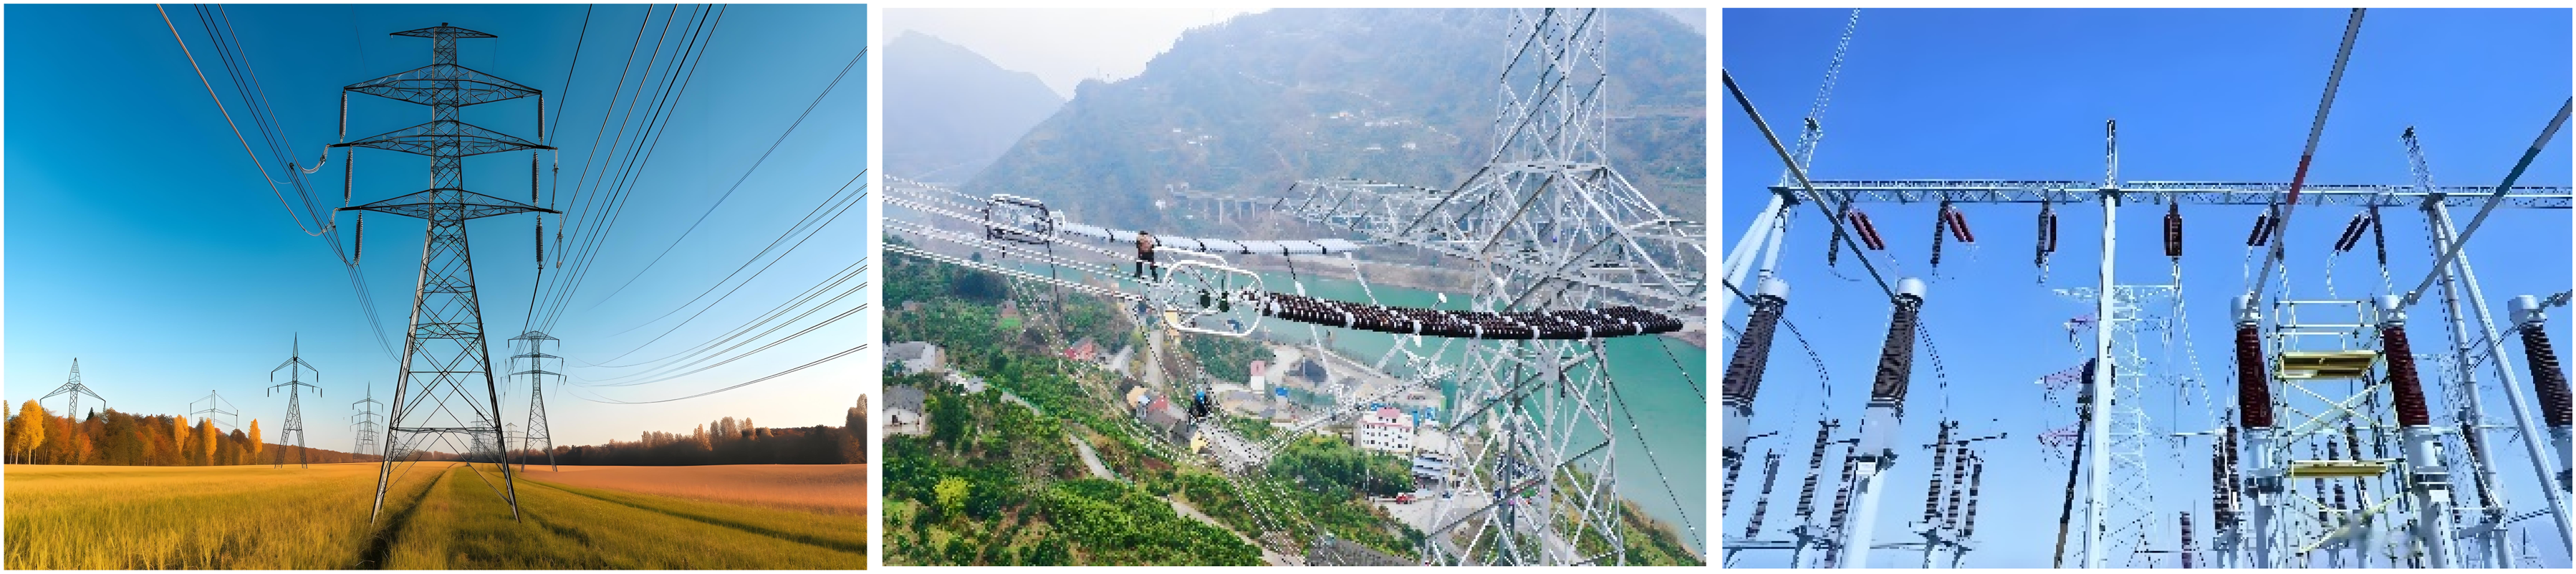
After the acquisition is completed, the original signal is first bandpass filtered with a filter passband of 20 kHz to 300 kHz to eliminate power frequency interference and high-frequency background noise. Assuming that the signal before filtering is Time domain waveform of traveling wave disturbance signal before and after preprocessing.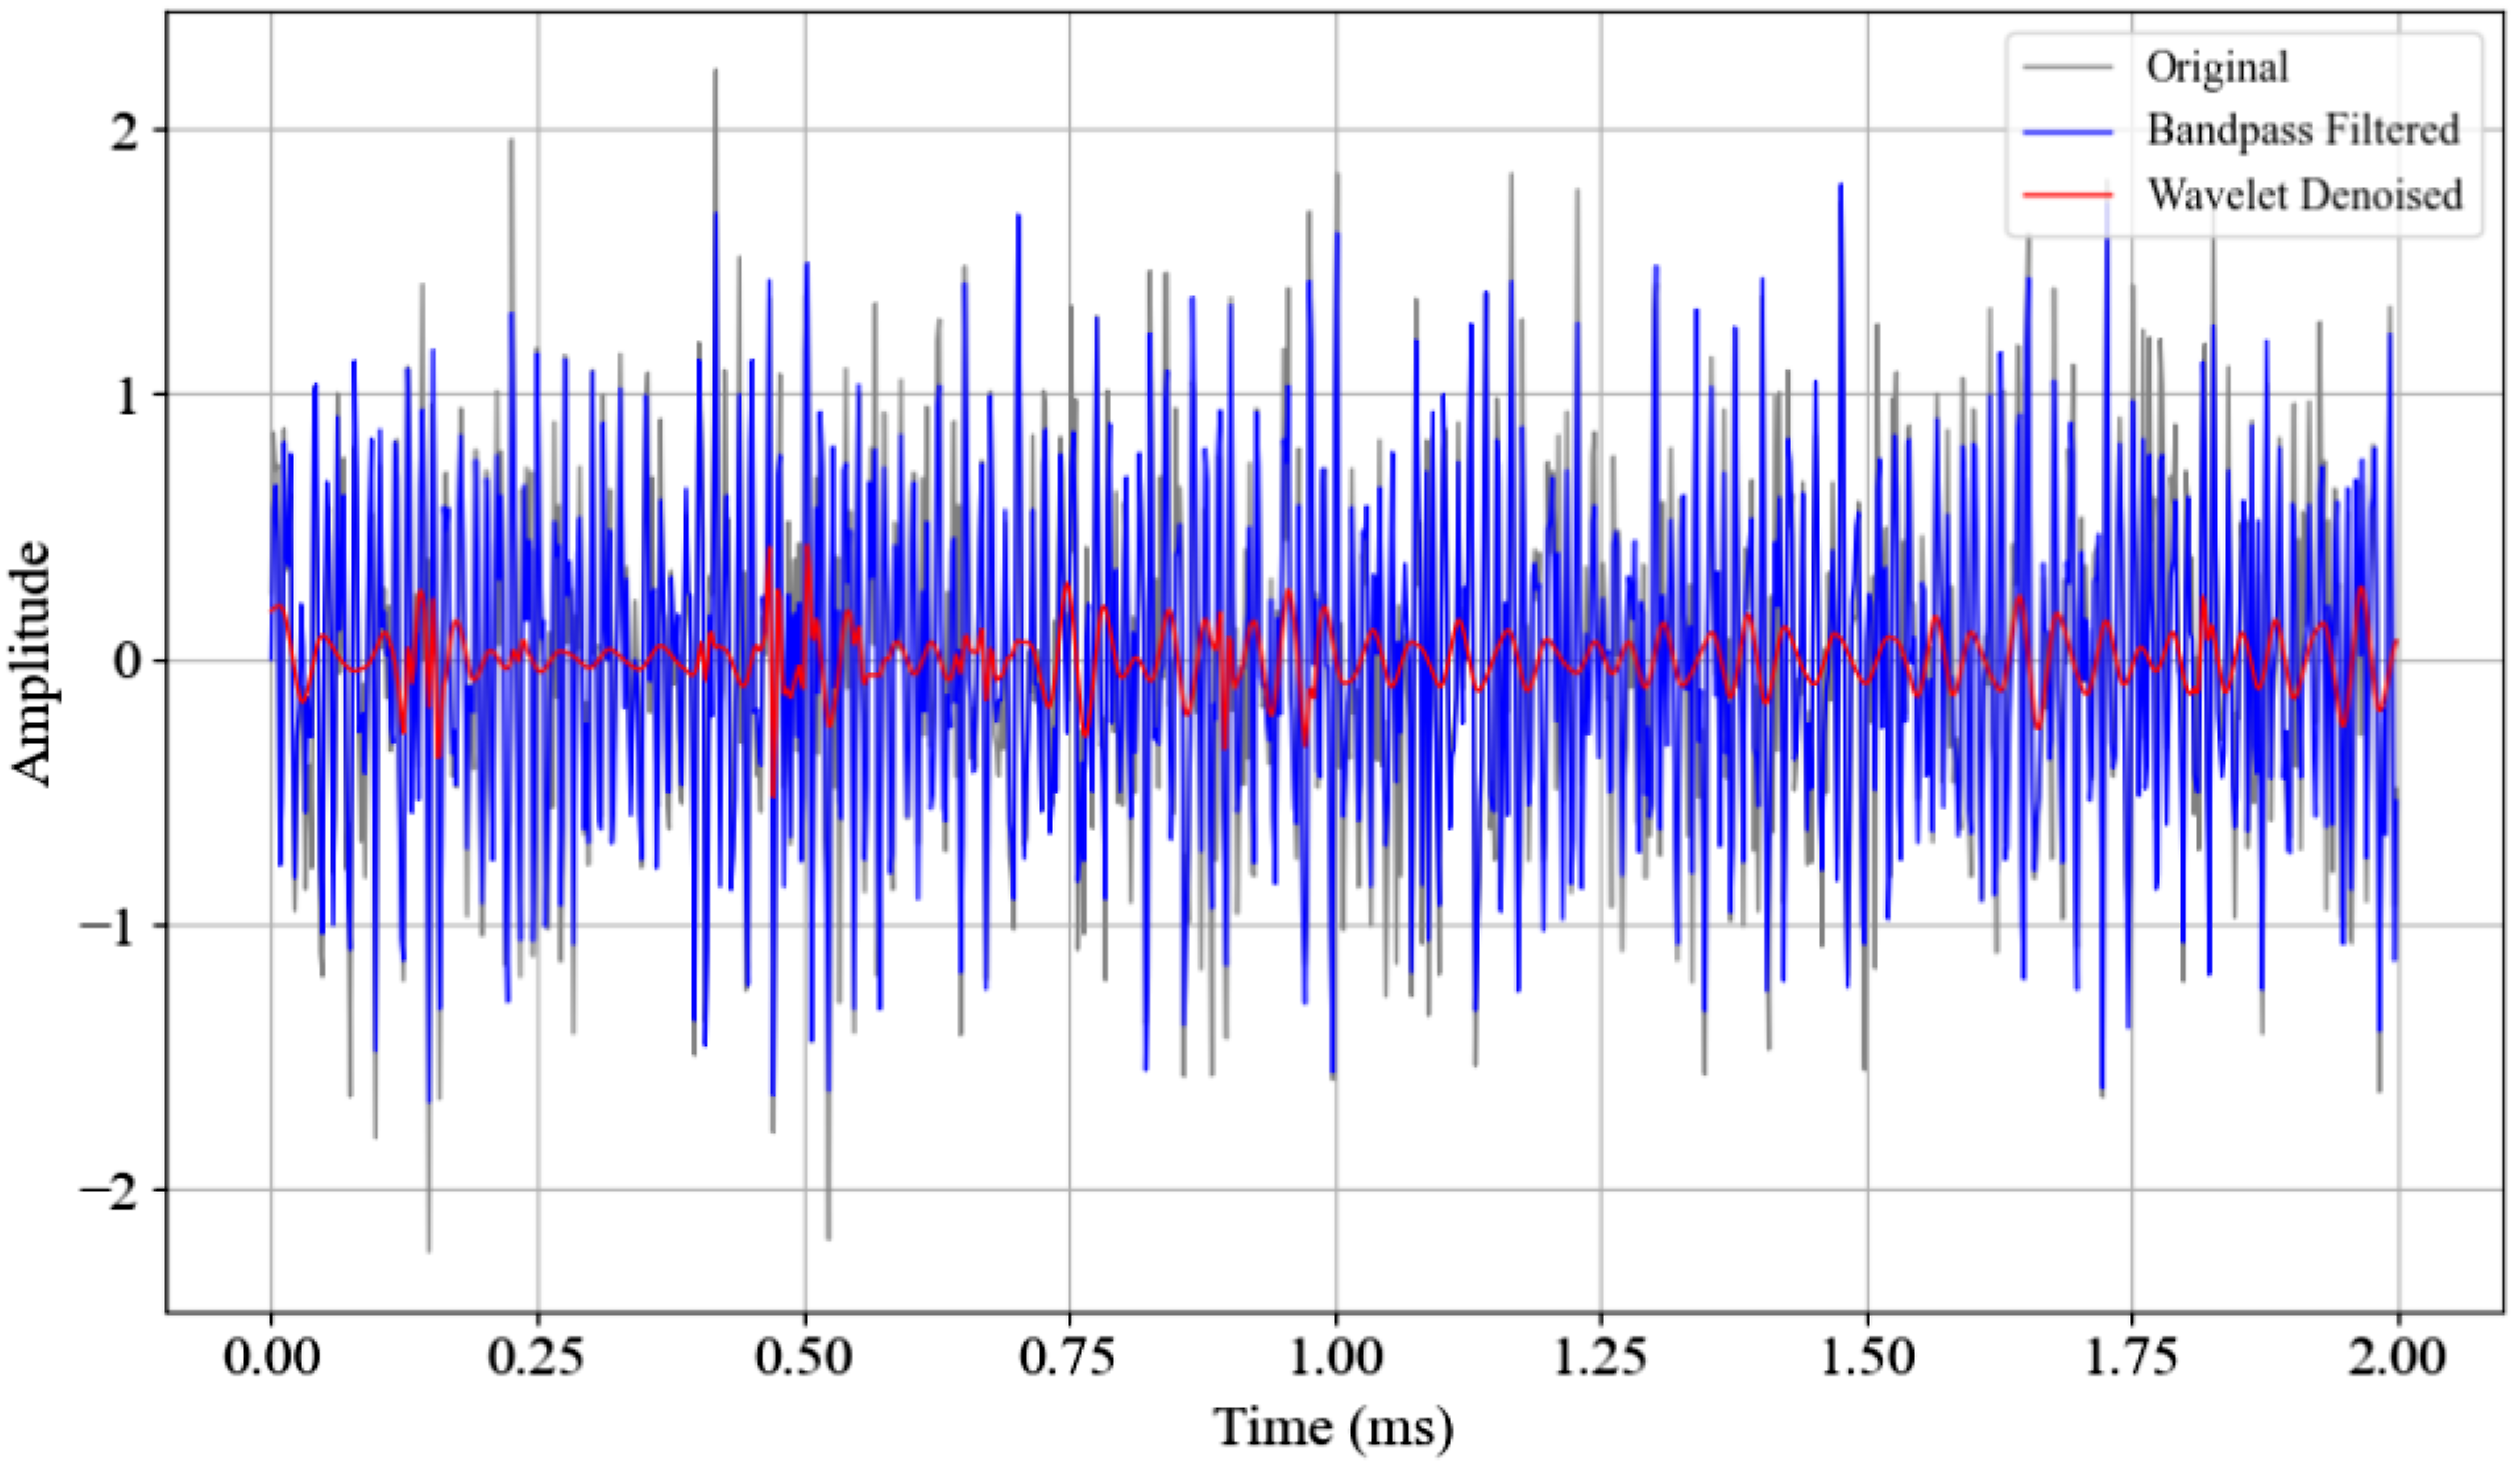


After data preprocessing is completed, the edge node transmits the compressed signal to the cloud through the low-power wide-area IoT protocol. The communication protocol adopts a dynamic flow control strategy to dynamically adjust the data upload frequency based on the signal energy threshold, and the peak bandwidth occupancy of a single node does not exceed 15%. For transmission interruption scenarios, the protocol has a built-in breakpoint resumption mechanism, which restores the integrity of the data packet through frame sequence number marking and redundant check code to ensure that the signal fragment can still be fully uploaded in a weak network environment.
There are a large number of low-amplitude redundant segments in the denoised signal, which do not have effective disturbance characteristics. Therefore, a fragment compression algorithm based on energy criterion is introduced. The signal sliding window energy


Effect of different preprocessing strategies on signal quality improvement.
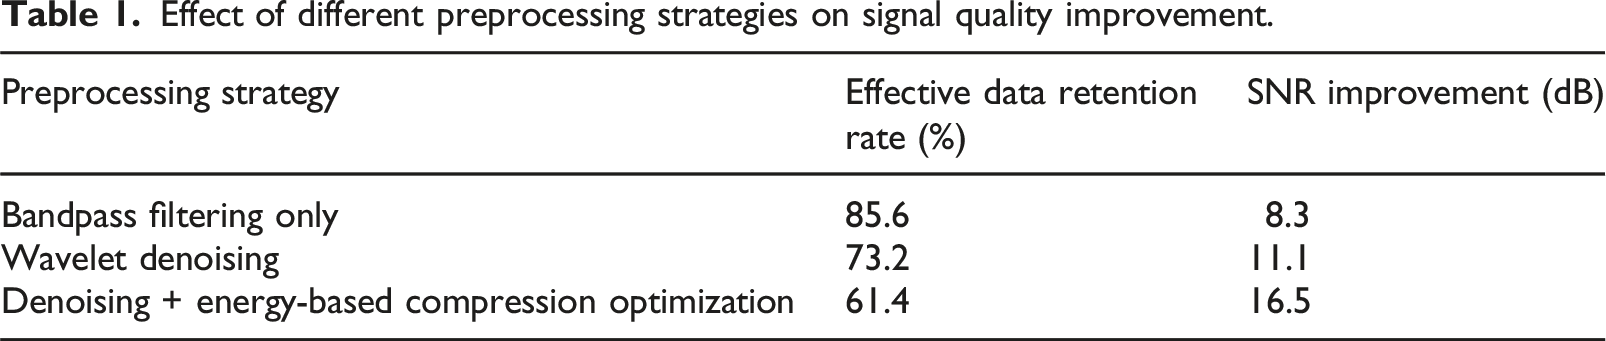
Table 1 presents the performance differences among three signal preprocessing strategies in enhancing the quality of traveling wave signals. According to the experimental results, single bandpass filtering demonstrates superior performance in preserving the original structure of the signal, achieving a valid data retention rate of 85.6% and an SNR improvement of 8.3 dB, indicating that this method effectively retains the energy of the original signal. However, due to its fixed-band frequency domain filtering characteristics, its suppression of non-stationary interference signals (such as high-frequency spikes or low-frequency noise) is limited, resulting in relatively weak overall noise reduction capability.
In contrast, the wavelet denoising strategy, which decomposes and reconstructs the signal through multi-scale analysis, shows greater advantages in attenuating background noise and transient disturbances. It achieves a signal-to-noise ratio improvement of 11.1 dB, outperforming the bandpass filter. Nevertheless, some signal components are misclassified as noise and attenuated or removed during the denoising process, causing the valid data retention rate to decrease to 73.2%, which reflects a certain degree of original information loss.
Furthermore, when wavelet denoising is combined with energy compression, the method effectively reduces redundant information and weak signal interference, allowing for enhanced recognition of high-energy features. This combined strategy achieves the highest SNR improvement of 16.5 dB, significantly improving signal clarity and identifiability. However, the compression of low-energy signal components in the process leads to a further drop in valid data retention rate to 61.4%, indicating a more pronounced loss of information.
In summary, the three preprocessing methods exhibit clear trade-offs between signal fidelity and noise suppression capability. Bandpass filtering is more suitable for scenarios that prioritize the preservation of raw data, wavelet denoising is appropriate for enhancing feature extraction under moderate noise conditions, while the combined denoising and energy compression strategy is better suited for applications requiring high signal clarity and robustness against interference, such as fault identification and waveform feature matching.
Edge side traveling wave feature extraction and preliminary recognition algorithm
The edge computing layer is deployed at nodes along the transmission line to undertake the local processing of high-frequency traveling wave signals. The design goal is to achieve a balance between signal processing efficiency and communication load through lightweight feature extraction and dynamic anomaly detection mechanisms. The feature extraction module is designed with a multi-scale feature extraction network based on a convolutional architecture, aiming to efficiently capture key disturbance patterns in high-frequency traveling wave signals. By incorporating a sliding window convolution operation, the module enables local perception and continuous feature scanning along the temporal dimension of the signal. In addition, pooling and compression mechanisms are employed to perform dimensionality reduction and energy aggregation on multi-scale feature responses, thereby enhancing the compactness and robustness of the feature representation. Within the system architecture, this module is deeply integrated with the data compression strategy. An energy-aware mechanism is used to evaluate the extracted feature fragments, selectively retaining only high-energy and highly relevant disturbance information for subsequent transmission and analysis. This approach effectively reduces the burden of redundant data transmission while ensuring the integrity of critical information, thereby improving the overall efficiency of edge–cloud collaborative processing. The anomaly detection module combines dynamic threshold discrimination with frequency domain energy distribution analysis to generate event trigger instructions, and the trigger conditions are synchronized with the predefined fault mode library on the cloud. This hierarchical design ensures that edge nodes complete real-time signal screening in a low-power embedded platform, providing high-value data input for deep analysis on the cloud.
The edge-side traveling wave feature extraction adopts the L-CNN structure and is deployed on the embedded edge node of the ARM (Advanced RISC Machine) architecture to perform online feature analysis and anomaly recognition for the collected high-frequency disturbance signals. The model structure consists of three layers of one-dimensional convolution modules, two layers of fully connected mapping modules, and an output normalization layer. The convolution kernel sizes in the convolution modules are set to 5, 3, and 3, respectively, all using single-channel sliding with a step size of 1. No padding operation is used, and the output size is pooled and compressed after each layer to reduce the computational complexity. The activation function uses Leaky ReLU, which is expressed as shown in formula (5):
After feature compression, the final discriminant space is constructed through two layers of fully connected mapping. The network output dimension is 2, corresponding to the effective disturbance trigger and non-disturbance state, respectively. Finally, the Softmax function is used for normalization, and its expression is shown in formula (6):

Model training and deployment parameter configuration table.
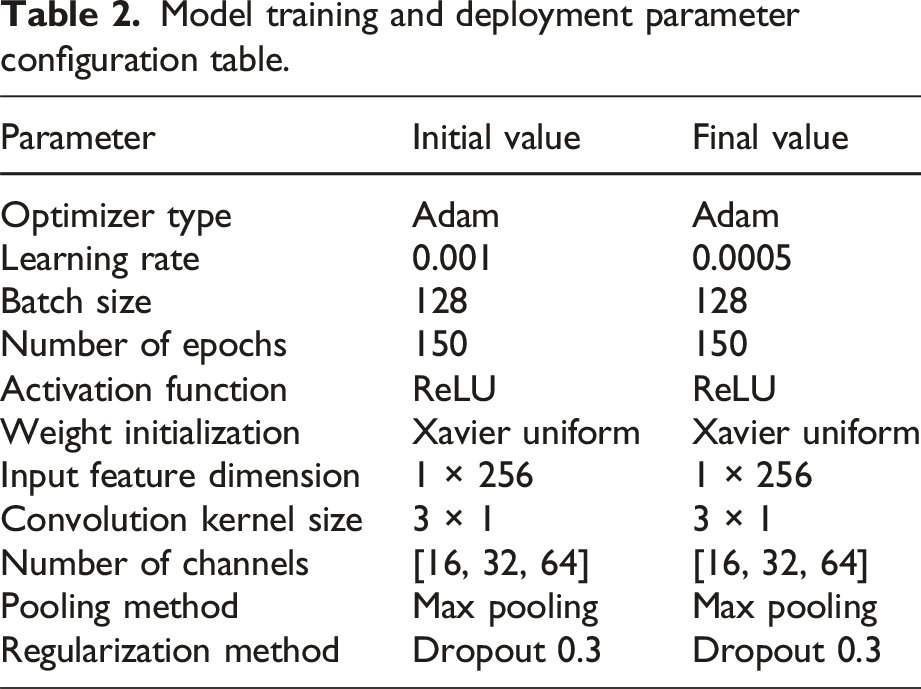
The training data comes from the disturbance fragments actually collected by the front-end node. After labeling, it is divided into a training set and a validation set. The Adam optimizer is used in the training process. The learning rate is initialized to 0.001, the batch size is set to 128, and the number of iterations is set to 150 rounds. After the model training is completed, it is quantized and compressed to 8 bits, converted to INT8 format and deployed to the edge device to reduce the consumption of floating-point computing resources and improve the inference efficiency. At run time, the model input is the fixed time window data output by the front sampling module. The input dimension is N×1, where N is the number of sampling points per frame, which is set to 256 points. The edge device uses a timed trigger method to input a frame of signal data every 30 milliseconds, and the average forward inference time of the model does not exceed 7.4 milliseconds. Once the probability of the disturbance category in the output exceeds the set threshold, the abnormal recognition event is triggered, and the current time window signal is packaged and uploaded to the cloud platform through the 5G communication module for the subsequent Transformer model to perform deep fusion analysis, forming a complete closed loop for the fault type and spatial location. The entire process does not require human intervention, realizing the end-side autonomous recognition and real-time abnormal perception of the embedded platform.
Design of cloud-based attention-enhanced temporal fusion model
The cloud analysis layer asynchronously uploads heterogeneous data streams to multiple edge nodes. The core of its architecture is to build a spatiotemporal collaborative fusion analysis framework to solve the problem of data inconsistency in distributed monitoring scenarios. The time series modeling module dynamically allocates weights of different time steps through the self-attention mechanism to strengthen the global correlation of key disturbance fragments. In the system design, the spatiotemporal alignment module automatically corrects the clock deviation and transmission delay between nodes to ensure that multi-source data is fused under a unified time reference. The feature fusion network adopts a hierarchical aggregation strategy to integrate local features and global context information layer by layer, and output fault types and location coordinates. This layer forms a closed-loop feedback mechanism with the edge computing layer, and regularly sends model update parameters to optimize local discrimination accuracy.
In order to achieve deep fusion and accurate recognition of multi-source data of traveling wave signals, the cloud uses an attention-enhanced time series model built on the Transformer architecture. The core of this model is to strengthen the dynamic dependency modeling of key features between different time steps through the self-attention mechanism, thereby improving the ability to extract traveling wave patterns in complex electrical disturbance sequences. The model input is a preprocessed high-frequency disturbance signal sequence uploaded from multiple edge nodes. Assume that the observation sequence of each node at time step 







The fused feature sequence is input into the feedforward neural network for nonlinear transformation. The network structure is a combination of two fully connected layers and a ReLU activation function. The output is the probability distribution of the traveling wave perturbation in each category. Assuming the network parameters are 

System real-time collaboration mechanism
The end-edge-cloud collaborative mechanism is based on a multi-layer distributed heterogeneous computing architecture, relying on asynchronous communication links and unified scheduling protocols to achieve dynamic allocation of multi-level perception, analysis, and control tasks. The IoT terminal in the system continuously perceives the high-frequency disturbance signal of the overhead transmission line, adopts a communication mechanism that combines periodic active push and abnormal trigger upload, and makes judgments based on the set disturbance amplitude threshold. When the perception signal
The edge node quickly extracts features from the received data through a lightweight convolutional neural network model. The recognition result is output by the confidence scoring function 
The confidence threshold
The cloud task scheduling takes minimum delay and maximum accuracy as the optimization goals and constructs a resource-aware task priority function 
During the model update process, the cloud maintains the global model parameter 
In terms of communication link scheduling, the system sets the transmission priority for the uplink data packets of the edge nodes according to the task urgency 
In terms of system resource scheduling, the end-edge-cloud node collaboration adopts a delay-constrained minimum resource occupancy optimization strategy to comprehensively evaluate the CPU occupancy, memory usage, and energy consumption during task execution. The objective function is defined by formula (22):
Experiment and result analysis
Experimental environment and IoT platform deployment
Experimental platform configuration table.
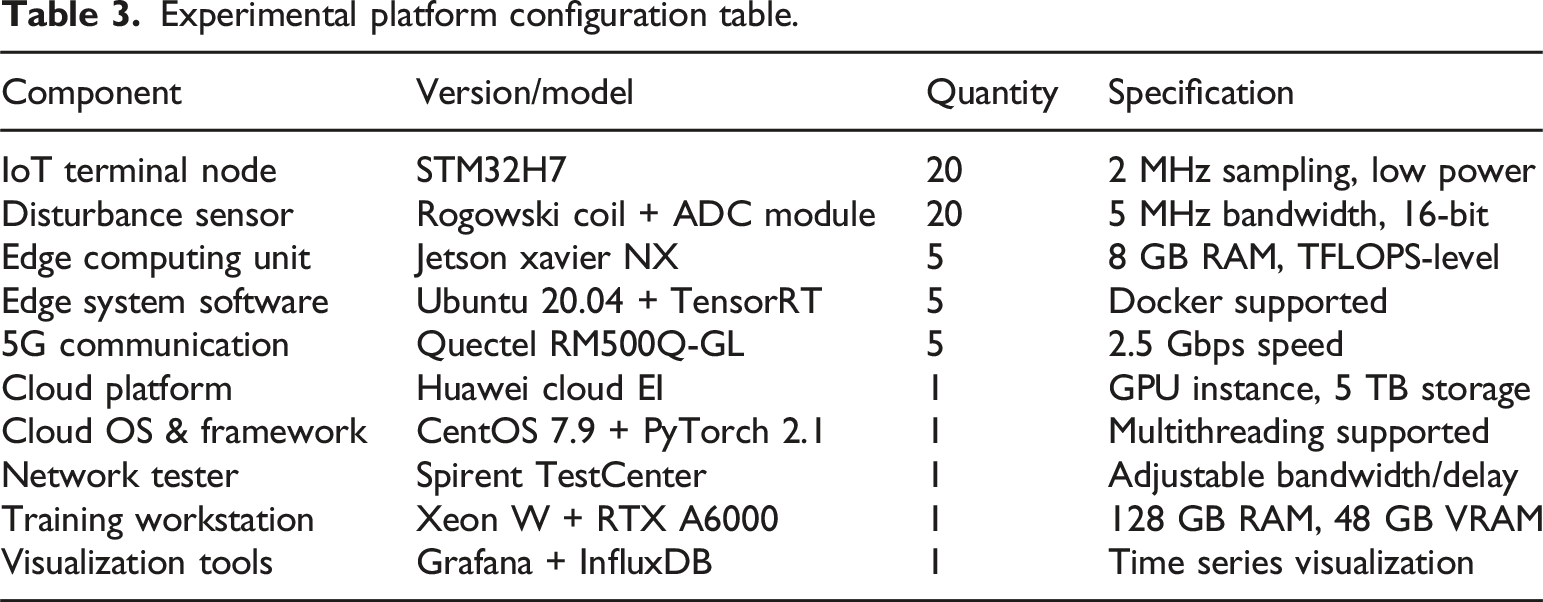
Table 3 lists the main hardware and software components involved in the system experiment, including acquisition terminals, edge devices, communication links, cloud computing platforms, and auxiliary test environments. The configuration parameters cover dimensions such as processing power, storage capacity, communication rate, and system environment, providing basic support for system performance testing and stability verification.
Recognition effect of multi-type disturbance traveling wave signals
In order to systematically verify the recognition efficiency of the constructed model in a complex disturbance environment, a multi-category traveling wave signal classification experiment was designed, and six types of typical disturbance signals were selected as the source of test samples. The number of samples used for each type of disturbance test was 100 groups. Single-Phase Ground Fault (SGF) is characterized by sudden amplitude changes but relatively concentrated frequency components, and the waveform has significant consistency. Phase-to-Phase Fault (PPF) has fuzzy feature interval boundaries due to sudden changes in phase-to-phase voltage and current, and the spectrum has medium ductility. Three-Phase Fault (TPF) is a high-intensity disturbance source with high-energy density and high regularity of frequency domain structure distribution, which is suitable for network convolution learning. Lightning Disturbance (LD) has a short waveform but drastic amplitude-frequency changes and has cross-features with high-energy fault disturbances. Switching Operation (SO) has certain periodicity and repeatability and is easily affected by power frequency harmonic interference. Non-Fault Disturbance (NFD) is a non-structural disturbance caused by natural fluctuations or background noise during operation, and the frequency distribution has no obvious regularity. The multi-category test set constructed based on the above disturbances is used for model evaluation, and the results are shown in Figure 4. Comparison of identification results of multiple types of disturbance traveling wave signals.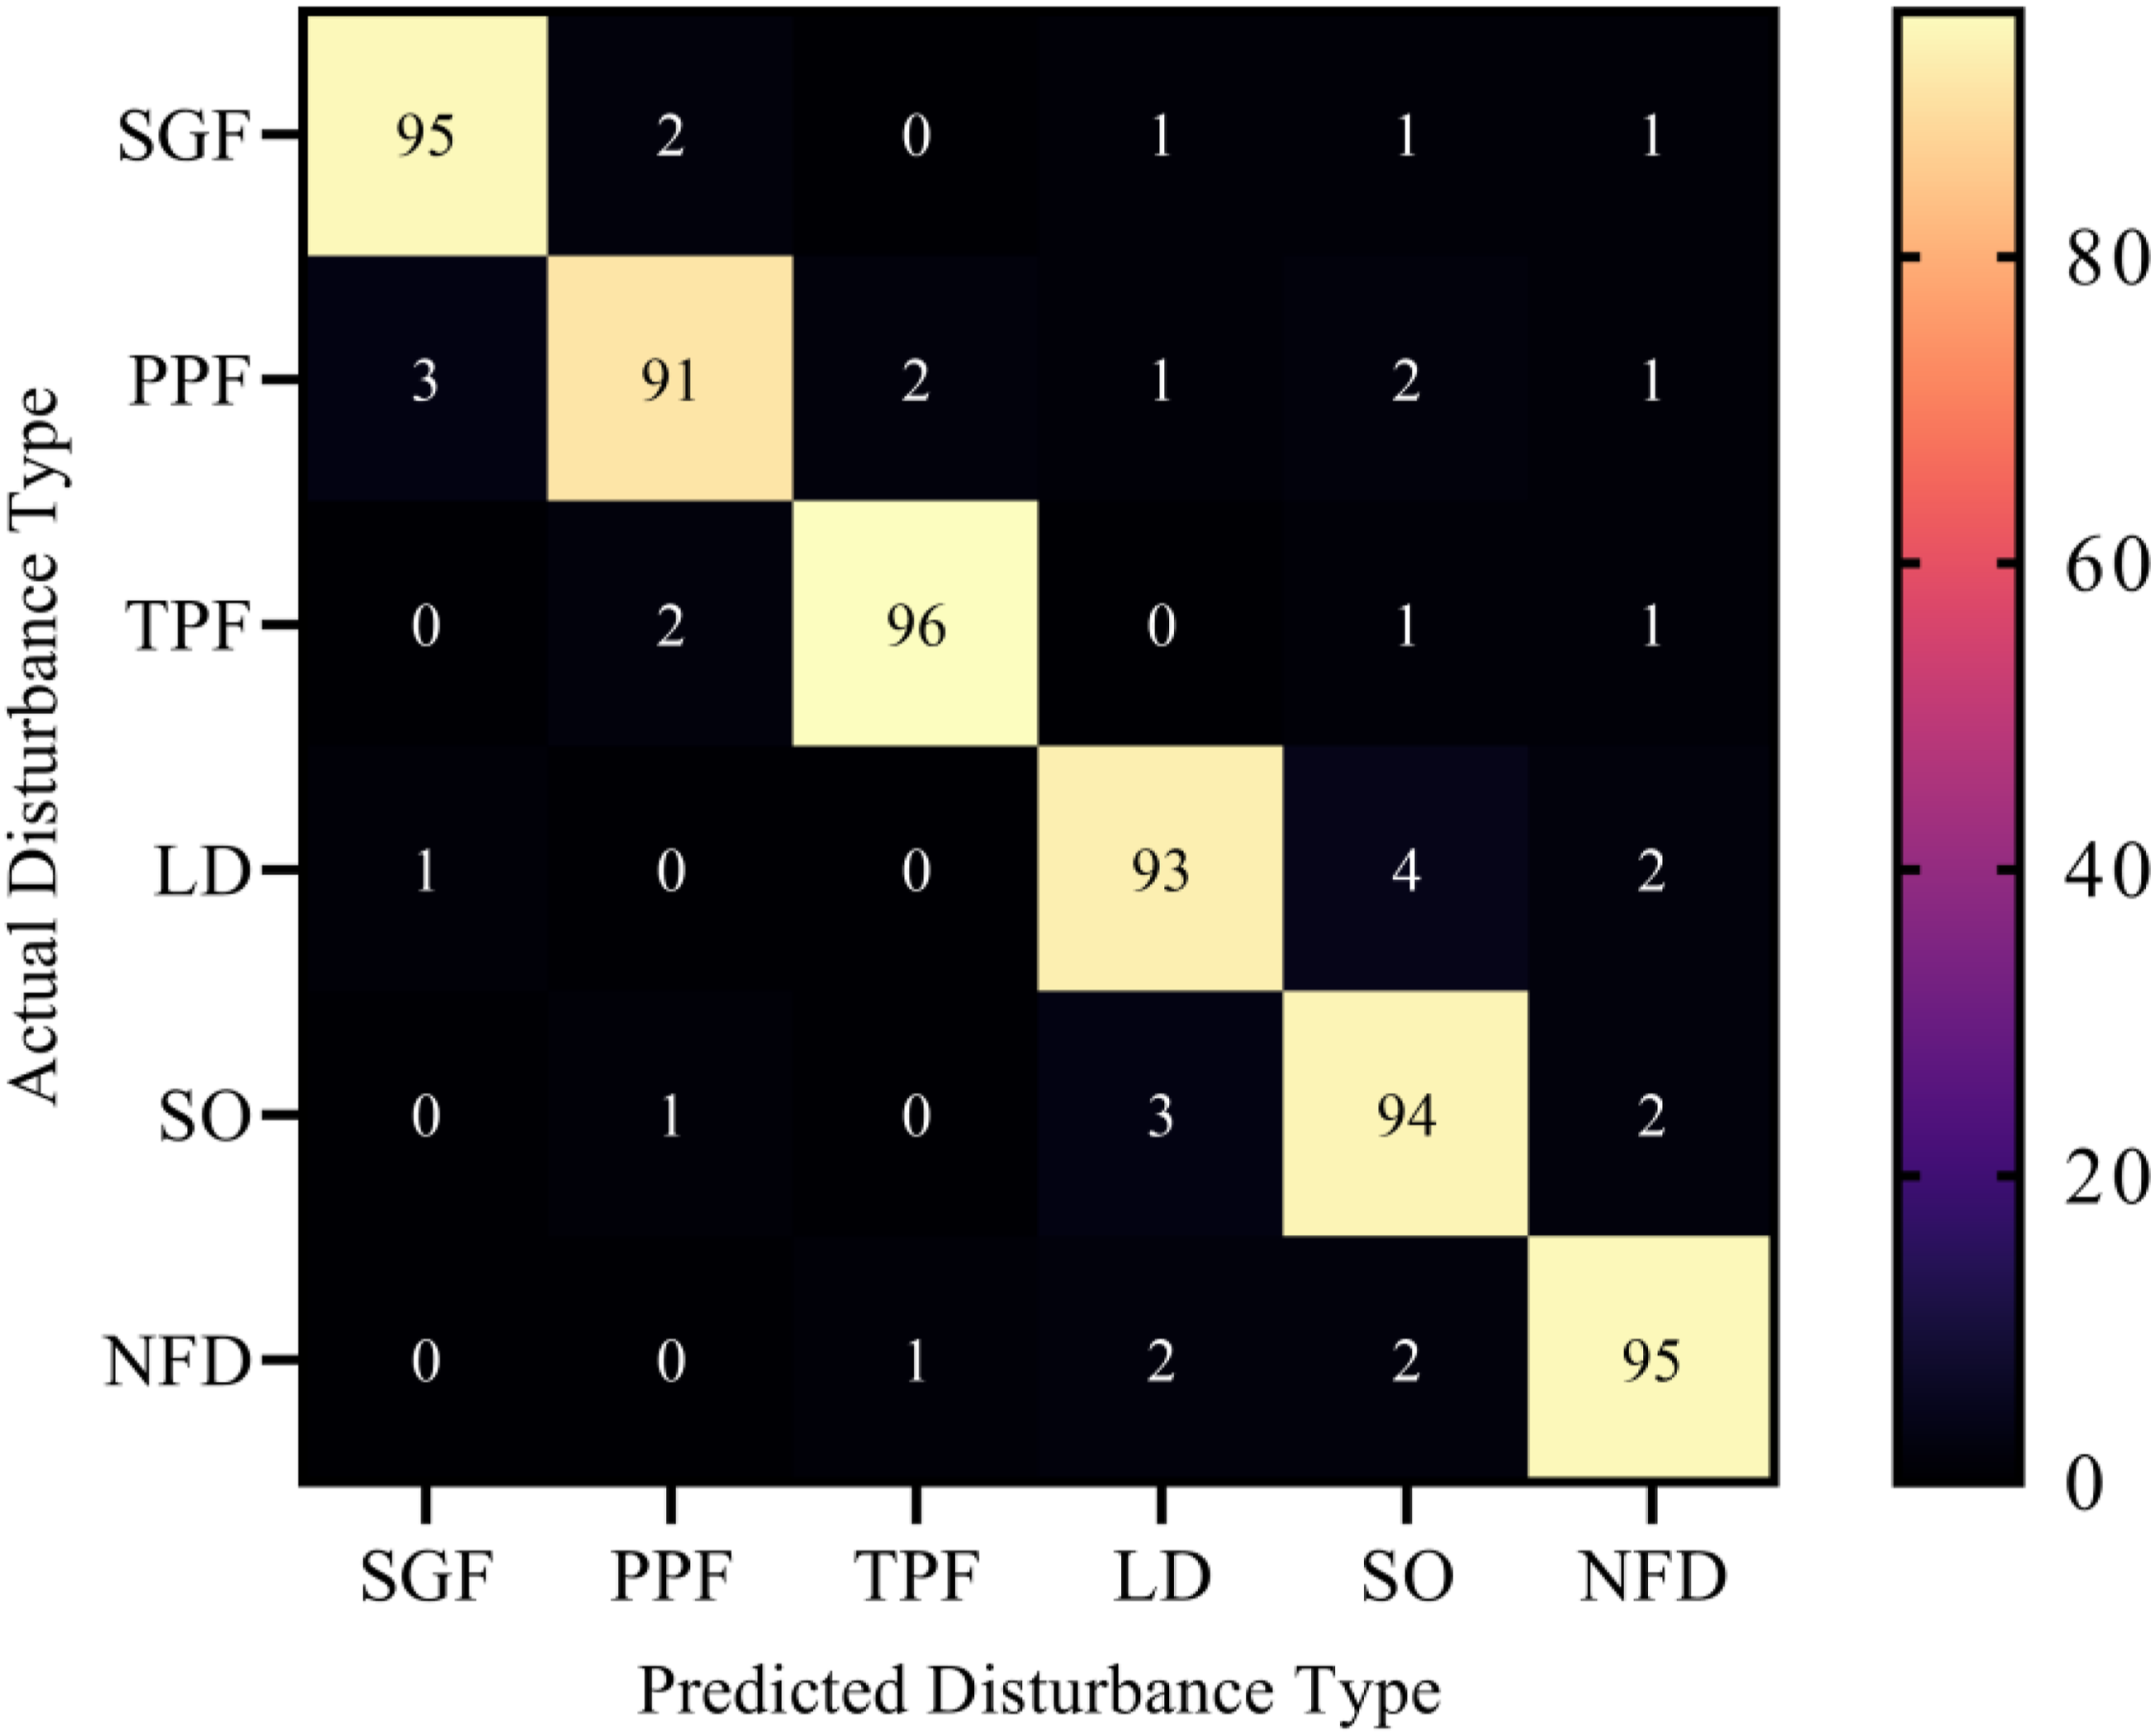
The results in Figure 4 show that the recognition accuracy of TPF and SGF are 96% and 95%, respectively. Due to the clear energy peak distribution in the high-frequency dimension of their signal morphology, the edge-side feature extraction module has a high degree of discrimination in the convolution response. The recognition rate of PPF is 91%, and the misjudgment is mainly concentrated in the SGF category. The reason is that the signal morphology of adjacent grounding faults is similar in the frequency component overlap interval, which affects the category boundary judgment of the Transformer encoder in the local feature aggregation process. The recognition accuracy of LD and SO is 93% and 94%, respectively. The model misjudgment mainly occurs in the boundary fuzzy area between the interference disturbance and the low-intensity fault signal, indicating that the attention mechanism is still insufficient in generalization in transient disturbance modeling. The accuracy of NFD is 95%. Due to its lack of trigger disturbance features, the edge-side abnormal discriminator has clear judgment boundaries on this type of samples. Overall, the model has the ability to separate high-dimensional features for fault disturbances and has strong recognition stability for unstructured noise.
Fault location accuracy
In order to verify the positioning accuracy of the designed system under different spatial positions and multiple types of fault forms, the experiment set up 11 typical fault points distributed along the line from the substation, and constructed 6 common fault types: single-phase grounding, phase-to-phase short circuit, three-phase short circuit, intermittent grounding, high-resistance grounding, and arc grounding. There are significant differences in electrical disturbance characteristics, traveling wave signal amplitude and duration of different types of faults. The single-end characteristics of the single-phase grounding fault signal are obvious, and the propagation direction is easy to confuse; the disturbance intensity of phase-to-phase short circuit and three-phase short circuit is high, and the waveform structure is relatively clear; intermittent grounding has discontinuous disturbances, resulting in unstable signal waveforms; the high-resistance grounding signal amplitude is weak and easily masked by background noise; the arc grounding disturbance pattern is complex, the noise background is strong, and it is very easy to cause recognition errors. The experiment simultaneously carried out accuracy tests in the two dimensions of spatial distance and fault type, and recorded the average error and error fluctuation range. The results are shown in Figure 5. Comparison of positioning errors of the system in spatial position and fault type dimensions. (a) Distribution of positioning errors under different fault point locations. (b) Distribution of positioning errors under different fault types.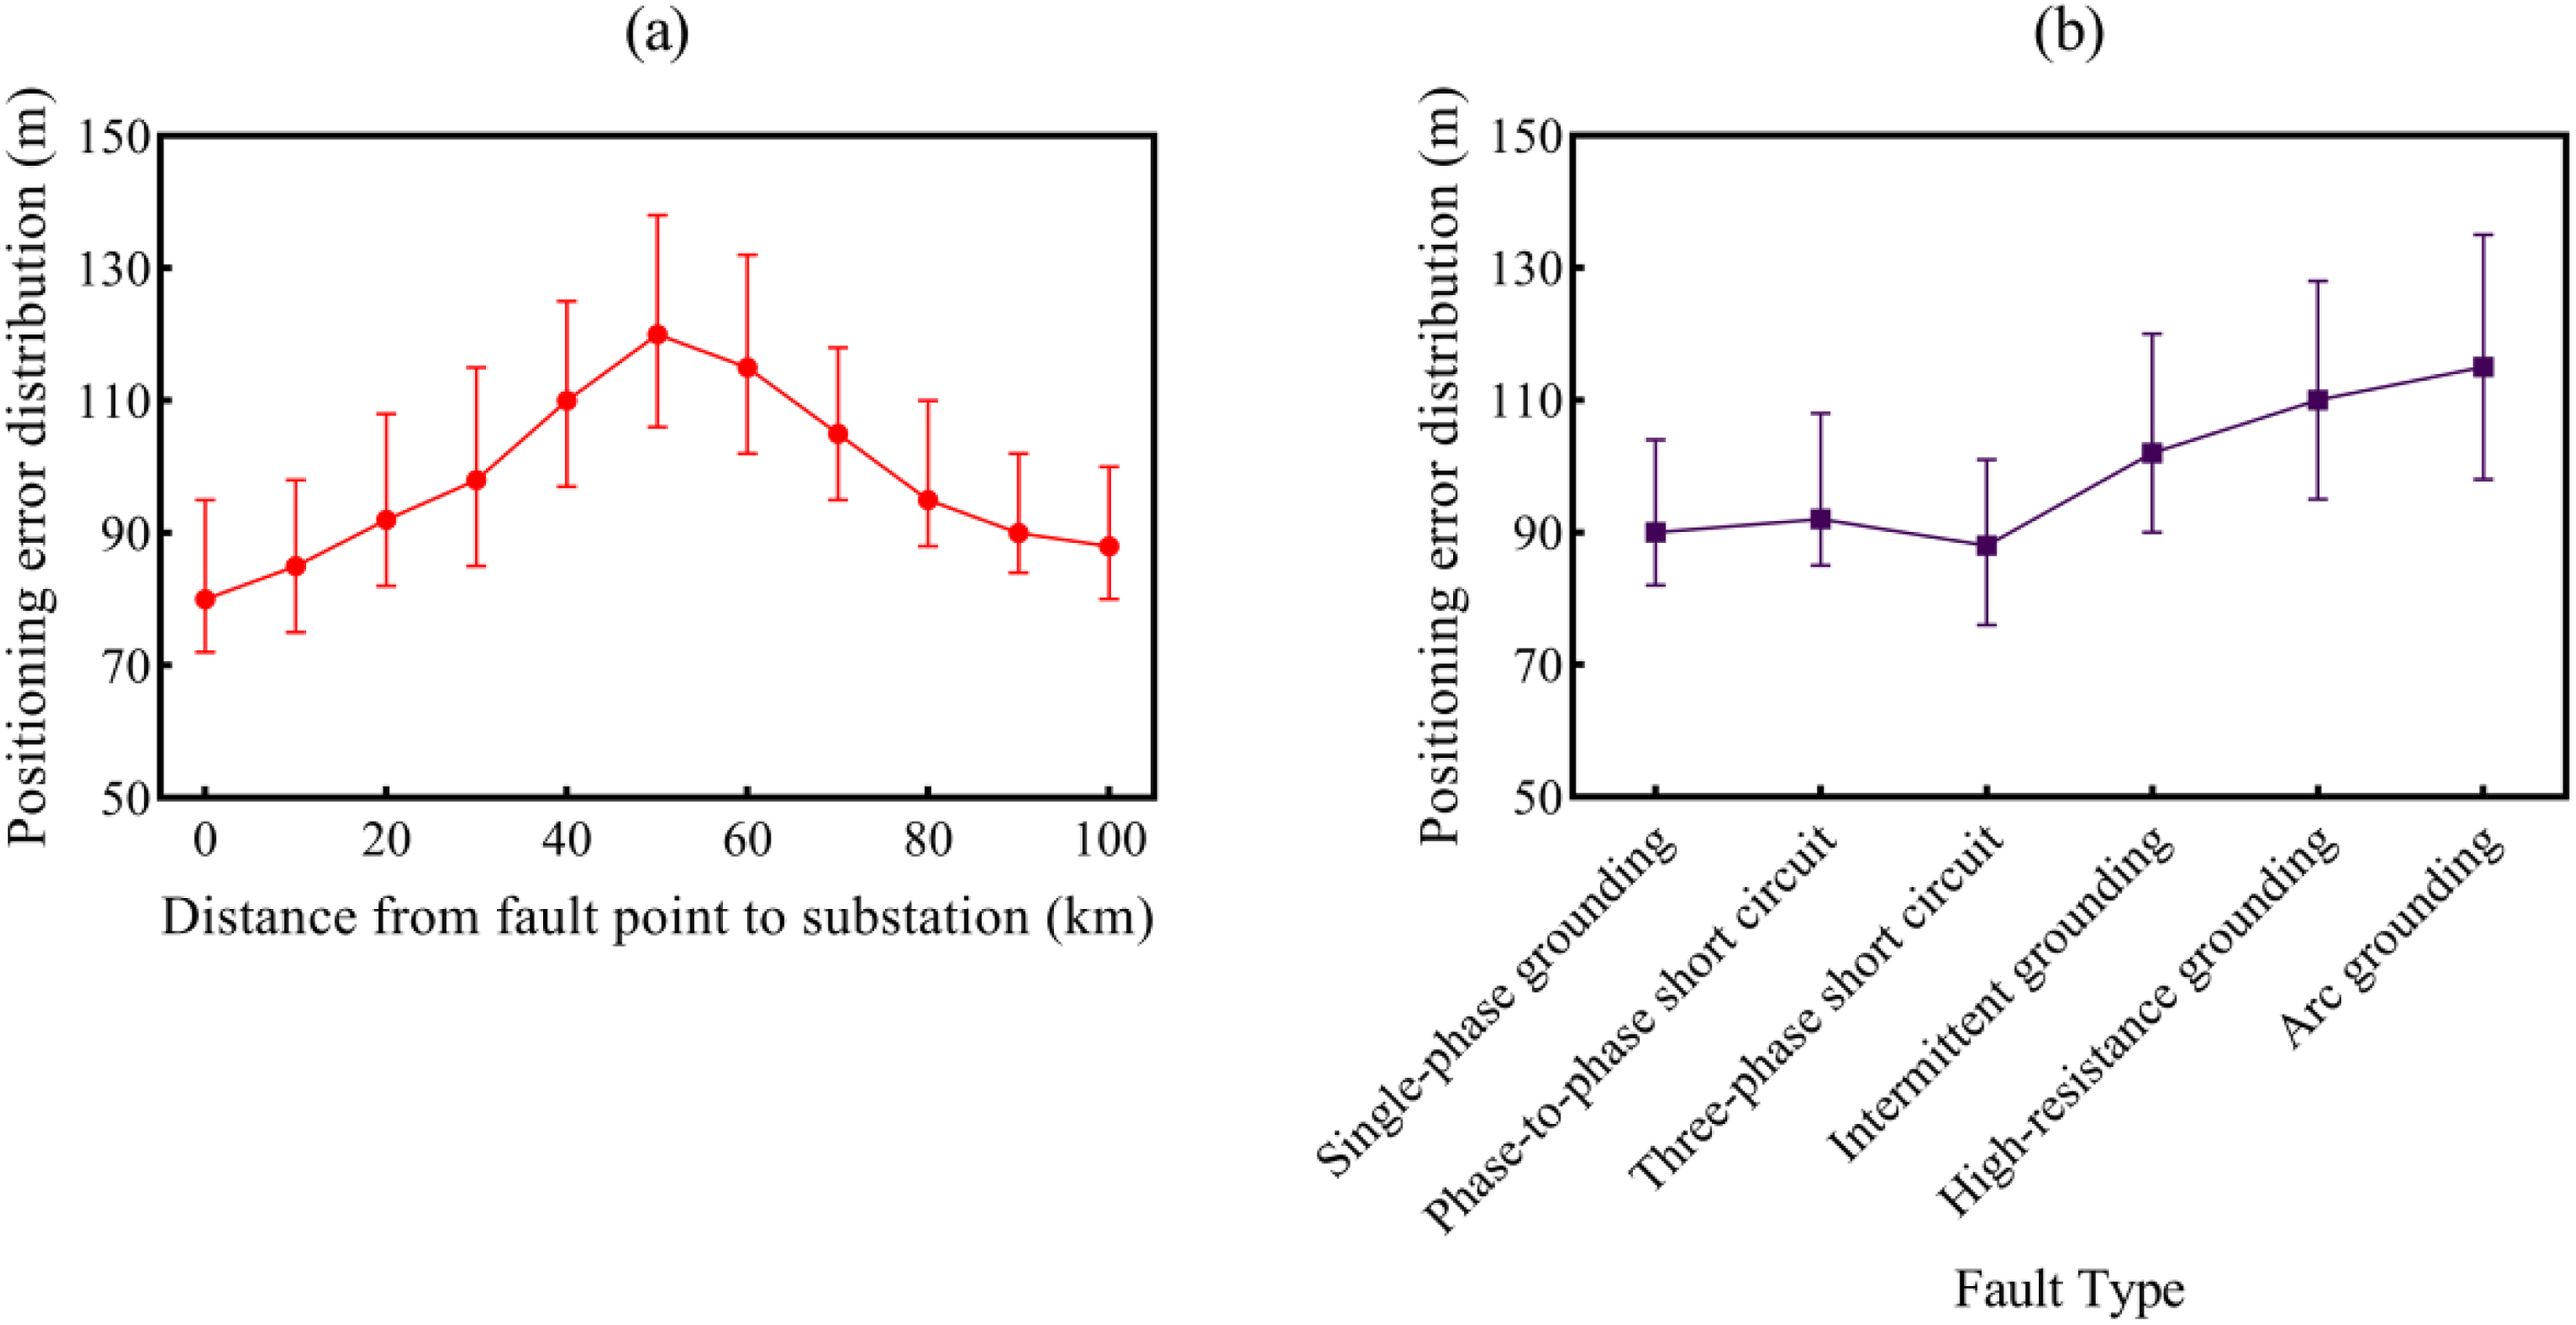
Figure 5(a) shows that when the fault point is located at 50 km, the average system positioning error reaches a maximum value of 120 m, and the corresponding maximum error upper limit is 138 m. This is because the signal at this location is affected by path obstruction and receiving channel mismatch during propagation, resulting in an increase in the probability of misjudgment of edge nodes. The error in the 90 km to 100 km area drops, with average positioning errors of 90 m and 88 m, respectively. Signal propagation tends to be stable, path loss decreases, and positioning result fluctuations decrease. The average error in the range of 0 km to 20 km is between 80 m and 92 m, with a small error fluctuation amplitude, high front-end signal fidelity, and the model performs stably in this area. In Figure 5(b), the average error of arc grounding reaches 115 m, which is the highest value among the six categories, corresponding to a maximum error of 135 m. This is because its non-stationary disturbance frequently interrupts the feature recognition process, and the trigger point drifts significantly. The average error of high-resistance grounding is 110 m, and the signal amplitude suppression causes the feature extraction failure rate to increase. The average error of intermittent grounding is 102 m, and the error range is wide, indicating that the waveform incoherence reduces the stability of the model sequence judgment. The average error of three-phase short circuit is 88 m, and the lower limit of the error is only 76 m, which is the minimum value among all types. The signal symmetry and high-intensity disturbance support the accurate positioning of the model. The overall results show that the designed system has the ability to maintain positioning accuracy under complex disturbance background.
Evaluation of response delay and data processing
In the actual operation of overhead transmission lines, the timeliness of transmission data directly affects the capture completeness of fault signals and the subsequent recognition accuracy. In view of the uncertainty of system response performance under different task volumes, this experiment designed a dynamic task stress testing process based on the end-edge-cloud collaborative structure. By controlling the number of front-end disturbance data inputs, collecting the response time of the terminal, edge and cloud under different load conditions, measuring the data transmission delay under the 5G link, and recording the throughput capacity of the system in single-node and parallel node modes, the performance fluctuations of each module in the process of traveling wave monitoring task processing are comprehensively evaluated. During the experiment, the task input was set to 100, 300, 500, 700, and 1000 electrical disturbance data, respectively, and the analysis object covered the entire process of data from perception to transmission to fusion and recognition.
The data in Figure 6 shows that the terminal response time has steadily increased from 4.8 milliseconds to 6.7 milliseconds, with a small increase, which is mainly limited by the sensor interrupt processing and cache forwarding efficiency. The increase in collection pressure has not led to a significant decrease in response capability. The edge response time increased from 6.1 milliseconds to 8.2 milliseconds, with a slightly faster growth rate than the terminal. The reason is that the lightweight convolutional neural network needs to complete more concurrent recognition when the task increases. Although the model has been pruned and quantized, there is still a problem of increased computing resource usage. The cloud response time increased from 12.3 milliseconds to 17.3 milliseconds, which is a more obvious increase. The main reason is that the Transformer structure has a linear expansion of inference time as the sequence length increases, and the fusion of multiple asynchronous node data requires additional synchronization scheduling and aggregation time. The uplink and downlink transmission delays also showed a steady upward trend, increasing from 9.4 milliseconds to 7.1 milliseconds to 18.6 milliseconds and 13.0 milliseconds, respectively. The main factors affected are the backlog of link scheduling queues and the dynamic competition of bandwidth resources under high task density. In terms of throughput indicators, the processing capacity of a single node decreased slightly after the increase in the number of tasks, from 2.17 per millisecond to 2.10 per millisecond, while the four-node parallel mode always remained above 4.20 per millisecond, indicating that the collaborative architecture has obvious task sharing and processing gain effects under high concurrent loads. The overall results verify that the system has strong response control capabilities and parallel scheduling capabilities under different task pressures. Response and throughput performance of the overhead transmission line traveling wave monitoring system. (a) Changes in the response time of the end-edge-cloud module. (b) Changes in data transmission delay. (c) Changes in system throughput with task volume.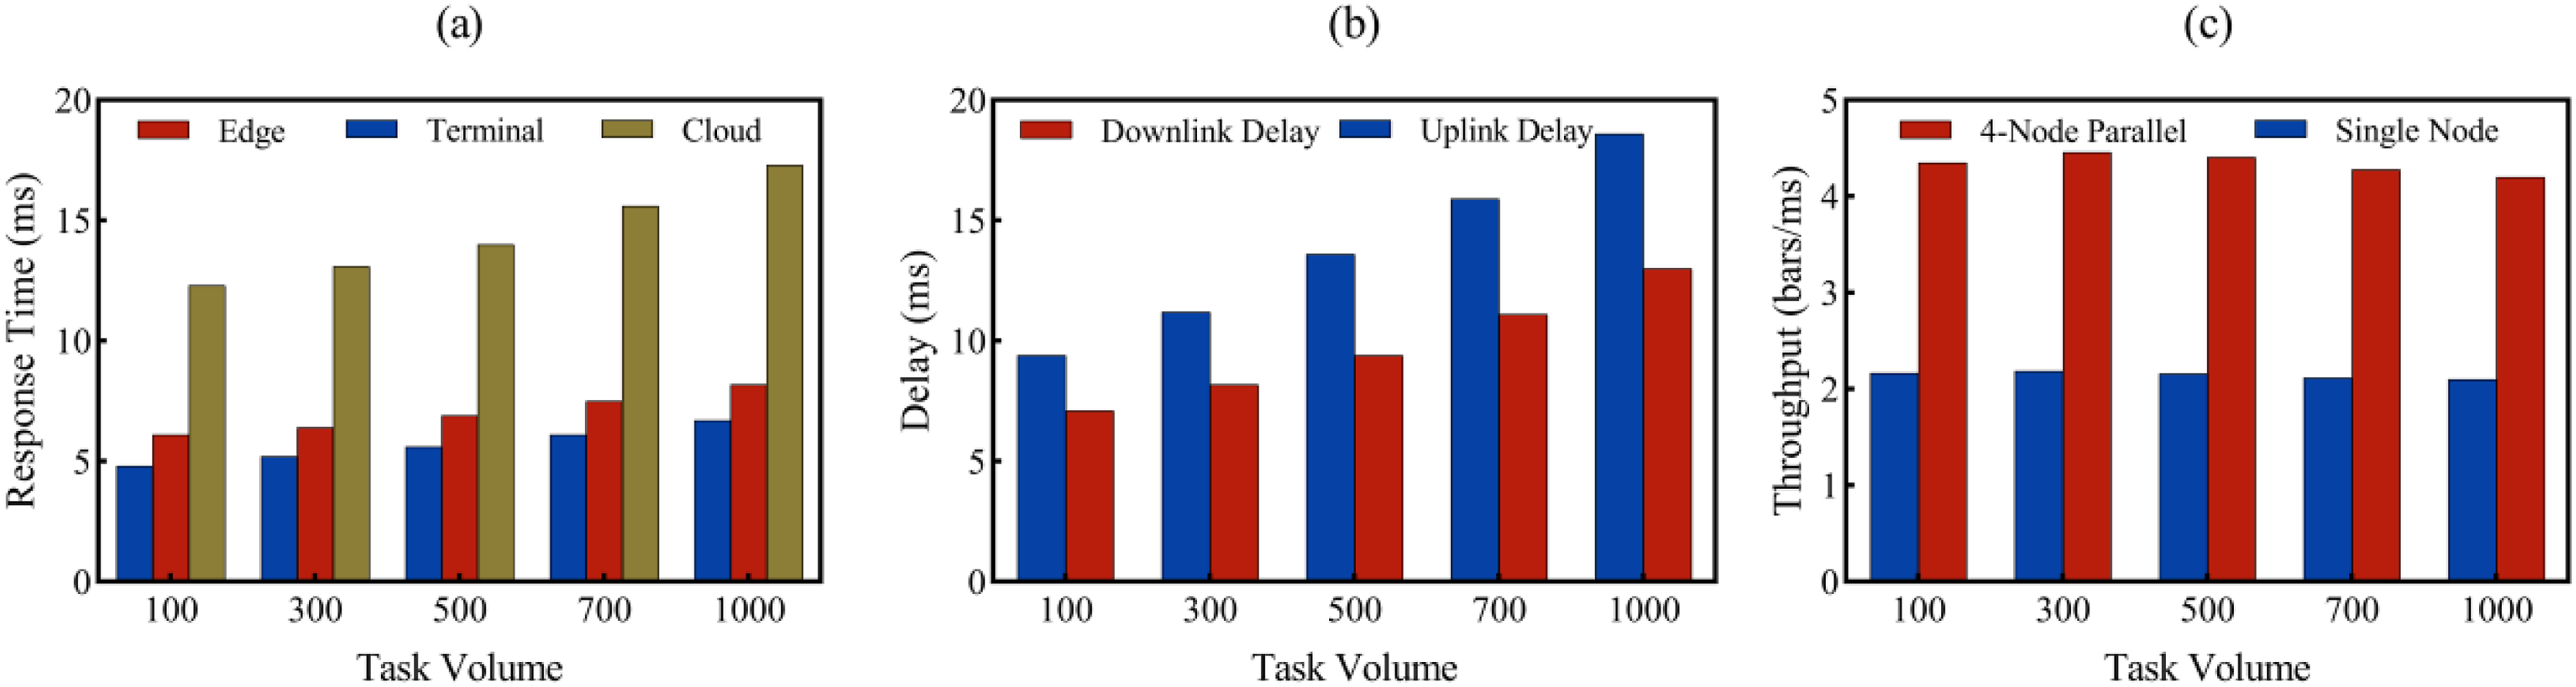
Multi-node collaborative processing
In order to evaluate the operating characteristics of task scheduling and response capabilities under the multi-node collaboration mechanism, this paper designs an experimental scheme with increasing number of nodes. By setting 1 to 20 nodes to form collaborative groups of different sizes, the task allocation and signal response processes are started in sequence, and the average task allocation time and total response delay in the end-edge-cloud collaboration process are recorded. The central scheduling module issues identification subtasks to each edge node for task allocation, and the response delay counts the overall processing time from the triggering of the disturbance signal to the return of the cloud analysis result, which is used to verify the scheduling load and response convergence trend of the system under the change of the number of concurrent nodes. Figure 7 shows the changing trajectory of task scheduling and processing delay during the expansion of node scale. Comparison of task allocation time and response delay under multi-node conditions.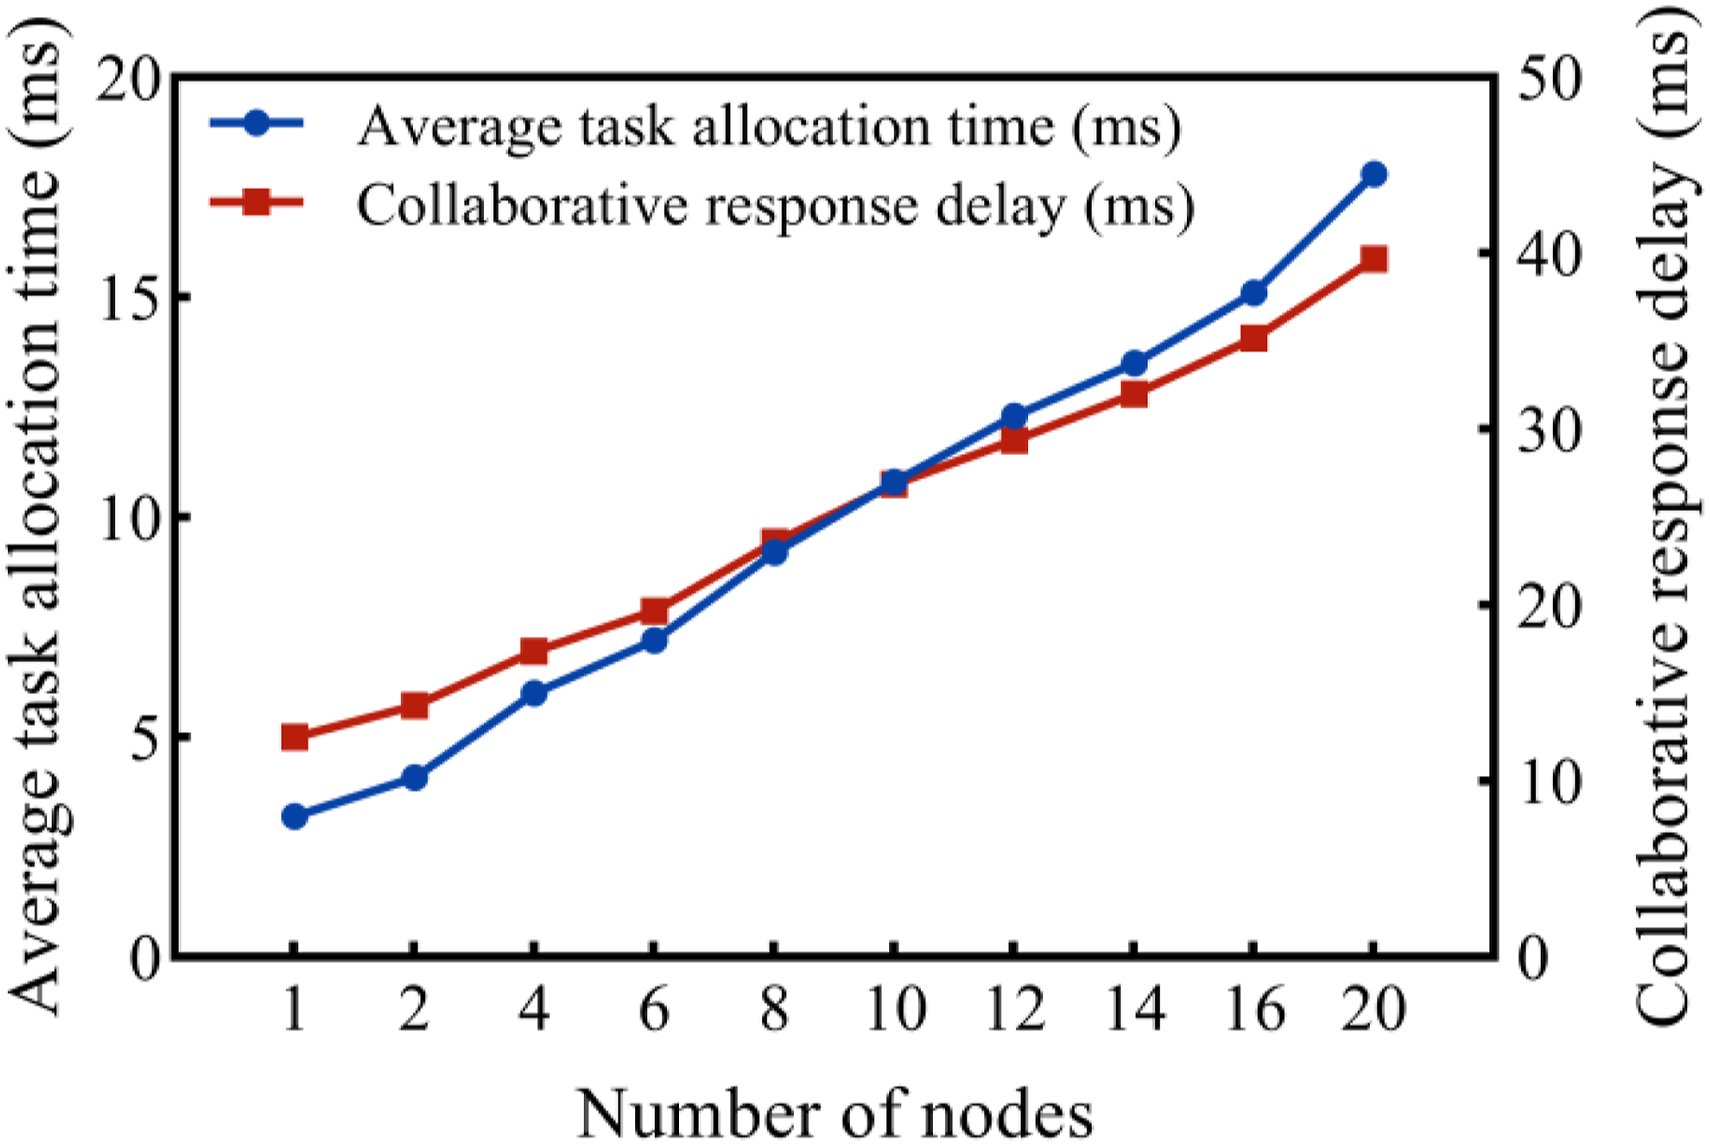
The data in Figure 7 shows that the task allocation time increases from 3.2 milliseconds when the number of nodes is 1 to 17.8 milliseconds when the number of nodes is 20, showing a nonlinear upward trend. The main reason is that the scheduling module needs to maintain more complex synchronization states and data transmission queues during the expansion of node scale, and the scheduling algorithm gradually accumulates overhead as the number of nodes increases during multi-threaded resource allocation. The collaborative response delay increased from the initial 12.5 milliseconds to 39.7 milliseconds at the maximum scale, and the increase was obviously limited by the increase in link convergence efficiency and the average completion time of edge computing. Since the recognition and processing of edge nodes uses a lightweight model, the computational burden expands slowly, and the main delay is concentrated in the aggregation of intermediate results between nodes and the final fusion decision stage. The overall trend shows that the system maintains a high scheduling efficiency under small-scale concurrency conditions, and the complexity of collaborative scheduling increases as the number of nodes increases, which in turn affects the overall response capability.
System stability test under different network environments
In the real-time monitoring of the power system, the quality of the network environment has an important impact on the performance of the system. In order to verify the stability and robustness of the system under different network conditions, this experiment set up three typical network environments for testing: 5G high-quality network, 4G medium-quality network and weak Wi-Fi network. Each network environment has different signal strength, delay and volatility. The 5 G network represents the best wireless communication environment at present, with low delay and volatility, which can ensure high system performance; although the 4G network is slightly inferior to 5G, it can still provide relatively stable signals and moderate delays under medium quality; the weak Wi-Fi network simulates an environment with unstable signals and high delays to examine the performance of the system under unfavorable network conditions. The experiment uses multiple key performance indicators for comparative analysis to comprehensively evaluate the impact of these network environments on various system indicators. Figure 8 shows the system performance data under three network environments. System stability and performance under different network environments.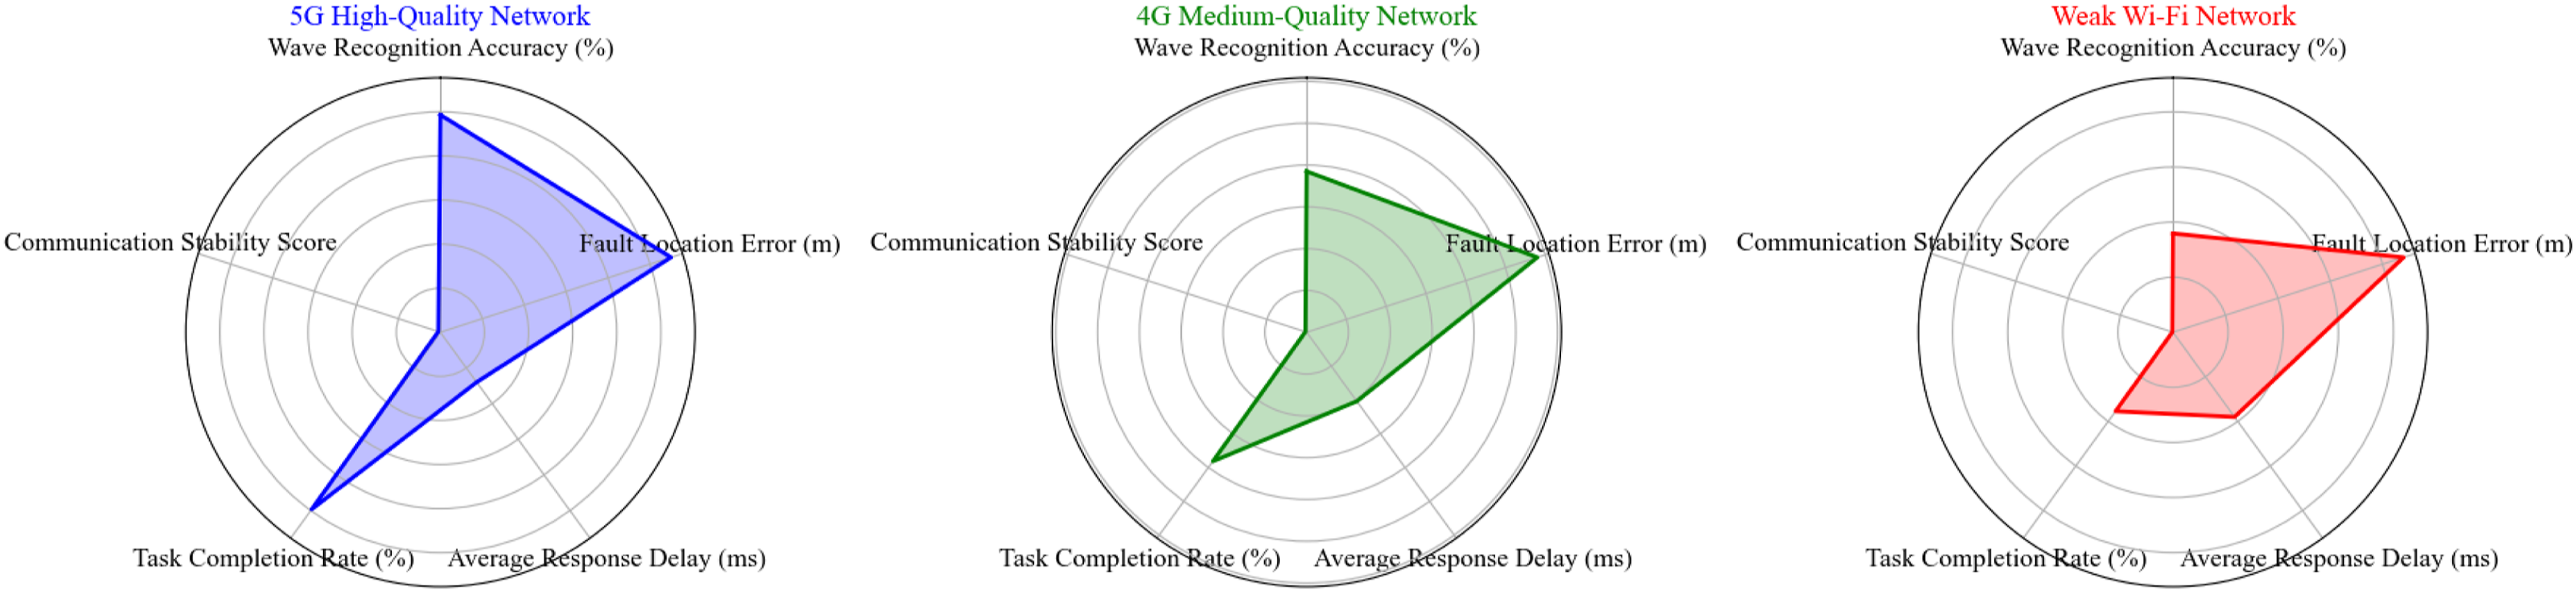
As can be seen from the data in Figure 8, the 5G high-quality network performed best in all test indicators, with a traveling wave recognition accuracy of 98.6%, a fault location error of 110 m, a response delay of 28 milliseconds, a task completion rate of 99.3%, and a communication stability score of 0.97. In comparison, the performance of the 4G medium-quality network has declined. In terms of fault location accuracy and response delay, the positioning error increased to 145 m, the response delay rose to 51 milliseconds, and the communication stability score dropped to 0.83. These changes are mainly due to the disadvantages of the 4G network in terms of signal strength and delay fluctuations, which lead to certain delays and errors in the data transmission process. In the weak Wi-Fi network, the traveling wave recognition accuracy dropped to 89.7%, the positioning error increased significantly to 220 m, the response delay reached 95 milliseconds, and the communication stability score was 0.62. This result reflects the serious constraints of the weak signal environment on the system performance. The packet loss rate and delay fluctuation of data transmission significantly affect the real-time performance and accuracy of the system. It can be seen that the quality of the network environment directly determines the stability and accuracy of the system. Under a high-quality network, the system can give full play to its advantages and achieve efficient and accurate fault monitoring and positioning.
Conclusion
This paper constructs a real-time traveling wave monitoring system for overhead transmission lines that integrates the Internet of Things and cloud computing architecture. Based on the end-edge-cloud three-layer collaborative mechanism, it realizes efficient collection, feature extraction and fault identification of high-frequency disturbance signals. The system uses a 500 kHz high sampling rate sensor terminal in the perception layer, deploys a quantized compressed L-CNN model on the edge side to complete local anomaly discrimination and data compression, and realizes multi-source time series modeling and spatial fusion identification through the Transformer model in the cloud. The experimental results show that the system has an identification accuracy of 96% for three-phase short-circuit faults, an average positioning error of 88 m, and a task processing throughput of more than 4.20 items/ms in the four-node parallel mode, indicating that the system has good performance in fault type identification, positioning accuracy and processing efficiency. The current system still has problems of link congestion and scheduling response fluctuations in large-scale node concurrency and weak communication environments. Subsequent research will optimize the multi-node synchronization mechanism, strengthen the lightweight design of edge models, and explore distributed parameter updates and heterogeneous collaborative scheduling strategies to further enhance the generalization ability and robustness of the system in complex power grid environments.
Footnotes

Funding
The authors disclosed receipt of the following financial support for the research, authorship, and/or publication of this article: This work is supported by the Science and Technology Project of China Southern Power Grid Co. Ltd Project No. 030000KC23110046 (GDKJXM20231233).
Declaration of conflicting interests
The authors declared no potential conflicts of interest with respect to the research, authorship, and/or publication of this article.