




Abstract
This study proposes a standard costs method to evaluate the total direct costs of a juvenile justice system and applies it to the Italian case. The proposed cost-analysis method based on standard costs by offense-related groups illustrates how it can be implemented for improving the quality of management and cost monitoring. An illustrative cost-benefit analysis of the costs of juvenile justice in Italy shows that investments in rehabilitation programs are highly attractive even during a period of economic crisis and in very different regions.
Introduction
During times of economic recession, basic services to protect children are at risk, as funds for essential health, education, and welfare services are among the first to be reduced. Children are especially vulnerable to public expenditure cuts (Jenkins et al., 2013; Lundberg and Wuermli, 2012; Ruxton, 2012).
Youth justice systems are also exposed to increasingly stringent budgets and economic stagnation because in most countries the service is partly provided by the public sector and partly privately. The Italian system is no exception. In the last decade, the average number of young offenders in custody every year in private communities has tripled from about 300 in 2001 to about 950 in 2012 with about 30 per cent foreigners (Italian Department of Juvenile Justice, 2016). In many European countries, fiscal consolidation and austerity policies contributed to reduce both quantity and quality of youth justice services provided by the state and community non-governmental organizations. The sustainability of the public/private partnership of juvenile justice is in jeopardy.
The relationships between the economic crisis, increased material and immaterial forms of poverty and juvenile crime are very close (ECJJ, 2012; International Juvenile Justice Observatory (IJJO), 2013; Levitt and Lochner, 2001; World Health Organization, 2010). The Italian data show a strong relationship, as is apparent from Graph 1. The number of young offenders that formally entered the justice system in 2007, at the beginning of the massive recession, was about 14,000 (including those charged without arrest), increasing to more than 20,000 in 2012. 1 A higher number of crimes mean higher costs. Because of scarce public resources due to economic recession or stagnation, a higher proportion of children is left behind (Menon et al., 2017) and will have a hard time catching up (de Blasio and Menon, 2016).
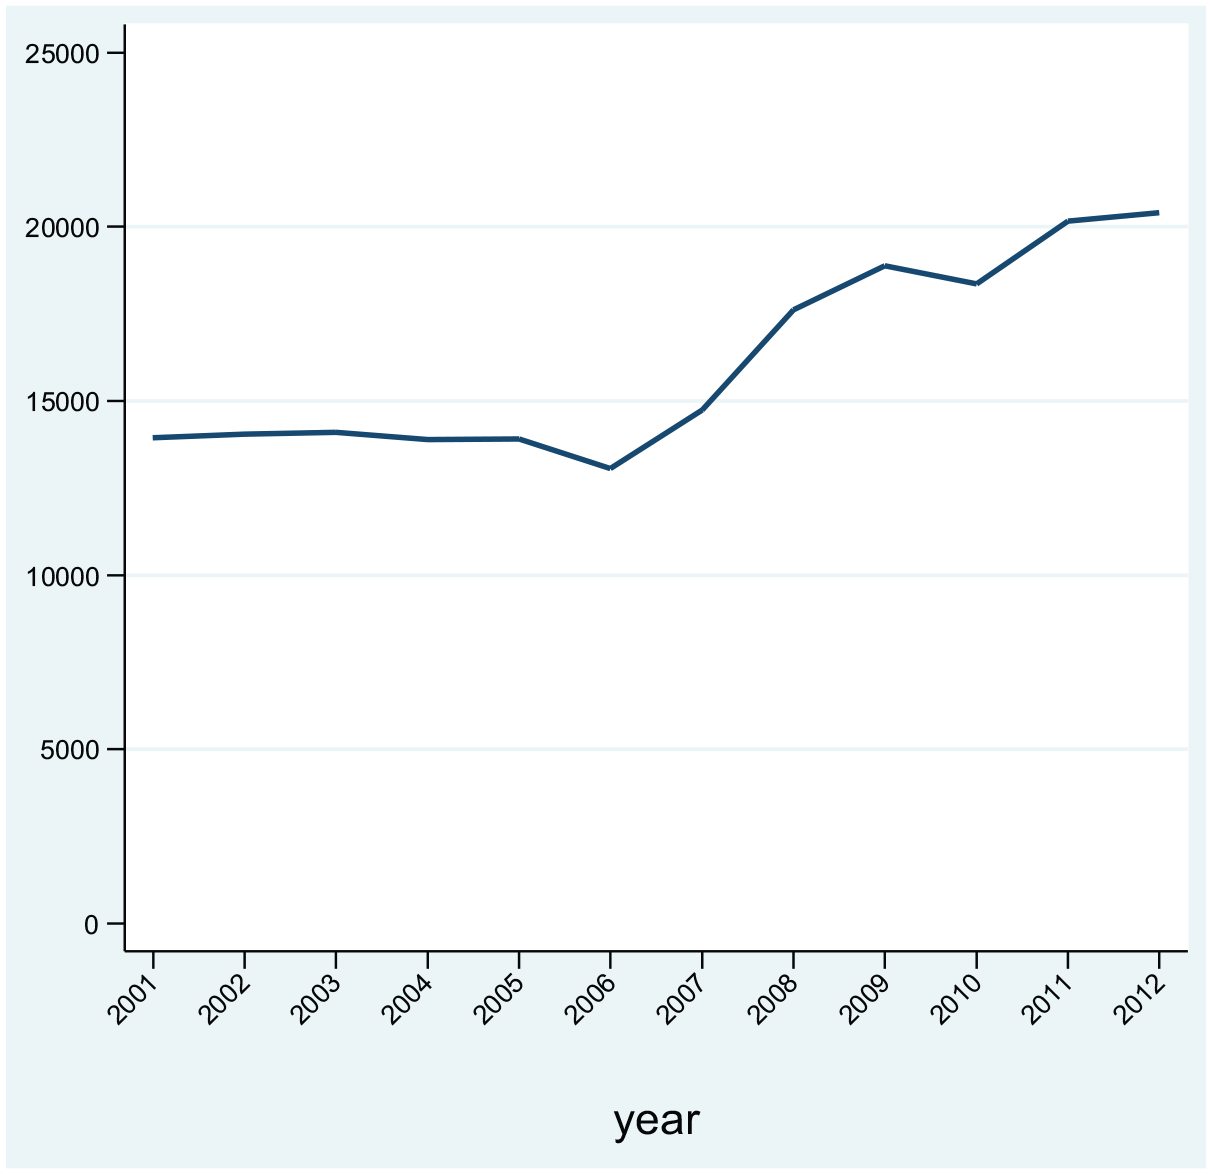
Evolution of Juvenile crime during the Recession: Youth in custody in Italy.
Undertaking an evaluation of the cost, efficiency, and effectiveness of a youth justice system is a difficult task due to the general lack of reliable and robust data. Data collection, monitoring, and evaluation and research are the keys to achieving evidence-based policies aiming to make the service more efficient and cost-effective and to measure improvements made for children incurring problems with the law.
Greater efficiency, that is spending less money to achieve the same outcomes for all our children, and effectiveness, that is, improving children’s outcomes and opportunities in an appreciable way, ensure that the State provides value for money to the taxpayer (Aos et al., 2001). Leaving a young member of society behind is both a private and social cost that builds up in a future that is difficult to predict.
In general, effective prevention reduces the likelihood that a child at risk of conflict with the law will be arrested. Prevention of any form of social exclusion that may be responsible for an offense is more desirable than a cure aiming at reintegrating into society a child offender. It is an investment in the future, not a cost. Diversion is a viable option for preventing a child from moving further into the criminal justice system by undergoing a trial, increasing the risk of further damage, with extra costs to society. Before sentencing a judge may propose bail. A sentence may include a community sanction or call for a detention period (Kilkelly, 2011). 2
Detention is often the most expensive youth justice service and is potentially harmful for children because they may be more likely to re-offend and they become more difficult to reintegrate, given the same opportunities provided to other young people (IJJO, 2013; McAra and McVie, 2007). However, diverting young offenders and resorting to community sanctions significantly affect reintegration, recidivism, and costs (Holman and Ziedenbuerg, 2006).
Diversion can be an effective means to improving efficiency by reducing the number of children going through the court bottlenecks. It also provides more equitable access to justice whose costs can often be discriminatory. The court process is the most lengthy and expensive component in the juvenile justice system. It should be used strictly for cases threatening serious damage to society. To ensure effective educational and re-inclusive action, children should be tried without undue delay. Victims also deserve rapid court proceedings (Esposito et al., 2014; OECD, 2013; Wilson, 2010).
In Europe, about 80 per cent of children who commit an offense do not re-offend (IJJO, 2013). In the 2010 sample of young offenders collected in North-Eastern Italy and Sicily regions of Italy (Menon et al., 2017), about 34 per cent offended a second time. This higher than average data are not surprising during times of economic and social crisis. For petty or minor offenses, it is still reasonable to believe that a verbal warning, family involvement, or a mediation program within a restorative justice framework prevents children from unnecessary criminalization and stigmatization (Holman and Ziedenbuerg, 2006; IJJO, 2011; Jacomy-Vite, 2011).
For children who commit an offense calling for a court sanction, a community sanction such as counseling, probation (pursuant to section 28 of Presidential Decree 448/88), vocational training and work, or mediation, rather than a penal sanction in isolation, is highly preferable. Children have greater opportunities for social reintegration and making amends to their communities for the damage they caused (Barton and Butts, 1990; Henggeler et al., 1998; Nelken, 2006).
The main aim of this study is to quantify the costs associated with each component of a youth justice system and its overall assessment in order to provide public authorities with reliable information to improve the efficiency and effectiveness of the system. This cost analysis can be used as the basis to implement a pragmatic and coherent spending review that can generate important savings while guaranteeing the sustainability of the system and the quality of the services provided. Systematic information about the cost structure of a justice system can also be informative to undertake a cost-benefit analysis.
The Italian juvenile justice system is an interesting example because it can be considered as a representative model for those national systems implementing a rehabilitative perspective (Dünkel et al., 2011). It is an instructive case, because, as it is common to many juvenile justice systems in Europe, there is no systematic collection of costs associated with the different treatments of young offenders. It is worth remarking that the cost method proposed here can be applied to all justice systems, for the youth or the adults, and not necessarily based on a restorative paradigm because it is based on the reconstruction of the cost structure of care packages that can be provided, for example, either by penal institutions or communities. In general, this standardized appraisal tool can be adopted by other national jurisdictions willing to improve the efficiency of their systems and to ensure greater transparency of reporting, in spite of the fact that the direct monitoring of the costs of the juvenile justice system is prohibitive.
The deficit in the system is not specific to Italy, but seems, to varying extents, to be a general problem in Europe. In order to optimize the resources flowing into the system, the IJJO (2011) green paper recommends that statistically robust data about the entire costs of the judicial measures per day and per act should be collected along with information about capacity and occupation rates for the facilities involved (Pruin, 2011).
In Italy, there is no structured cost evaluation of the youth justice system. We propose a cost evaluation method similar to the standard cost method adopted for the evaluation of the health sector (Baker, 2002; Drummond et al., 2015; Kuntz et al., 2008; Larg and Moss, 2011) and use it to provide a statistically robust estimate starting from minimal information. We also compare estimated costs with estimated benefits stemming from the justice system as deduced from the families’ willingness to pay for social rehabilitation programs.
The study is organized as follows. The next section describes the structure of the Italian juvenile justice system. The subsequent section illustrates how to implement the proposed standard cost method and explains the care packages used in the simulation technique. The section devoted to the results presents the estimated costs and scenario analyses and compares costs with potential benefits. Concluding remarks and policy considerations follow.
The Structure of the Italian Juvenile Justice System (IJJS)
To understand the cost structure of the IJJS, we summarize here the main features of the operational and organizational architecture of the services for minors in conflict with the law (Dünkel et al., 2011; Gatti and Verde, 2002; Padovani et al., 2011). As illustrated in Figure 1, when a child is arrested, he or she enters the penal structure comprising a Reception Center (Centri di Prima Accoglienza–CPA), the Juvenile Social Service Offices (Ufficio di Servizio Sociale per i Minorenni–USSM), the Penal Institution for Minors (Istituto Penale per i Minorenni–IPM), and the Rehabilitative Community regulated by the foundational Legislative Decree issued on 28 July 1989, no. 272 (Barbagli et al., 2003).
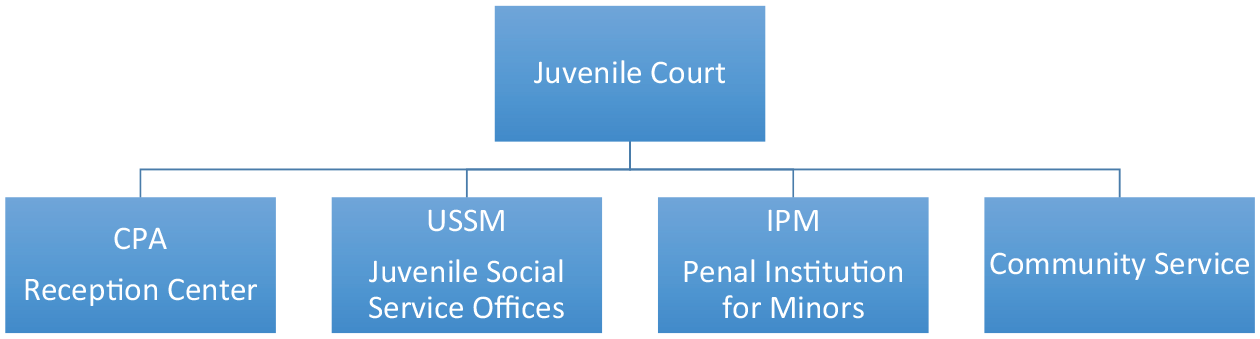
Structure of the Italian juvenile justice system.
All services offered by the juvenile justice system are coordinated by the Department of Youth Justice, one of the four departments of the Justice Ministry. The Department has 12 territorial centers (Bari, Bologna, Cagliari, Catanzaro, Florence, L’Aquila, Milan, Naples, Palermo, Rome, Turin, Venice), 27 Reception Centers, 19 Penal Institutions for Minors, 29 Juvenile Social Service Offices located in the Court of Appeal districts, 3 11 Ministerial Communities and a range of private social communities that collaborate with the various territorial Centers of Juvenile Justice (CGM).
Reception center (CPA)
The CPA is the service in charge of hosting minors that have been arrested or taken into custody, providing hospitality until the validation hearing before the pretrial investigation judge (GIP), which must take place within 96 hours of the arrest. The CPA, while ensuring the custody of the child, does not provide a detention service. Not all young offenders in custody pass through the CPA.
Juvenile social service offices (USSM)
These facilities were initially established in 1934 by Royal Decree 1404 with the mission of rehabilitating minors with irregular conduct or personalities, treating, and preventing juvenile delinquency. Legislative Decree 1985 of 1962 established that Social Service Offices be located in each Court of Appeal district, assigning to them the additional task of undertaking studies and sociological surveys pertaining to the prevention of juvenile delinquency. In the 1988 reform (Presidential Decree 448/1988) of the code of criminal procedure, the duties are further specified as formal collaboration with the social and health services of municipalities and provinces in order to jointly implement rehabilitation programs that effectively take into account the personality traits of young offenders and the specific circumstances of their family and community background. Officers are also expected to report to the Judicial Authority about personal conditions and circumstances, to recommend a customized intervention program for the acceptance of responsibility by the young offender and reintegration, to provide assistance during criminal proceedings and to verify the outcomes of the intervention plan until the young person in conflict with the law reaches 21 years of age.
Penal institutions for minors (IPM)
The IPM implements the measures involving deprivation of liberty ordered by the Judiciary in the form of arrest warrants or orders to carry out sentences in relation to the condition of children. Those who enter IPM are between 14 years old and 21 years old. The specificity of each treatment can be traced to the need for protection of the personality of the child, as guaranteed by the Italian Constitution on which our juvenile justice system is based. The IPM carries out the stricter criminal measures and implements rehabilitation programs respecting the rights of the child in custody. The 19 Italian Penal Institutions receive an average of 500 children per year. This figure was fairly stable in the decade 2001–2012 (Source: Italian Department of Juvenile Justice).
Community service
Communities are facilities organized around a family model that host minors in community custody as established by section 22 of Presidential Decree 448/88. These facilities also organize educational and work activities to facilitate the social re-inclusion of young offenders, in line with the institutional mandate aimed at social reintegration. The Italian context offers 11 Ministerial Communities and a wide range of affiliated private social facilities.
The next section describes the standard cost method and data used in the analysis.
Costing Methodology
In Italy, there are no official data for the cost of each treatment step in the juvenile justice system. How much is spent on the public facilities of the justice system can be gleaned from state budget transfers. This is an aggregate figure allocated to each cost source. Little is known about the cost efficiency of the facilities at the micro level, public and private, or about the whole public/private system. As a consequence, without data aggregated through a ‘digitalized’ bottom-up process, the components of the system lacking cost efficiency cannot be established. This lack of information prevents the central administration from optimizing the use of the human, financial, and material resources of the system and offering the best service quality at minimum cost, with evident advantages for both taxpayers and beneficiaries.
To advance the quality of judicial decisions, the IJJO guidelines advise collecting information on actual duration and delays, either due to the Public Administration or the authorized associated sector of the different stages of the proceedings. However, to optimize the quality of the care of juvenile offenders, it would be important to record information about the level of educational care for juveniles in custody or within penitentiary establishments for minors, the enrolment rates of minors, either under a form of deprivation of liberty or charged without arrest, and involved in an inclusion or child-friendly treatment program such as a mediation procedure, and the proportion of juveniles under 17 that reoffended up to the age of 21 (recidivism) 4 (Jacomy-Vite, 2011; Kilkelly, 2011).
Our interest here is in the cost efficiency of the system. Fixed and variable costs and duration of custodial sentences are not known with certainty and are, therefore, estimated using statistical simulation techniques. Only direct costs are included, although we acknowledge the presence of indirect and intangible costs. In general, fixed costs include management, maintenance, and personnel costs, while variable costs include food, linen, water, heating, and other variable expenditure. In general, the ‘standard’ cost of each care package per beneficiary is derived by adding the cost of each institution and service included in the package.
We borrowed this standard cost procedure from the costing methodology often adopted in the cost effectiveness evaluation of health care systems (Baker, 2002; Kuntz et al., 2008; Larg and Moss, 2011; Mayes, 2007). It consists in defining homogeneous groups of cost items specific to each care package associated with a diagnosis (diagnosis-related groups–DRGs). The DRG is a system initially designed to classify hospital cases into 1 of 467 groups of illnesses. These groups of cost items also account for different treatments and length of hospital stay. In general, costs vary from hospital to hospital. Because monitoring of the costs for each DRG in each hospital may be very expensive, health administrations estimate average DRG costs using standard costs per each cost item related to the group.
In analogy to the DRG concept, in the context of a juvenile justice system, we define an Offense-Related Group (ORG) of services and care package representing a classification system that groups young offenders according to the consumption of resources and services required for their social reintegration, their personality profile and type of offense. It is a bottom-up approach to effective cost management (Winston and Albright, 2009).
We now illustrate the standard cost method that develops in three steps. We first examine how to define a standard cost structure. We then present the care packages referring to the treatments most frequently adopted in the Italian juvenile justice system followed by the description of the statistical technique that we use to reproduce the real-world uncertainty associated with standard costs.
Definition of the standard cost structure
Definition of the standard cost structure of the institutions involved in the specific juvenile justice system under consideration. For the Italian case, the institutions are the following: CPA, USSM, IPM, and Communities. The costs also vary in relation to the services provided. Our cost database, therefore, also records the costs of judicial services such as judicial court costs for each hearing and for the probation service with or without study/work activities. Standard costs are prior estimates of what is expected to cost or should cost to produce one unit of (service) output under normal conditions. 5 The system of standard costs aims at an average valuation of resource consumption. A standard cost for a justice system is the specific cost of a care package for a specific type of offender.
To estimate the total direct costs of the juvenile justice system, we implement a standard cost approach based on care packages specific to each ORG. This allows for cost and efficiency comparisons across justice facilities and social services’ performance within the system. Furthermore, ORG can be a tool to adjust the method of payment or reimbursement for the private/public facilities.
The services provided by each cost source are aggregated in the following Offense-Related Groups (ORGs) or care packages.
Definition of the care packages
The definition of the care packages that include the costs of the package of treatments and services received to ‘cure’ young offenders of their ‘diagnosed’ problem borrowing the terminology used in the health sector to define a DRG.
We distinguish the following eight ORGs:
Young offenders are arrested and taken to a CPA where they stay for an average period of 3 days. The judge orders a precautionary measure of pretrial detention for 30 days. After 4 dispute hearings, juveniles spend 180 days in a penal institution for minors.
Young offenders are arrested and taken to a CPA where they stay for an average period of 3 days. The judge does not order a precautionary measure. After 4 dispute hearings, juveniles spend 180 days in a in a juvenile penal institute.
Young offenders are arrested, and the judge orders a precautionary measure with placement in a community for 30 days. After 4 dispute hearings, juveniles spend 180 days in a community.
Young offenders are charged without arrest and are taken into custody by the USSM for other obligations, pursuant to Presidential Decree 448/88. This period involves 4 hearings (initial, verification, final).
Young offenders are taken into custody by USSM for obligations pursuant to Presidential Decree 448/88. During this period the court orders 30 days of detention in an IPM. This period involves 4 hearings (initial, verification, final).
Young offenders are charged without arrest and are free until pretrial. The trial is suspended after the first hearing and the judge orders a probation period in a community for 2 years. In the verification hearing, the crime is deleted from the records if the probation period is positive.
Young offenders are charged without arrest and are free until pretrial. The trial is suspended after the first hearing and the judge orders a probation period. The probation program includes study or work activities and a mediation procedure. In the verification hearing, the crime is deleted from the records if the probation period is positive.
Young offenders are arrested, and the judge orders a precautionary measure of placement in a community for 30 days. The trial is suspended after the first hearing and the judge orders a probation period. The probation program includes study or work activities and a mediation procedure. In the verification hearing, the crime is deleted from the records if the probation period is positive.
Table 1 summarizes how CPAs, USSMs, IPMs, Communities along with judicial court and probation services contribute to each care package.
Services and institutions involved in the composition of care packages.
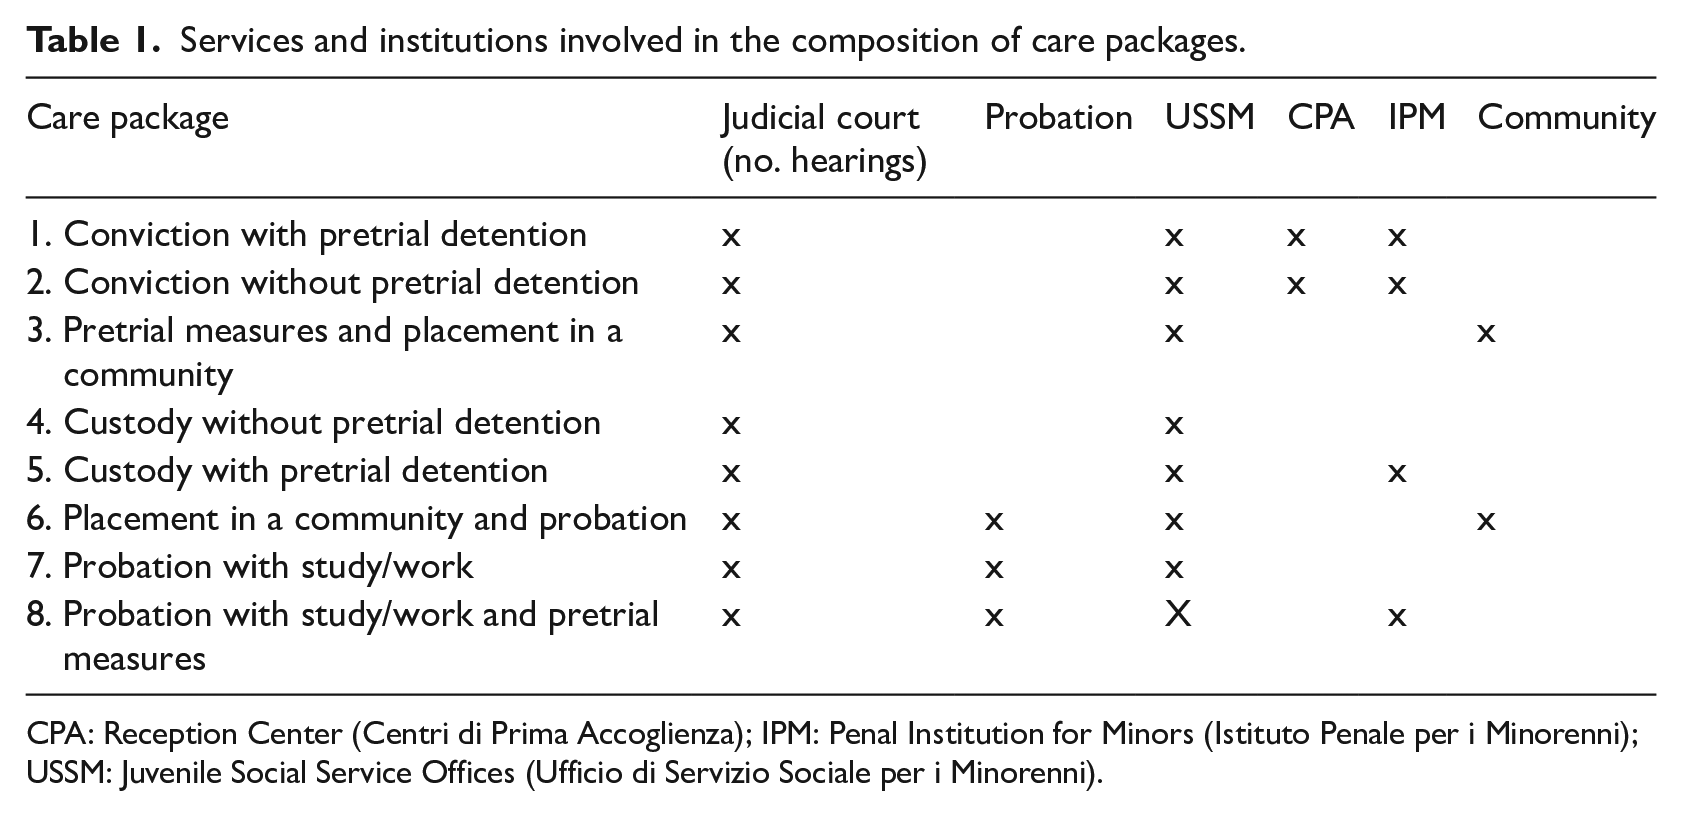
CPA: Reception Center (Centri di Prima Accoglienza); IPM: Penal Institution for Minors (Istituto Penale per i Minorenni); USSM: Juvenile Social Service Offices (Ufficio di Servizio Sociale per i Minorenni).
Simulation analysis
Simulation analysis measures expected standard costs by care package using Monte Carlo simulations of costs, duration of custodial sentences, and distribution of offenders across care packages. 6 We simulate the distribution of expected costs and periods using a PERT distribution, as shown in Figure 2. The PERT distribution is a smoothed version of the Triangular distribution and is located to the right of normal distribution. Like the Triangular distribution, it is commonly used to represent expert estimates of the minimum, maximum, and most likely (mode) values of a random variable in a smooth parametric distribution, where the mean and standard deviation are unknown. This distribution is bounded on both sides (from the minimum and the maximum value), avoiding unwanted extreme values, and the degree of confidence linearly decreases from the center of the distribution (the mode).
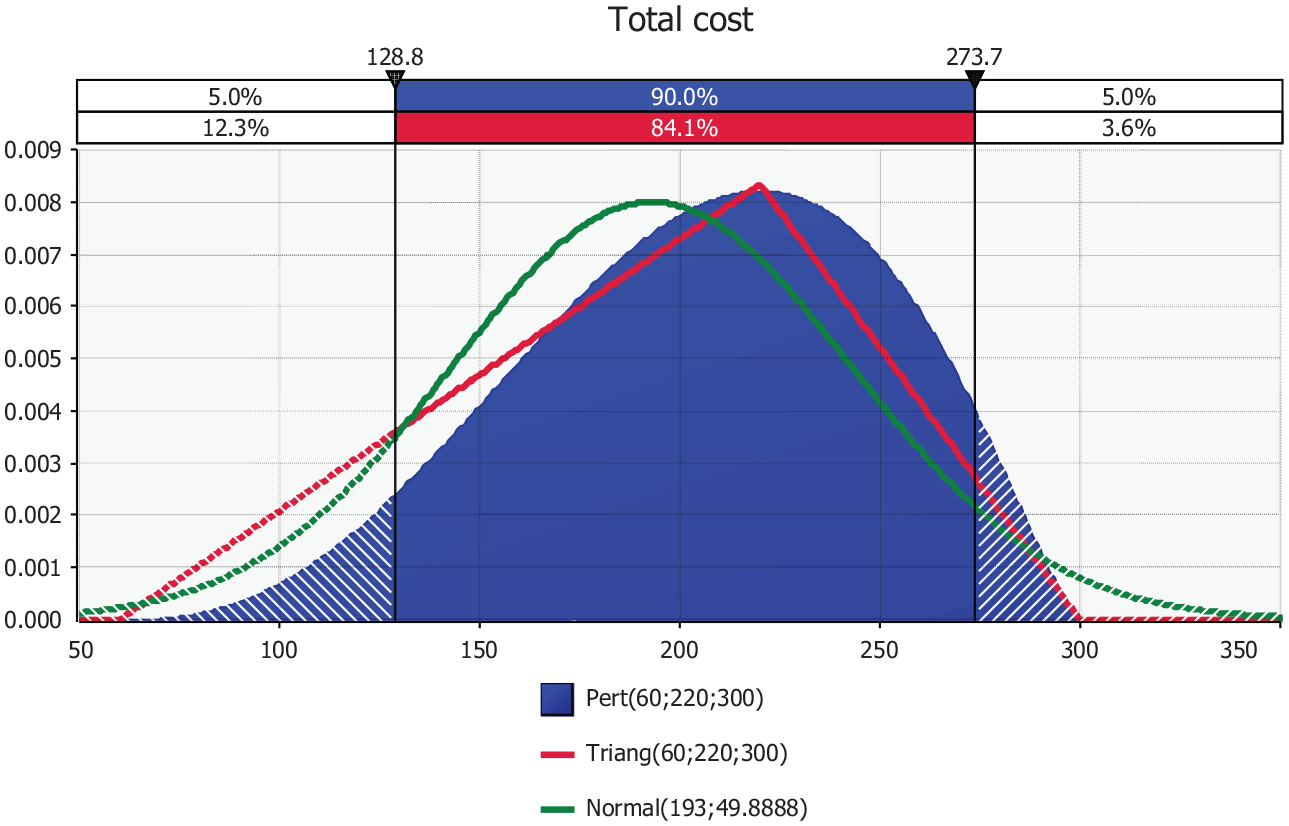
PERT distribution compared with triangular and normal distribution.
The PERT distribution is a translated and scaled form of the Beta distribution and is preferable to the Triangular distribution when the distribution is highly skewed (i.e. the most likely parameter is close to minimum or maximum) because it puts less emphasis on extreme values. The mean of the former distribution is 4 times more sensitive to the most likely value than to the minimum and maximum value, whereas the expected value of the latter distribution is equally sensitive to each parameter.
Both distributions stress the most likely value over the minimum and maximum estimates, but the PERT distribution defines a smooth curve. Depending on the three values provided, the PERT distribution can represent a close fit to normal or lognormal distributions.
Given the lack of actual cost data 7 for each cost source over time, we assume in general a standard predetermined cost structure under normal conditions. We partly account for possible non-linearities and economies of scale by assuming a less than proportional range of cost variation. 8 We also account for these features by choosing as the most likely value of the cost distribution of interest the minimum value plus 2/3 of the difference between the maximum and the minimum value.
The next section shows how we constructed the standard cost structure for custodial facilities (CPAs, USSMs, IPMs, and Communities), judicial courts, and probation services. This data collection scheme can be adapted to the specific organizational architecture of the judicial system under study.
Data: Standard Costs of Custodial Facilities and Services
This section describes the assumptions underlying the definition of standard costs per type of custodial facility and service used as the starting point for the simulation analysis. We assume that fixed and variable costs per young offender are likely to occur within a lower and upper range on the basis of information received from the budget service of the Juvenile Justice Department of the Italian Ministry. We also evaluate the duration of the period of benefit by young offenders under rehabilitation. These estimates capture the uncertainty due to the lack of an analytical measurement of the data.
Custodial facilities
CPA
The expenditure per young offender kept in a Reception Center varies between €630 when the custody period lasts 2 days to €2600 when custody lasts the maximum stay allowed of 4 days. Daily variable costs vary between €15 and €30 per person. The fixed costs of a CPA are larger than those of an IPM because of the presence of diseconomies of scale. Average total costs per person per day in a CPA range from €315 to €650 (Figure 3(a)).
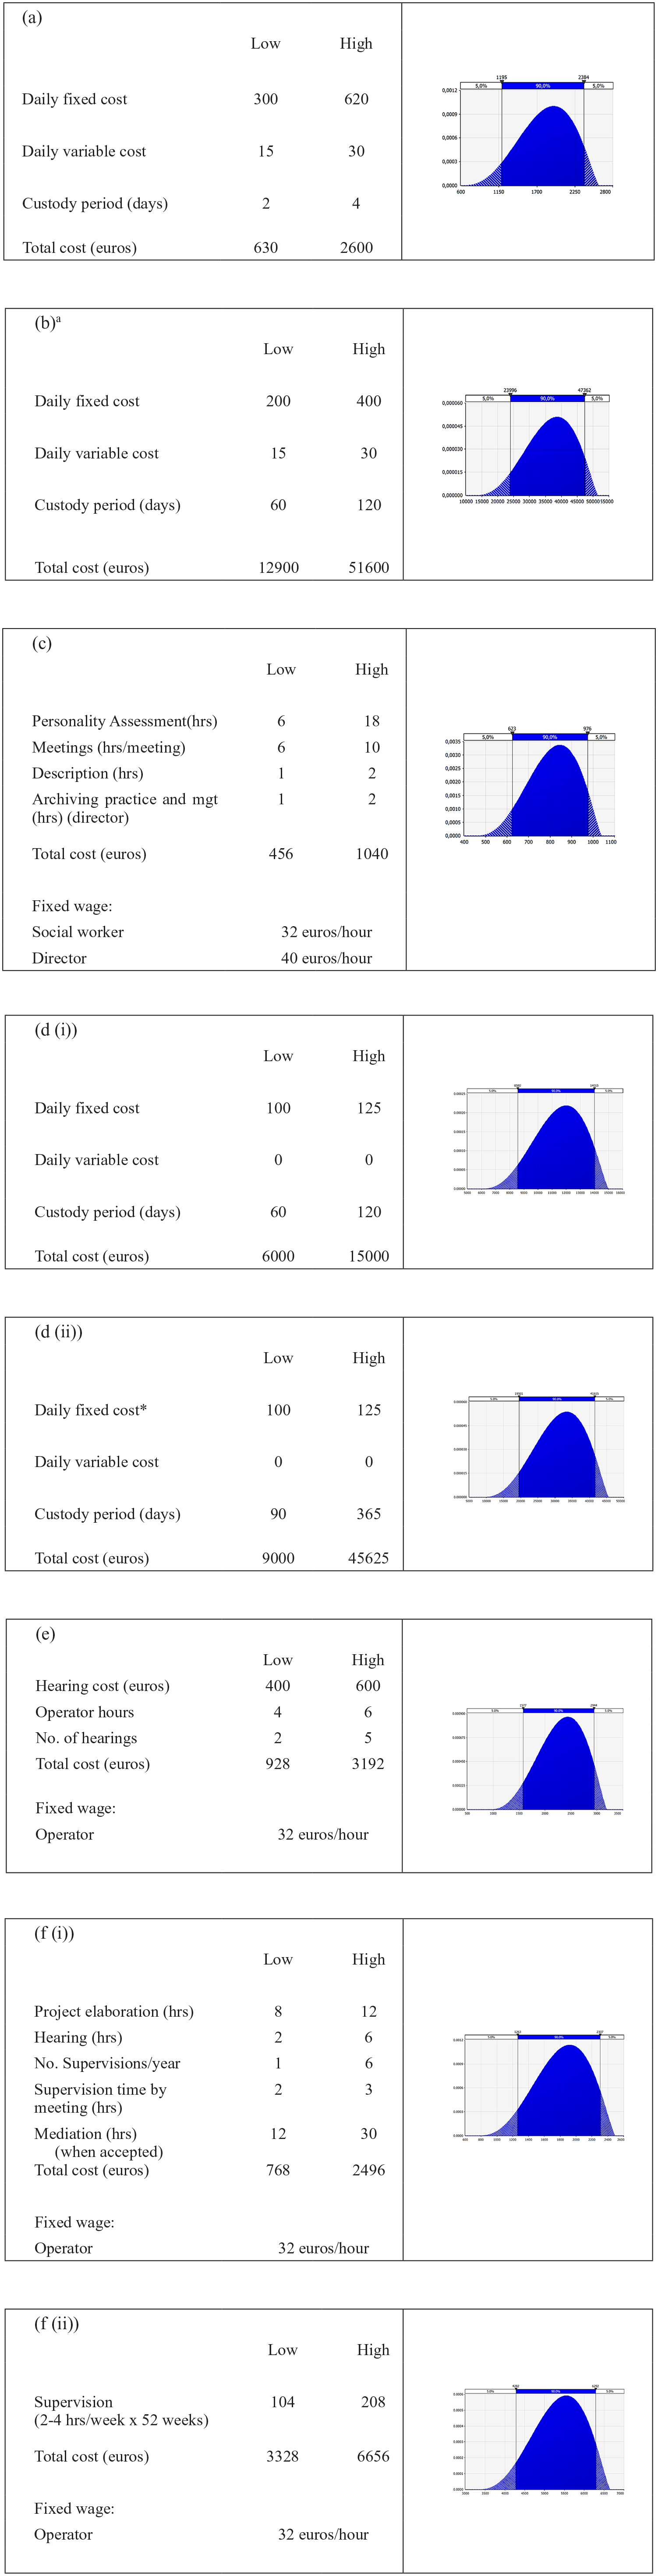
Standard costs per young offender. (a) Reception Center (CPA). (b) Pretrial Detention/Convictiona (IPM). (c) Juvenile Social Service Offices (USSM). (d) (i) Community costs/pretrial. (ii) Community costs/probation. (e) Hearings (Initial, pretrial, verification). (f) (i) Probation (art. 28 DPR n.448/88). (ii) Probation study/work.
IPM
The daily fixed costs of the penal establishments for minors is about two-third of the fixed costs of a CPA. The custody period varies between 60 and 120 days in the case of pretrial detention or 90–180 days in the event of conviction. Total daily costs per young offender considered socially dangerous in an IPM range from €215 to €430. It is instructive to compare the costs of juvenile and adult justice. On average, the detention of an adult costs about 50 per cent less daily than the detention of a young offender. 9 The design capacity of the Italian prison system is about 45,000. In 2002, when excess capacity was about 10,000 inmates, the cost was about €127, while in 2011, with over-congestion of more than 22,000, the cost is estimated at around €113 per inmate. At full capacity, after the 2006 pardon 10 that released about 30 per cent of inmates, the cost of conviction of an adult was about €198 (Figure 3(b)).
USSM
Social service officers compile a personality profile requiring between 6 and 18 hours of work after meetings with the young offender of 6–10 hours. The process of submitting the profile to the judge for the pretrial hearings is assumed to take between 1 and 2 hours. The USSM Director is supposed to devote between 1 and 2 hours to the management and supervision of the process. Assuming that the gross hourly cost of a social worker is €32 per hour and the Director’s gross hourly salary is €40, the cost range for the service provided per person by the USSM varies between €456 and €1040. The cost of the service provided by the USSM is present in all care packages based on ORGs (Figure 3(c)).
Placement in community and probation
Community fixed costs vary between €100 and €125 per person. In the case of placement in a community (pretrial measure), the average duration is between 60 and 120 days, while for probation the custody period may vary from a minimum of 90–540 days. The total cost is calculated over a 365-day period because our aim is to estimate annual costs. A day spent by a young offender in a community is about 1/2 of the minimum cost and 1/3 of the maximum cost of the same amount of time in an IPM (Figure 3(d), i and ii).
Services
Public hearings
There is a minimum of two to a maximum of five public hearings per person (initial, pretrial, and verification) because all care packages involve the juvenile court. In each hearing operators are involved for between 4 and 6 hours at the cost of €32 per hour. Hearing costs vary between €400 and €600 (Figure 3(e)).
Probation
Probation can also be implemented outside communities (Figure 3(f), i), with the involvement of USSM for a period of study and/or work (Figure 3(f), ii). 11 The social worker, paid a gross salary of €32 per hour, is asked to draft a probation program that may take between 8 and 12 hours of work and to supervise the effectiveness of the plan through a number of meetings varying from a minimum of 1 to a maximum of 6, possibly last in between 2 and 3 hours. Public hearings may take between 2 and 6 hours per meeting. The mediation procedure may take between 12 and 30 hours depending on the complexity of the case. The Department of Juvenile Justice calculates that about 50 per cent of minors on probation go through a mediation process because the procedure requires the consent of both the offender and the victim. Probation periods may be spent either in communities or with the offenders’ families. The cost for each probation procedure ranges between about €770 and €2500 (Figure 3(f), i). Supervision for studies or work activities (Figure 3(f), ii) is exerted through weekly meetings of 2–4 hours. The yearly cost is estimated to vary in the range of €3300–€6700.
Results
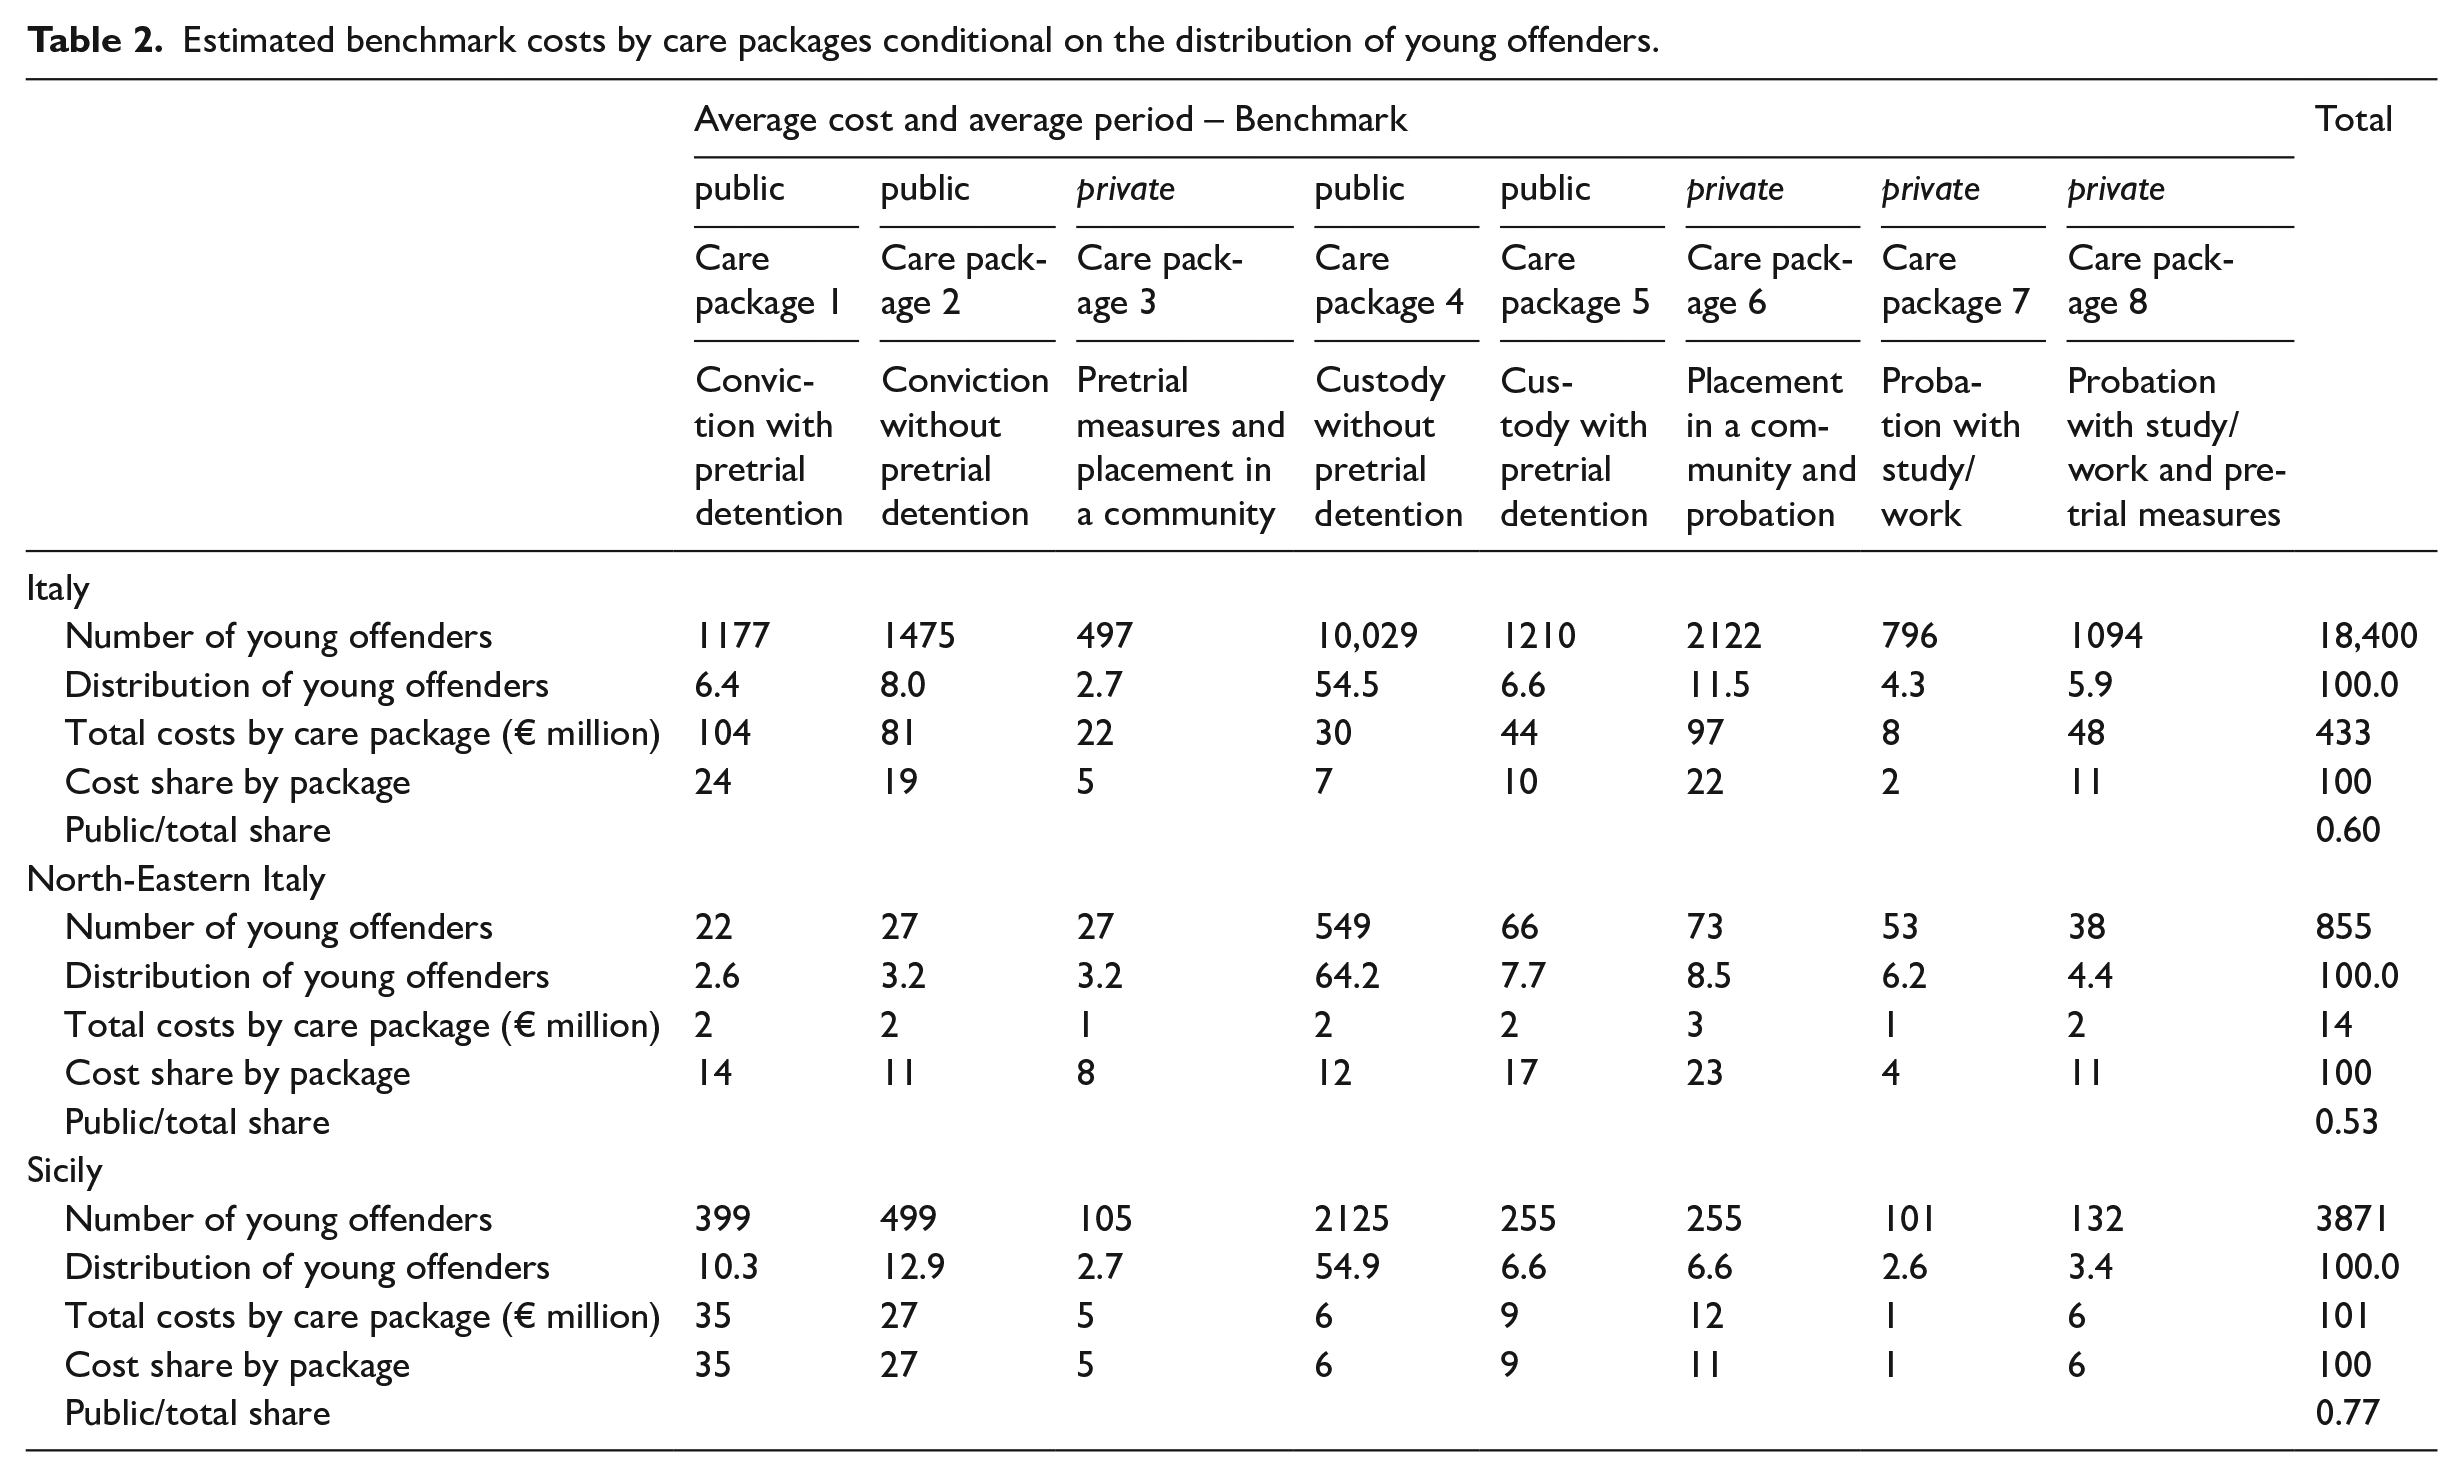
Total costs of each care package are estimated by adding the costs of custodial facilities and services involved in each care package as outlined in Table 1. The costs are those described in the previous section and reported in Figure 3. These are costs per care package administered to a young offender. Therefore, total costs at the level of the juvenile justice system have to be multiplied by the number of young offenders treated with a specific care package as it is shown in Table 2 for our benchmark case. The level of costs for each care package per offender can then be recovered by dividing total costs by the number of young offenders (Table 2 row 2 and Figure 4). Because our main focus is on the comparison of traditional conviction methods with probation, we present results also aggregating care packages 1 and 2 as ‘conviction’ and care packages 6, 7, and 8 as ‘probation’.
Estimated benchmark costs by care packages conditional on the distribution of young offenders.
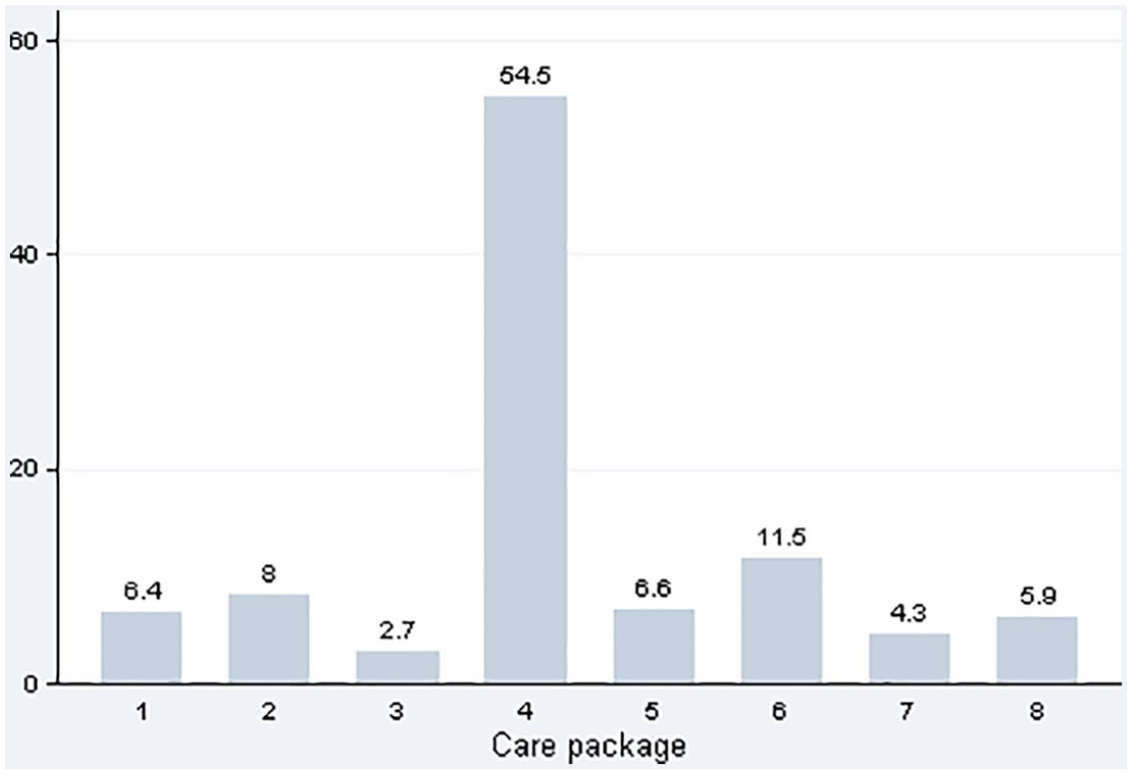
Distribution of young offenders by care package in Italy.
We first report in the next subsection the cost structure of the benchmark case that is used to implement different scenarios as presented in the subsequent subsection. The final subsection compares these costs to benefits stemming from rehabilitation programs estimated in a companion paper (Menon et al., 2017).
Estimated benchmark costs
Estimated benchmark costs per each care package are derived using the average custody period and the average of each cost included in the care packages. When multiplied by the number of young offenders, we obtain the total costs of each care package shown in Table 2.
The total number of young offenders taken into account for our simulation is 18,400 corresponding to the average for the years 2007–2012 (Italian Department of Juvenile Justice). A total of 54.5 per cent of them received a judicial pardon without pretrial detention (care package 4), while about 6.6 per cent were taken into custody with pretrial detention (care package 5). Convicted young offenders were 14.4 per cent of the total (care packages 1 and 2) and about half were judged without pretrial detention. Communities offered rehabilitation services to 14.2 per cent of juveniles in conflict with the law (care packages 3 and 6), while 11.5 per cent followed a probation track. The remaining 10.2 per cent were diverted to probation programs that included study and/or work activities and experienced an alternative mediation procedure (care packages 7 and 8). It should be emphasized that official statistics (Italian Department of Juvenile Justice, 2016) show that the number of young people in custody for the first time in 2007 was 53 per cent of the total, while in year 2012, it was down to 38 per cent. In our simulation exercise, we assume a period average of around 50 per cent, so entrants of the current and previous year to the year under consideration balance in average. It is therefore reasonable to analyze the flow of young offenders as a stock. A young offender entering the juvenile justice system may move across penal paths during the period of proceedings. We observe young ‘patients’ at the end of the proceedings, so that they can reasonably be assigned to a specific care package.
Estimated direct costs of the Italian system total €433 million (Table 2). Almost one-quarter of the costs (23.3%) relate to Sicily, while North-Eastern Italy uses only 3.2 per cent of total resources.
As shown in Table 2, the cost of conviction for 14.4 per cent of total young offenders (care packages 1 and 2) amounts to 43 per cent of total costs (€185 million). Probation (care packages 6, 7, and 8) uses up to 35 per cent of total costs (€153 million) for 21.7 per cent of young offenders. The cost of conviction per offender per year is about €69,758 versus probation costing €38,135. 12 This corresponds to 55 per cent of conviction costs suggesting a potential saving of 45 per cent of resources per each young offender diverted from conviction to the more costly and socially effective probation.
There are interesting regional differences. In North-Eastern Italy, 5.8 per cent of total young offenders is convicted and costs 25 per cent, while in Sicily is 23.2 per cent explaining the cost surge to 62 per cent. In the North-East of Italy, young offenders in probation are 19.1 per cent of the total against 12.6 per cent in Sicily. The corresponding use of resources for probation amounts to 43 per cent in North-Eastern Italy and 19 per cent in Sicily.
Because conviction is a wholly public cost while probation is mainly channeled through the non-profit private sector, the relative weight of conviction affects the public/private mix of the service provided by the juvenile justice system. The Italian system is managed by the State for 60 per cent of total expenses (care packages 1, 2, 4, and 5) and 40 per cent by private social operators paid by the State and/or local municipalities (care packages 3, 6, 7, and 8). The public cost in North-Eastern Italy is 54 per cent while in Sicily it is 77 per cent. Figure 5 displays cost shares for each care package and territorial dissagregation.
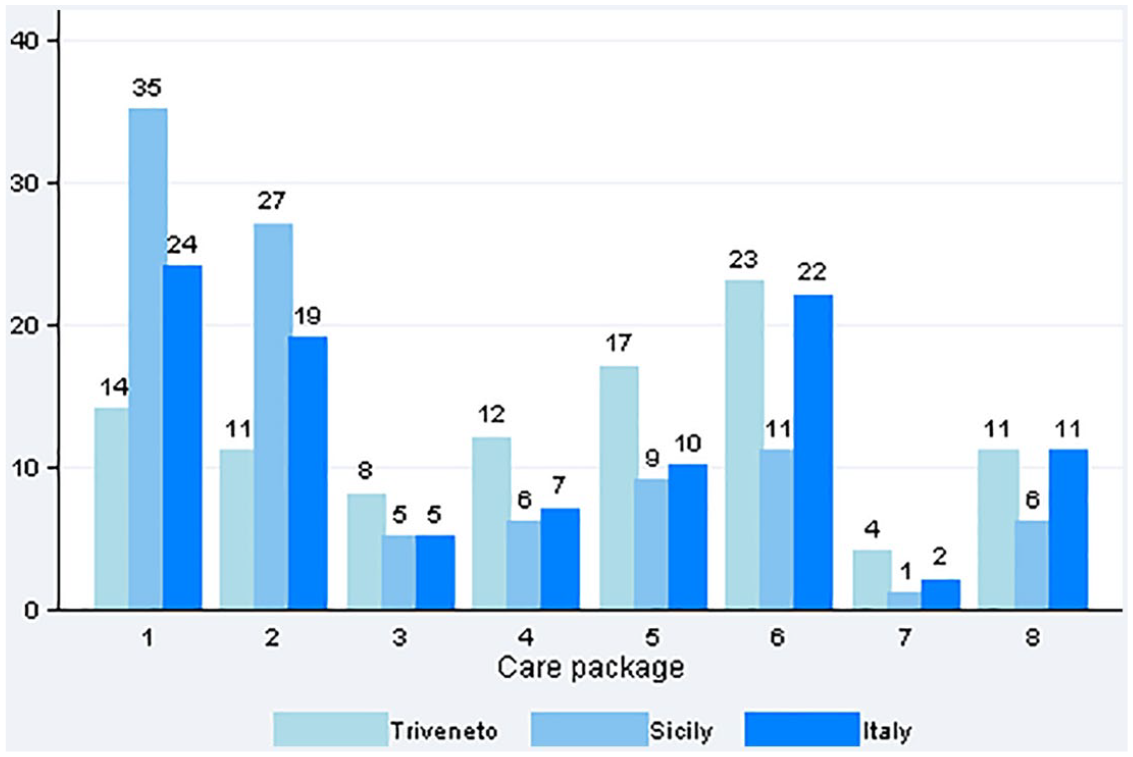
Cost share by care package.
Costs depend upon structural characteristics such as the quality of facilities and the number of staffs per offender, the duration of the punishment and the number of young offenders included in an ORG. Having estimated cost ranges between minimum and maximum values, we account for the possibility that unit costs and duration may vary between facilities and over time without change to the distribution of young offenders. The analysis also provides an indication of possible savings within the system if all custodial facilities are operating at minimum costs.
Scenario analysis
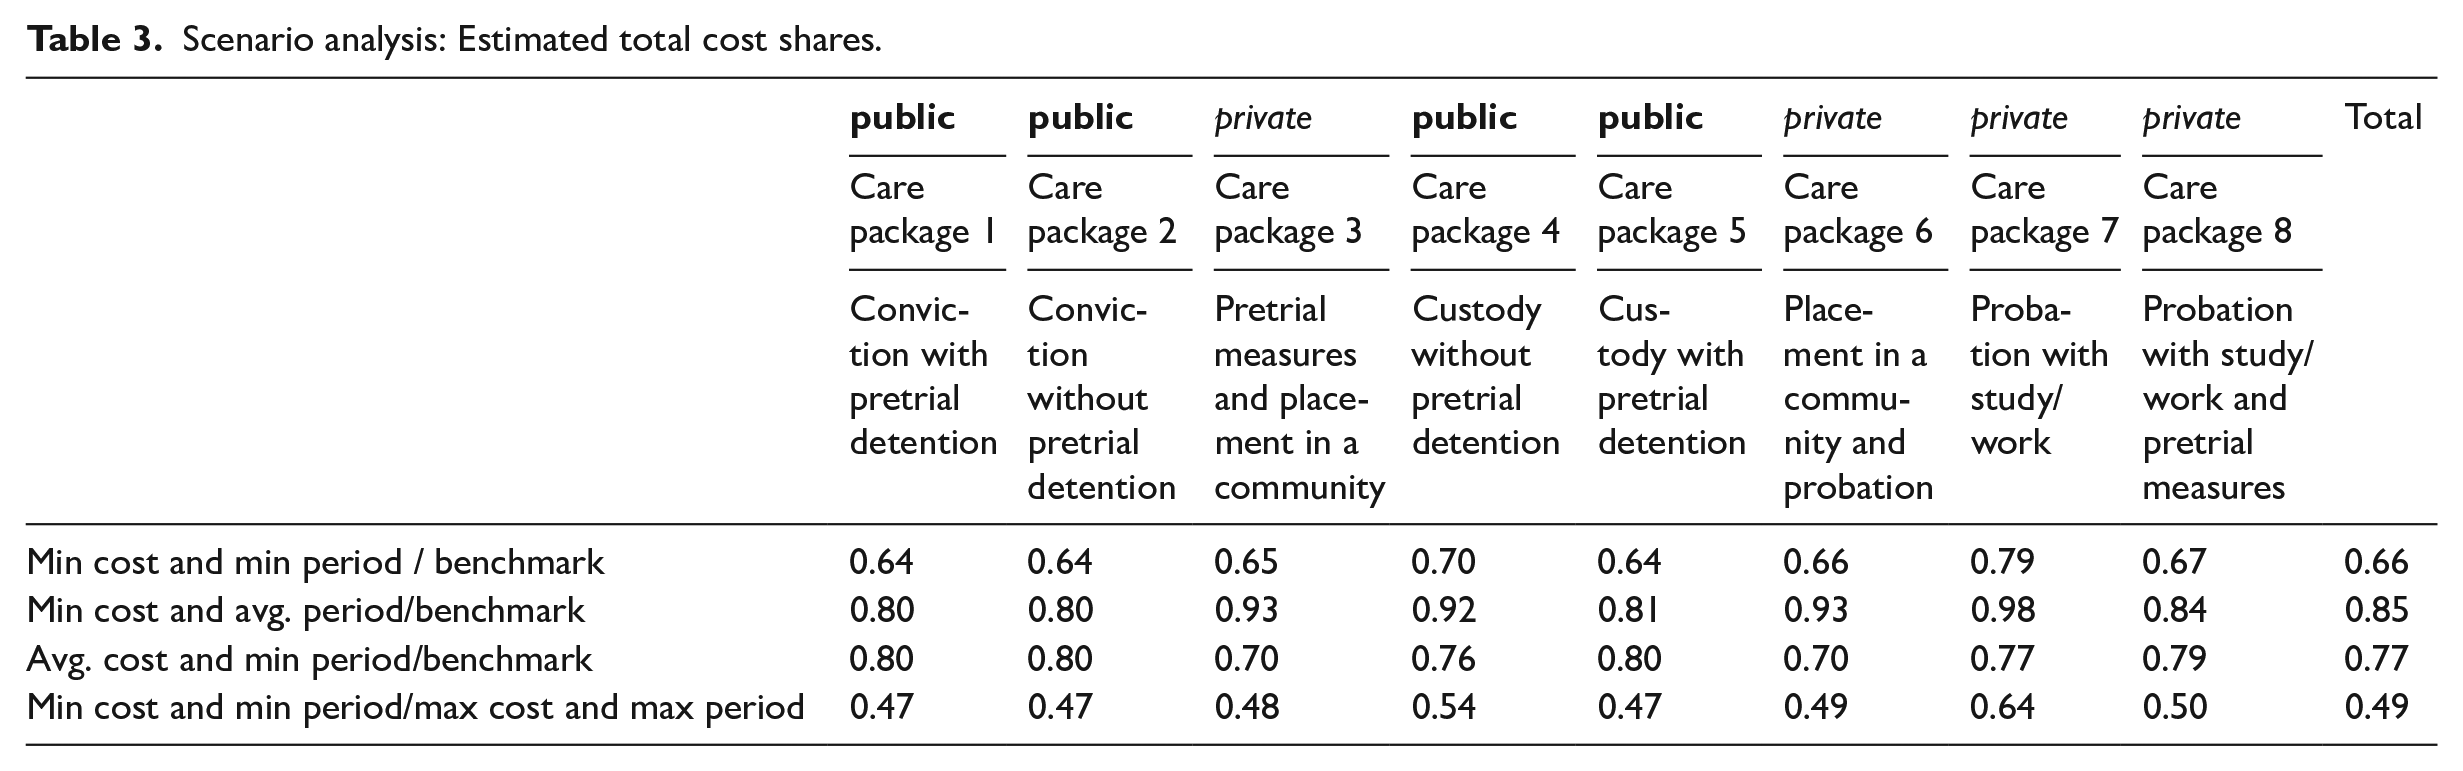
The scenario analysis compares, in sequence, the cost of each care package computed at minimum costs and period, at minimum cost and average period, at average cost and minimum period, and the ratio of minimum to maximum costs and period per package (Table 3 and Figures 6 and 7).
Scenario analysis: Estimated total cost shares.
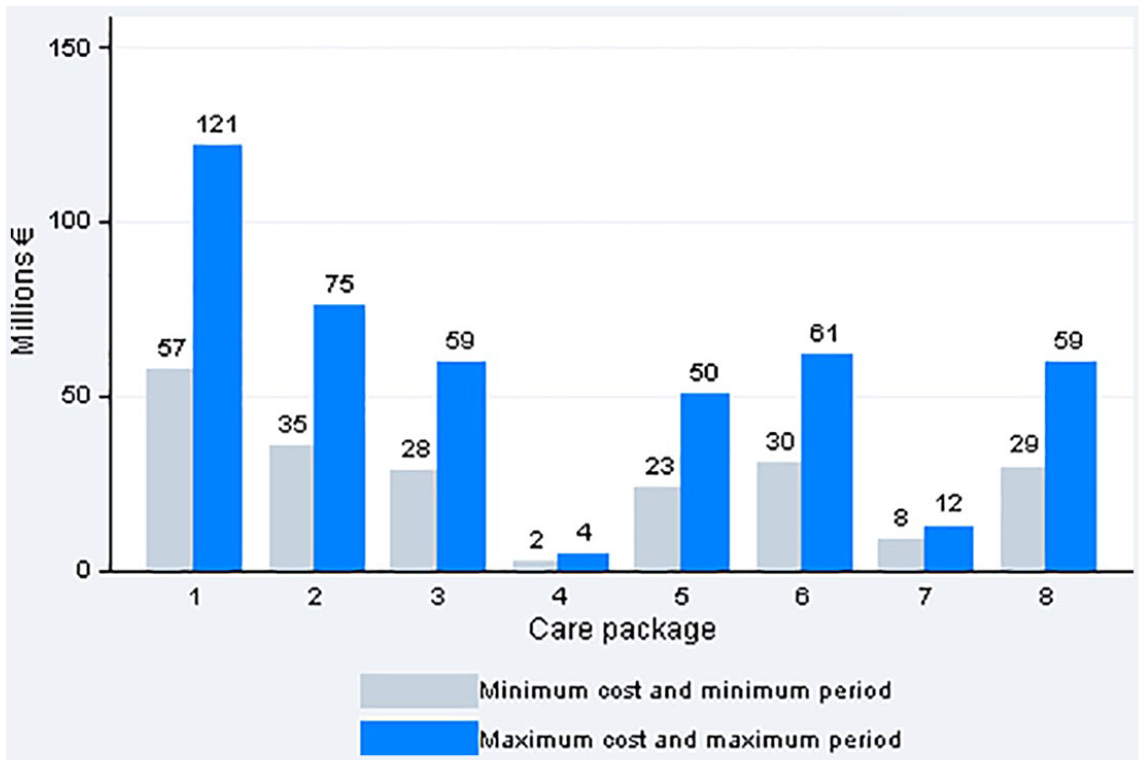
Total cost by subject by care package in Italy.

Total cost by care package in Italy.
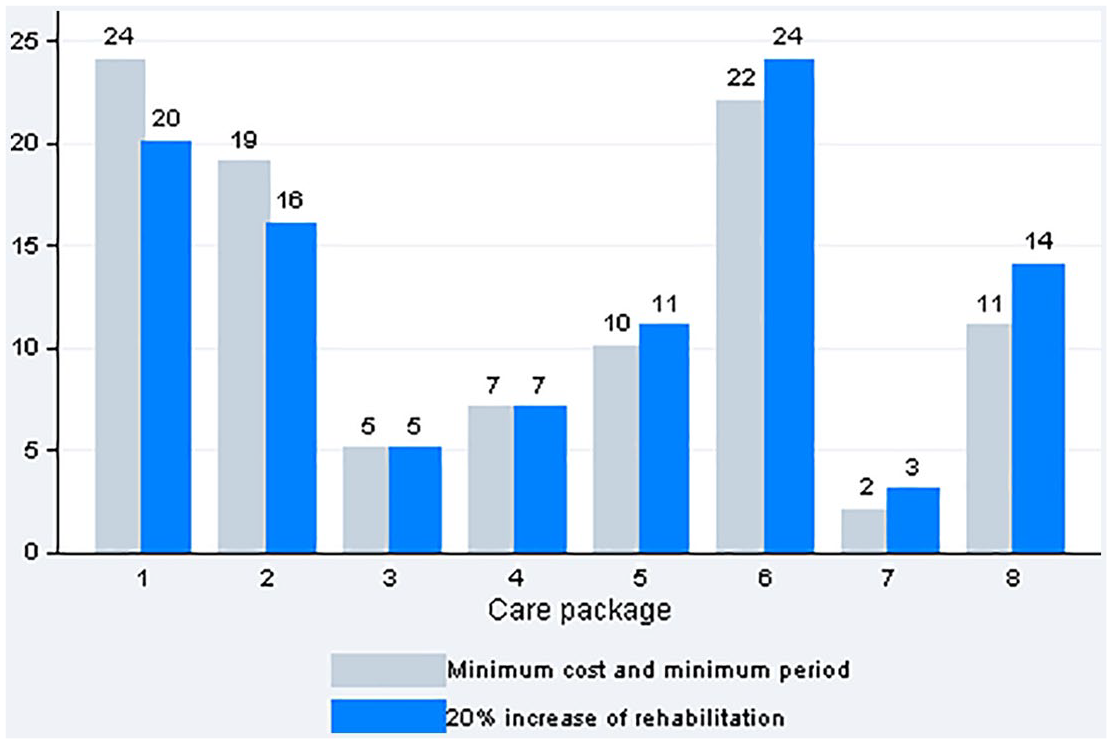
Simulation (+20% rehabilitation).
Inspection of the last column of Table 3 reveals that if the juvenile justice system minimized both costs and duration, this would reduce costs with respect to benchmark levels by 34 per cent. However, minimizing duration only would reduce costs by 23 per cent. The sole reduction of costs would allow savings of 15 per cent. The gap between minimum and maximum costs and periods is 51 per cent. If the juvenile justice system was able to minimize both costs and duration, for example by reducing court delays, this could save more than 50 per cent of public resources almost in all care packages with the exception of package 4 related to custody without pretrial detention and probation with study or work where possible savings amount to about 35 per cent.
Because the costs of a day spent in detention are two to three times higher than the cost of a day spent in a community, it is evident that direct costs may be substantially reduced if a reasonable proportion of children held in detention who are not socially dangerous are diverted to communities. The social desirability of this policy would likely be much higher if we also included the possible benefits derived from the fact that detention is potentially harmful to children in conflict with the law and is less effective in preventing reoffending.
We now account for the possibility that the distribution of young offenders varies across care packages, while costs and durations are fixed. We simulate the impact on the costs of the juvenile justice system of the often-recommended policy by the Juvenile Justice Department that at least 20 per cent of convicted young offenders be transferred to a more child-friendly restorative solution. In particular, we assume that 20 per cent of young offenders allocated to care package 1 looking at conviction with pretrial detention move to care package 8, that is, probation under study or work supervision with a pretrial measure (Table 4). We assume a similar transfer from care package 2 (conviction without pretrial detention) to care package 7 (probation under study or work supervision).
Scenario analysis: Simulation of a 20 per cent increase of young offenders for rehabilitation – Italy.
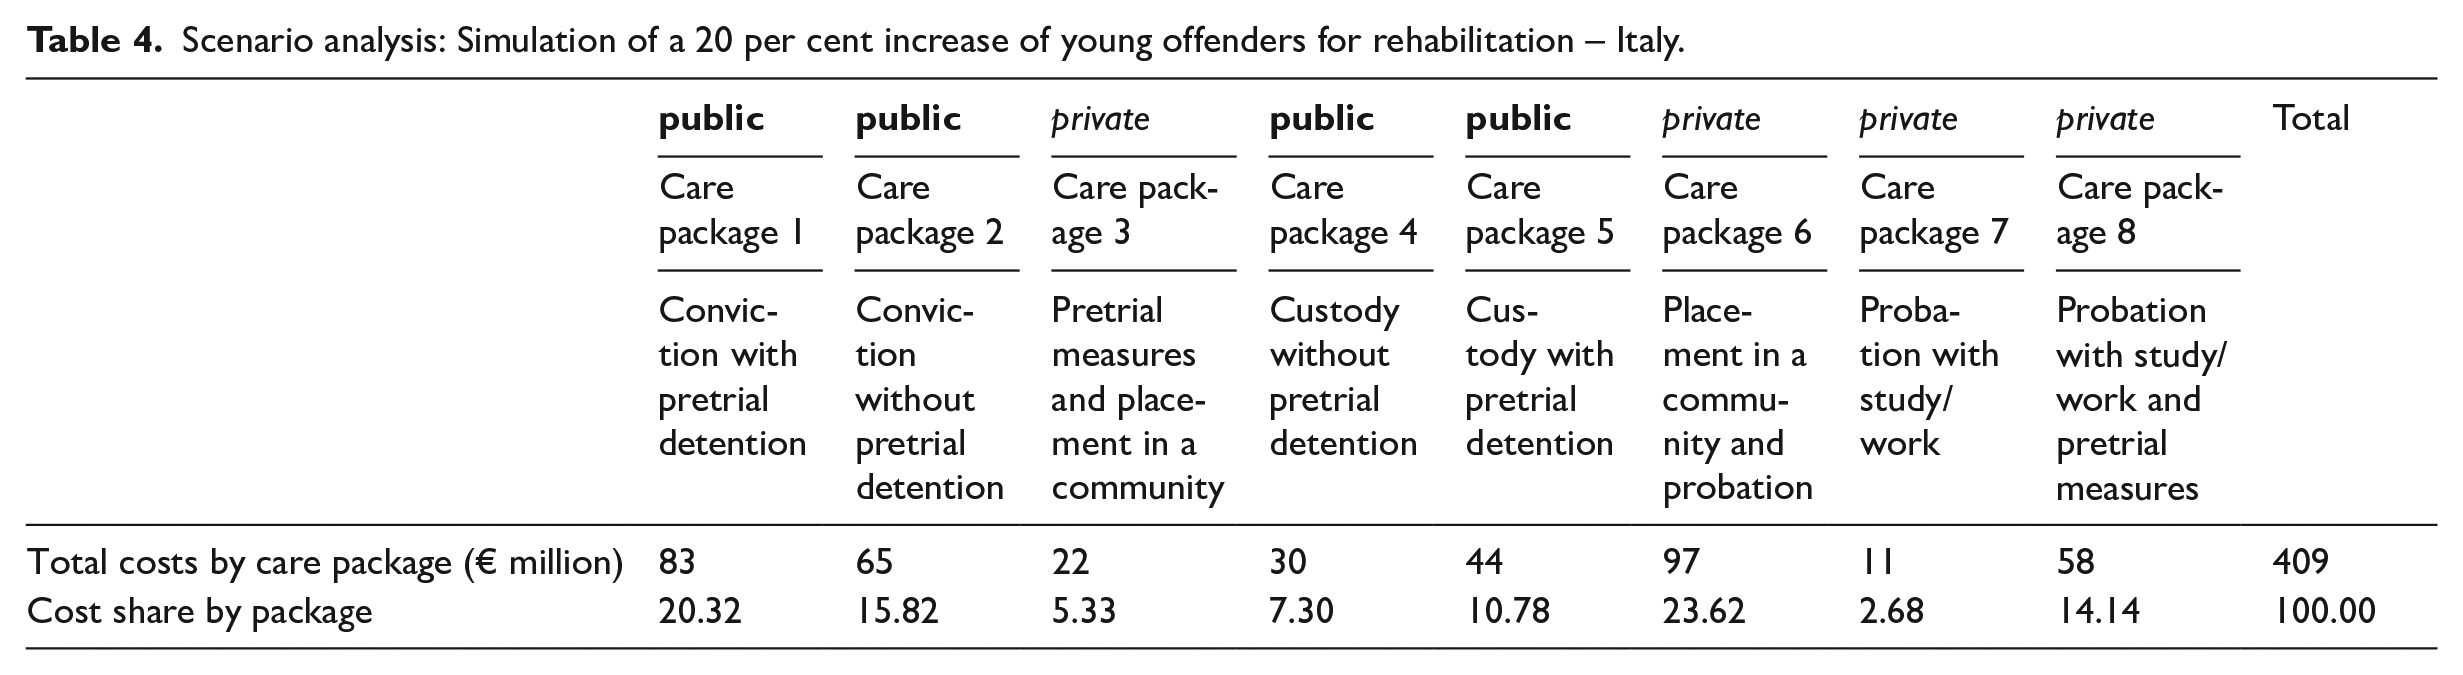
The total costs of the juvenile justice system fall from €433 million to €409 million providing 5 per cent of public savings per year. The cost share of conviction (care packages 1 and 2) falls from 43 per cent to 36 per cent, while the cost shares of care packages 7 and 8 associated with probation within families increase from 13 per cent to 17 per cent. Figure 8 compares the cost shares of the benchmark estimation and simulation exercise for each care package. Considering that the cost for implementing our conjectured 20 per cent diversion scheme is negligible (Dünkel et al., 2011; Padovani et al., 2011), the benefit/cost ratio of the program presented in the next section would be much higher. The social profit would be even higher if compared to a situation where nothing had been done.
Cost-benefit analysis
Cost analysis provides a complete accounting of the expenses related to a given system or program. The estimated costs can also be compared to benefits to derive the rate of return to society of an investment such as the funding of a rehabilitation program (Becker, 1968; Bowles and Cohen, 2008; Cohen, 1998).
In a companion project as part of the same research program of this study, Menon et al. (2017) estimate the benefits derived from a questionnaire that was submitted to a representative sample of families of the regions of the North-East of Italy and Sicily. The interviewed were asked to state whether they were willing to vote for a hypothetical referendum to finance rehabilitation programs complementing the existing ones for juvenile offenders by increasing local income taxes. Respondents declaring that they would vote in favor of the program are then asked a close-ended contingent valuation question about their willingness to pay a bid amount as annual local income tax for the rehabilitation program. The sum of the individual willingness to pay for a rehabilitation service reveal the value to society of the ‘rehabilitative public good’ and is an indirect measure of the benefits to society stemming from the rehabilitative service (Bala et al., 1999).
Menon et al. (2017) also show that families in North-Eastern Italy and Sicily have a high propensity to invest in the future of their troubled children even in times of economic recession. The authors further estimated the internal rate of social returns stemming from the investment in rehabilitation programs for juvenile offenders by relating estimated benefits with the costs estimated in this study for North-Eastern Italy and Sicily. Public awareness of the size of these social returns should help policymakers to take informed decisions about juvenile justice policies. Based on household willingness to pay and the total number of households in North-Eastern Italy and Sicily in 2009, the annual benefits that society derives from juvenile rehabilitation programs are about €116 million in North-Eastern Italy and €148 million in Sicily.
Comparing these estimated benefits with the total costs of the juvenile justice system of €14 million in North-Eastern Italy and €101 million in Sicily, where the size of the young offender population is about 4 times the number in North-Eastern Italy, we obtain a benefit/cost ratio of 8.3 in North-Eastern Italy and 1.5 in Sicily. These figures show that investments in rehabilitation programs are highly attractive even during a period of economic crisis and in very different regions. The investments need not be necessarily funded by transfers from the central government that are unlikely in times of recession. The willingness to pay may be captured, at least in part, through solidarity by fostering innovative social institutions, such as community foundations, that are designed to pool donations into coordinated and effective social inclusion and prevention programs.
Conclusion
This study proposes a general method to measure standard costs of juvenile justice systems analogous to the system implemented in the health sector by DRGs in order to understand where justice systems can be made more cost-efficient. The method can be easily adapted to the organizational structure of any juvenile justice system. The application of the method is illustrated using the cost structure of the Italian youth justice system as an example.
In times of economic recessions and social crisis, the implementation of formal management and cost monitoring systems gathering and using information to evaluate the performance of organizational resources (human, physical, and financial) and the system as a whole is a crucial concern. Analytical and digitalized accounting can be introduced in traditional management and administration practices at low institutional costs and public resources can be allocated more efficiently, in terms of costs, and effectively, in terms of rehabilitation and recidivism. A more efficient juvenile justice system is also less exposed to the budget cuts dictated by austerity measures that may have undesirable repercussions on the quality of future generations of citizens.
The research estimates that the total direct costs of the system are €433 million. Almost one-quarter of the costs are related to Sicily. The cost of conviction per offender per year is about €69,758 versus probation costs of about €38,135, suggesting a potential saving of 45 per cent of public resources per young offender diverted from conviction to less costly and socially effective probation. The North-South comparison reveals that in North-Eastern Italy only 5.8 per cent of total young offenders are convicted, while in Sicily the number of convicted children is 23.2 per cent. Conviction in the North-East uses 25 per cent of resources, while Sicily consumes for conviction 62 per cent of resources. North-Eastern Italy adopts probation as an alternative measure in 19.1 per cent of cases, while Sicily in only 12.6 per cent.
The Italian system is managed by the State for 60 per cent of total expenses and 40 per cent by private social operators paid by the State and/or local municipalities. The public/private mix in North-Eastern Italy is 54 per cent while in Sicily is 77 per cent. This higher rate of dependency of Sicily on state resources should be corrected by providing incentives to private social operators.
If the juvenile justice system was able to minimize both costs and duration, for example reducing court delays, this could save more than 50 per cent of public resources almost in all care packages. The simulation that at least 20 per cent of convicted young offenders are transferred to a more child-friendly restorative solution would allow for 5 per cent of public savings per year. Considering that the cost for implementing our conjectured 20 per cent diversion scheme is negligible, the benefit/cost ratio of the program can be reasonably expected to be very high.
Diversion and placement in the community are not only effective in reducing recidivism, but also cost-efficient. Therefore, a spending review of the youth criminal justice system may reasonably recommend targeting resources away from detention and toward prevention and diversion policies following a three-pronged strategy: (1) minimize structural costs, (2) reduce duration of punishments by improving the quality of the rehabilitating service in penal establishments and eliminate wasteful court delays; (3) decrease the number of children in detention by at least half over the next 3 years making greater use of community sanctions, especially in those regions, like Sicily, where children are more at risk.
Improving the efficiency of youth justice systems saves taxpayer money, protects society, and is an effective investment in the quality of young people. To provide youngsters who have tangled with the law with the same opportunities to realize their full potential as peers have, prevention should be a policy priority because, as this study showed, the cost of ‘re-including the excluded’ is extremely expensive for society and damaging for the child. The public savings derived from a more efficient youth justice system may be earmarked and reinvested in prevention programs targeted on our vulnerable young people in the geographical areas of the country where the young are most at risk.
It is worth remarking that the resources to sustain and improve a juvenile justice system may not come only from efficiency savings generated by a better public management of the system as this study shows. Additional resources may also come from society through the voluntary contributions of families as the cost-benefit exercise shows.
Footnotes
Acknowledgements
The authors wish to thank the University of Verona and the Istituto Don Calabria – Casa San Benedetto, the funding institutions. They would also like to acknowledge the collaboration of the Italian Ministry of Justice – Juvenile Justice Department and the helpful discussions with Concetto Zanghi, Maria Stefania Totaro, Isabella Mastropasqua, and Ronald Roesch, as well as Cedric Foussard and participants in the IJJO Conference 2012 held in London.
Funding
The author(s) disclosed receipt of the following financial support for the research, authorship, and/or publication of this article: This article is part of the research ‘Causal analysis of juvenile crime and evaluation of the effects of restorative justice programs on the well-being of individuals and society’ supported by the grant ‘Joint Research Projects 2005’ from the University of Verona co-funded by the Istituto Don Calabria – Casa San Benedetto and developed jointly with the Italian Ministry of Justice, Department of Juvenile Crime.
