
Abstract
The study of complex activities such as scientific production and software development often requires modeling connections among heterogeneous entities including people, institutions, and artifacts. Despite advances in algorithms and visualization techniques for understanding such social networks, the process of constructing network models and performing exploratory analysis remains difficult and time-consuming. In this article, we present Orion, a system for interactive modeling, transformation, and visualization of network data. Orion’s interface enables the rapid manipulation of large graphs—including the specification of complex linking relationships—using simple drag-and-drop operations with desired node types. Orion maps these user interactions to statements in a declarative workflow language that incorporates both relational operators (e.g. selection, aggregation, and joins) and network analytics (e.g. centrality measures). We demonstrate how these features enable analysts to flexibly construct and compare networks in domains such as online health communities, electronic medical records, academic collaboration, and distributed software development.
Keywords
Introduction
As social network analysis has gained popularity, researchers have developed novel statistical techniques, visualization designs, and user interfaces (UIs) to make sense of large networks. However, many of these advances take the process of assembling a network model for granted. Much data that are collected for analysis, whether scraped from online data sources or tabulated using traditional surveys, are not inherently in the form of a network but instead a raw list of data points and their corresponding attributes. This requires analysts to extract their own model of a network from the raw data. For many data sets, networks can be modeled in as many different ways as analysts have hypotheses. For instance, after collecting a database of online community data, analysts may wish to examine the relationships between community members to measure collaborative support or the relationships between thread posts to measure the dissemination of information or the relationships between communities as a whole to measure comparative community success. To analyze each of these scenarios, completely different network models need to be extracted from the original data.
Typically, refactoring network data into such various models requires custom code that can take analysts days or even weeks to write. While it is also possible to express most of the necessary operations as database queries, this requires defining a schema, loading the data, and then forming the correct Structured Query Language (SQL) queries—including complex queries such as multitable joins. Repeating this level of effort as new questions emerge may undermine the exploratory process and even dissuade some analysts from testing all hypotheses.
To address these issues, we introduce Orion, a system for interactive modeling, transformation, and visualization of network data. While many visualization and data mining techniques have been proposed for social network analysis, Orion focuses on the often-overlooked early stages of data transformation and assessment when forming network models from source data. Orion enables iterative, exploratory analysis by reducing hours of programming and transformation to a few minutes of interactive, graphical specification. We make the following contributions:
A unified model and workflow language for network data. We use relational data tables as our fundamental model and represent networks as edge tables over a domain of integer node indices. We chose this model to correspond to those used by analytic databases and scalable network analysis packages. Our workflow language provides both relational operators and graph analysis routines and enables the generation of reusable analysis scripts. The language supports a range of analysis tasks including network definition, filtering, aggregation, and statistics computation.
A graphical UI for iterative network manipulation and visualization. Orion translates UI actions, such as drag-and-drop and menu commands, into operations in the underlying workflow language. Orion also supports the specification of complex linking relationships. The system first constructs a graph model of links among table columns; a traversal algorithm then identifies all feasible linking paths defining networks for a set of user-selected node types. This approach simplifies the otherwise difficult process of specifying a series of relational join and aggregation operations. Once a network has been defined, Orion enables visual exploration using tabular, matrix, and node-link views. Networks can also be exported for use in other analysis tools.
The rest of the article is structured as follows: After reviewing prior work, we describe our data model and present the Orion interface. Next, we discuss our enabling algorithms for network extraction and describe our workflow language. As a preliminary evaluation of Orion, we demonstrate its use in case studies of online health communities, electronic medical records (EMR), academic collaboration, and distributed software development. We then discuss future work and conclude.
This article is an extended version of an earlier publication 1 and features more network operators, further details on our workflow language, and an additional case study. This version also includes Appendix 1 with implementation and evaluation details for our foreign key identification algorithm.
Related work
Orion draws on related work in graph visualization, analysis tools, and data management. We discuss selected relevant projects below.
Graph visualization techniques
Researchers have devised a variety of visualization techniques for networks. 2 Two common representations used in social network analysis are node-link diagrams (typically using force-directed placement) and adjacency matrix views. 3 Hybrids of the two have also been proposed.4,5 These approaches organize elements according to the linkage structure of the graph.
An alternative approach is to plot network data according to the attributes of the nodes,6,7 as in a scatter plot or so-called semantic substrates. 6 Network links can then be drawn between nodes. This approach is well suited for assessing potential correlations between node attributes and network structure.
In a related vein, PaperLens 8 uses multiple coordinated views of network attributes to explore publication databases. The NetLens system 9 generalizes this approach to support networks that fit a “content-actor” data model, that is, bipartite networks such as publications and authors. In contrast, Orion supports an arbitrary number of linking relationships both within and between data tables.
Others have researched means of dealing with large graphs in excess of tens of thousands nodes. Common strategies include filtering and aggregation. Van Ham and Perer 10 introduce a degree-of-interest function 11 that reduces a graph to a small connected subset of nodes based on a set of foci (e.g. search results). PivotGraph 7 and Honeycomb 12 aggregate networks by “rolling up” edges according to node attributes, for example, an analyst can collapse a social network of corporate employees to show the summed connection strengths between workers’ geographic locations. ManyNets 13 enables comparison among multiple networks using a tabular view of summary graph statistics. If desired, users can still view standard (albeit less scalable) node-link diagrams on demand.
Orion draws on this prior work: it provides both node-link and matrix visualizations and supports network aggregation based on node attributes. However, with the sole exception of NetLens, 9 each of the above systems assumes that a well-defined network is given as input to the tool. None of these tools help the user define and assess a variety of network models derived from arbitrary data tables.
Network analysis tools
Recent years have seen a proliferation of network analysis tools. Many of these tools combine visualization and statistics within an interactive environment.14–18 Others are programming libraries19–21 or menu-driven interfaces22,23 that provide access to analysis algorithms. While these tools support data import from common file formats (e.g. GraphML) and external data services (e.g. Twitter or Facebook), they do little to facilitate the flexible construction of network models from arbitrary data tables. Orion is not intended as a replacement for these systems; rather, it is designed to assist the unsupported early stages of network analysis. In the process, it enables the use of these downstream tools.
Managing graph data
Another domain of related work is graph data management. Database researchers24,25 have developed storage strategies and query languages 25 for large networks. Similarly, a number of commercial systems—including neo4j, InfiniteGraph, AllegroGraph, DEX, OrientDB, and sones/GraphDB—are now available. These systems facilitate storage, indexing, and querying of large graphs but with goals different from Orion. Representative applications include managing social network websites and querying motifs in biological networks. Orion instead supports the construction and assessment of network models from source data.
Interactive data transformation and querying
Orion focuses on transforming data to create network models. In a related vein, other research systems have been designed to assist the early stages of data cleaning and reformatting. Google Refine 26 and Data Wrangler 27 enable analysts to reformat input data sets and correct data errors prior to analysis. D-Dupe 28 assists the process of finding and resolving duplicates within a data set. Any of these tools might be used to prepare data tables prior to network modeling with Orion. Similar to Wrangler, Orion produces as output not only data but also a declarative transformation script that can be reapplied to new data and inspected to review data provenance. In this light, Orion can also be understood as an end-user programming tool for network manipulation.
Orion was particularly influenced by (and is named in relation to) the Polaris system, 29 now commercialized as Tableau. Polaris maps drag-and-drop operations of data variables into a formal algebra from which both database queries and resulting visualizations are derived. One key insight from this work is the value of deeply coupling visualization tools with rich facilities for data transformation. Orion similarly provides a UI in which user actions are mapped to statements in an underlying data transformation language. While Polaris enables filtering and aggregation operations over a single data table, Orion instead enables manipulation of multiple tables, including linking relationships realized as relational joins.
The two systems most similar to Orion are Gilbert and Auber’s 30 work on automated graph generation and Liu et al.’s 31 Ploceus. Both of these systems enable analysts to extract network models from tabular data and visualize the results. Gilbert and Auber 30 analyze the relationships among table columns to infer a hierarchy of values (e.g. continent, country, and city). They present an interactive visualization of these hierarchies with which users can select a desired network model that links entities according to shared column values. However, the system only operates on a single table. Ploceus 31 enables users to similarly extract networks based on shared properties and provides a suite of filtering, aggregation, and subdivision operations. Like Orion, Ploceus defines most of its operations using relational algebra and includes support for multitable joins. However, Orion provides more sophisticated subdivision methods and is unique in providing mixed-initiative support for network construction: Orion can automatically infer foreign key relationships and recommend possible network models for requested node types.
Data model
A variety of data models exist for handling graph data; common structures include adjacency lists and adjacency matrices. However, these representations alone are insufficient for network analytics, as in many cases networks must be derived from a prior data source permitting a number of models and parameterizations. As a simple example, a social network extracted from an email archive might include links only between senders and recipients or might include links among all co-recipients.
Prior research on visualization toolkits has noted the value of representing networks as relational tables: 32 each row represents an edge in the graph, and columns contain source and target node values among other edge attributes. This format provides a sparse representation of the network, enables easy querying of attributes, and supports efficient edge iteration. On the other hand, this format is inefficient for path following and is thus ill-suited for many graph algorithms. As a result, we adopt a hybrid data model in Orion.
We use relational data tables as our base representation. Tables can represent individual node types or linking relationships. At times, node types may be implicit within the attributes of a table; Orion provides methods to promote these values to their own table. Networks can be inferred from the foreign key relations among tables. This design allows us to support arbitrary node types and linking relations while facilitating integration with relational databases.
Once a specific linking relationship has been chosen (as described in subsequent sections), Orion models the network using a specialized edge table format. Source and target columns represent incident nodes using zero-based integer indices. For efficient processing, these indices default to the row index in the corresponding node table. This scheme works well for edges involving a single node table but leads to index collisions among different tables. To ensure distinct keys, we bias the indices for a given table by the total size of any previous tables. The mapping from node tables to index ranges is stored as metadata for the edge table.
Some graph analysis routines, such as force-directed layout or clustering coefficient calculation, can be performed by simply iterating over edges. However, other methods—including shortest path and betweenness centrality algorithms—must traverse the graph by following paths. Accordingly, our edge tables support the construction and caching of adjacency lists, represented as an array of sorted integer arrays for in-links, out-links, or both.
This integer-based representation provides multiple benefits. In particular, it allows rapid access of associated node data via index-based table lookups and facilitates the creation of efficient network analysis routines. Representing nodes as zero-based integers enables the use of simple arrays to keep state within graph algorithms, avoiding the overhead of associative data structures.
Our data model, like the rest of Orion, is implemented in the Java programming language. We have implemented our own data structures and processing routines, but our data model was intentionally chosen to correspond to those used by modern analytic databases and scalable network analysis packages. 21 In future work, we want to exploit this correspondence to implement our workflows on massively scalable platforms. We use relational operators for as much of our workflow as possible, so that we can later leverage shared-nothing parallel databases. That said, we will show shortly that our own implementation already scales to networks involving millions of elements and so supports a broad class of data sets.
The Orion UI
With the Orion UI, analysts can import source data from multiple formats, specify a variety of network models, compute statistics, and visualize the results. Analysts can then export either the resulting data or a declarative script defining the transformation workflow. In this section, we first describe the design of the Orion interface through a concrete usage scenario. We then provide more detailed descriptions of Orion’s UI components.
Usage scenario
Consider the real-world example of a researcher (a Computer Science PhD student) studying online health communities organized around medical conditions (e.g. asthma, lupus, and lyme disease). Driving questions include the following: How do community dynamics and structure vary across conditions? Can we gain new insights from the co-occurrence of symptoms and conditions? To explore these questions, our analyst collected over 3 million discussion posts from MedHelp.org, a public online health site. The initial database consists of a single table where each row represents a post on the site. Table columns include a forum (community) name, the user name of the poster, the post date, the title of the discussion thread, and the post text.
From these data, the analyst would like to analyze the social networks of the individual communities. She begins by importing the data table (a large comma-separated values (CSV) file) into Orion. The table and its columns are displayed in the Schema Viewer in Figure 1(a).
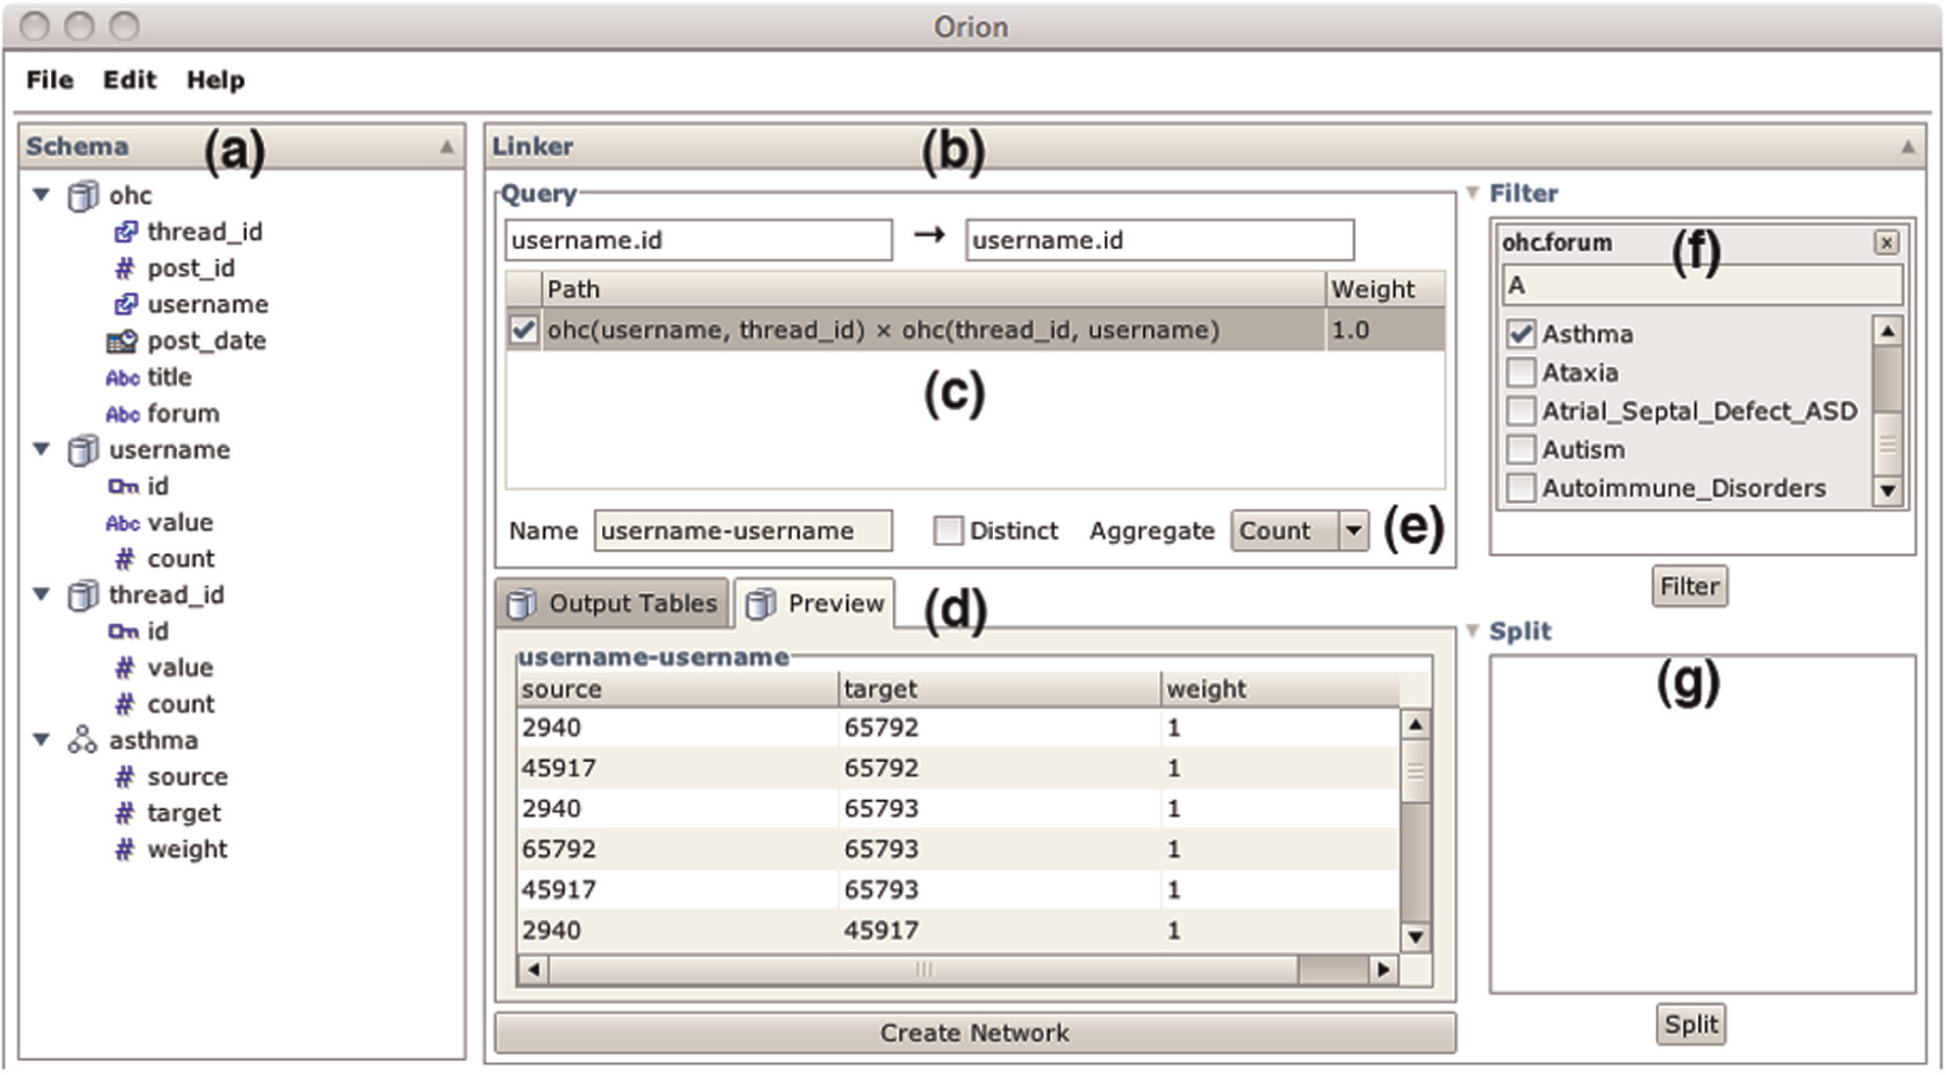
The Orion user interface, consisting of (a) a schema viewer for manipulating data tables and (b) a linker interface for creating network models. Analysts drag-and-drop desired node types to the linker and Orion responds with (c) a table of possible linking paths. (d) The preview display shows the resulting network data. Analysts can also specify (e) aggregation, (f) filtering, and (g) splitting (subdivision) criteria.
Next, she must define the entities of interest that might form the nodes of her graph. Currently, these entities reside implicitly as values within the table. The analyst right-clicks the username field and selects “Promote” in the resulting context menu. This operation causes all username values to be extracted from the table: a new table is constructed with one row for each unique user and the username field in the original table is replaced with a foreign key referencing the new table. As the analyst wishes to model a social network based on co-participation within a discussion thread, she similarly promotes the thread_id field as an entity of interest.
The analyst would now like to construct a social network among users. She drags the id field (the primary key) from the username table and drops it on the Linker interface in the center of the Orion window (Figure 1(b)). The interface allows analysts to specify desired source and target node types. In response, Orion calculates all feasible network definitions involving username entities as nodes (Figure 1(c)). In this case, there is only one feasible result: linking users by shared threads. Should the analyst wish to consider alternatives, she could promote other entities (e.g. individual forums).
When the analyst clicks the check box to include the linking path, Orion responds by showing a preview of the resulting graph (Figure 1(d)). Orion previews include both a list of tables that will be generated and an inspector for individual table values. For now, the analyst would like to limit her exploration to a single community. She drags the forum field from the Schema Viewer to the Filter region of the Linker; she then selects the “Asthma” forum using the resulting search box (Figure 1(f)). The preview updates in turn. Satisfied, the analyst clicks the “Create Network” button to add the network to the data set; the Schema Viewer updates with a new edge table containing links between all posters to the “Asthma” forum who have posted to the same thread; by default, edge weights indicate the number of shared threads between two users.
By right-clicking the “Asthma” edge table, the analyst reveals additional options. She can choose to visualize the network using both matrix and node-link diagrams. In a matrix overview (Figure 2(a)), the disjoint structure of the community becomes evident, which suggests that newcomers arrive into the community, ask a question, and it gets handled by one of a handful of leaders. This also suggests that the community may serve as an “answer mill” rather than a place of prolonged discussion. The analyst can dig deeper by filtering the visualization to only show a highly active cluster and pivots to a node-link visualization (Figure 2(b)). Here, with nodes sized by their post count and colored according to their betweenness centrality, the analyst can focus on specific nodes of interest for further analysis.
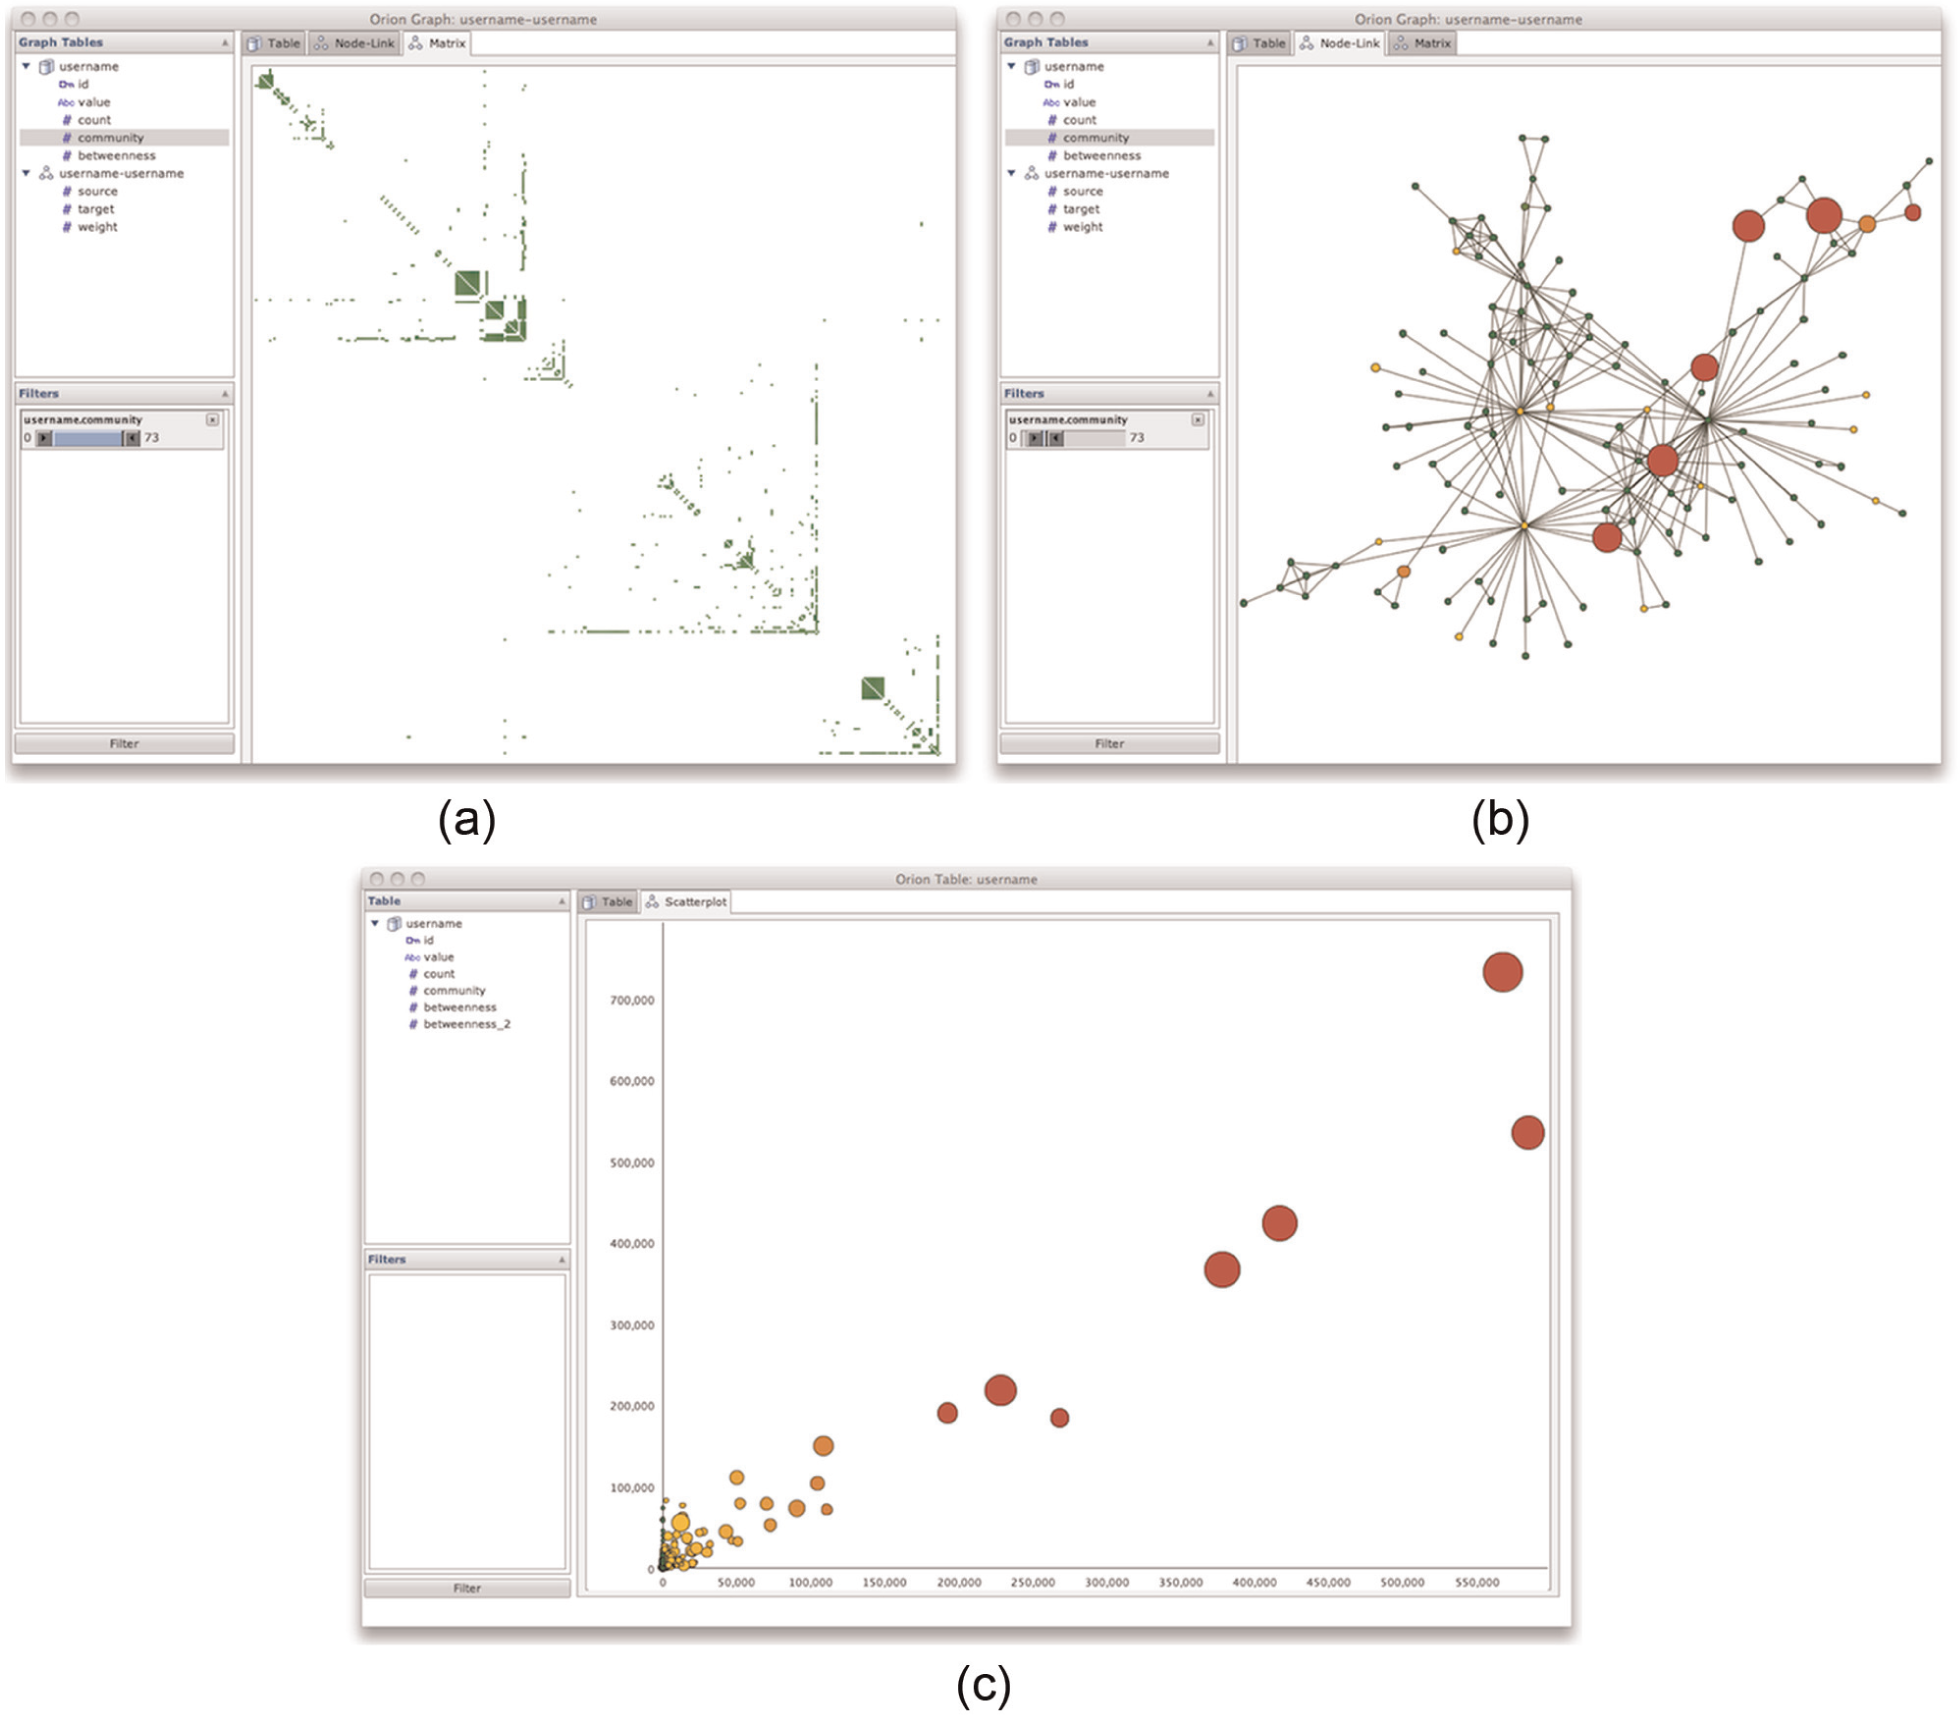
Orion visualizations of online health communities. (a) A sorted matrix view of an online asthma forum. A few central leaders divide up responses among incoming questions. (b) Node-link diagram of highly active cluster of the same forum. (c) Plot of betweenness centrality values for two different network models, sized by number of posts. The models have similar centrality distributions.
Individual tables can be inspected and visualized using bar or scatterplot charts. Each visualization also supports interactive filtering controls. After filtering the graph to highlight interesting patterns, the analyst can save the filtered edge table as an additional entry in the Schema Viewer. The analyst can also compute statistics, including node degrees, betweenness centrality, and clustering coefficients. Statistical operators add additional columns to the implicated edge and/or node tables.
Now the analyst would like to assess the effects of using a different network model. The current model includes edges connecting all posters to the same thread. What happens if instead thread respondents are connected only to the thread initiator? The analyst follows the same modeling path as before, but this time adds a join predicate: she right-clicks the linking path of the network and chooses to filter how the ohc table is linked to itself. In these particular data, a poster has a post_id of 0 if they initiated the thread and a post_id greater than 0 if they responded to the thread. As these data characteristics are specific to this particular community data, the analyst enters a customized formula in the resulting dialog: INT1(“post_id”) == 0 && INT2(“post_id”) > 0.
The formula ensures that the source node always corresponds to the thread initiator and that the target node is a respondent. The analyst creates this network, computes betweenness centrality values, compares values for the two models in a scatter plot (Figure 2(c)), and notes a high degree of correlation. She decides to proceed with the simpler model connecting only initiators to respondents.
The analyst would now like to start comparing the various health communities. She revisits her previous steps, but instead of filtering the forum field, she drags it to the Split region. The preview display then shows entries for multiple networks—one for each forum. Upon completion, these networks are grouped together within a subtree of the Schema Viewer. Context menus for the grouping element enables batch invocation of statistics for all contained networks (see Figure 13 for an example). The analyst can now continue analyzing the diverse characteristics of health communities.
UI design
The previous scenario illustrates a subset of the modeling and visualization functionality supported by Orion. We now describe the UI components in detail. Along the way, we outline additional functionality, such as the ability to merge multiple sets of edges and construct “rollup” graphs via node aggregation.
Schema viewer
The Schema Viewer (Figure 1(a)) provides an overview of all data tables in the current data set and supports data manipulation. Source data tables and generated edge tables are indicated by icons. Table attributes are displayed using icons indicating their data type, with special annotations for primary and foreign key fields. Context menus enable analysts to rename and remove both tables and columns, create derived columns using an expression language, specify primary keys, and promote values in one or more columns to new node tables. Analysts can also access statistics and visualization options via context menus. Drag-and-drop interactions allow analysts to specify foreign key relations (by dragging a field on to a primary key with a matching type), import data (by dragging external data files from the operating system), and query for network models (by dragging fields to the Linker interface).
Link specification
The Linker interface (Figure 1(b)) is the primary means of defining networks. Analysts start by dragging desired node types to fields for source and target nodes. Orion responds by computing the possible linking paths between the source and target nodes and displays the results in a table. Users can select the resulting paths to include those edges within the resulting network model.
Filtering
Analysts can drag-and-drop fields to specify filtering criteria (Figure 1(f)). Filters can be created for any table involved in the network. Orion generates dynamic query widgets—selection lists and range sliders—based on the data type. Corresponding predicates are then applied during network construction to limit the nodes and edges included in the final graph. In addition to single-table predicates, analysts can specify filtering criteria directly on joins. Filterable joins are presented in a context menu when an analyst right-clicks a linking path. Currently, Orion only supports user-defined join predicates specified as Java code statements.
Splitting
An alternative to filtering is to split a network into a collection of subgraphs. Examples include inspecting time slices and splitting on categorical variables (e.g. health forums). To specify subdivision criteria, a user first drags a node or edge field to the Split region (Figure 1(g)). Orion then displays a widget enabling further parameterization (Figure 3). Networks generated by splitting appear in the Schema Viewer as grouped collections that support batch operations.
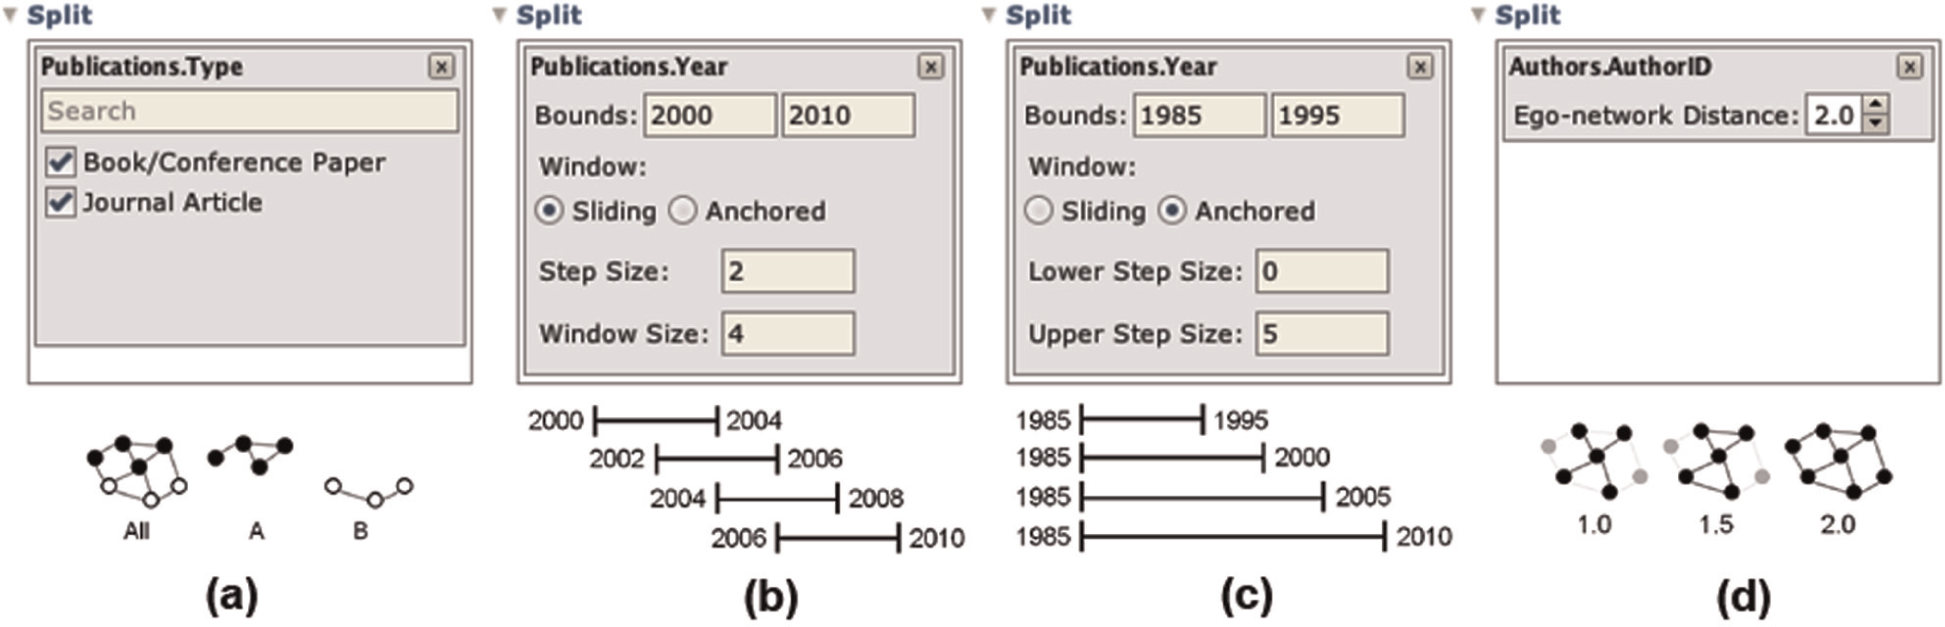
Network splitting operations supported by Orion: (a) subdivision by category, (b) sliding windows, (c) anchored windows, and (d) subgraph extraction.
Orion supports splitting by categorical variables to create separate networks that isolate a given node or edge attribute value. For quantitative and temporal attributes, users can specify window functions; both sliding windows (which sequentially cover a domain) and anchored windows (which extend from fixed reference bounds) are supported. Of course, not all such splits are useful: naively splitting on a node’s primary key results in a collection of singleton graphs. In this special case, Orion instead interprets the split as a request for subgraphs centered at each node and provides a graph distance control. Analysts can extract all nodes and edges within a specified graph distance to isolate egocentric networks. For example, a distance of 1.0 includes all neighbors, a distance of 1.5 includes all neighbors and edges between them, a distance of 2.0 includes all nodes within two hops, and so on.
Rollup
When specifying desired node types via drag-and-drop, typically the primary key of a node table is used. If analysts instead drag-and-drop a nonkey field, an aggregated network will be constructed that uses the unique field values as individual nodes (cf. PivotGraph 7 ). The underlying nodes are grouped according to the requested field; edges between groups are tallied to provide an aggregate representation of the underlying graph.
Multiple edge sets
By selecting multiple linking paths, Orion allows analysts to construct networks with multiple edge sets. When multiple paths are selected, the linking interface enables controls for choosing an aggregate function for merging edge sets (Figure 1(e)); options include basic logical (or, and) and arithmetic (count, sum, product) operations. For arithmetic operations, analysts can also provide numerical weights for each edge set.
Preview and confirmation
As analysts manipulate settings within the linker display, a preview panel updates in response (Figure 1(d)). Analysts can review the number and size of all tables generated and inspect the values of individual tables. Once an analyst is satisfied with the linking definition, they can click the “Add Network” button to add all resulting tables to the Schema Viewer.
Visualization
Orion also supports visualizations: table displays, basic data graphics (bar and scatterplot charts), node-link diagrams, and matrix views (see Figure 2). Visualizations are shown in a separate window with different visualization types accessible via tabbed panes. These windows include a schema viewer showing only the data tables implicated in the current visualization. Orion uses the Java implementation of the Protovis specification language 33 to generate these visualizations.
Analysts can parameterize a display using filtering, sorting, zooming, and visual encoding controls. Node-link diagrams use a force-directed layout algorithm based on a physical simulation. Matrix rows and columns can be sorted by node attributes or by linkage to hunt for patterns within the data. Layout and sorting facilities are included among the analytic operators described in section “Network analysis.” As our interactive data transformation methods constitute the primary contributions of this article, we leave consideration of additional visualization facilities to future work.
Network definition and extraction
Having introduced the Orion interface, we now discuss some of the underlying algorithms enabling interactive network modeling. While relational tables provide a flexible model for representing data, network extraction involves creating linking queries that regularly include one or more join operations. As a result, defining networks via a query language such as SQL can be tedious and error-prone. To simplify the process, Orion models the connections among data tables and analysts request networks simply by specifying the desired node types. The system then enumerates the possible network definitions, from which an analyst can choose.
We describe the steps of this process in the following subsections. First, we construct a linking graph that models the foreign key relations among tables. In response to user queries (i.e. desired node types), we then run a search algorithm over this graph to identify valid linking paths. Linking paths are then translated into relational algebra statements for extracting network edge tables.
Linking graph construction
To aid network definition, Orion builds a linking graph: a data structure that supports user queries over possible network models. Nodes within a linking graph correspond to data table fields (columns); primary key fields are assumed to represent a specific node type. Edges in the graph represent relationships among fields (e.g. foreign key references) that might be used to define a network among node types. Given input schemas for a set of data tables, Orion constructs a directed graph containing three types of edges:
Key reference (R) edges link all primary and foreign keys representing the same node type.
Intratable (T) edges link all foreign keys within a table. The edges represent potential linking paths between node types.
Conjugate (C) edges link a foreign key F of one node type to a primary key P of a different node type if and only if the table containing F has an additional foreign key that references P.
While the first two edge types are straightforward, conjugate edges merit further explanation. These edges represent paths in which one can join a linking table with itself to form a unipartite graph—a process analogous to multiplying a bipartite adjacency matrix by its transpose. Key reference (R) and intratable (T) edges are bidirectional; conjugate (C) relationships are unidirectional, from a foreign key to a primary key with a different node type. Figure 4 shows the schema and linking graph for publication data extracted from the Association of Computing Machinery (ACM) digital library.
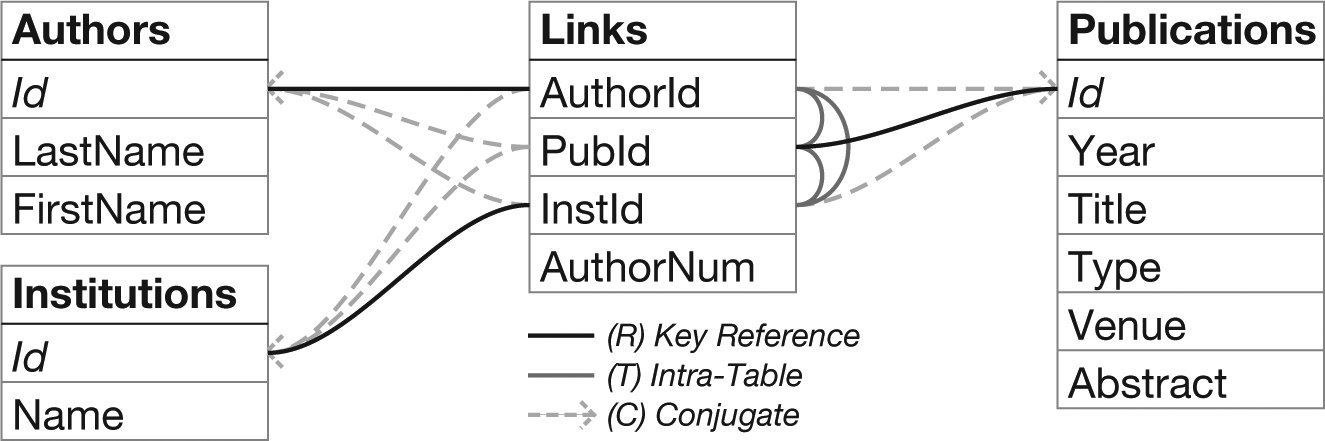
Schema and linking graph for publications data. Primary keys are italicized. Links are styled according to the edge type; links without arrows are bidirectional (R and T edges). The graph is a data structure for finding all networks involving a pair of node types.
Automated key finding
To facilitate accurate key assignments—and thus accurate linking graph models—Orion includes mechanisms to automatically infer single-column primary and foreign key relations. To identify primary keys, the algorithm finds columns with distinct elements in each row and then ranks the candidates according to data type (e.g. integers are preferred to strings or dates) and position (left-most columns—those with a minimal index position—are preferred). The top-ranking result for a table is then chosen as the key, though users are free to override this choice within the interface.
For a selected primary key, Orion identifies candidate foreign keys by first finding all table columns with a matching data type. It then scores each candidate using a logistic regression classifier. The regression model includes the following features, where P is the primary key column, F is the candidate foreign key column, dist returns a set of distinct column values, and lcs returns the longest common subsequence within two strings


In other words, candidate keys are classified using features concerning (a) how many distinct primary key values occur in the candidate column, (b) how many elements in the candidate column occur in the primary key column, (c) the similarity of the column names for the primary and candidate keys, and (d) the similarity of the primary key table name to the candidate key column name. We trained our classifier on a corpus of test data, including all examples in this article. Our classifier achieves an accuracy of 98.9% using cross-validation tests. More details about our classification approach, including additional features and evaluation methods, are provided in Appendix 1.
Linking path search
Given a linking graph and desired source and target fields (node table primary keys), Orion searches the graph to identify valid linking paths. These paths can be translated into relational algebra statements (e.g. projections and joins) to create a network edge table.
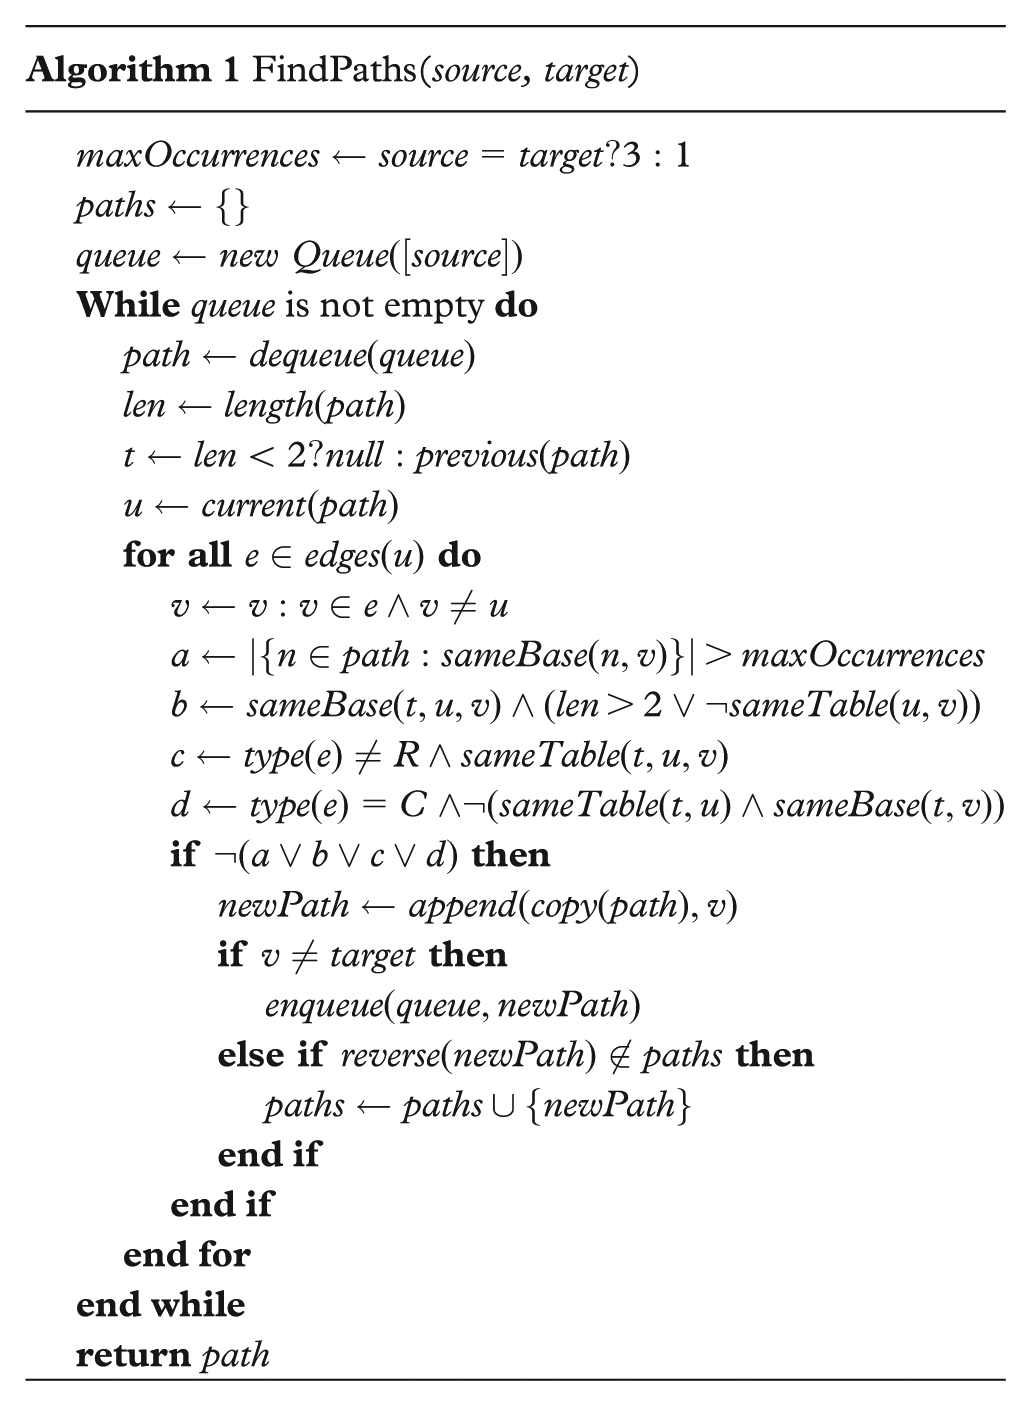
Orion’s path-finding method (Algorithm 1) performs a breadth-first traversal starting from the source field. The traversal algorithm allows repeated visits to a node but greedily prunes the search at each step by testing the validity of candidate path segments. For a given path segment path, we denote the most recently added field by u, the previously added field by t, and a newly encountered candidate field by v. All fields have a corresponding base field indicating the node type: primary key fields reference themselves, while foreign key fields reference a primary key. With these definitions in place, valid paths are defined by the following conditions, which roughly correspond to the Boolean variables a, b, c, d within Algorithm 1:
Excluding source and target fields, paths cannot contain the same base more than twice.
The same base field cannot occur three times consecutively unless u and v are in the same table.
Three consecutive fields cannot be from the same table, unless the third field is reached by a key reference edge (R).
A field reached through a conjugate edge (C) cannot be added to a path unless (a) t and u are in the same table and (b) t and v share the same base field, which differs from that of u.
The algorithm returns a set of valid linking paths with which an analyst can define a network model. To simplify the results, the algorithm culls paths that are identical to a previously found path if reversed. In addition, Orion sorts the returned paths such that shorter paths with less variation in base field types are listed first.
Network extraction
Once an analyst has selected a set of desired linking paths, Orion translates these paths into relational algebra statements that when evaluated provide a network edge table. Figure 5 provides examples of input queries and the resulting linking paths and relational algebra statements (using the data and linking graph in Figure 4).
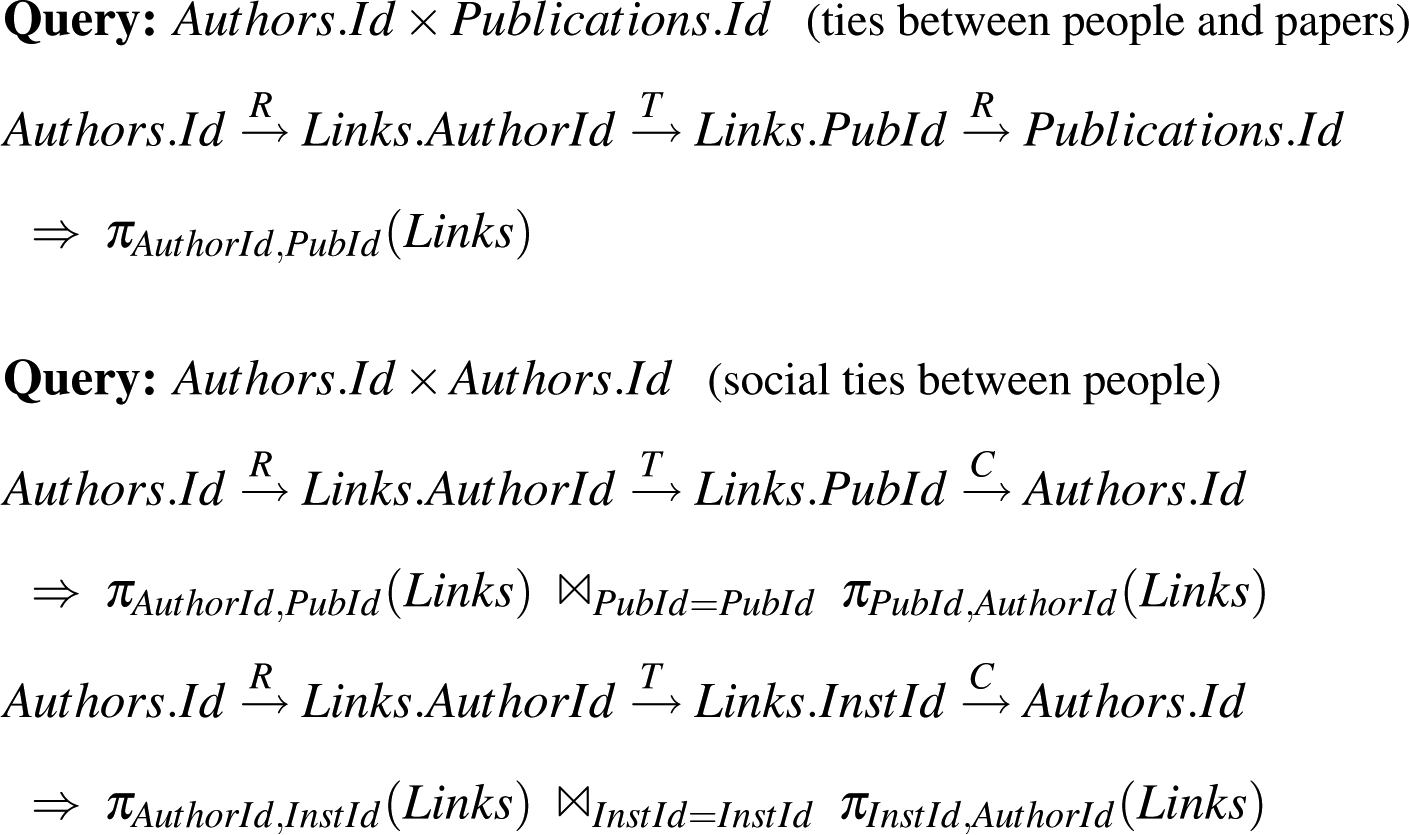
Example linking queries and results returned by Orion’s search algorithm. Linking path edges are annotated by type: key reference (R), intratable (T), or conjugate (C) edges. Paths are mapped to relational algebra statements to extract network edge tables.
Mapping paths to relational algebra is straightforward. In most cases, each pair of fields (ignoring source and target fields) maps to two columns of the same table, with adjacent pairs related by an equijoin on the shared inner field. The special cases are conjugate edges, for which an encountered pair is instead joined against itself, and “self-edges” within a table that result in an odd number of path elements (e.g. tree data with paths of the form
When an analyst selects a network definition, Orion executes the resulting queries and constructs an edge table with integer node indices (section “Data model”). Orion similarly turns filtering criteria specified in the UI into relational selection predicates that are incorporated into the queries. If an analyst selects multiple linking paths, Orion will construct multiple edge tables. Orion then forms the union of these edge tables; analysts can further specify aggregation functions in the Orion UI to control if and how multiple edge sets should be merged.
Orion workflow operators
In addition to transforming data, one goal of Orion is to enable the construction of editable and reusable analysis workflows. These workflows are realized in a declarative language incorporating both relational operators and network statistics. By mapping UI actions into statements in this language, Orion supports not only data manipulation and visualization but can also export reusable scripts that keep a record of data provenance. In this section, we describe the operations supported by our language and how they can be used to model and analyze network data.
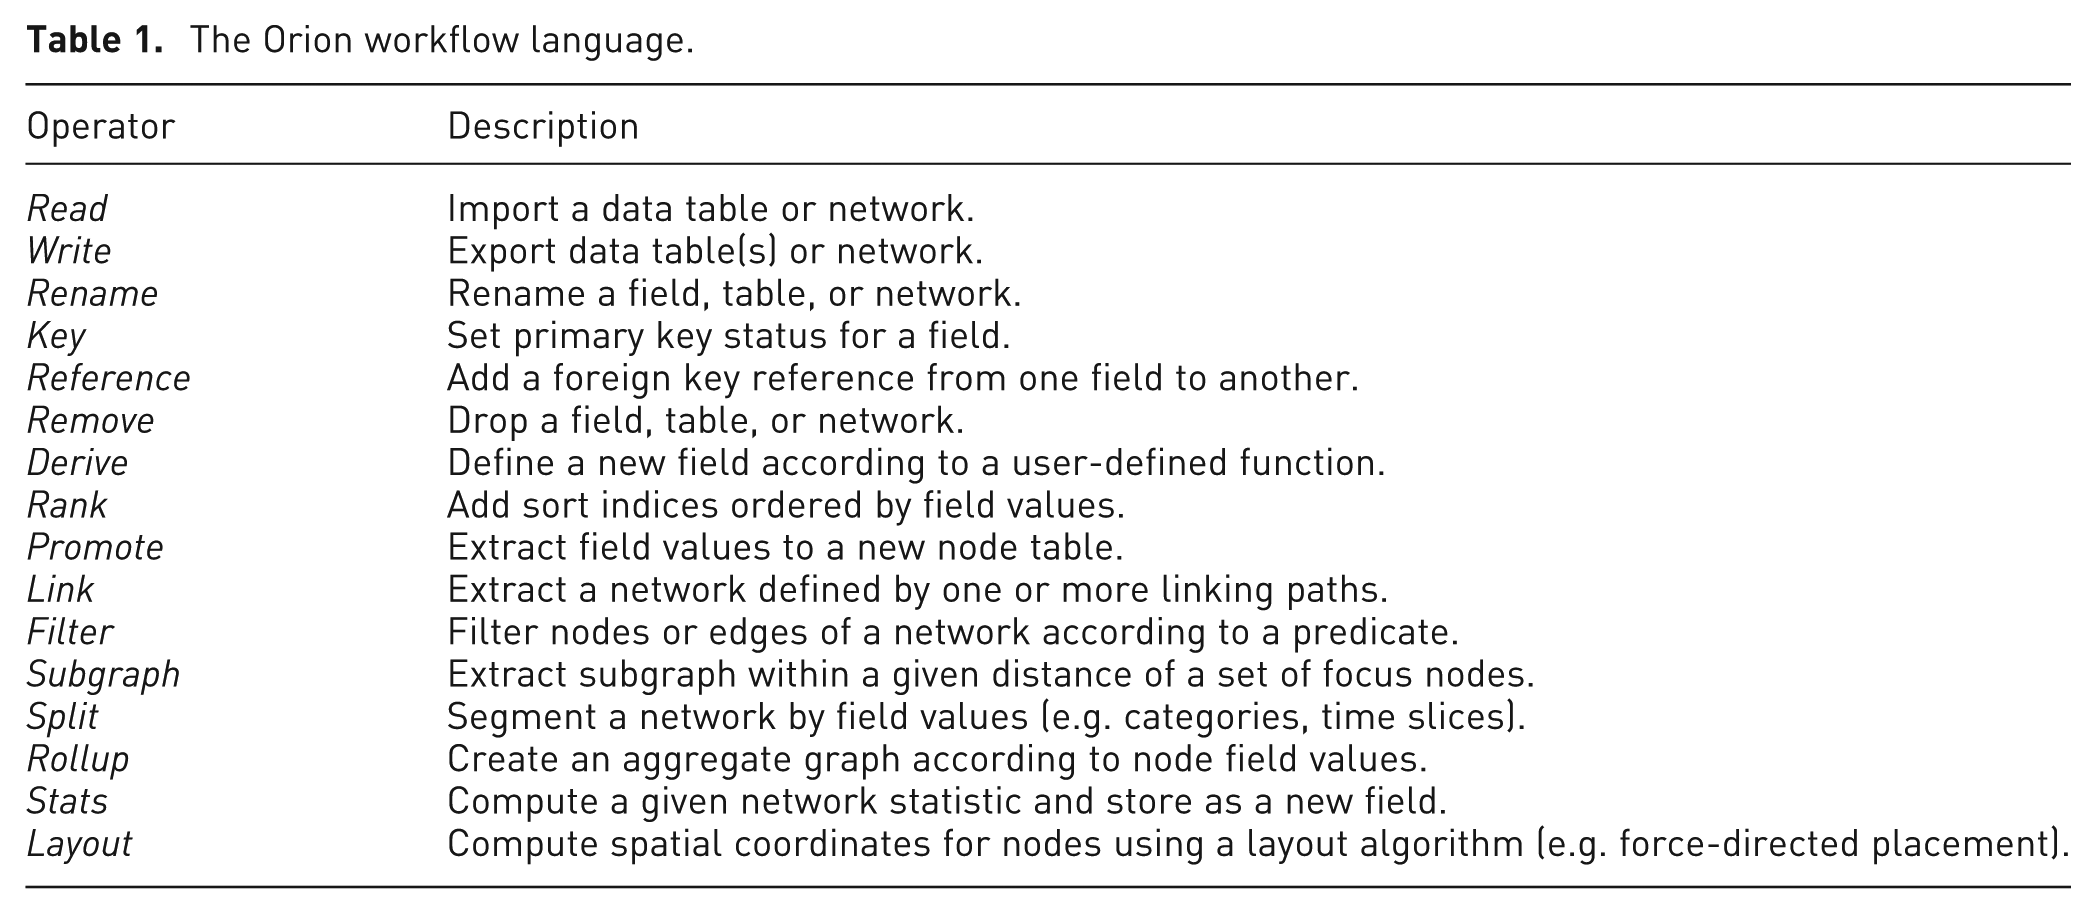
Each Orion workflow task is an operator accepting one or more named parameters. These operators modify a data set: a collection of named tables. A workflow is simply a sequence of tasks. Figure 6 shows an example workflow for the case study in section “Online health communities.” Orion externally represents workflows using a simple XML format. Table 1 summarizes each of these operators.
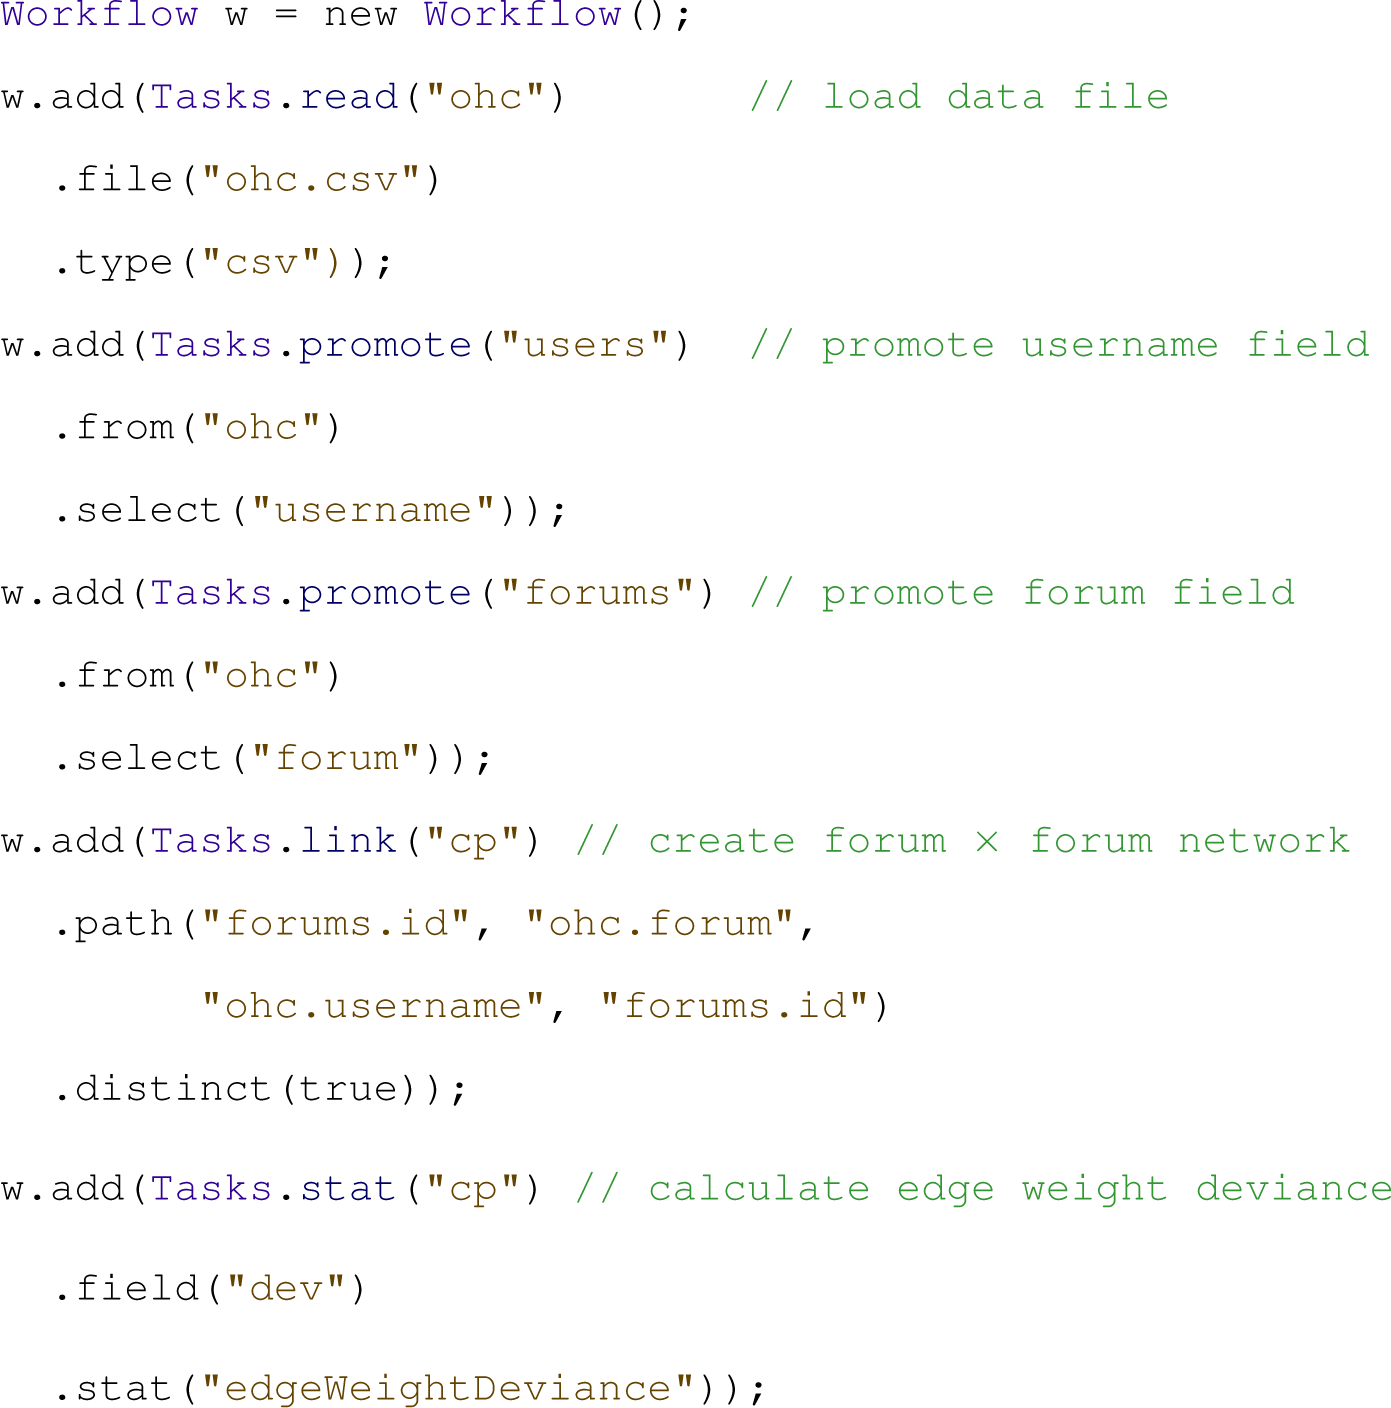
An example Orion workflow definition for the online health case study in section “Online health communities.” Here the workflow is shown as Java code; workflows can also be persisted using a simple XML format.
The Orion workflow language.
Data import and export
Orion’s input/output operators read in data from different sources and write results in a variety of formats. The
Schema modification
Orion includes a handful of operators for modifying table schemas. The
Table transformation
To aid the creation of network models, Orion provides operators for manipulating single tables. The
Ranking table rows
The
Promoting column values to node tables
Tabular data often contain implicit linking relationships via values embedded in a column. For example, a single table of research grant awards might contain fields for a principal investigator (PI), a co-PI, and the institutions of each. From these data, one may wish to form social networks of researchers and/or institutions. To help model such networks explicitly, Orion provides the
Network modeling
At the core of the Orion language are network creation operators.
Network definition
Given a set of linking paths as input, the
The link operator also accepts optional projection and filtering parameters. Projection parameters consist of node or linking table columns to include across joins (as if included in a SQL SELECT clause). Filter parameters are name–value pairs of table names and predicate functions. Both single-table predicates (for filtering either node or linking tables) and two-table predicates (for join predicates on linked tables) are accepted. The link operator also accepts Boolean parameters for suppressing self-links in unipartite graphs and for ensuring that only distinct edges are considered in linking tables. The latter enforces preaggregation of linking tables.
Subnetwork extraction
Once a network has been created, Orion provides operators for extracting subgraphs. For example, an analyst may want to compare time slices of an evolving network or various egocentric networks extracted from a larger social graph. The
Given a set of “focus” nodes, the
Orion also provides
Network aggregation
At times an analyst will be more interested in the aggregate properties of a graph than in leaf-node details; given a social network, she may wish to view the aggregate connections among genders or cities. The
Network analysis
Orion additionally provides network analysis algorithms. The
While many of these metrics are common to social network analysis, a few deserve special mention. The edge weight asymmetry and deviance measures are inspired by Van Ham et al.’s Honeycomb 12 system. The former is simply the logged ratio of edge weights between corresponding antiparallel edges in a directed graph. The latter calculates the amount an edge weight deviates from the expected value if one assumes a uniform random distribution of total weight across the cells of the adjacency matrix. Deviance can help identify edges with unexpectedly strong or weak strengths, particularly in dense aggregated networks.
Community identification is performed via a greedy hierarchical clustering optimizing Newman’s modularity metric. 34 Linkage-based sorting provides an integer sort order of nodes that attempts to minimize the distance among connected nodes. We approximate this objective by seriating the nodes using the cluster tree constructed by the community identification algorithm. 35 The resulting ordering is particularly useful for visualization purposes, such as permuting the rows and columns of an adjacency matrix diagram to reveal clusters. 4
The
Summary
In summary, the transformations supported by Orion are realized in a declarative workflow language. Saved Orion sessions are simply XML-serialized versions of this workflow and so can easily be edited or reviewed directly in a text editor. While the Orion interface enables rapid specification of these workflows, we have also found that programmatic use of the workflow language (as in Figure 6) has greatly aided data analysis in our research groups.
Case studies
We now present a collection of case studies illustrating how Orion has been applied to conduct network analyses in multiple domains.
Online health communities
The scenario in section “Usage scenario” introduced an analysis of online health communities. In addition to comparing the social networks of individual forums, our collaborating analyst is also interested in exploring the connections between communities. Might cross-posting behavior provide insights into the comorbidity of medical conditions? We demonstrate such a scenario using the Orion UI.
To assess such questions, the analyst generates a network in which the nodes correspond to discussion forums and edge weights indicate the number of distinct users who have posted in both forums. To construct this network with Orion, the analyst promotes both the username and the forum fields to node tables. The analyst then requests a network with forum nodes as both the source and the target. Orion suggests the desired result: linking forums by shared users.
The analyst then runs the edge weight deviance statistic to calculate the degree to which edge weights vary from the expected value (assuming a uniform random distribution). The resulting matrix diagram is shown in Figure 7, with cells colored by deviance.
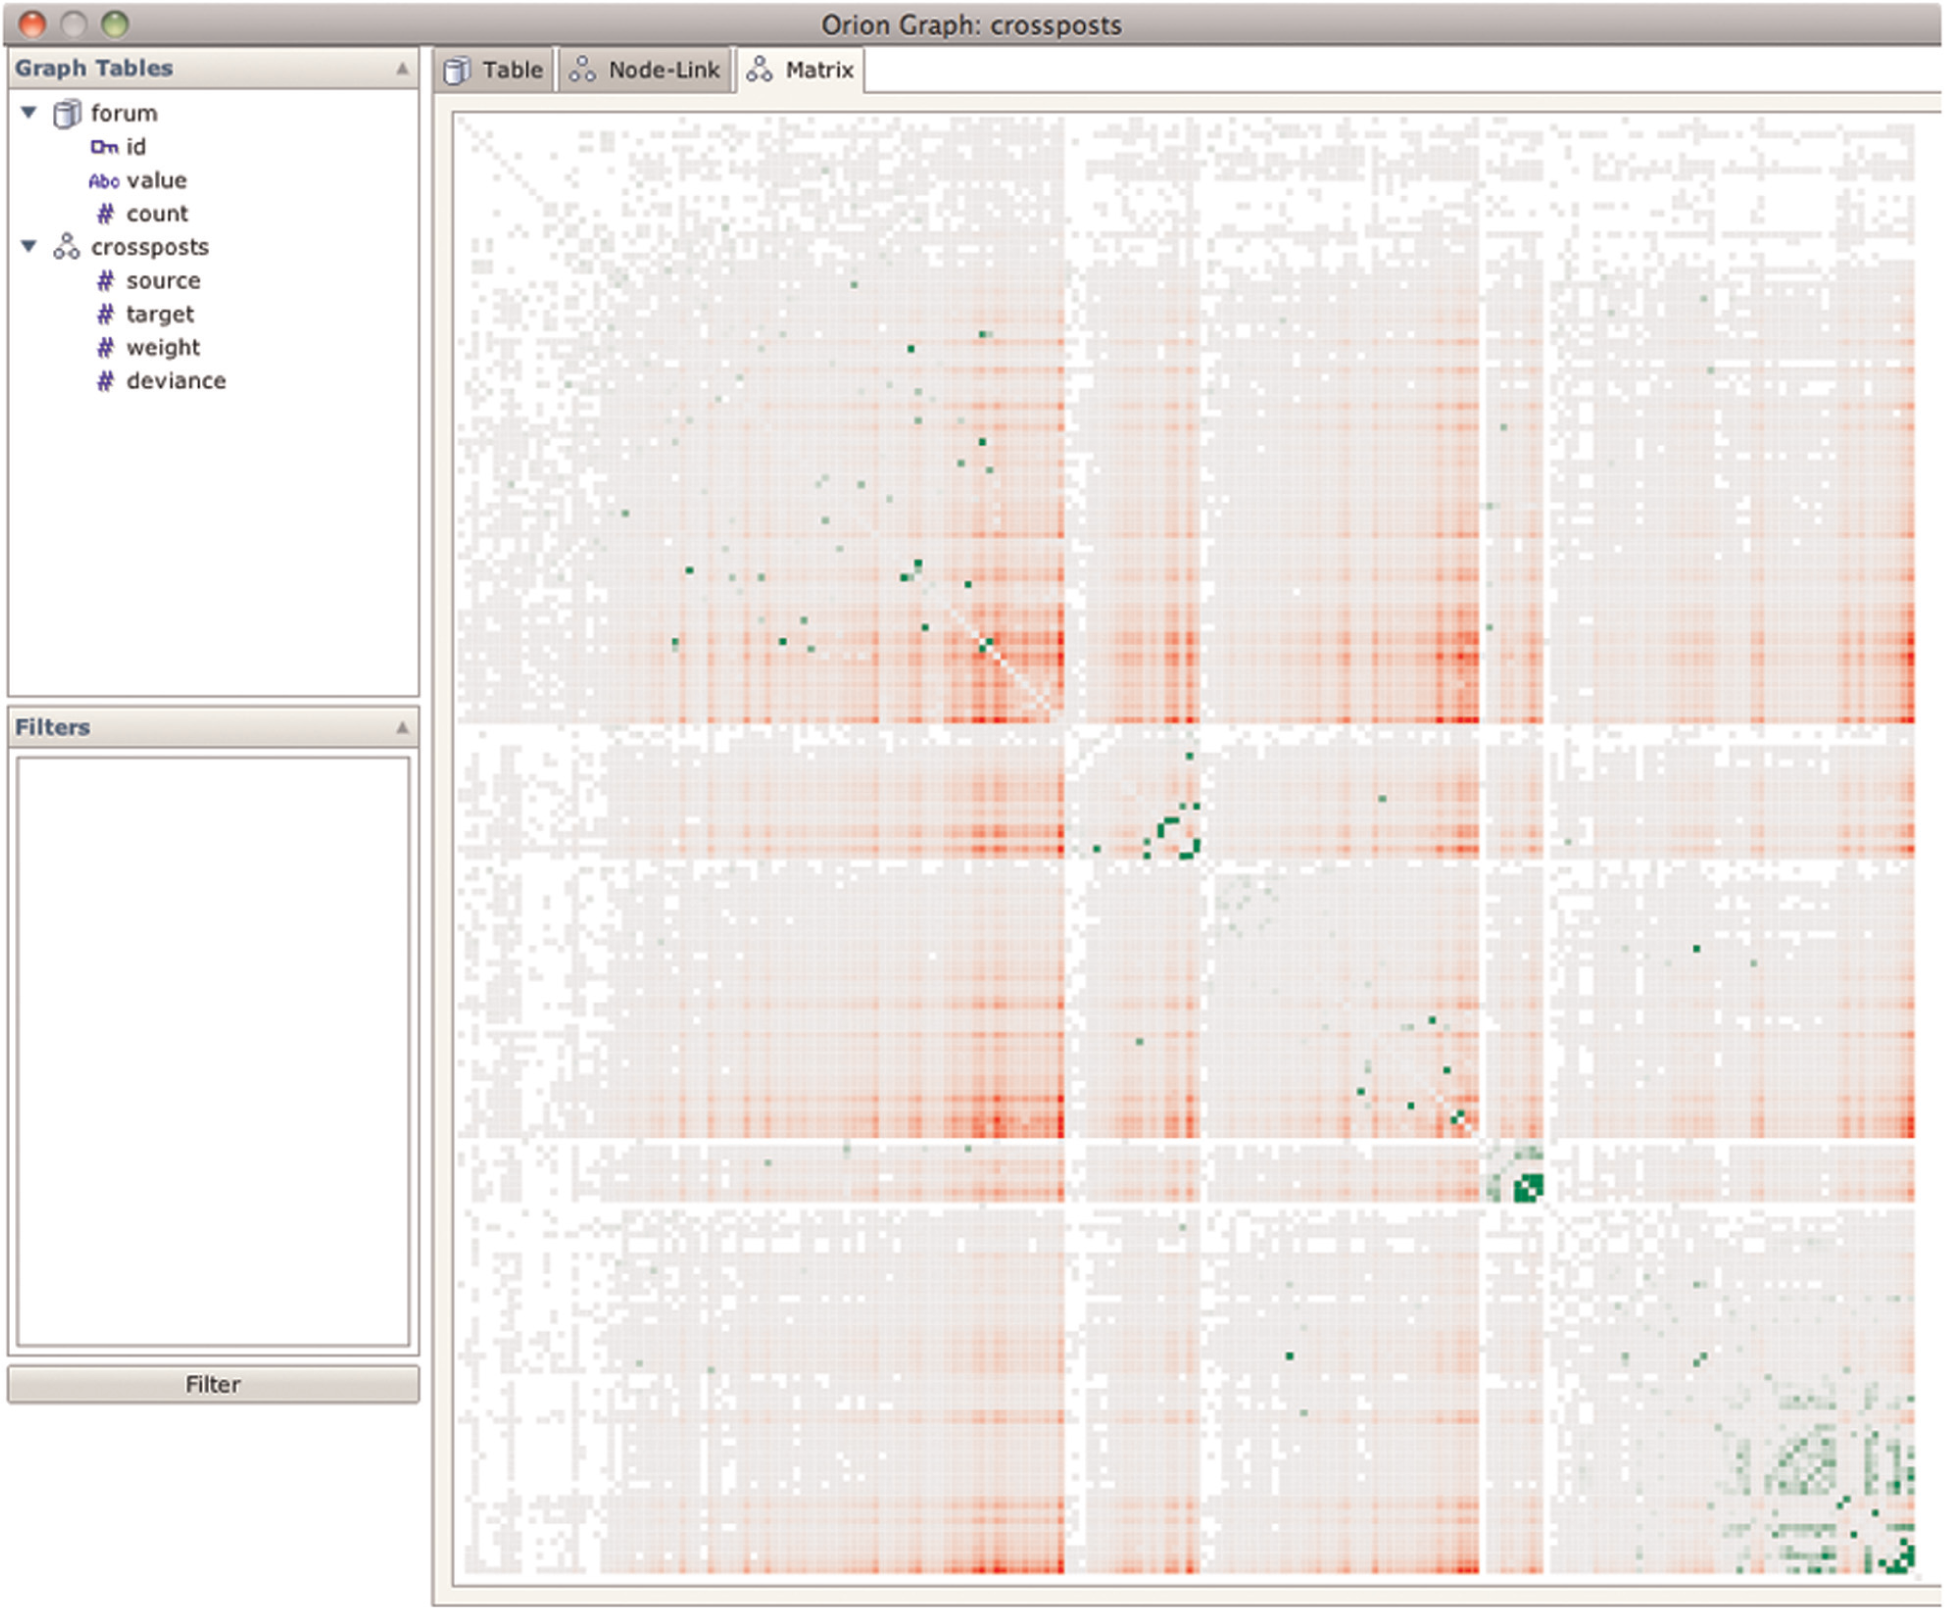
Matrix view of connections between online health forums. Edges are weighted by the number of distinct cross-posters. The cells are then colored according to edge weight deviance; green cells indicate values greater than expected and red cells indicate values lower than expected.
By inspecting both this matrix view and the sorted edge table, the analyst has flagged a number of unexpected connections. Some connections appear to indicate possible data errors, for example, the hearing loss forum has unexpectedly strong connections to many other forums. Other strong connections indicate interesting co-occurrences (e.g. cold/flu and stress, ear/nose/throat problems, and heart disease) or common misdiagnoses (e.g. lupus and lyme disease). Orion has enabled her to make these observations in a matter of minutes. The analyst is now following up on these results, for example, by correlating them with external comorbidity data.
Electronic medical records
In another case study, Orion is used to model the progression of a disease using data from EMR. The goal of constructing such networks is to allow medical experts to better understand the onset of symptoms in patient populations, hopefully resulting in speedier diagnoses and treatments. In this case study, a team consisting of a computer scientist (the analyst) and four medical experts (one cardiologist, two medical scientists who were formerly emergency room doctors, and one epidemiologist) construct a network from over 3.3 million clinical notes involving 50,000 patients over 7 years to model the evolution of heart failure (HF).
The analyst begins by loading the data tables using the File menu in the Orion UI. The analyst imports an EMR table, where each row corresponds to a clinical event for an associated patient. The EMR table only contains IDs of events and patients, so the analyst also imports a symptomDefinitions table that contains associated metadata, such as the symptomName and symptomDate. In this data set, all dates are aligned by the diagnosis of HF, so negative dates imply events before a patient was diagnosed with HF and positive dates imply events after diagnosis. The analyst also imports an additional patient metadata table, patientDefinitions, that contains the patientType, which defines whether it is a case patient with HF or a control patient without HF.
The analyst then promotes both the patientIDs and the symptomIDs fields to node tables. However, since the symptom metadata is located in a separate table, the analyst creates a reference from the symptoms table to the symptomsDefinitions table using Orion’s automatic key-finding algorithm. The analyst similarly creates a reference between patients and the patientDefinitions table.
The analyst now wishes to create a network of symptoms when they co-occur among different patients. The analyst also demands that the edges of this network have a weight equal to the number of patients that experienced such a co-occurrence. To do this, the analyst requests a network with symptom nodes as both the source and the target and selects the option to only count distinct patients when tabulating edge weights. Orion then invokes its path-finding method (Algorithm 1) and presents the only path found:
However, the analyst is only interested in how the symptoms co-occur up until the patient diagnosis and so filters the network to ensure that all date values are negative. The analyst then runs the linkage-based order statistic to obtain a sort order for a matrix visualization that minimizes the distance among connected nodes. The resulting networks (unfiltered and filtered) are then exported from Orion and visualized using MatrixFlow, 36 shown in Figure 8.
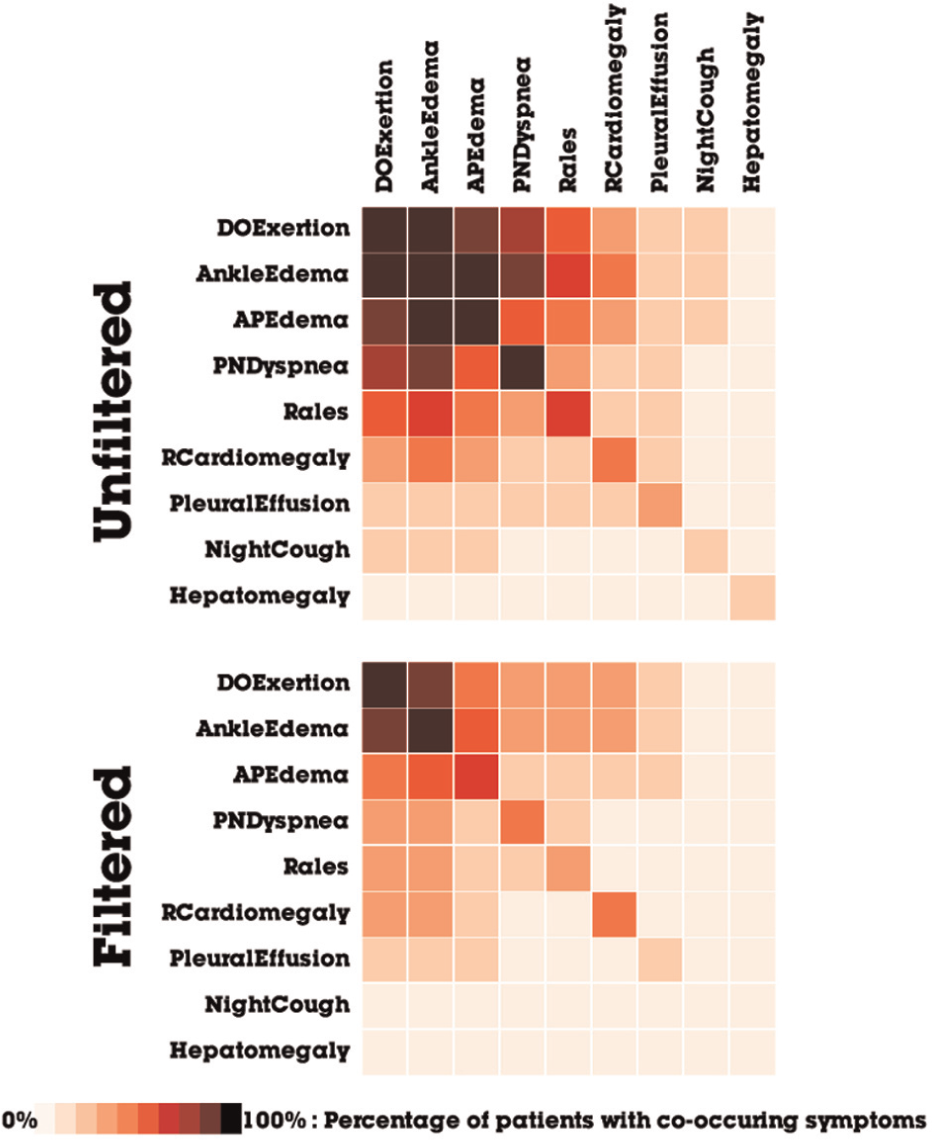
Matrices of co-occurring symptoms extracted from electronic medical records of patients with HF. The filtering constrains the symptoms to only those that appear prior to HF diagnosis.
Temporal network analysis
Having generated an overview, the analyst now wants to understand how the co-occurrence network of symptoms changes over time. Based on clinical background knowledge, the analyst wants to focus on 18 months leading up to the diagnosis of HF. Using Orion, analysts can model temporal networks by using the Split operator to subdivide networks into time windows. The analysts choose to split by symptomDate, setting the lower bound to 18 months before diagnosis and the upper bound to the date of diagnosis. The analyst performs two different types of splits using 3-month intervals: a binned network with sliding time windows and a cumulative network with anchored time windows, as shown in Figure 9.
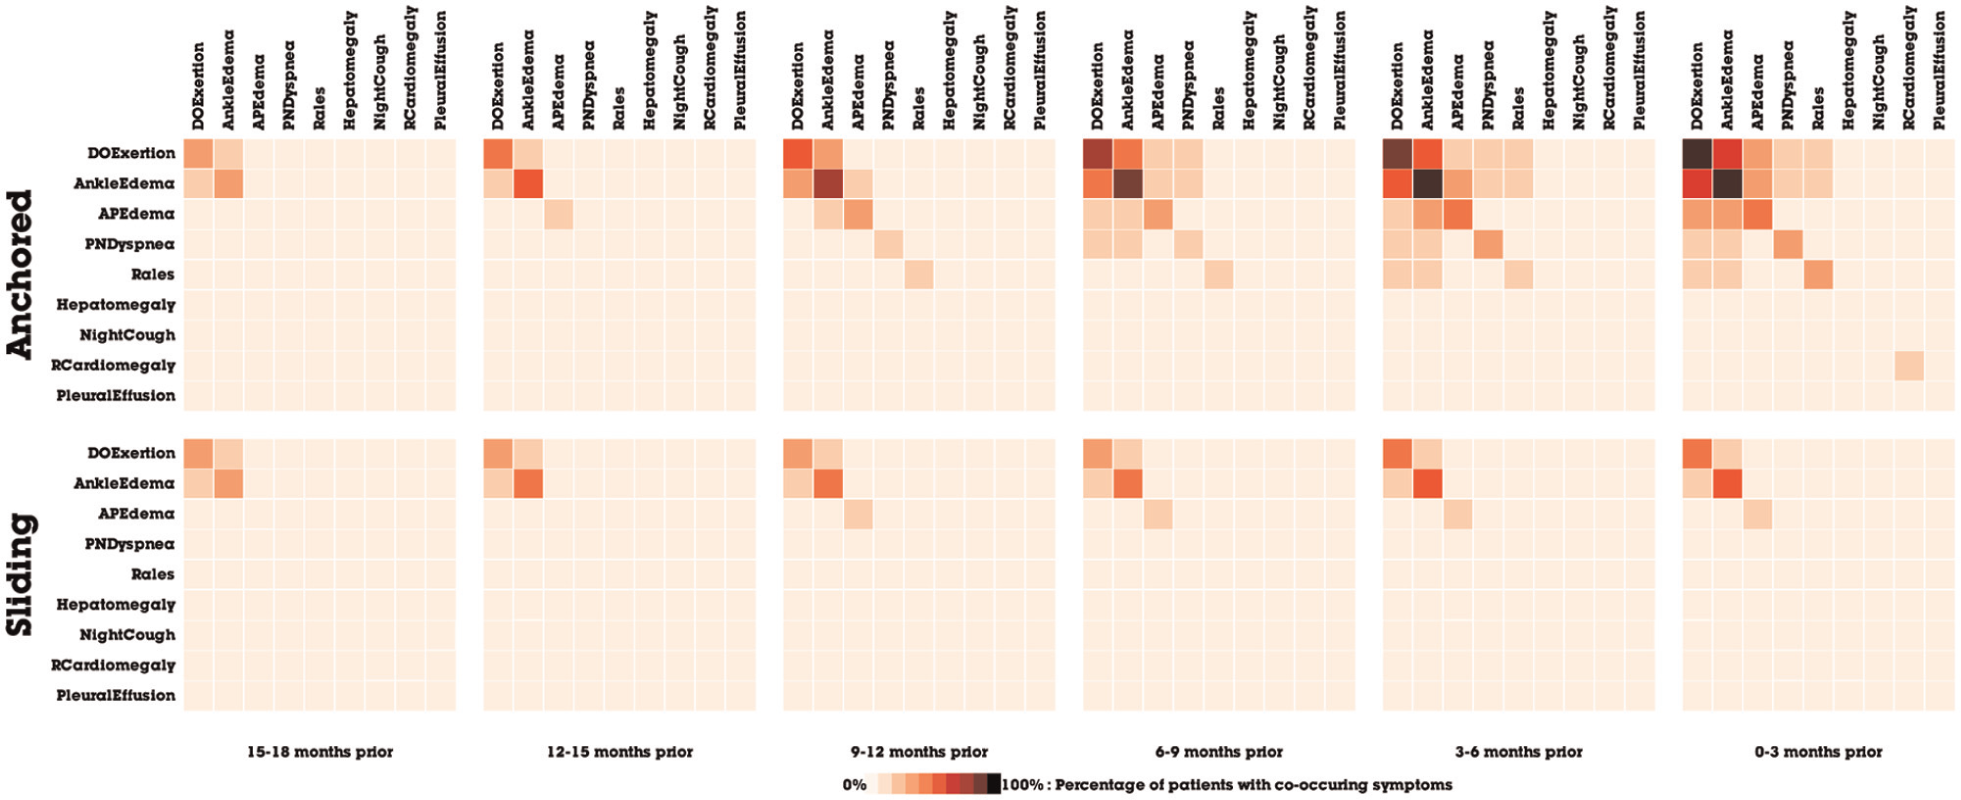
Matrices of co-occurring symptoms, split by (a) anchored and (b) sliding windows of 3-month intervals.
Ultimately, the analyst decides to generate separate networks for different patient cohorts. In this data set, there are three different types of patients: control patients who do not have HF, HF patients with preserved ejection fraction (HFpEF), and HF patients with reduced ejection fraction (HFrEF). This is particularly interesting to the analyst because there is currently a research debate about whether HFpEF and HFrEF should be considered the same or different disease. The analyst then splits the network by the patientType field. The three different patient cohorts are shown with anchored time windows in Figure 10.
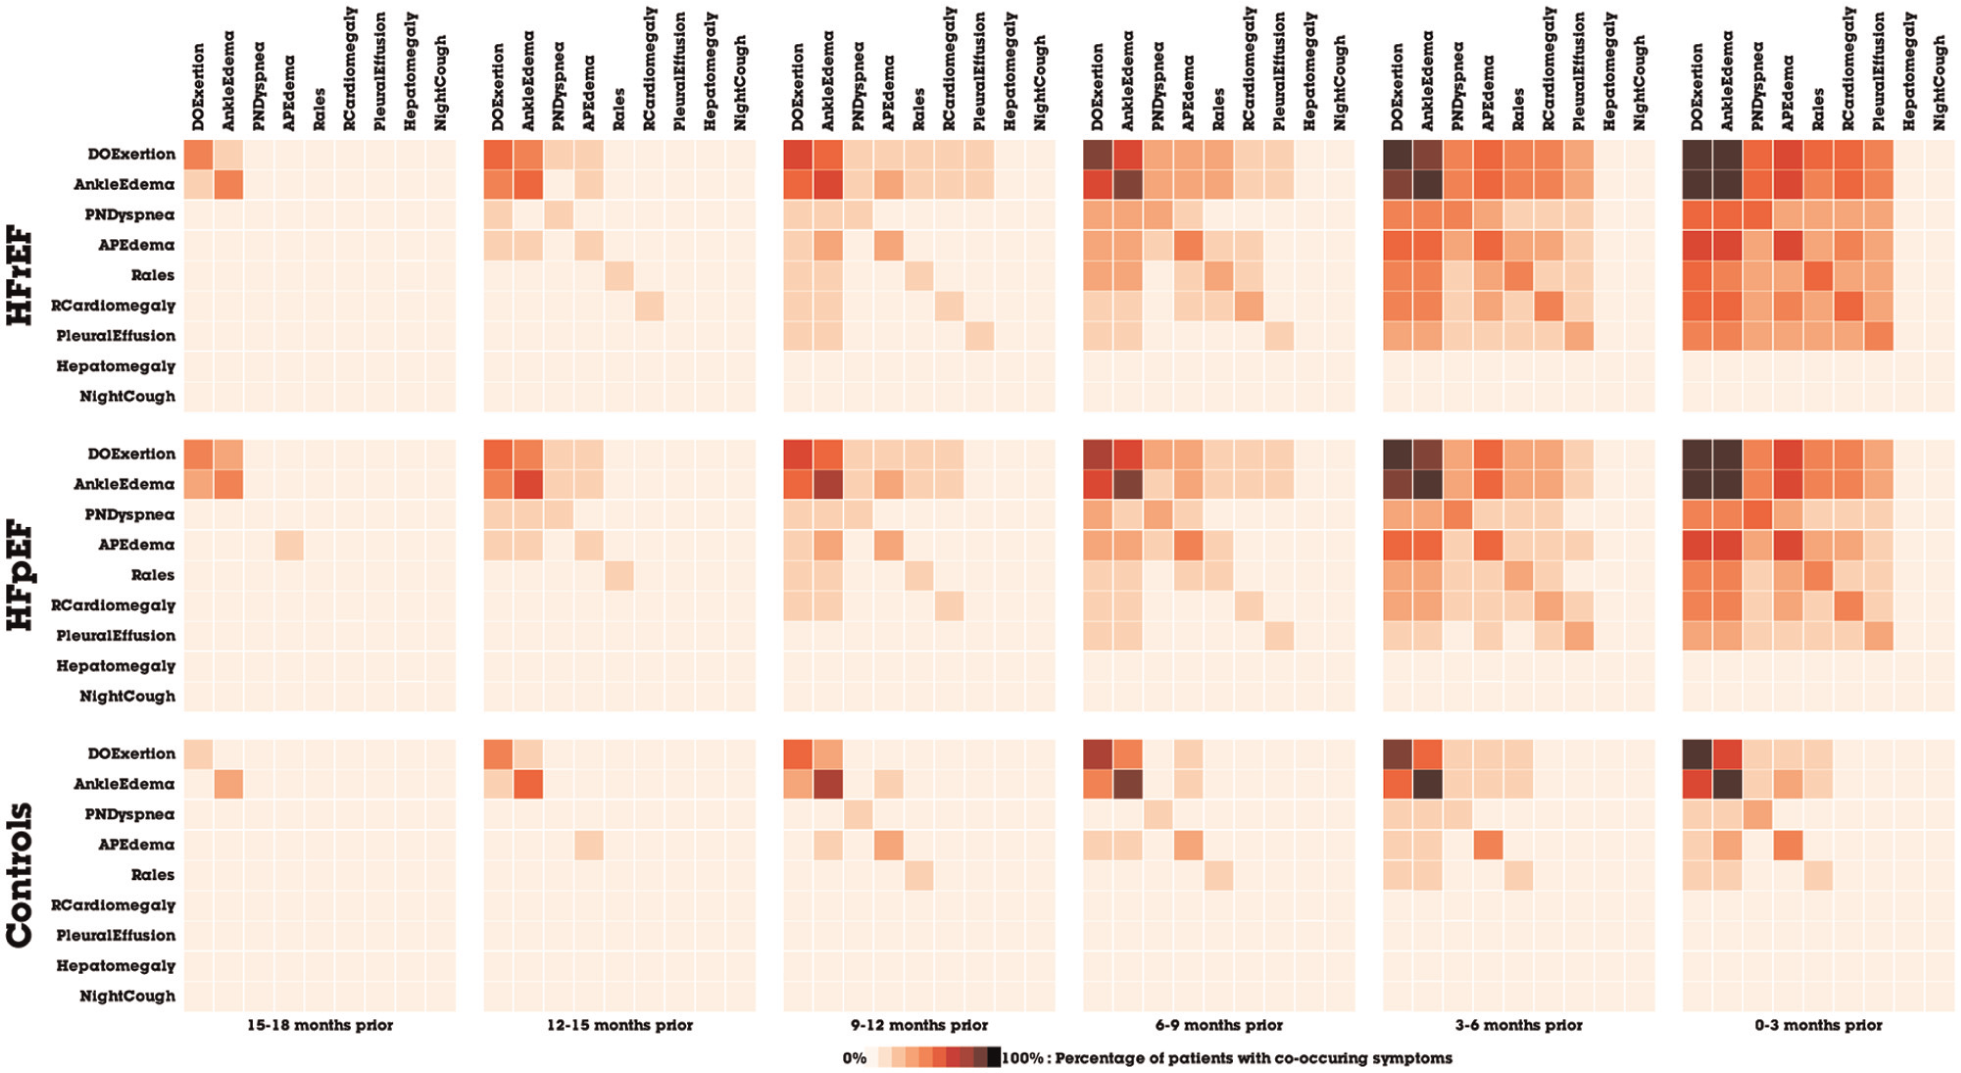
Matrices of co-occurring symptoms, split by an anchored time window and patient cohort.
Upon analyzing the networks generated using Orion, four medical experts confirmed novel temporal patterns of the progression of heart disease. They found that Orion rapidly enabled data exploration in ways that previously were prohibitively difficult; prior attempts required writing custom network modeling code for each new hypothesis. In fact, Orion’s provided features (e.g. splitting) sparked some of the research questions that were explored. The experts are optimistic that such network analyses can eventually help clinicians make earlier diagnoses, due to the large variability in diagnoses among patients. The ability to quickly compare and contrast different patient networks also provided novel evidence for the HFpEF and HFrEF debate, as a similar temporal pattern is observed in both cohorts, which suggests that despite the pathophysiological differences, both HF types seem to develop the same co-occurrence patterns. The results of this analysis have led to a publication in a medical informatics conference, 36 as well as a pending publication in a medical journal.
Multivariate network analysis
Inspired by the results of analyzing the symptoms network, the medical experts became curious about how symptoms interact with diagnoses, medications, and lab tests. In response, the analyst creates a co-occurrence network with the same approach described above but instead uses an enhancedEMR table, where each row corresponds to a clinical event for a specific patient (symptoms, diagnoses, medications, or lab tests). Each event has eventType and eventDescription metadata. Akin to the technique above, the analyst requests a network with event nodes as both the source and the target and selects the option to only count distinct patients when tabulating edge weights. As shown in Figure 11, the resulting network is then exported from Orion and styled using D3 37 for publication. The network was further filtered using D3 to show only the most common event co-occurrences. All nodes in the image are either diagnoses or symptoms. The other types of events (lab tests and medications) do not co-occur often enough to be present in this graph.
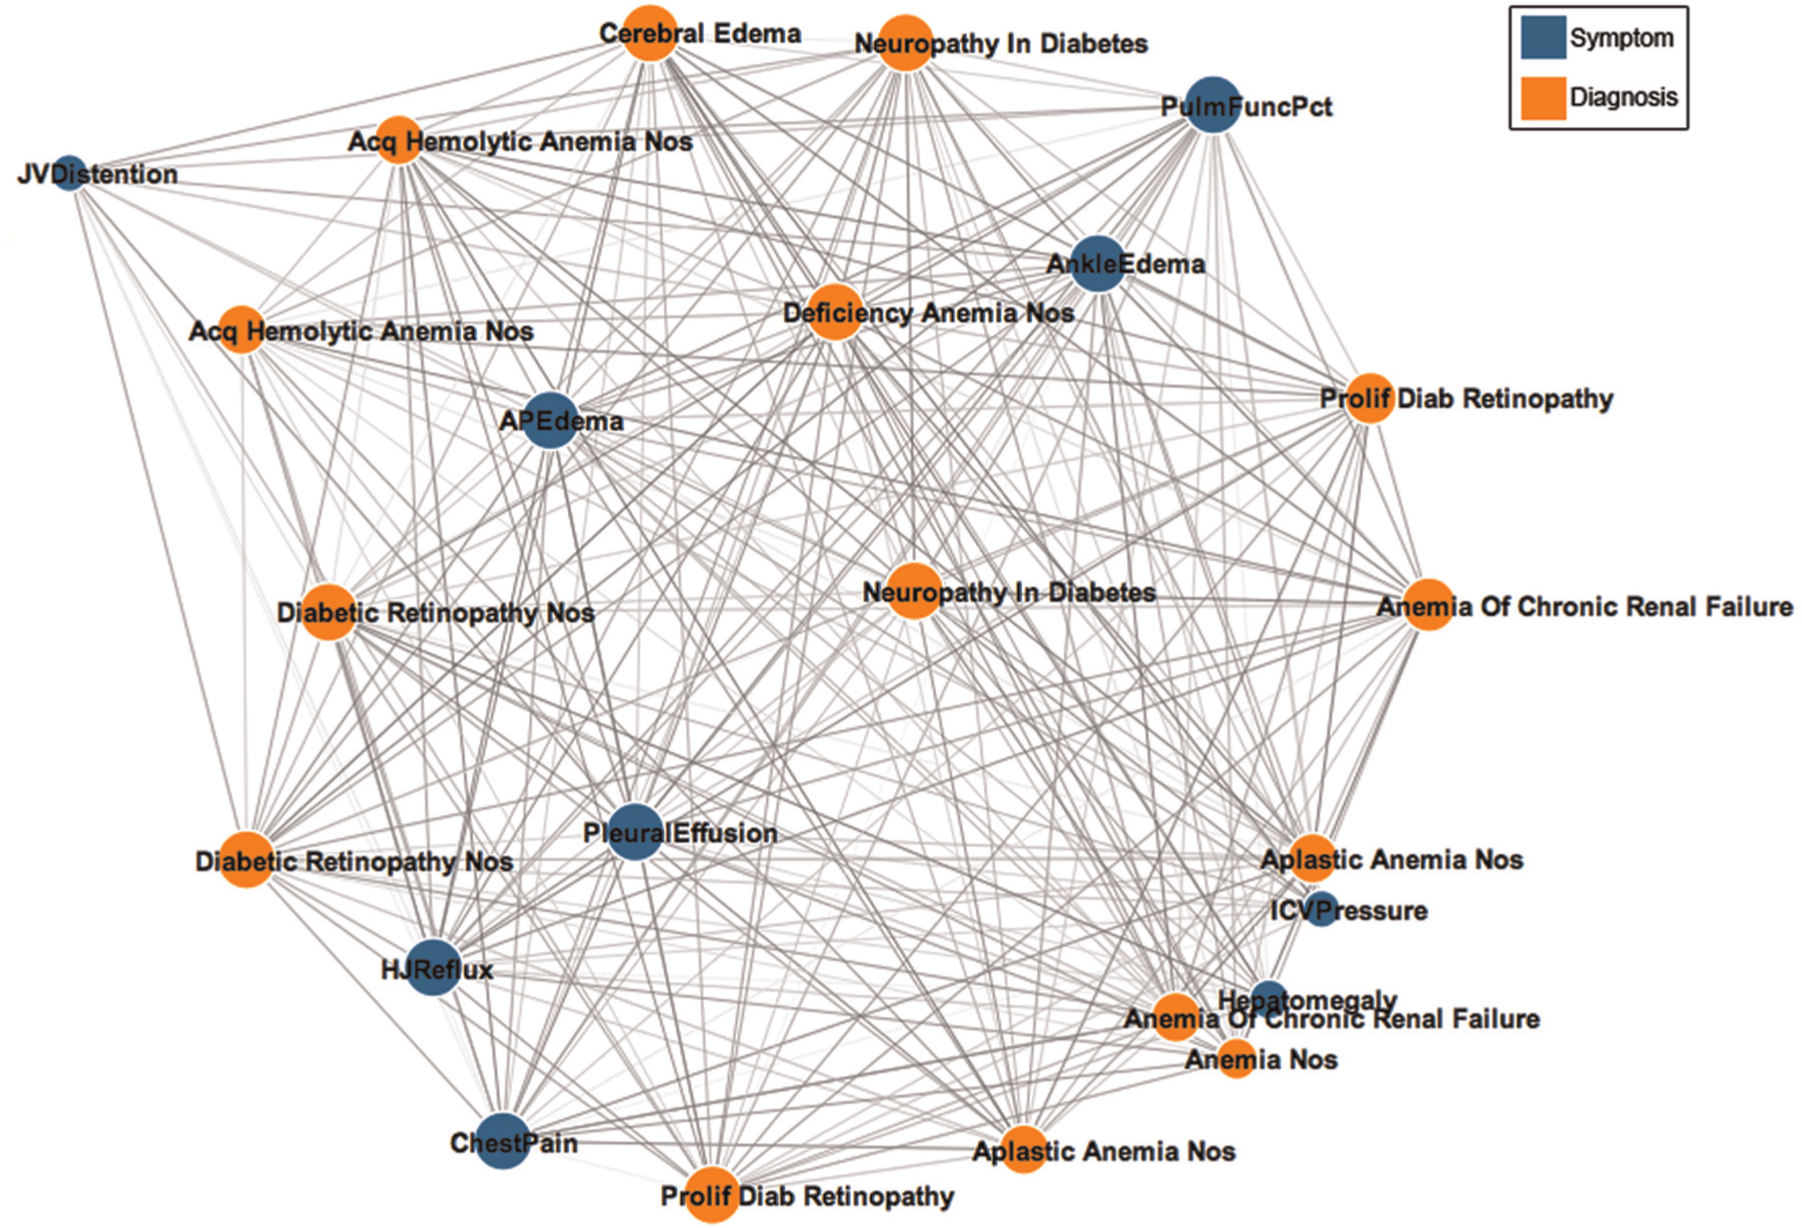
A network of the most commonly co-occurring clinical events extracted from electronic medical records of patients with heart disease.
Surprised by the domination of symptoms and diagnoses, the analyst wonders how certain types of events co-occur with each other on the previous unfiltered network. To find out, the analyst uses Orion to create an aggregate network, where nodes represent an eventType and edges are weighted with how many times an eventType co-occurs with another eventType. By requesting a network with eventType nodes as both the source and the target, Orion generates a rolled up aggregate network. In Figure 12, the network is rendered as a matrix where each cell is colored based on its edge count.
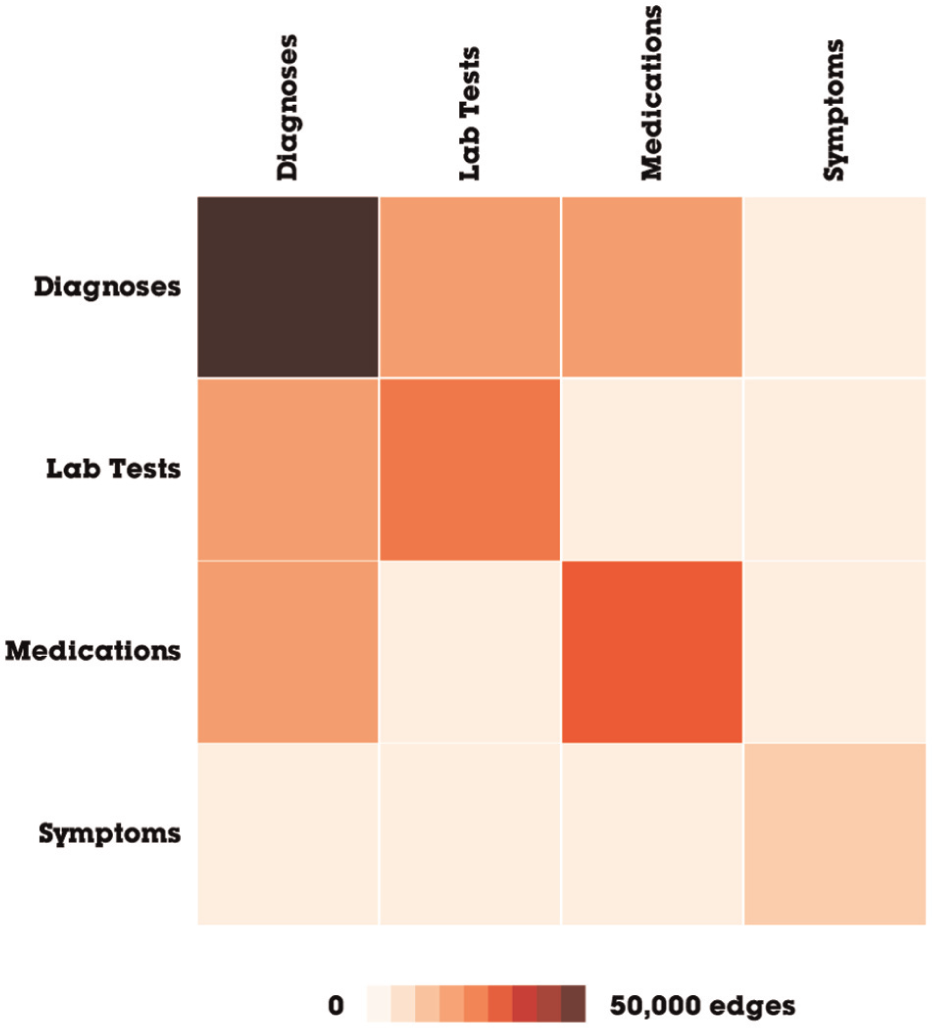
An aggregate network of clinical event types. The network was transformed using Orion’s rollup operator, then exported, and visualized with D3.
The medical experts are now in the process of making sense of the multivariate analysis in a clinical context. The rapid ability to generate networks with temporal and multivariate features shows promise of validating several features critical for disease diagnosis. The medical collaborators believe that Orion’s expressiveness may help them gain a better understanding of heart disease.
Academic production and collaboration
We are also using Orion to explore academic production and collaboration networks, for example, section “Linking graph construction” discusses data extracted from the ACM digital library. To inspect the career progress of computer scientists, we use Orion to construct a social network based on co-publication. Using Orion’s subgraph extraction facilities (Figure 13), we define social networks over increasing periods of time (e.g. first all publications up to 2000, then 2001, and so on). We then batch compute betweenness centrality scores for each extracted network. As Orion enables easy data export, we subsequently loaded the data into Tableau for further analysis, leading to the plot in Figure 14.
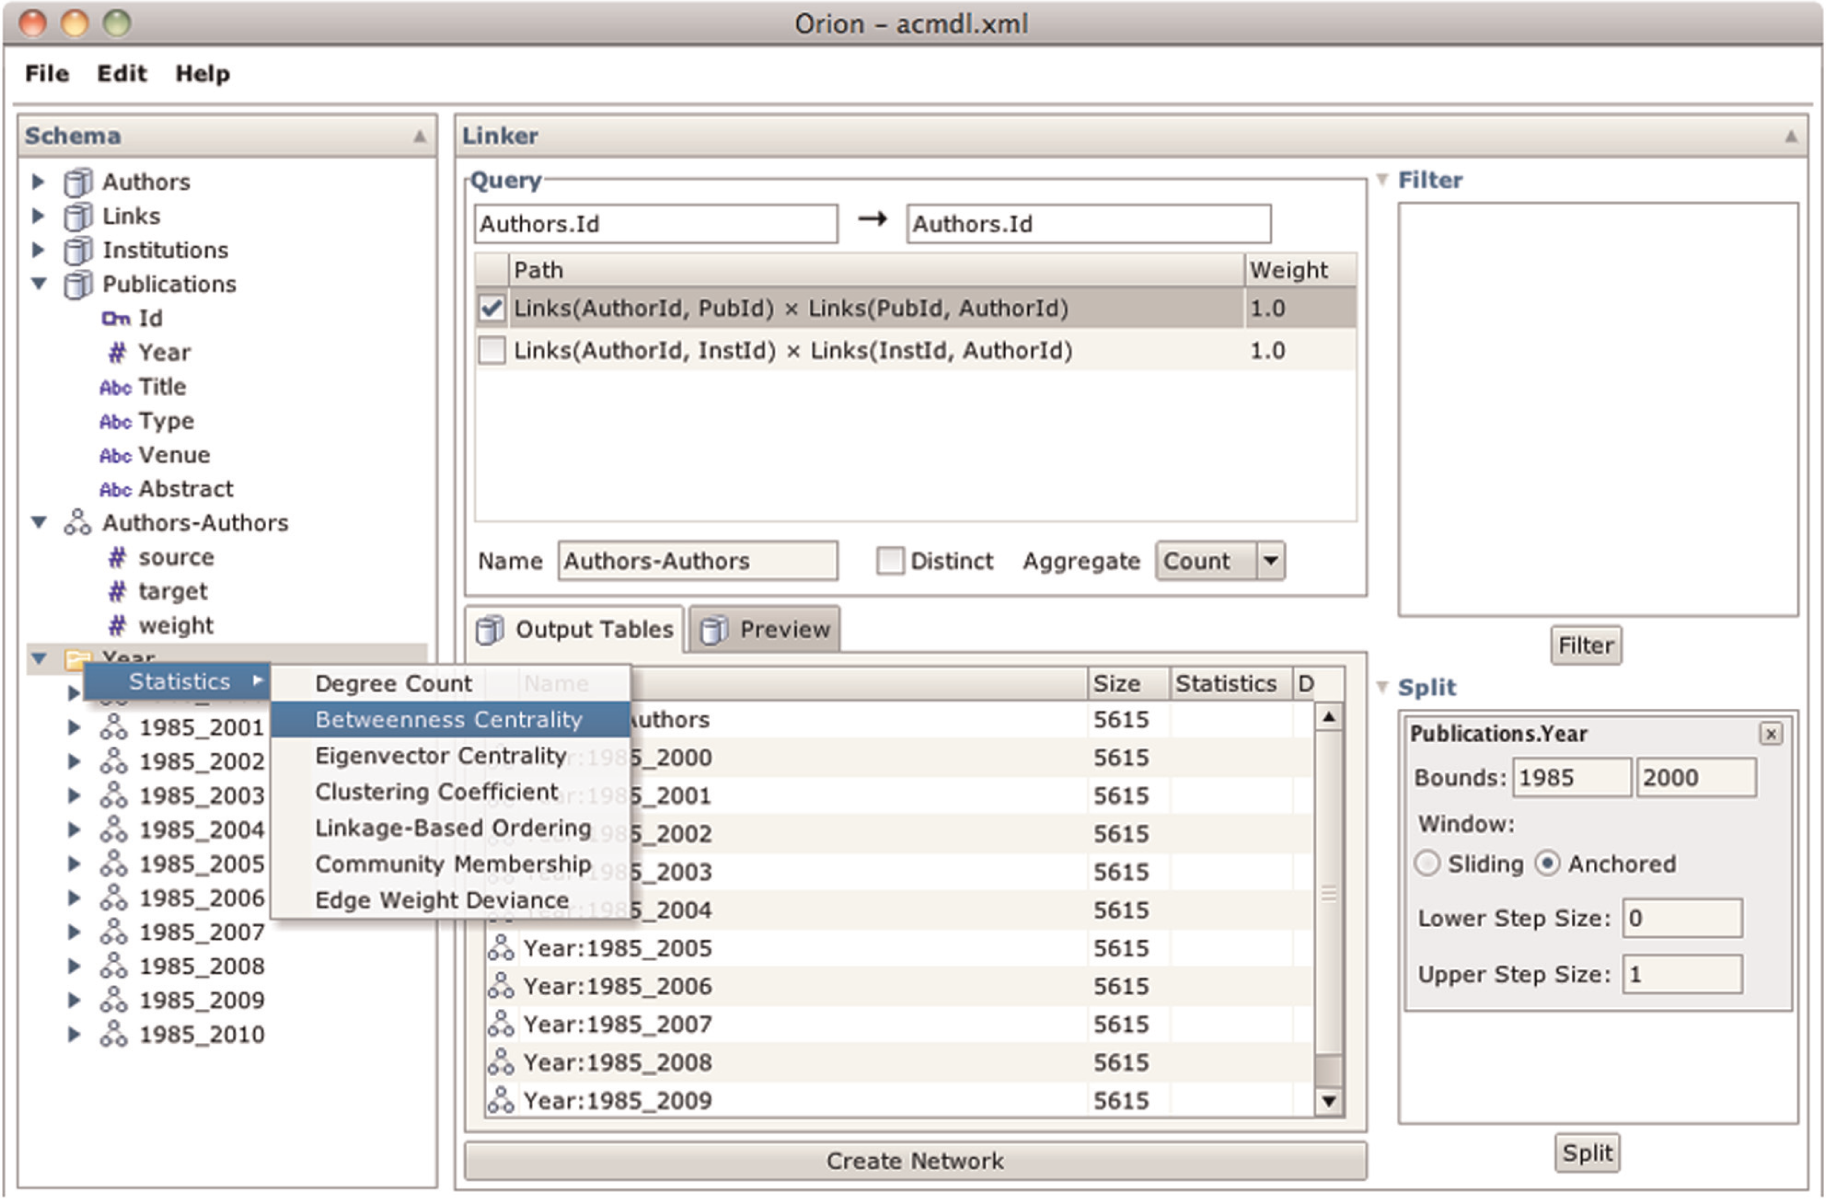
Using Orion to subdivide an ACM co-authorship network by publication date. The Split region on the lower right provides controls for defining a filtering window; the Preview pane in the center lists all resulting tables. When the networks are created, the Schema Viewer on the left groups the results to support batch statistics calculation.
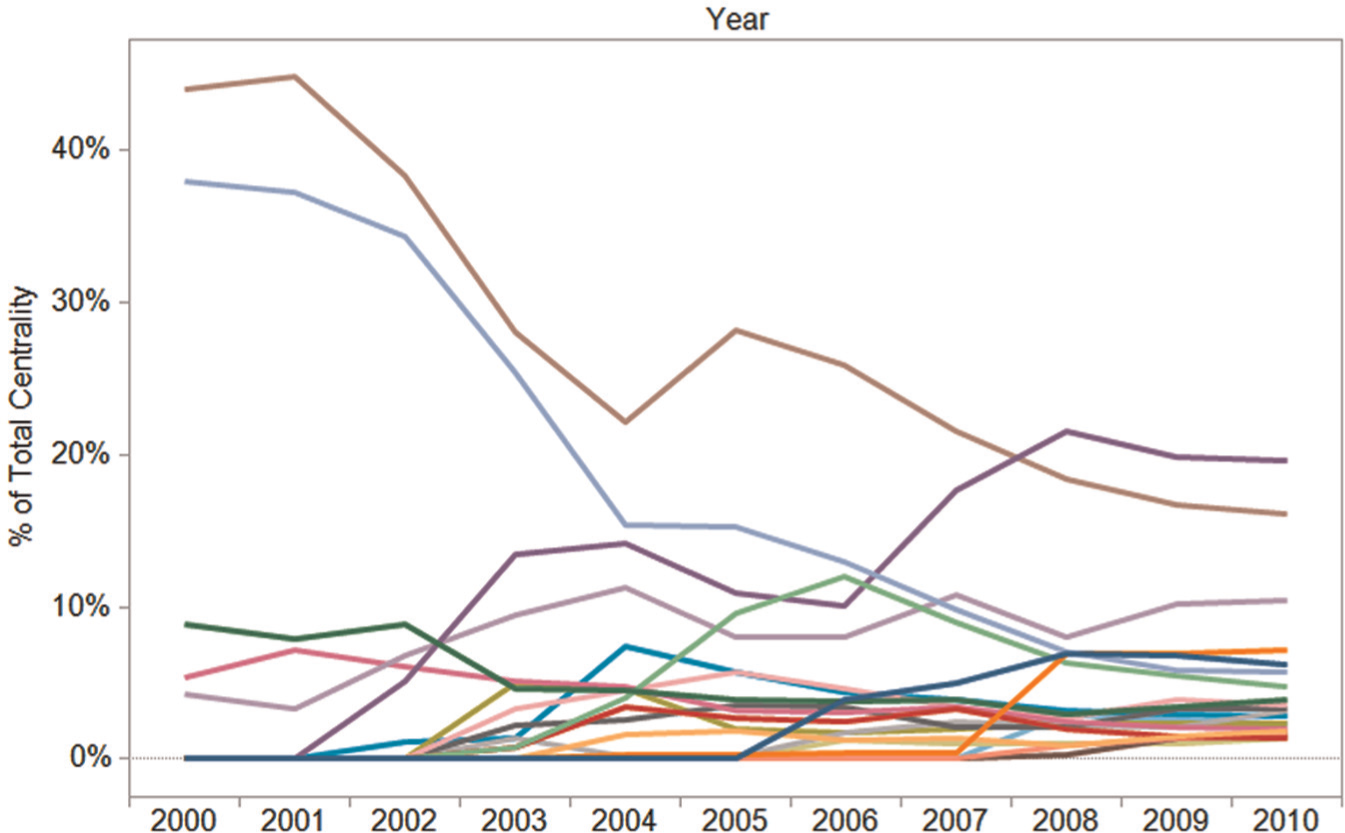
Time-sliced betweenness centrality scores for researchers in the ACM digital library. Centrality scores are normalized per year. The data were generated in Orion and then exported to Tableau.
Orion’s flexibility also enables assessment of other models. For example, we have constructed the network of all researchers who have published in the same venue (by promoting and linking on the publication venue) within the same year (by specifying a join predicate enforcing matching years).
The ACM publication data contribute to a larger analysis initiative with social scientists at the first author’s university. The scientists are studying academic collaboration and have collected multiple data sets indicating links among university faculty. In addition to publication databases, the data include department and PhD committee memberships and co-PI relations on grants. These heterogeneous edge sets can be combined and weighted in any number of ways to form a collapsed network. We are using Orion’s edge aggregation features to create and compare network models built from heterogeneous linking data.
Software development on GitHub
Finally, we have used Orion in collaboration with computer scientists studying global development patterns in open-source software. The data under investigation come from GitHub, a Web service that hosts open-source projects. Using the GitHub Web application programming interface (API), the researchers have collected over 1,000,000 commits and 500,000 explicit “follower” connections among roughly 50,000 users. In addition, each user’s location has been geocoded according to a self-reported location string and then mapped to near-by major metropolitan areas (see Heller et al. 38 for more details).
Using Orion, we can quickly generate and analyze networks extracted from these data. For example, we have constructed social networks based on commit history: a link is included between two users A and B if B makes a commit to the same repository immediately after A. We can specify this network in Orion by linking users via a table of commits. We have as input two tables: one for users and another for commits. The commit table includes the date, project name, and the user (as a foreign key). First, we promote the project (repository) name to its own table and then link users according to a shared repository. We limit links to temporally adjacent commits by first applying a rank operation based on the commit date and then adding a join predicate that ensures that only adjacent ranks are included in the resulting network.
We can also construct networks of “who follows whom” by linking users using a table of extracted follower relations. By requesting the user location attribute as a node type (rather than the user id), we construct an aggregated graph among major cities, with edge weights indicating the number of connections between users in those cities. We can then apply edge weight asymmetry and deviance statistics to examine differences among various locales. Figure 15 shows selected matrix views from this analysis (originally published in Heller et al. 38 ). For example, in Figure 15(c), we see that Paris and Tokyo each have many fewer incoming “followed” links than would be expected if links were assigned randomly and that San Francisco consistently receives a surplus of “followed” links. While these particular images have been stylized for publication using Protovis, 39 the underlying analysis can be performed completely within Orion.
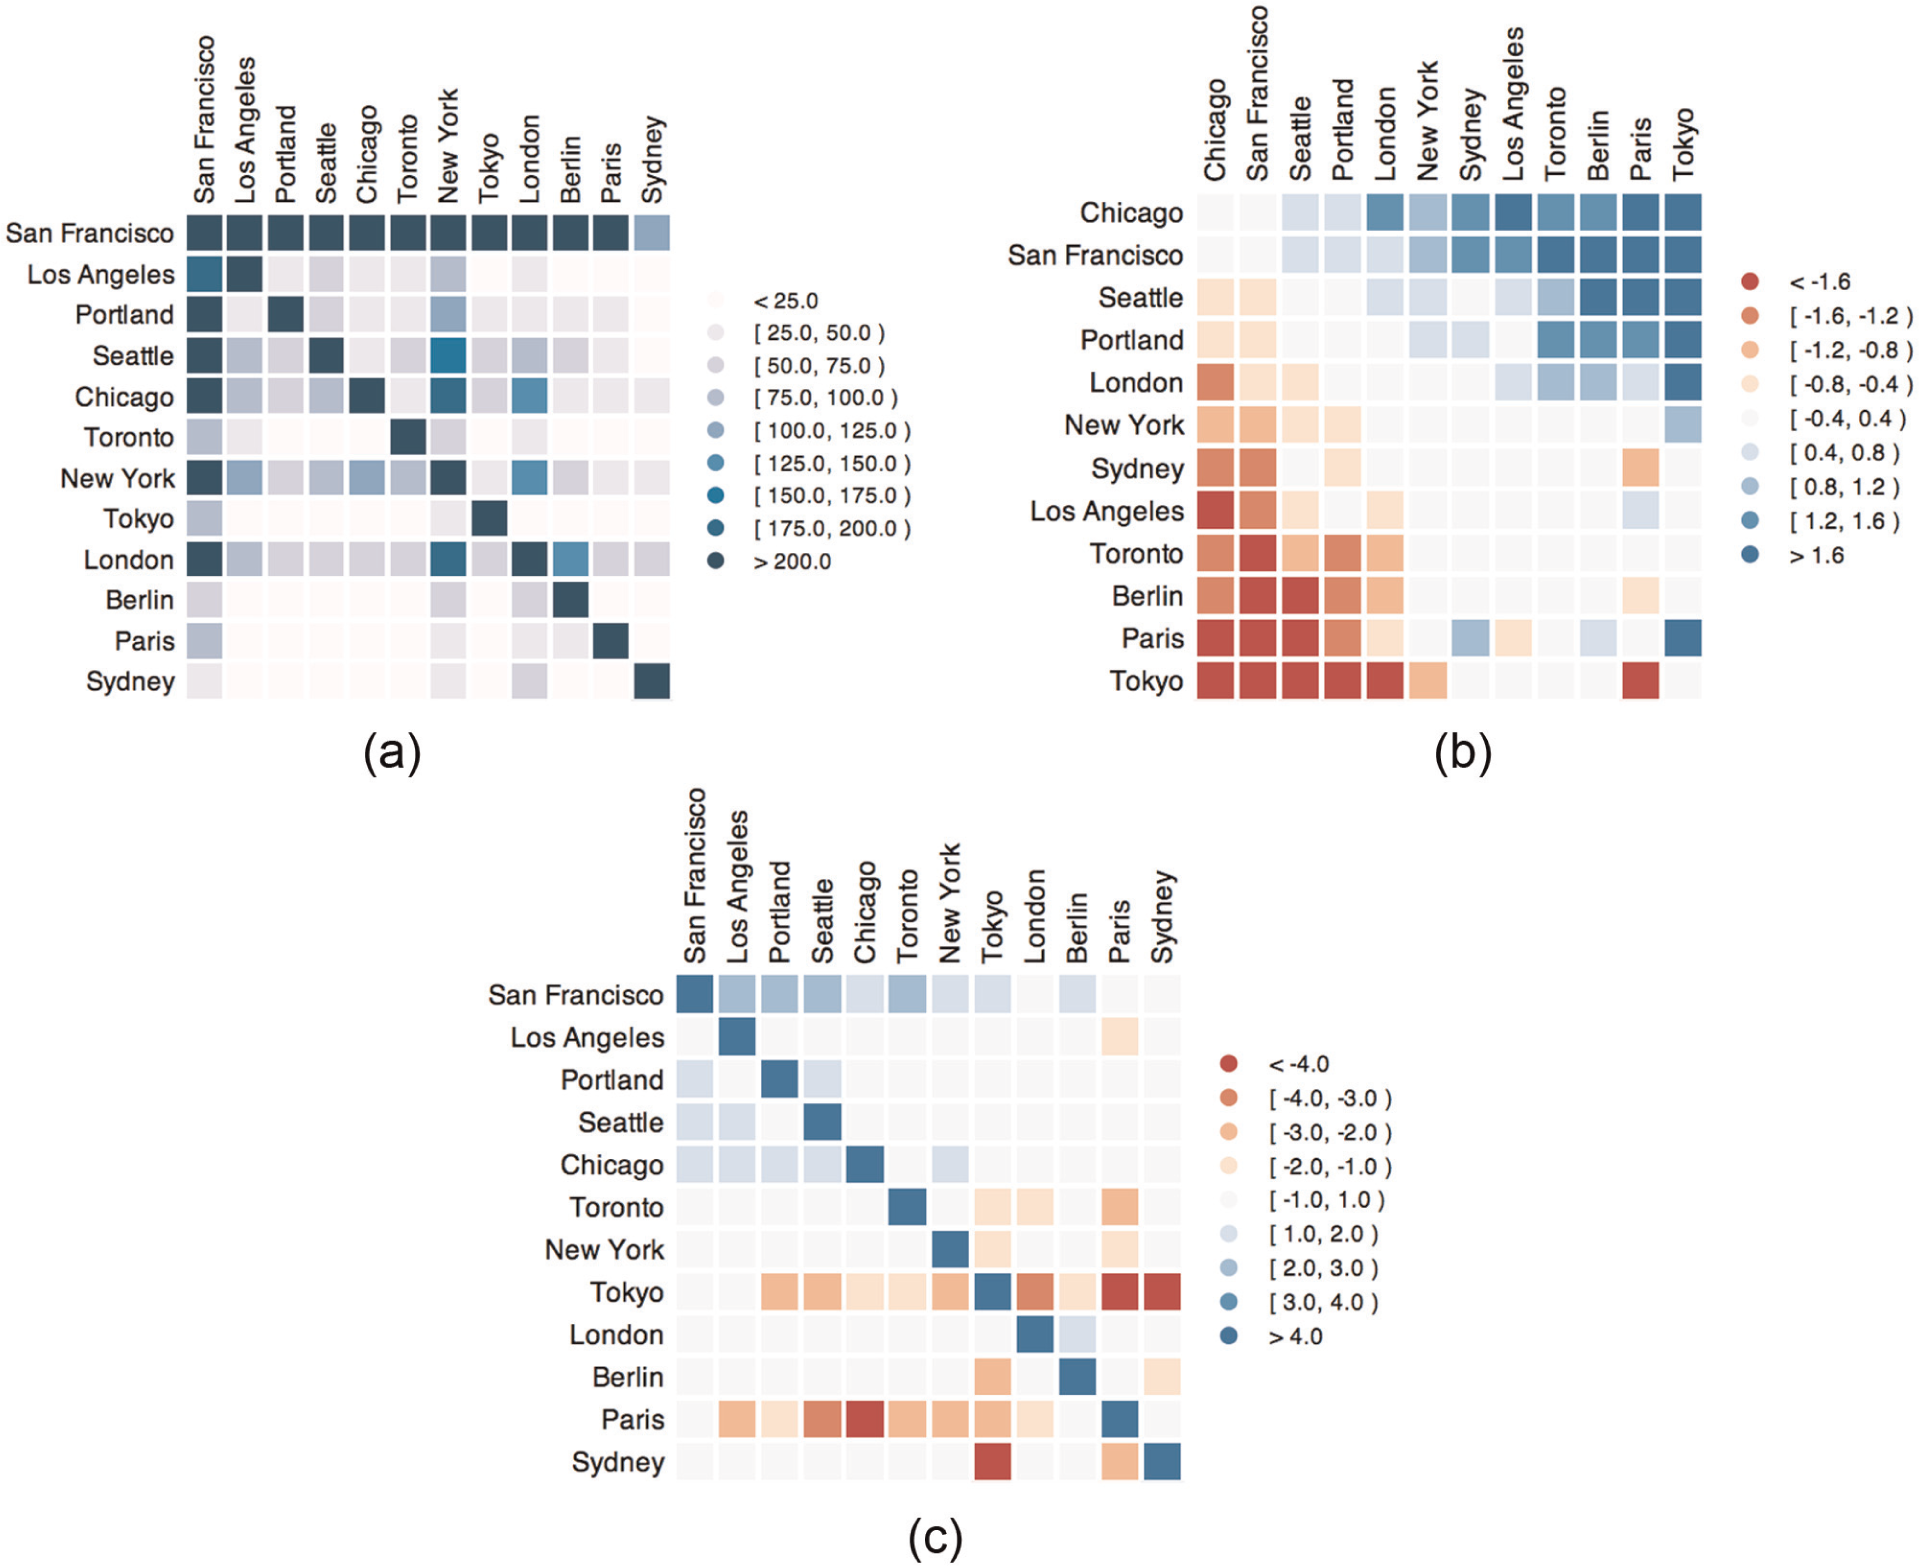
Matrix diagrams resulting from an Orion analysis of GitHub, a hosting service for open-source software. (a) Raw counts of follower links between cities, sorted by geographic proximity (column nodes “follow” row nodes on GitHub). (b) Follower links colored and sorted by asymmetry. (c) Followed links colored by deviance from expected value and sorted geographically.
Conclusion and future work
This article introduces Orion, a system for interactive modeling, transformation, and visualization of network data. By providing a unified model, workflow language, and graphical UI for iterative network manipulation, the construction and comparison of networks empower analysts to be more exploratory and flexible in their analysis. Through case studies involving online health communities, academic collaboration networks, and global software development, we demonstrate how Orion supports the visual analysis of multidimensional heterogeneous networks.
While our case studies illustrate how Orion can be applied to real-world analysis tasks, each study was conducted in the context of a collaboration between the analysts and ourselves. A necessary next step is to evaluate how analysts use Orion without external assistance. User studies with representative tasks and participants would certainly help surface usability issues and inform iterative design. However, we believe the most important test will come from analysts independently applying Orion in their own work.
As analysts gain the flexibility to create new models and transformations of network data with Orion, a critical need arises for better methods to preview and compare the constructed networks. While Orion provides capabilities to support these tasks, we believe that providing even more sophisticated visual and statistical techniques to summarize the similarities, differences, trends, and outliers of the resulting networks is an area ripe for future research. Additionally, while Orion provides great power for analysts to model networks that match their hypotheses, the vast number of possibilities to construct a network may seem daunting. An interactive visual representation of Orion’s linking graph may assist users in understanding and specifying network models. Future work might also provide users with proactive automatic suggestions to help uncover network models with interesting and meaningful patterns.
Footnotes
Appendix 1
Acknowledgements
The authors thank Diana MacLean, Sanjay Kairam, Brandon Heller, Eli Marschner, Jimeng Sun and MedHelp for sharing data and thank the anonymous reviewers for their suggestions.
Funding
Jeffrey Heer was supported by National Science Foundation (NSF) Grant CCF-0964173 and The Boeing Company.