
Abstract
In this article, we are reporting the findings of a usability study of opinion mining systems’ visualizations. The objectives of this study are to first to rank the visualizations of the opinion mining systems and second to identify important visualization metrics. A questionnaire survey was designed to ask users their level of agreement or disagreement about the 11 selected visualizations against a set of information visualization metrics on a Likert scale. The data were collected by conducting seminars and using a web-based online questionnaire (N = 146). The collected data were analyzed using descriptive statistics and an independent sample t-test to rank the visualizations and investigate differences between perceptions of the two groups of respondents (the participants of the seminars and the online questionnaire), respectively. The results revealed that simple, eye pleasing, easy to understand, user-friendly visualizations with less pre-knowledge required rated higher than others. It is concluded that the participants of the online questionnaire mostly required more pre-knowledge to comprehend the visualizations as compared to the participants of the seminars. The important information visualization metrics are eye pleasing, easy to understand, user-friendly, informative design, usefulness, and representation style. The results of this study could aid in the design and development of visualizations for opinion mining systems.
Keywords
Introduction
Opinion mining processes a set of search results for a given item, generates a list of product features, and aggregates opinions about each feature. 1 The objectives of opinion mining include mining, summarizing, and visualizing people’s opinions about organizations, individuals, government, products, and services from online reviews. Mining, summarizing, and visually presenting online reviews manually are time consuming and tedious. 2 Different opinion mining systems have been proposed in the literature for this purpose, focusing on various aspects, for example, identifying and measuring opinion words.3,4 However, considerably less work has been done on finding effective ways to present these opinions to end users. 5
There is a need for the careful design of visualization techniques to present customer’s opinions with sufficient visual cues and different levels of abstraction (summarization), as this information has a significant impact on building a successful business. 2 Visualization techniques empower customers to draw meaningful conclusions by giving a purposeful representation of the data. It provides an appropriate starting point for the interactive exploration of attractive patterns. 6 People’s opinions as free text present many challenges for visual analysis due to heterogeneity, voluminosity, and higher dimensionality. The fundamental challenge is to present complex multidimensional thematic space in easy to understand ways. 7 It is also difficult to provide integrated views of data with side-by-side visual comparisons between the opinions of different customers’ groups. 2 Another noteworthy challenge is to present information in a way that is easy to understand at a glance, even without particular training. 8
Different kinds of visualization techniques were applied to present peoples’ opinions, including radial, bar chart, pie chart, and graphs. Every technique has its own level of abstraction, advantages, and disadvantages. Opinion visualizations are designed to meet the needs of data analysis experts; therefore, most of the existing opinion visualization techniques did not consider novice end users. Usability issues are very critical for information visualization. 9
Better usability of these visualization techniques is required when used by customers. 10 Each technique requires a study in order to determine its usability and usefulness. There is also a need to consider users’ recommendations while designing visualizations of opinion mining systems which can only be possible when users evaluate the existing techniques. To the best of our knowledge, no prior study was conducted to evaluate opinion visualization techniques for users’ opinions.
This article presents the evaluation of innovative visualizations of some of the existing opinion mining systems. To be specific, this study aims (1) to rank the visualizations of the opinion mining systems, (2) to investigate differences between perceptions of the two groups of the respondents (the participants of the seminars and the online questionnaire), and (3) to identify important visualization metrics.
The rest of this article is organized as follows: section “Background study” discusses the noteworthy visualizations of existing opinion mining systems. This is then followed by section “Usability,” which presents existing work on usability studies. Section “Research methodology” discusses the research methodology used in this study. Section “Results and discussion” presents the results and discussion, and finally, section “Conclusion” concludes this article.
Background study
A systematic literature review process comprising searching and screening steps was used in the study. Pertinent research papers were searched from different digital libraries, including the ACM Digital Library, IEEE Xplore, ScienceDirect, Scopus, Emerald, SpringerLink, CiteSeerX, Web of Science, Google Scholar, and Google. The keywords used were “opinion mining,” “sentiment analysis,” “visual opinion mining,” “opinion mining system,” “opinion mining on online reviews,” “opinion mining on web,” “opinion extraction,” and “sentiment classification.” More than 50 relevant papers were gathered in the search step. Three levels of screening were employed using three criteria. In the first level screening, 30 papers were selected based on the research focus, that is, opinion mining (first criterion). At the second level, 16 papers that discussed opinion mining systems with visualizations were selected (second criterion). There were four main types of visualization, namely, radial, graph, hierarchical, and bar chart. Finally, 11 papers were selected based on intuitiveness, complexity, and level of abstraction for each of the visualization types (third criterion). Table 1 shows the details of the selected visualizations. These visualizations are discussed below.
Details of the selected visualizations.
Radial visualization
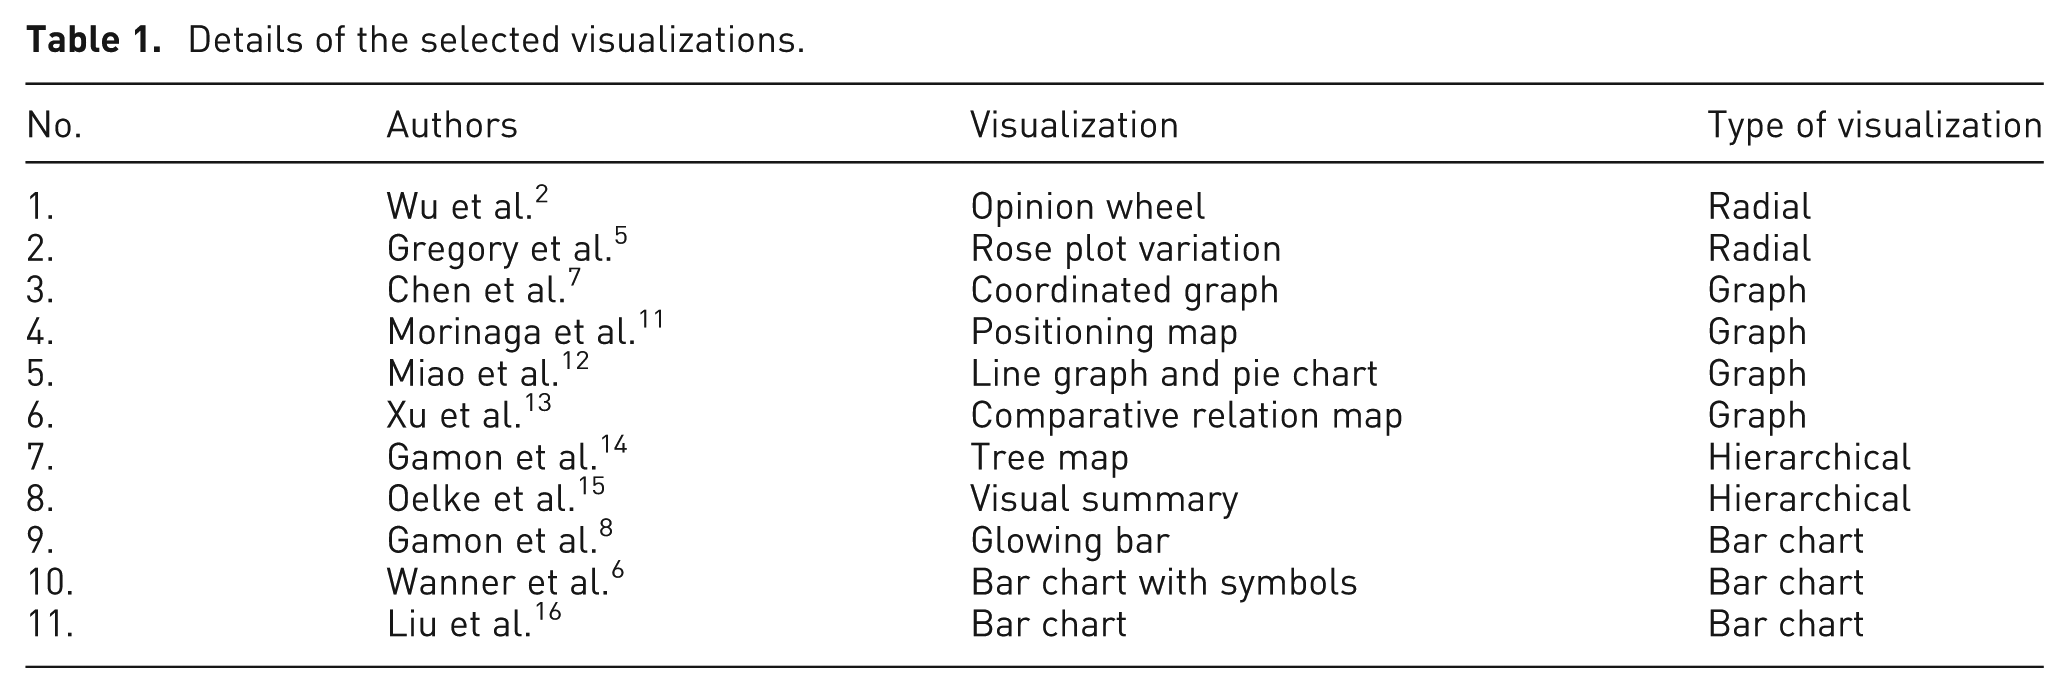
Data in radial visualizations are arranged in a circular or elliptical fashion and are an increasingly popular technique in visualization research. 17 Opinion wheel 2 and rose plot 5 utilize radial visualization in opinion mining. The opinion wheel is a combination of positioning map inside an opinion triangle, which is bounded by an opinion ring (radial visualization) as shown in Figure 1. It provides an integrated view of multiple dimensions such as temporal, demographics, and spatial information for the hotel customers’ feedback data.
Opinion wheel shows customer opinion according to age. 2
The opinion triangle, which is bound by the opinion ring, is used to present customers’ opinions. The vertices of the triangle represent negative (N), positive (P), and uncertainty (U) opinions. Each point inside the triangle represents a customer’s opinion, and its position determines the semantic orientation of the opinion. For example, a point closer to the positive vertex represents a positive opinion. The opinion ring consists of colored histograms of different data dimensions to present categorical information. The size and color of the histograms encode the number of customers in each age group as shown in Figure 1. The strengths of the opinion wheel include low level of abstraction and multidimensional view of data in an effective way.
A visual analytical tool was developed by employing a radial visualization to explore the sentiment contents in a large collection of documents. 5 The authors modified the rose plot (originally used by Florence Nightingale in 1858 18 ). The first modification was the use of colors with different shades (light and dark) to represent emotion categories, whereas the second modification introduced the unit circle in the rose plot to display the mean and deviation values of opinions by drawing the appropriate rose plots outside (larger than mean) or inside (smaller than mean).
In Gregory et al.’s study, 5 each document was assigned a score according to the eight emotion categories consisting of four concept pairs (positive–negative, pleasure–pain, cooperate–conflict, and virtue–vice). The glyph on the right-hand side shows the higher value of negative and vice emotions than the mean value. The rose plot is a powerful visualization to analyze and compare a large collection of documents with respect to emotional categories. Gregory et al. 5 used histograms to present the number of documents in each group.
Graph
The graphs adapted for visualizations in opinion mining include coordinated graph, 7 comparative relation map, 13 positioning map, 11 line graph, and pie chart. 12 Chen et al. 7 introduced a novel visualization approach for the analysis of conflicting opinions of customer reviews on the controversial bestseller novel “Da Vinci Code.” Terms (opinion words) extracted from positive and negative reviews were classified into different clusters using “TermWatch,” which is a visual interface in the IMPROVISE software. These terms were then presented using a coordinated graph (Figure 2).

Coordinated graph representing positive and negative terms. 7
The top and the bottom half of the graph present terms used in positive and negative reviews, respectively. The vertical bar thickness shows the number of terms for each month. The arcs connect months in which common terms appear and their thicknesses represent the number of common terms. The authors also used a spectrum graph to display the distribution of positive and negative reviews over time. The coordinated graph provides an effective way for the comparison of terms with respect to time.
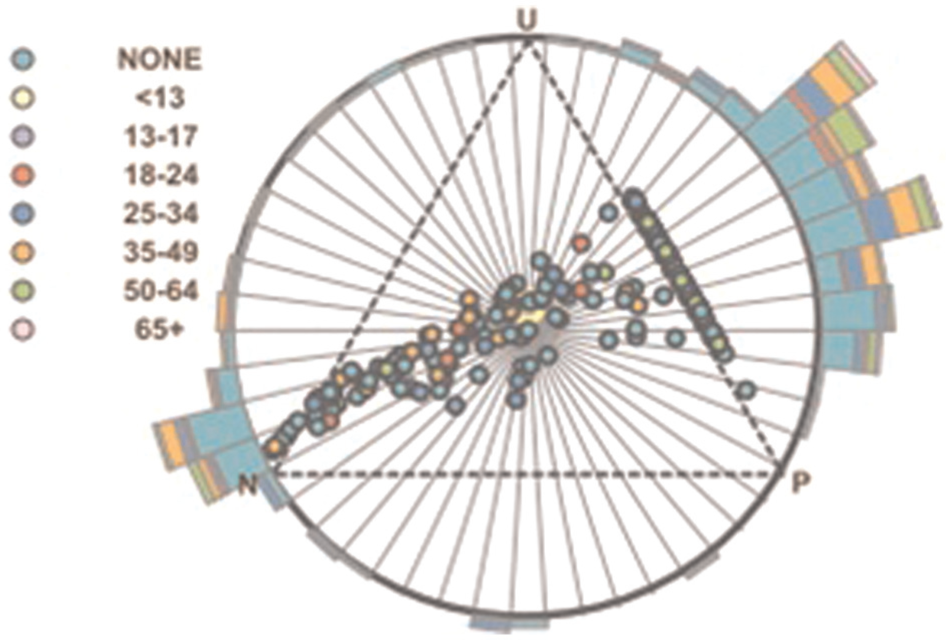
Similarly, Xu et al. 13 used graph to compare Nokia E71 with its competitors, that is, Nokia E61, Blackberry Curve, iPhone, and Blackberry Bold 9000, on different features, such as size, function, and looks (Figure 3).
Comparative relation map shows comparison between competing mobile phones. 13
The red box shows the number of favorable statements for Nokia E71, and the blue box shows the number of favorable statements for competitive products. The comparative relation map was very helpful (1) to highlight the relative strengths and weakness of products, (2) to analyze threats from competitors and enterprise risks, (3) to support decision making and risk management, and (4) to design new products and marketing strategies.
There are many other examples of the use of graphs for opinion mining visualizations that utilize positioning map, line graph, and pie charts. Morinaga et al. 11 deployed two-dimensional positioning maps for the comparison of competing cellular phones. Five cellular phones with their corresponding four characteristics (keywords) were compared and plotted on a map. Finally, Miao et al. 12 presented a visualization system “Amazing” for mining and summarizing electronic products. In this system, a line graph was deployed to present the number of positive and negative comments about a product over time, and a pie chart was used to show the proportion of positive and negative reviews.
Hierarchical visualization
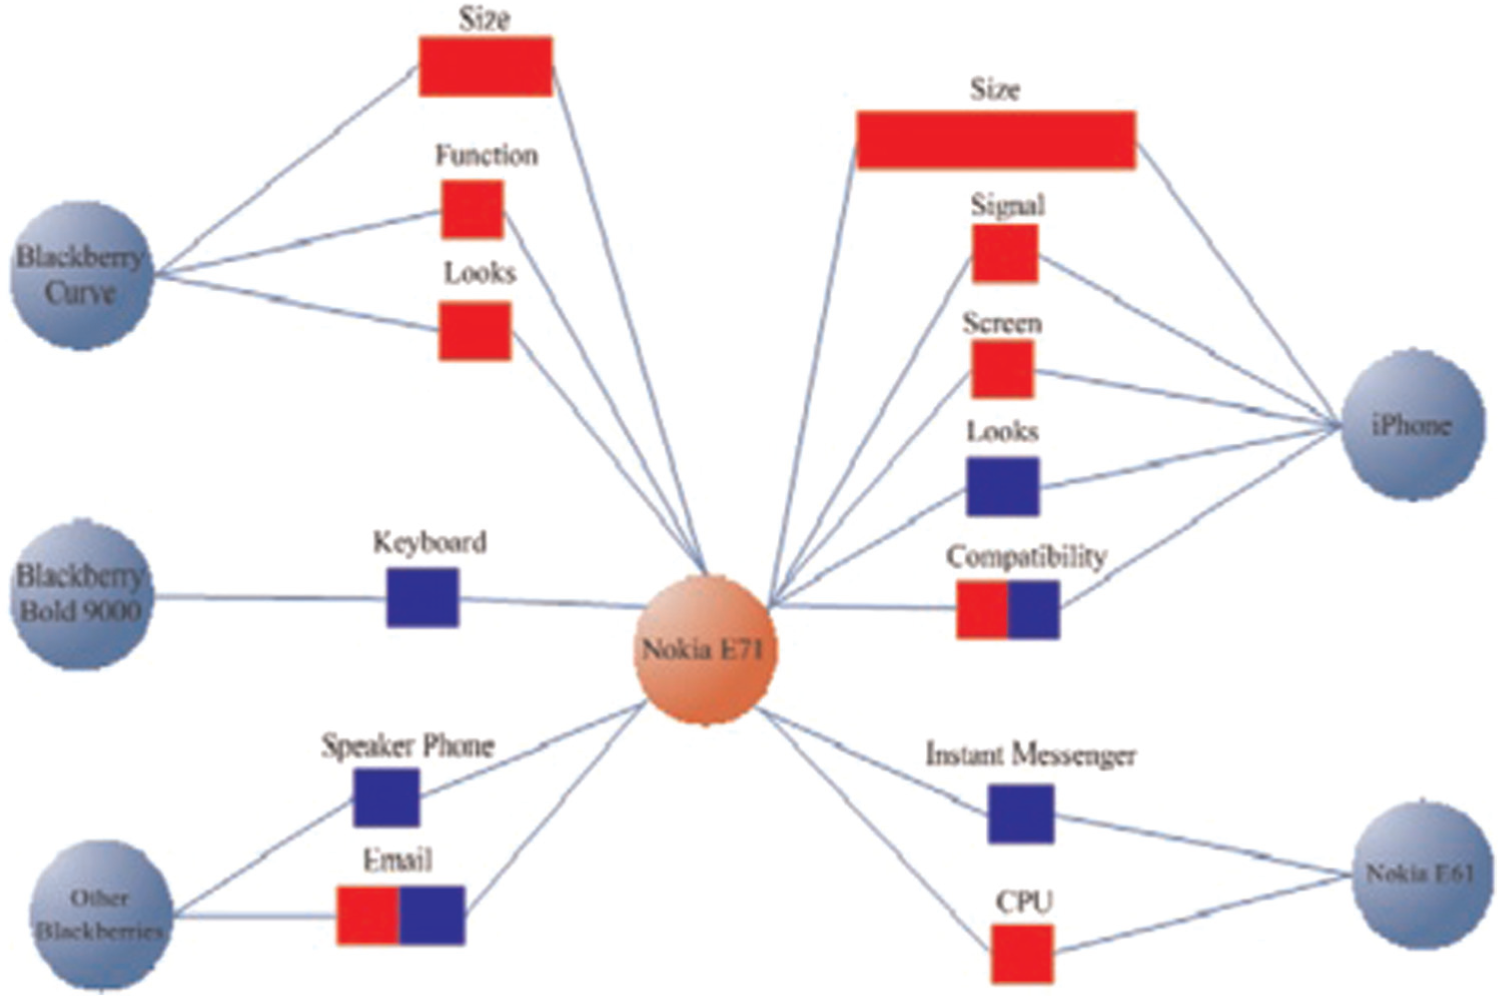
The third type of visualization technique is the hierarchical visualization. The opinion visualizations that utilized hierarchical technique include tree map 14 and visual summary report. 15 Gamon et al. 14 introduced a prototype system “Pulse,” with an intuitive visualization for mining customer reviews on cars. In this system, sentences were grouped together based on similar features, which are then displayed as boxes using a Tree Map as shown in Figure 4. The size and color of the boxes indicate the number of sentences and the average sentiment of a feature, respectively. The tree map provides users a high level of abstraction for common features, most positive and negative features, and overall sentiment associated with the features.
Tree map representing common car’s features and overall sentiment associated with the features. 14
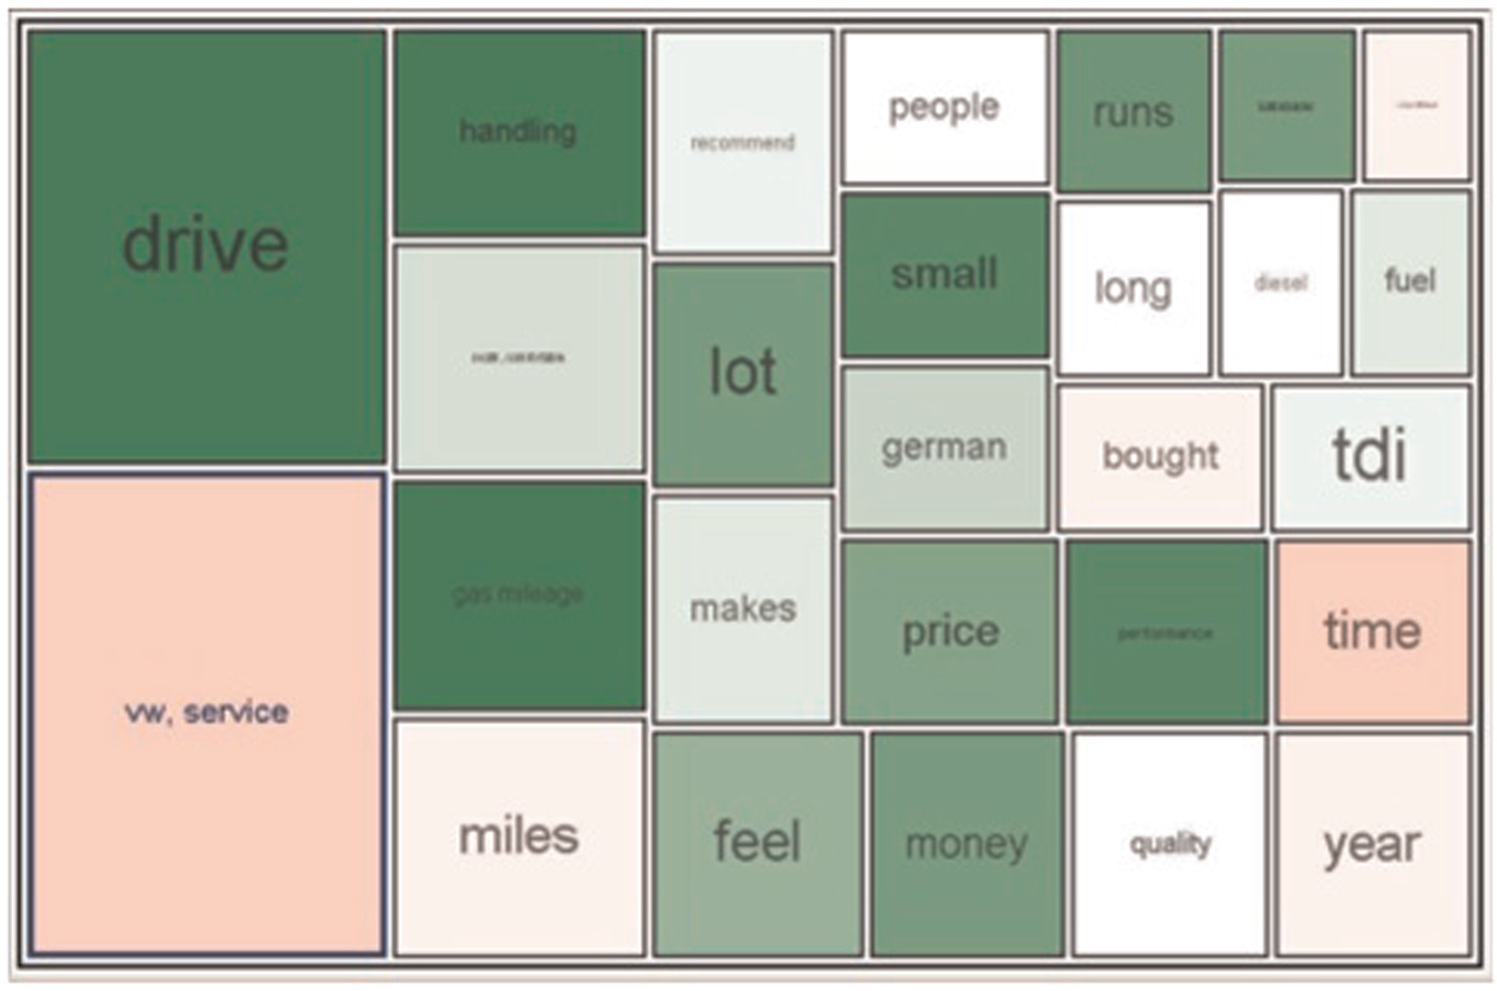
Oelke et al. 15 introduced a visual summary report for printers and book reviews. Visual summary report provides a quick analysis of printers’ reviews. It describes the frequent features of given products along with their corresponding sentiment based on a color scale. Blue and red colors with different shades were used to represent the positive and negative tendency of the sentiment of the product’s features, respectively, as shown in Figure 5. The size of the inner box represents how many people commented on a particular feature. The strength of visual summary is its scalability with respect to the number of features and products.
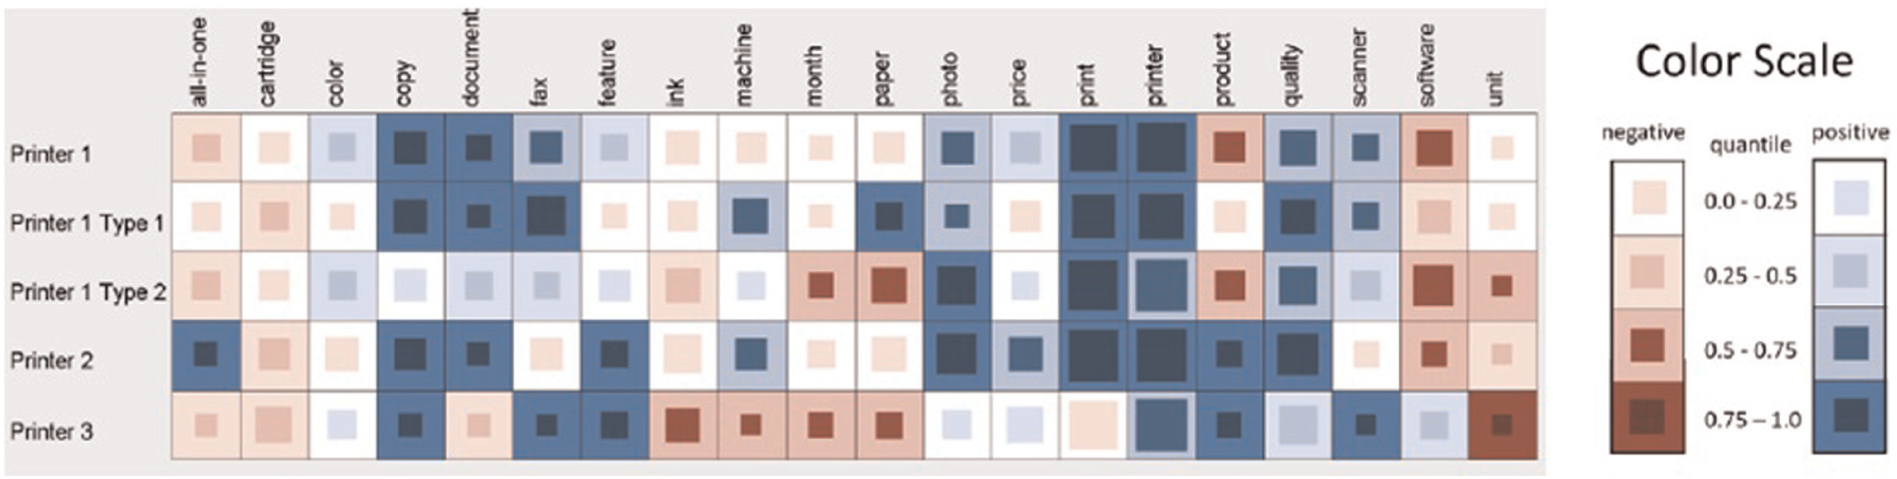
Visual summary of printers’ reviews. 15
Bar chart
The final visualization techniques involve the use of bar charts, that is, glowing bars, 8 bars with different shapes, 6 and bar chart. 16 Gamon et al. 8 presented an analytic prototype system “BLEWS” for news with glowing bars for the visualization of popularity and liberal and conservative views about news articles. Two boxes of blue and red colors with varying size on both sides of an article headline were used to depict the number of liberal and conservative references, respectively, as shown in Figure 6. The size of the boxes depends on the number of references. The order of article from top to bottom describes the popularity of the news article. Emotional charge (the degree of excitement and agitation of the author at the time of writing the text) was presented by a glow around the boxes.
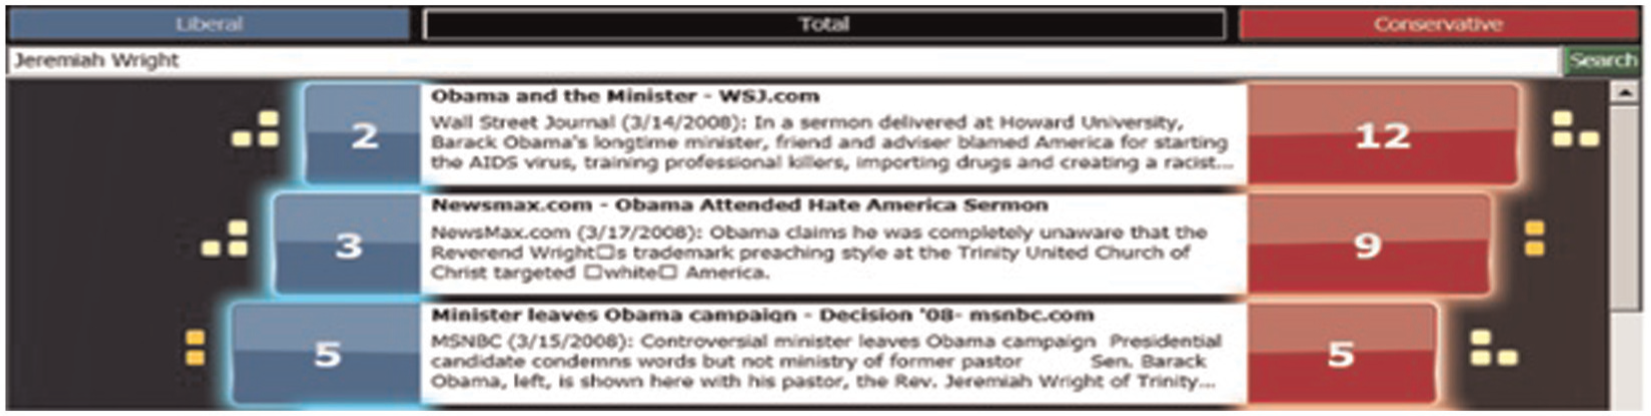
Glowing bars showing popularity and views about a news article. 8
Similarly, Wanner et al. 6 proposed an innovative visual tool for the sentiment analysis of news feeds. News articles were displayed on a daily basis; two horizontal lines represent 1 day and each colored object represents one news item as shown in Figure 7. Symbols with different colors and shapes were used to show the presence of certain keywords in the news. The sentiment score of news item was determined by its vertical position. The strengths of this visualization are zooming, filtering, details on demand, and similarity search operations that can be applied to find out interesting trends and to highlight particularities and emotional contents in the news.
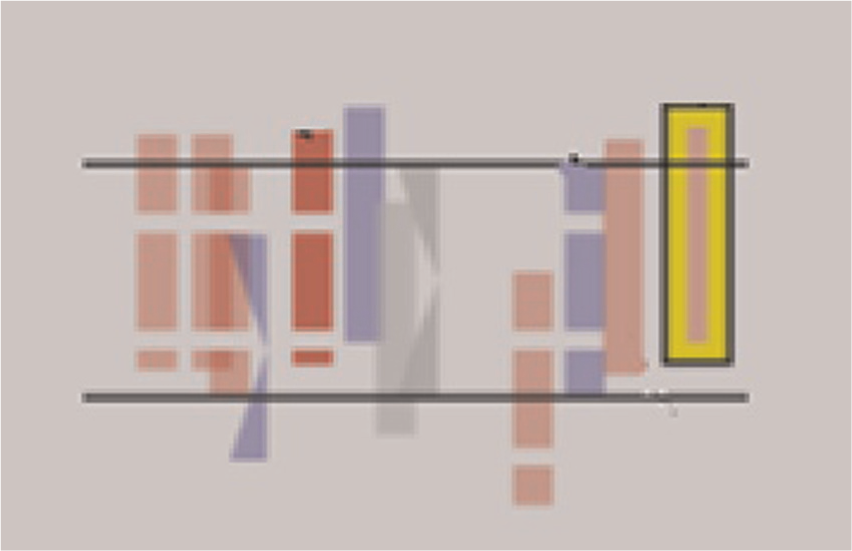
Bars with symbols depicting various keywords in a news item. 6
Finally, Liu et al. 16 developed and presented a visualization system “Opinion Observer” to compare reviews of competitive electronic products. The “Opinion Observer” highlights the strengths and weaknesses of each product by utilizing a bar graph as shown in Figure 8. The bars represent different features of given products. The size of bar above and below the x-axis represents the number of positive and negative comments about each feature. Different colors of bars were used to differentiate between given products. The strengths of this visualization are simple and easy to understand design.

Bar graph comparing prominent features of competing products. 16
Usability
In this section, we introduce usability and some of the existing work on usability of information visualization. The usability, expressiveness, and quality of visualizations are equally important to data usability in any system. 19 According to the International Organization for Standardization, usability is “the extent to which intended users of a product achieve specified goals in an effective, efficient and satisfactory manner within a specified context of use.”20,21 Usability can be examined from various aspects.22,23 Table 2 shows usability aspects defined in the literature, with the most common aspects being efficiency (time to complete tasks), effectiveness (percentage of tasks completed), and user satisfaction (how well the users liked using the system to complete these tasks). Usability can be measured by evaluating users’ experience of interacting with the system, which involves a focus on the interface. 30 Standard metrics exist today in many areas of information technology to measure performance, either of the system alone or of the combination of users and the system. For example, word error rate metric in speech recognition, precision and recall metrics in information retrieval, and efficiency, effectiveness, and user satisfaction metrics in human–computer performance are used to measure the performance of a system. 31
Usability aspects.

Zviran et al. 30 investigated the effect of user-based design and website usability on user satisfaction for commercial websites by conducting a questionnaire survey. The data were analyzed using the System Usability Scale (SUS), and results indicate that the stock trading websites have the lowest user satisfaction than online shopping and customer self-service websites. Similarly, the user interfaces of 775 news mobile websites in terms of screen space usage were analyzed by Jeong and Han. 32 The authors identified most of the screen space was wasted on advertisement. In Malaysia, the usability of International Islamic University Malaysia (IIUM) website was investigated by conducting a case study with 10 participants. 33 The participants were required to fill a checklist as a post-test questionnaire. The results showed that the interface conforms at least 70% of usability properties such as visibility of system status, user control and freedom, consistency and standards, error prevention, and aesthetic and minimalist design. Kim and Kim 34 conducted a usability study for the evaluation of “dCollection”—a single consortium for institutional digital repositories in Korea in terms of satisfaction, supportiveness, usefulness, and effectiveness. Two usability experiments (laboratory and remote test) were conducted with a focus group study. Based on the evaluation results, different ways for the improvement of usability in digital repositories were proposed, that is, improving visual appearance and clustering and displaying similar documents together.
The influence of user satisfaction on customers’ loyalty and positive word-of-mouth in e-banking was studied by Casaló et al. 35 The result of this study showed that user satisfaction on a bank website in Australia had a positive effect on customer loyalty and positive word-of-mouth. Similarly, bank users were found to be more satisfied in tag-based interfaces as compared to conventional interfaces in both online and mobile context. 36 Another study explored the impact of user interface on user satisfaction, effectiveness, and efficiency of learning Adobe Flash CS4 software, and results revealed that user satisfaction of learning this software was better on graphical user interface instead of command line. 37 Riel et al. 38 studied the effect of customer satisfaction on e-loyalty and found e-loyalty to be strongly influenced by customer satisfaction. Similarly, speed, navigation, reliability, deliverability, and quality of results of a search engine were found to influence users’ satisfaction by Dudek et al. 39
Visualizations are effective only if users can interpret the underlying information. Additionally, the interaction mechanism of a visualization tool, that is used to manipulate the data and produce different views, contributes toward the effectiveness of visualizations. Therefore, in addition to the typical usability measures of effectiveness, efficiency, and user satisfaction, a number of evaluation areas and metrics specifically geared toward information visualization have been proposed in literature, including situation awareness, interaction, creativity, utility, cognitive, and perception31,40,41 as shown in Table 3.
State-of-the-art information visualization evaluation areas and metrics.
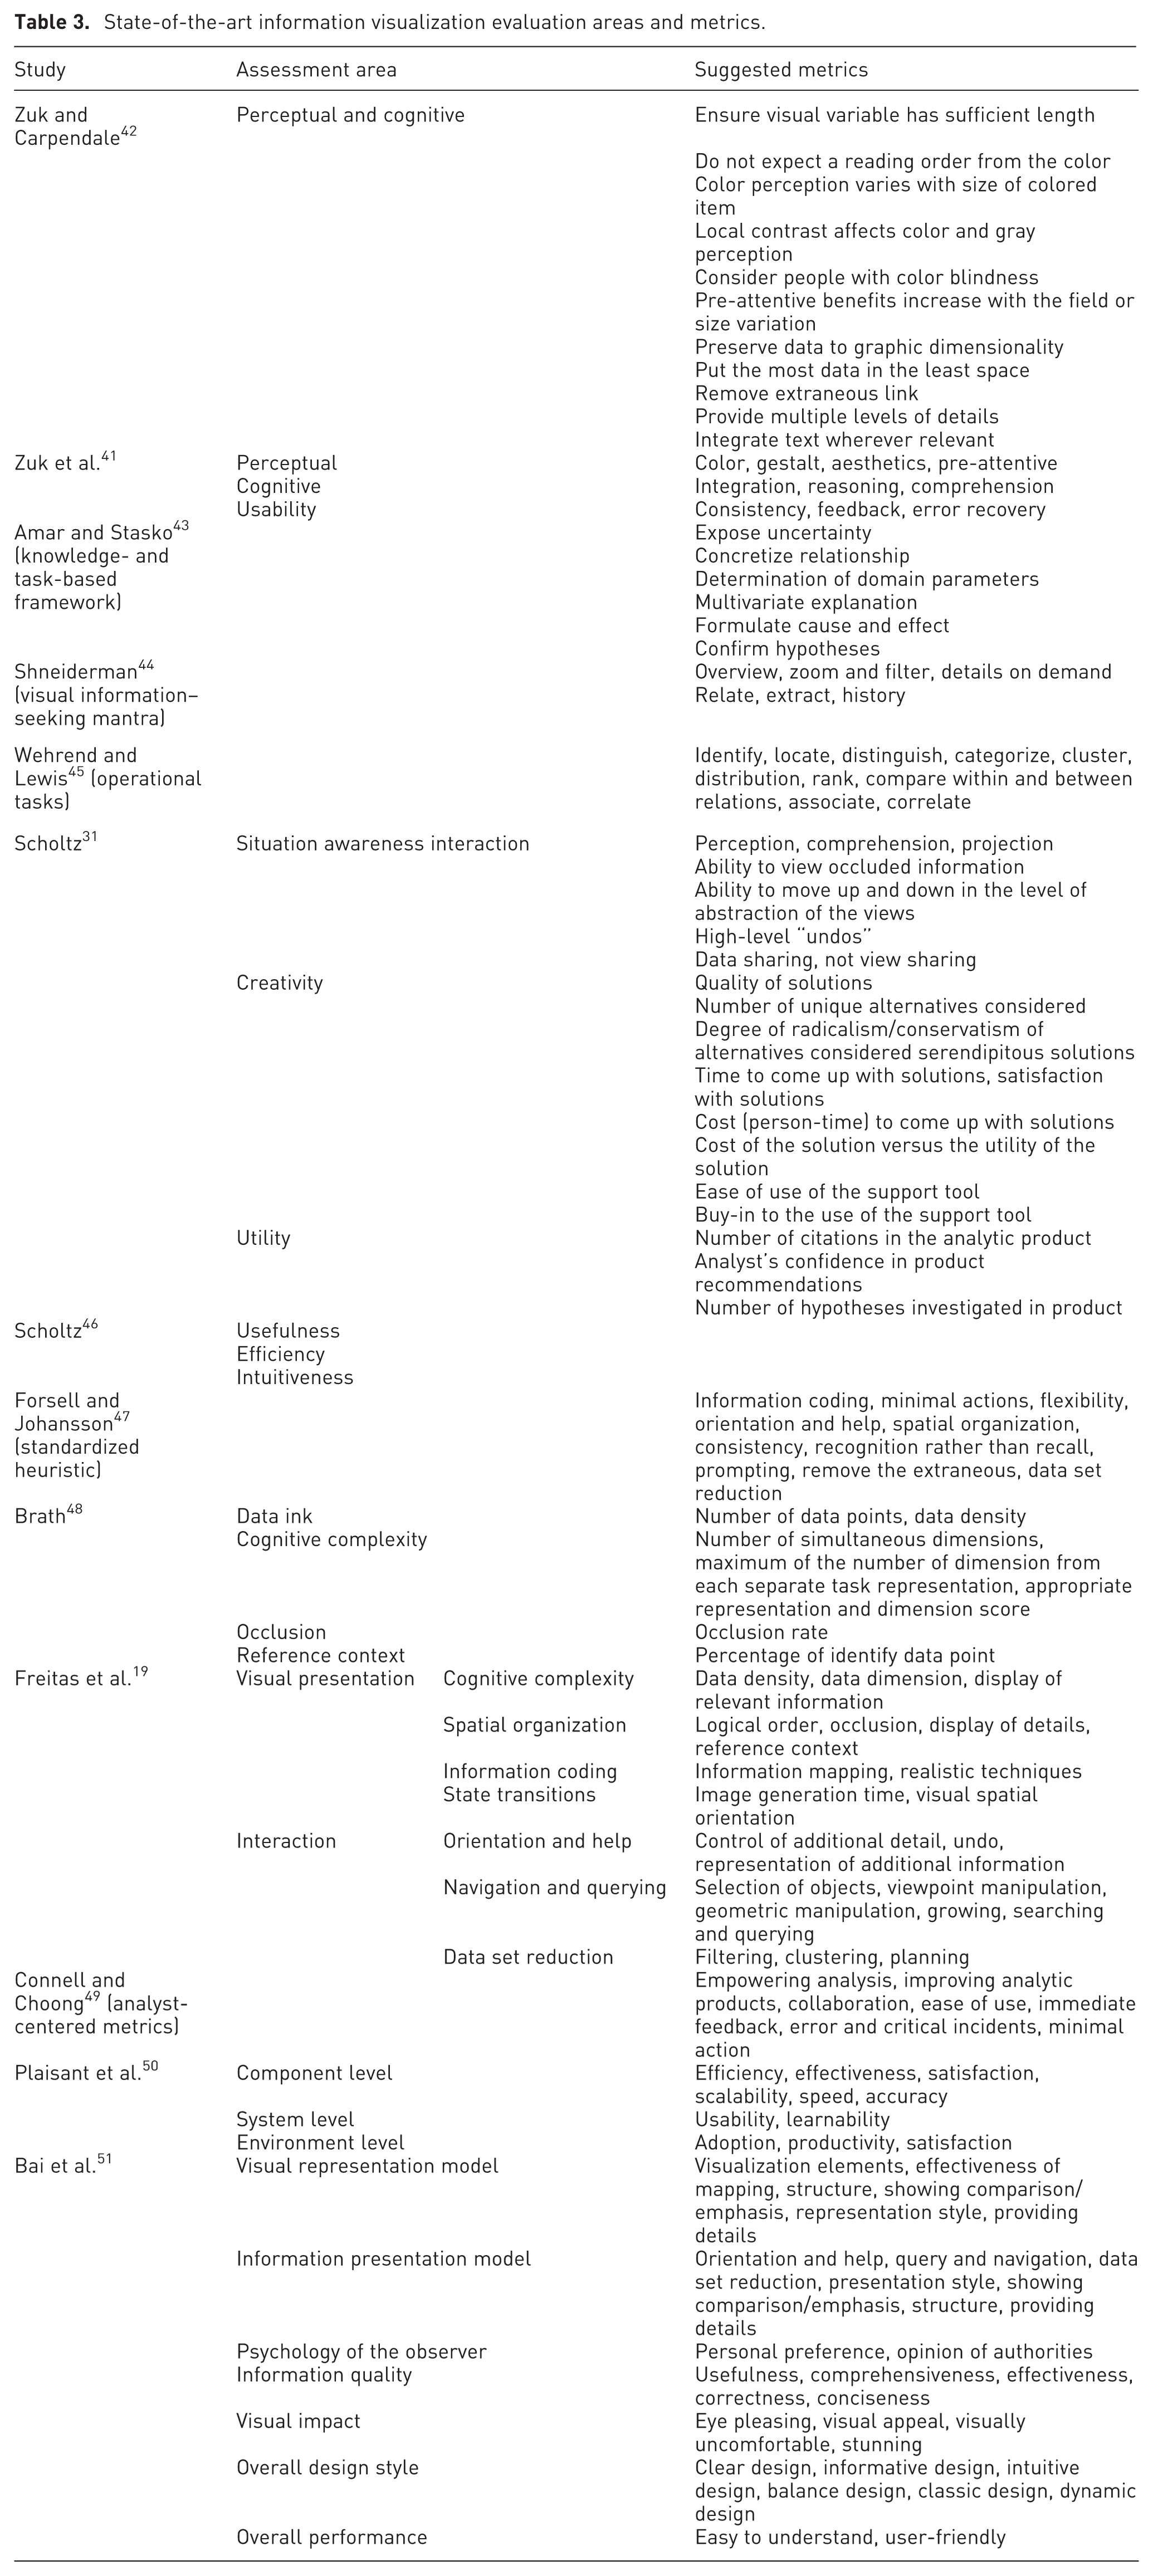
Zuk and Carpendale 42 developed perceptual and cognitive heuristics for the analysis of uncertainty visualizations. They integrated principles from Tufte, 52 Bertin, 53 and Ware 54 to propose a framework that provides insights into the strengths and weaknesses of various aspects of visualizations. In another study, Zuk et al. 41 used three different sets of heuristics (perceptual, cognitive, and usability) to evaluate a specific system by conducting a user study. The participants were asked to use these heuristics to evaluate the system. Their findings exhibited that the results have a high dependency on the heuristics used and the types of evaluators chosen. A knowledge and task-based framework for the design and evaluation of visualizations was proposed by Amar and Stasko, 43 which is based on “analytic gaps.” These gaps defined the obstacles faced by visualizations in facilitating high-level analytic tasks, such as decision making and learning. Shneiderman 44 defined seven tasks, “overview, zoom, filter, details on demand, relate, extract, history,” that a visualization technique should provide. Based on these tasks, different experiments were conducted to measure the completion of tasks and difficulties while users interact with Cam Trees, Information Cube, and Information Landscape visualizations on different data sets by Wiss et al. 55 The results showed that these visualizations behaved differently on different data sets, and a guideline was provided for the selection of visualization for a specific data set. Similarly, 11 operational tasks were identified by Wehrend and Lewis 45 that one might do with a visualization, including identify, locate, and distinguish. Amar and Stasko 43 and Shneiderman 44 provided high-level heuristics, which were more difficult to apply than the heuristics from Zuk and Carpendale. 42
Scholtz 31 proposed evaluation areas, namely, situation awareness, interaction, collaboration, creativity, and utility, to be included in basic usability to evaluate visual analytic environments. Qualitative metrics for evaluating the utility of visual analytic environments were also developed by Scholtz 46 using heuristic reviews. This evaluation addressed many usability issues: usefulness, efficiency and intuitiveness of the visualizations, user interaction, and analytical process. First, a team of visualization experts and analysts defined a list of tasks and data sets required to accomplish these tasks. Then, the developers of the systems acted as users in the study who performed the required tasks and provided their evaluation (reviews) to reviewers. The reviewers identified the important heuristics, such as complexity of a visualization, lack of labels, and misleading color coding. In 2011, Scholtz 56 conducted another study based on the heuristics defined by Amar and Stasko, 43 Zuk and Carpendale, 42 and Shneiderman 44 to identify what factors are important to analysts in evaluating a visual analytics system. 56 A user study with three analysts was conducted in a group setting. The analysts performed the required tasks and were asked to comment on the utility and ease of use of visualizations, the efficiency of interactions, and different aspects of the visualizations they liked and dislike, and so on. Based on the analysts’ comments and the result of previous studies, a guideline was proposed to evaluate visual analytics environments, which synthesized guidelines developed by researchers in various domains, such as websites and user interfaces. 46 An overview of different types of evaluation scenarios for understanding visualizations, for instance, evaluating user performance and user experience, is presented by Lam et al. 57 In this work, the authors encapsulate the most common evaluation goals, outputs, evaluation questions, and approaches for each evaluation scenario. This survey assists practitioners in setting the right evaluation goals, picking the right evaluation questions to ask, and considering a variety of methodological alternatives for the chosen goals and questions.
In well-established fields, such as user interface or website design, guidelines have been developed based on the results of empirical studies or the experience of experts, which can speed up the design and evaluation process to replace some of the need for the observation of actual users. 58 However, there is currently no agreed-upon set of metrics or guidelines in literature for the evaluation of visualizations and interaction mechanism. To overcome this issue, several efforts have been made, which defined sets of useful guidelines and metrics.47,56,59 Brath 59 provided the guidelines for interaction mechanism and visualization to create interactive visualizations. The guidelines are divided into three parts: knowing the goal, interaction, and visualization. For the first part, knowing the goal, he recommended that a real problem and its supported data must exist. The author also suggested that an interaction mechanism should be simple, effective, consistent, and interactive, which allows a variety of operations, such as slicing, filtering, drill down, and zooming. The guidelines for visualizations include the addition of legend, scale, and annotation. Forsell and Johansson 47 took a step toward defining a standardized set of heuristics. They conducted a study to identify a compact set of heuristics that cover most of visualization usability issues. In their experiments, evaluators rate how well a total of 63 heuristics (previously published) can present a collection of 74 usability problems. Based on the evaluator’s rating, they derived a new set of 10 heuristics, namely, information coding, minimal actions, flexibility, orientation and help, spatial organization, consistency, recognition rather than recall, prompting, remove the extraneous, data set reduction.
Freitas et al. 19 defined four classes to evaluate information visualization techniques, namely, completeness, spatial organization, information coding, and state transition, and three classes, namely, orientation and help, navigation and querying, and data set reduction, for the analysis of interaction mechanism. For each class, they defined a set of metrics to evaluate the usability of visualization as shown in Table 3. Data visualization metrics have been proposed by Brath 48 to evaluate the efficiency of three-dimensional plots by measuring the number of data points, the number of dimensions, occlusion rate, the density of data points, the number of simultaneous dimensions, and the number of identifiable data points. Metrics for interaction mechanism were not defined in this study. Analyst-centered information visualization metrics were proposed by Connell and Choong 49 to measure analysts’ needs and experiences. These metrics are based on understanding the behavior of novice and experienced analysts and their workplace requirements (Table 3). Plaisant et al. 50 defined three levels of visualization evaluation: component level, system level, and environment level. The component level focuses algorithms, visual representations, interactive techniques, and interface designs. The system level includes interfaces, which combine and integrate multiple components. The third level is the environment level, which addresses evaluation issues related to adoption. The authors also listed metrics for each level (Table 3). Similarly, Bai et al. 51 defined seven assessment areas, namely, visual representation model, information presentation model, psychology of the observer, information quality, visual impact, overall design style, and overall performance for evaluation of information visualizations. Each area is further divided into a set of evaluation categories and sub-categories (metrics). These metrics can be utilized to evaluate different areas of information visualizations.
Pillat et al. 60 conducted an investigational study to evaluate two information visualization techniques, Parallel Coordinates and Radviz, by conducting experiments with users in a laboratory with the presence of observers. Some usability problems were identified in the visualizations as pointed out by the users, such as difficulty in the interpretation of the Radviz’s layout. To identify the role of eye tracking technique on usability, AppVis 1.0 network management tool was evaluated by Pretorius et al., 61 and results showed that better evaluation of visualization can be achieved by integrating eye tracking method in traditional evaluation methods. An evaluation study of the visual analytics system “Jigsaw” with 16 participants is reported by Kang et al., 62 which describes an investigative analysis exercise. The participants have given 50 documents with the goal to identify a hidden terrorist plot. Qualitative data, such as observations, follow-up interview notes, and videos, and quantifiable data, such as the number of documents viewed and the number of queries performed, were analyzed, which suggested that the system can benefit investigative analysis.
The literature indicated that various studies have been conducted in myriad domains, such as websites,30,32,33 software, 37 digital repositories, 34 user interface,35,36 and information visualization60,61 to investigate their usability using questionnaires, interviews, focus group, and tests with users in remote or laboratory settings. However, there is still a lack of usability studies that evaluate information visualization techniques, especially in the opinion mining domain, except Wu et al. 2 who evaluated the opinion wheel from data analysts. To the best of our knowledge, no usability study was found in the literature that investigated opinion visualization techniques focusing on customers’ point of views. It is important to consider customers’ recommendations for better usability and usefulness as they are the main users of the systems. This study aims to fulfill the gap by ranking the visualizations of opinion mining systems and identifying important information visualization metrics.
Research methodology
In this section, the conceptual design and the research methodology are described.
Method
Instrument
A questionnaire survey consisting of 10 structured closed-ended questions was developed to collect the data. The 10 evaluation metrics (and the assessment areas) were adapted from Bai et al. 51 (see Table 4). We selected six out of seven assessment areas because it was difficult to collect data for the seventh assessment area, which is about domain experts’ opinion. Each assessment area defined a set of evaluation categories and sub-categories (metrics). The questionnaire had two parts. Part A required the participants to fill in their demographic profiles, such as age and gender. Part B required the participants to state their level of agreement or disagreement about visualizations against each metric on a Likert scale that ranges from Strongly Disagree (1) to Strongly Agree (5) (see Table 4).
Questionnaire with metrics and assessment areas.

Instrument refinement
The questionnaire was pre-tested by conducting a pilot study to judge its feasibility. The pilot study was performed with the help of a focus group to gain the participants’ understanding about the questionnaire. There were 15 participants in the focus group study, 5 in each group. The participants were academicians from COMSATS Institute of Information Technology, Pakistan. The participants discussed the questionnaire with each other and provided their level of understanding, suggestions, and comments. Initially, 14 metrics were selected; however, after the pilot study, 4 metrics, namely, visual appeal, visually uncomfortable, stunning, and conciseness, were removed as the first 3 metrics can be represented by eye pleasing. Similarly, conciseness is closely related to the comprehension metric. Then, the refined questionnaire was again discussed with two participants of the focus group study to finalize its contents, and the finalized questionnaire was used to collect data.
Data collection
Seminars and a web-based online questionnaire were used to collect the data.
Seminar
The first author of this article (A.S.) contacted the coordinator of Computer Science Department of COMSATS Institute of Information Technology, Pakistan, for conducting seminars on opinion visualization techniques. The coordinator made arrangements for the seminars and informed the author, students, and academicians about the venue and the time of the seminars. The target participants of these seminars are students and academicians with a computer science background, especially students who took the “Human–Computer Interaction” course. This course introduced some of the prominent visualization techniques, such as tree map. As a result, the students who took the course had a better knowledge about visualization techniques. The reason behind targeting computer science personnel is that they are the largest group of the Internet users and are more likely to consult and use online opinion information than other Internet user groups.
Three seminars were conducted to present the information about state-of-the-art opinion visualization techniques and for a dynamic discussion about the visualization techniques with target participants. The first author of this article (A.S.) gave a 10-min presentation at the beginning of each seminar in order to present the objectives of the study, a brief introduction of selected opinion visualization techniques, and instructions on filling the questionnaire, so that the participants had an adequate understanding to fill in the questionnaire. Then, a question–answer session was held in order to clarify the understanding of the participants about the visualization techniques. In the session, the participants asked mostly the questions about the meaning of a symbol or metaphor in the visualizations such as the interpretation of symbols in Figure 7. Approximately, the session lasted for 30 min. After the session, the opinion visualization techniques were displayed, and the participants were requested to fill in the questionnaire. After that, an interactive discussion was held between the participants and the presenter in which the participants provided their preferences about opinion visualizations. The preferences were noted down. Approximately, 60 min were consumed in the first seminar. The same procedure was repeated for second and third seminars.
Online questionnaire
To increase the number of responses, an online questionnaire was also created, and the link was distributed via e-mail to computer science students of different universities in Malaysia. We added a video in the online questionnaire that briefly introduced the selected opinion visualizations. One of the limitations of the online questionnaire is the lack of face-to-face communication, especially a question–answer session to clarify concepts. To overcome this limitation, we added a description of concepts, metaphors, and symbols in the online questionnaire, which was asked by the participants of the seminars in the question–answer session. It took approximately 5 weeks to collect the data.
Participants
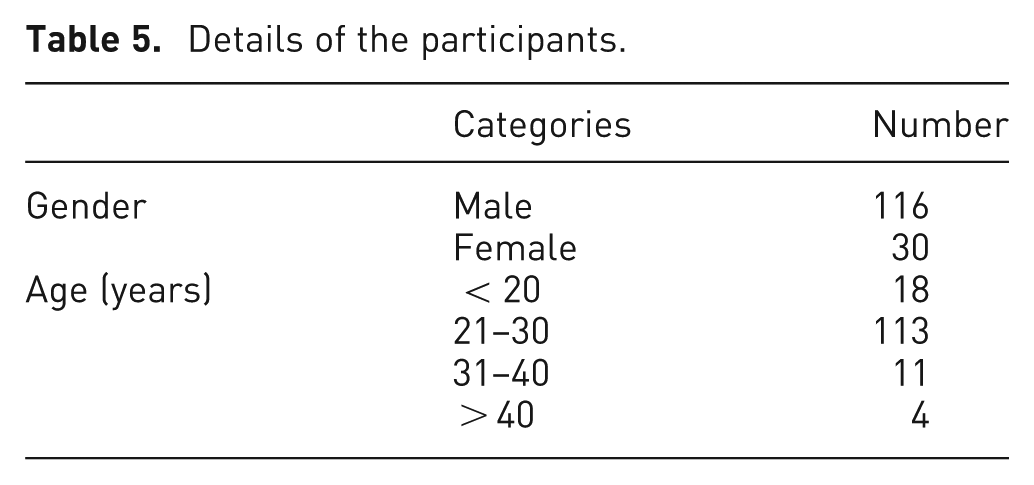
A total of 146 users participated in the data collection. The participant’s size of the seminar was 110 (22 females and 88 males). The participant’s size for online questionnaire was 36 (17 females and 19 males). Table 5 shows the details of the participants (M: 25.57, standard deviation (SD): 5.55). Most of the participants belonged to the 21- to 30-years age group as they used more Internet than other categories. A large number of participants have prior experience of getting decision-oriented information from online reviews.
Details of the participants.
Results and discussion
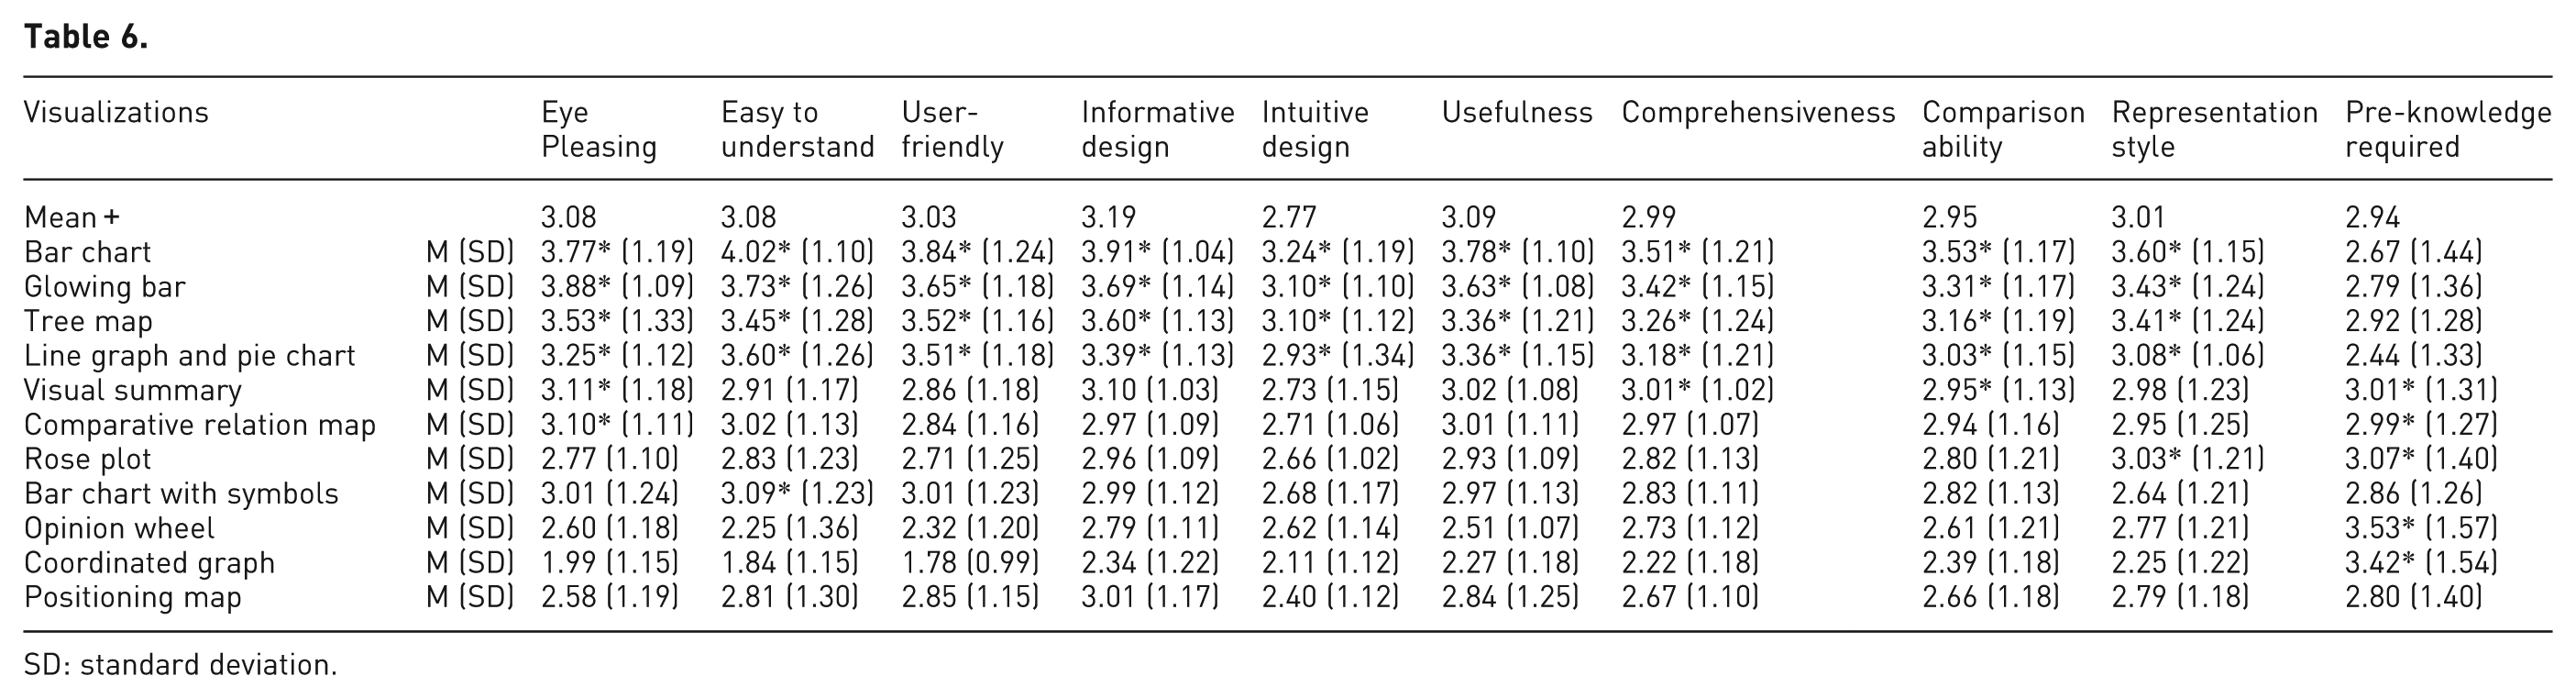
The collected data were analyzed using SPSS 18 (Statistical Package for the Social Sciences) to achieve the objectives of this study. The mean (mean+: Table 6) value of a metric across the visualizations was also calculated for the ranking of the visualizations and to identify important information visualization metrics. An independent sample t-test was conducted to investigate differences between perceptions of the participants of seminars and online questionnaire.
SD: standard deviation.
Ranking of visualizations
In order to achieve the first objective, that is, ranking of the opinion visualizations, descriptive statistics, such as mean and SD, of all metrics for each of the visualizations were analyzed. Table 6 shows the ranking of the visualizations. The contents in gray shade show the metrics which scored higher than the mean+ values. The metrics scored higher than mean + value are also marked with the symbol *. The visualization ranks higher than others based on the number of gray-shaded metrics. Therefore, the top four visualizations are bar chart, followed by glowing bar, tree map, line graph, and pie chart. Positioning map is at the lowest rank with no gray-shaded metric.
The reason behind the higher ranking of bar chart and glowing bars is the simplicity, effectiveness, and easy to use design, 63 with no or little pre-knowledge requirement. Other factors that contributed strongly in the ranking are (1) highest visual appeal and user-friendliness, (2) easy to understand and highly informative design, and (3) highest comparison ability and good presentation style (see Table 6). One more advantageous factor of bar chart and glowing bar is the ease of locating specific information directly. 64 Besides the simplicity in the design, bar charts are not suitable to present multidimensional data with low level of abstraction and also have a limitation on the number of data values.9,65
Tree map efficiently utilizes display space 66 to present multiple features and their corresponding semantic at a same time with an appealing and eye pleasing design. The identification and comparison of key features and sentiment are made easy by using tree map layout. 66 Line graph and pie chart are common, simple, effective, and easy-to-use visualization.63,64 Line graph shows users the trend movement of customers’ opinions and assists to predict the tendency of customers’ opinions about a product. It also provides a quick analysis of data to find minimum and maximum positive and negative users’ opinions. As opinion data are highly dimensional, the line graph is not suitable for opinion visualization because of limitation on the number of dimensions and data sets. 63 A pie chart provides an easy way to perform comparison between the number of positive and negative comments. 9 It is also interesting to note that all the top visualizations have less pre-knowledge requirement as they are simple, common, less dimensional, and user-friendly.
The next visualization is the visual summary that provides a quick and scalable way to compare competing products based on different features with corresponding semantics at a glance. The strength of visual summary is the color scale which presents levels of semantic tendency. The comparison is difficult because no significant difference lies in the size of inner rectangles as pointed out by the participants of the seminars. Furthermore, it is also difficult to locate a specific piece of information. The comparative relation map is an eye pleasing and multidimensional visualization that facilitates comparison among competitive products intuitively; however, it is difficult to understand because high pre-knowledge is required to interpret it as pointed out by the participants of the seminars. The next visualization is the rose plot, which is aesthetically appealing and has a compact layout and easy to interpret design.2,5,17 Its design facilitates comparison in a quick and easy to understand way, but it has limitation on the number of data elements because each element requires a substantial amount of screen space, and for many items, the size of a petal becomes small and it is difficult to distinguish among petals. 67
Bar chart with symbols is difficult to understand because of high pre-knowledge requirement as pointed out by the participants of the seminars. Opinion wheel provides a good way to present high-dimensional data with a low level of abstraction. 2 It is also difficult to locate a piece of information because of higher dimensionality and low level of abstraction. Users do not prefer to present too much information in a visualization. 2 It is rated highest in pre-knowledge requirement and low in visual appeal and understandability. Mostly, the participants of the seminars failed to understand opinion wheel due to high pre-knowledge requirement. Opinion wheel is designed for data analysts, and this is one of the reasons behind the low ranking. Coordinated graph is visualization with (1) lowest visual appeal, (2) highest difficulty level to understand, (3) lowest user-friendliness and informative design, and (4) higher pre-knowledge requirement. A majority of participants pointed out about its visually uncomfortable design and difficulty in identifying a specific piece of information in the open conversation. The last visualization is positioning map which is widely used, simple, and easy to understand visualization; however, it lacks visual expression and some of the flexibility offered by newer visualization techniques to present multidimensional data.68,69 Positioning map also has significant overlap while presenting many data points 69 and hence is less suitable for opinion data.
It is observed that common, simple, eye pleasing, easy to understand, less dimensional, and highly summarized visualizations ranked higher. The usefulness of visualization technique in terms of presenting decision-oriented information is a vital metric in usability of the visualizations. The level of abstraction is another important factor because users are not concerned with the details of individual review. Mostly, the users require a higher level of abstraction in easy to understand ways. Another significant metric is the knowledge required to understand the visualization. Users prefer visualizations that are understandable without any pre-knowledge and training. It is concluded from the results that most of the selected visualization required pre-knowledge to gain understanding about the visualizations. As the dimensionality of data within visualization grows, more pre-knowledge is required to understand visualization. If a user fails to understand visualization, then it is not considered useful. In the comparative analysis of different products and features of different products, comparison ability of visualization played an important role.
Investigation of differences between perceptions of the participants of seminars and online questionnaire
An independent sample t-test was conducted to investigate differences between perceptions of the participants of seminars and online questionnaire.
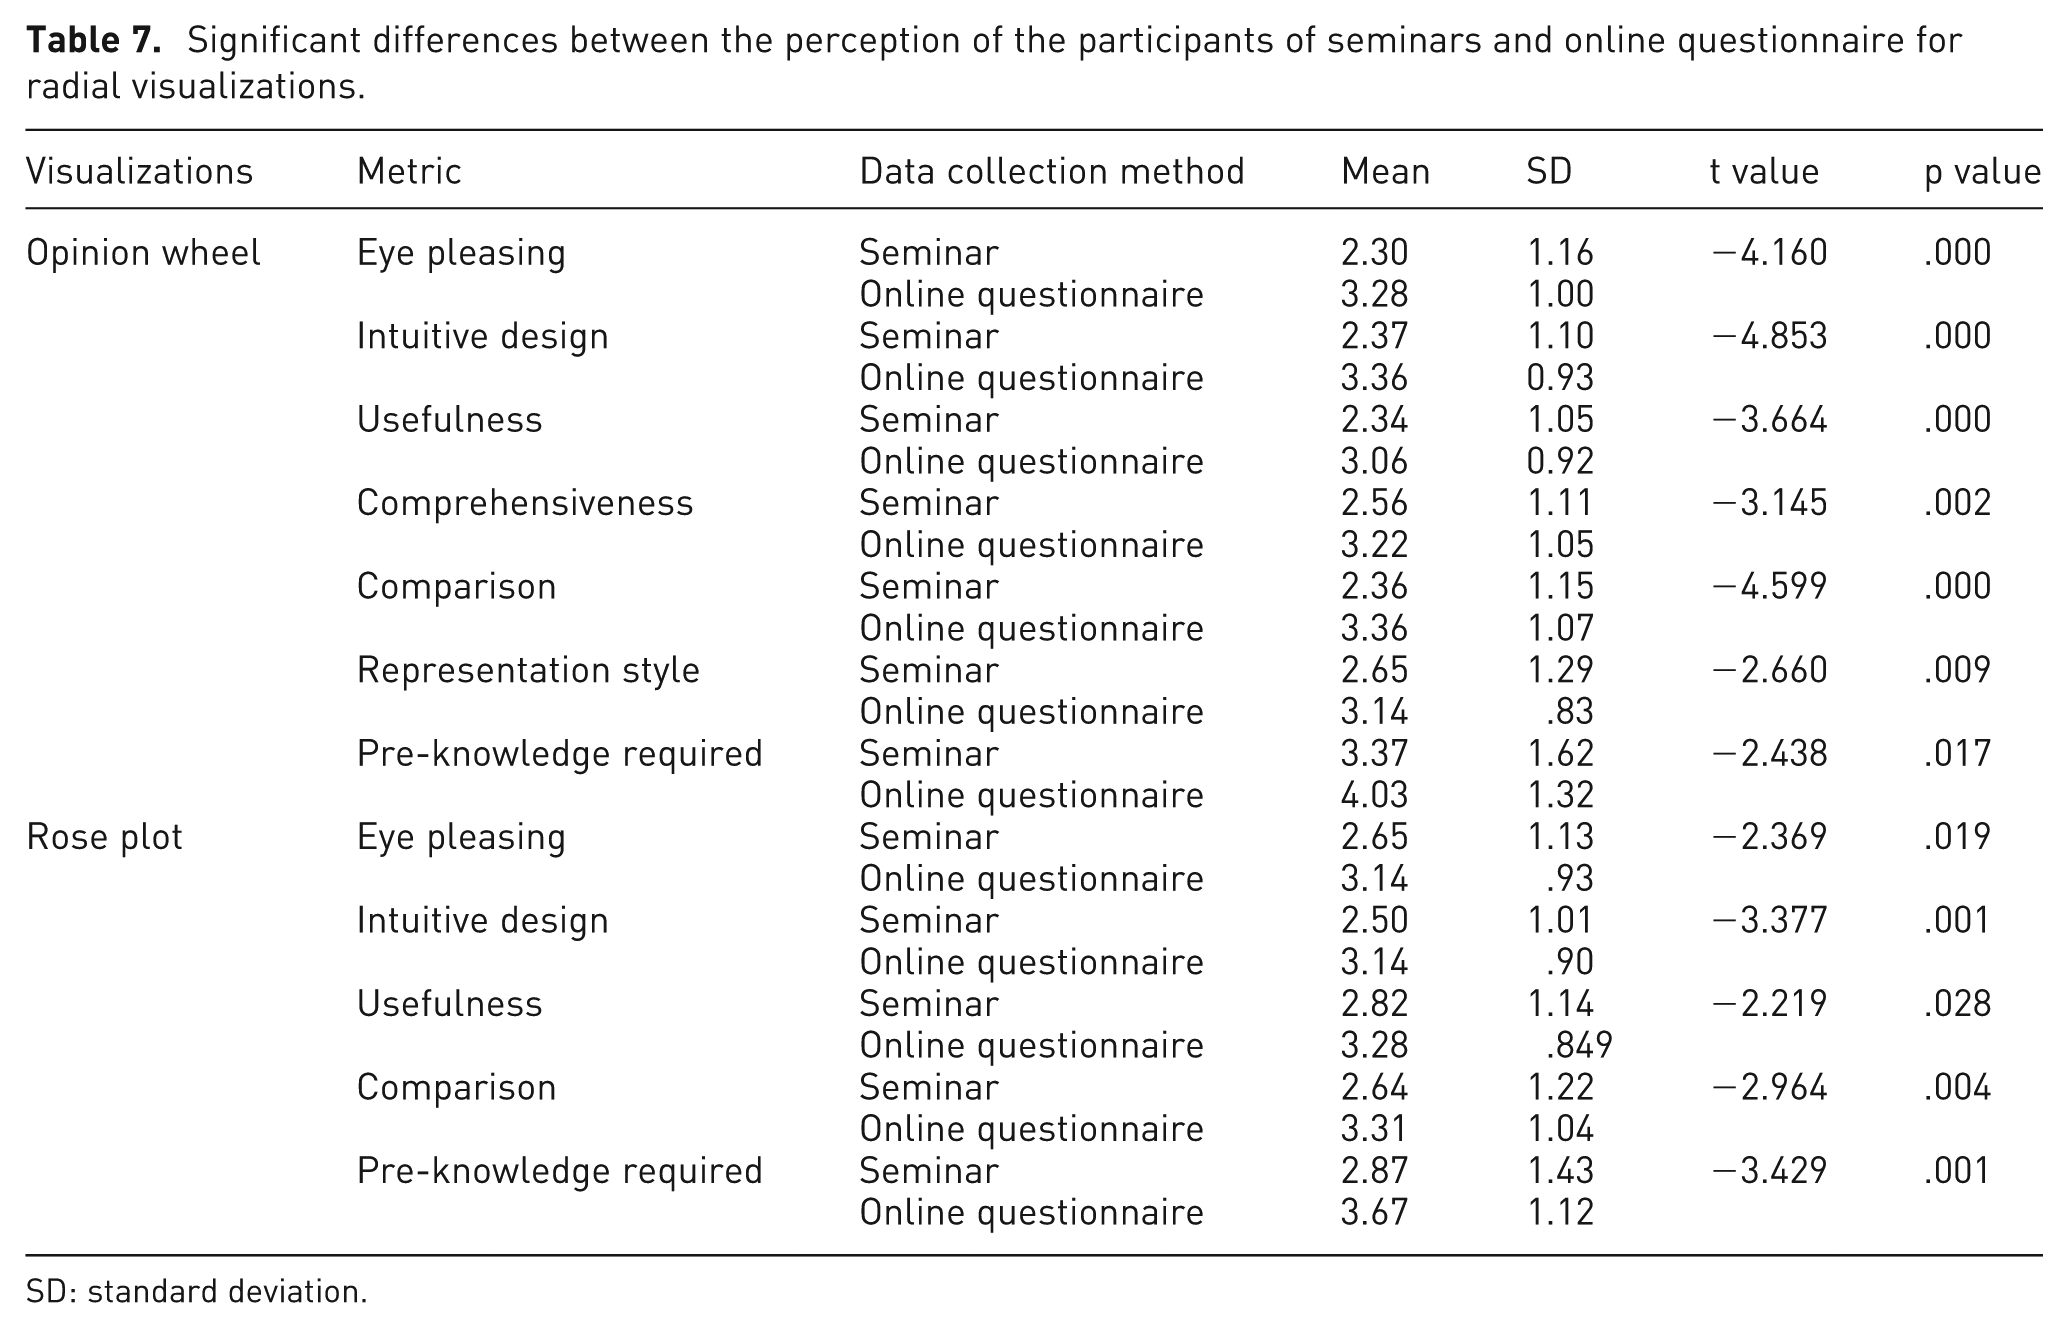
The results with significant differences about the perception of the participants of the two groups for radial visualizations are shown in Table 7. The participants of the online questionnaire are relatively more inclined toward visual appeal, intuitiveness, usefulness, comprehensiveness, comparison ability, and presentation style of the opinion wheel than the participants of the seminars. However, they required more pre-knowledge to comprehend the opinion wheel as compared to the participants of seminars. Similarly, high visual appeal, intuitiveness, usefulness, comparison ability, and pre-knowledge requirement were reported by the participants of online questionnaire on the rose plot as compared to the participants of the seminars.
Significant differences between the perception of the participants of seminars and online questionnaire for radial visualizations.
SD: standard deviation.
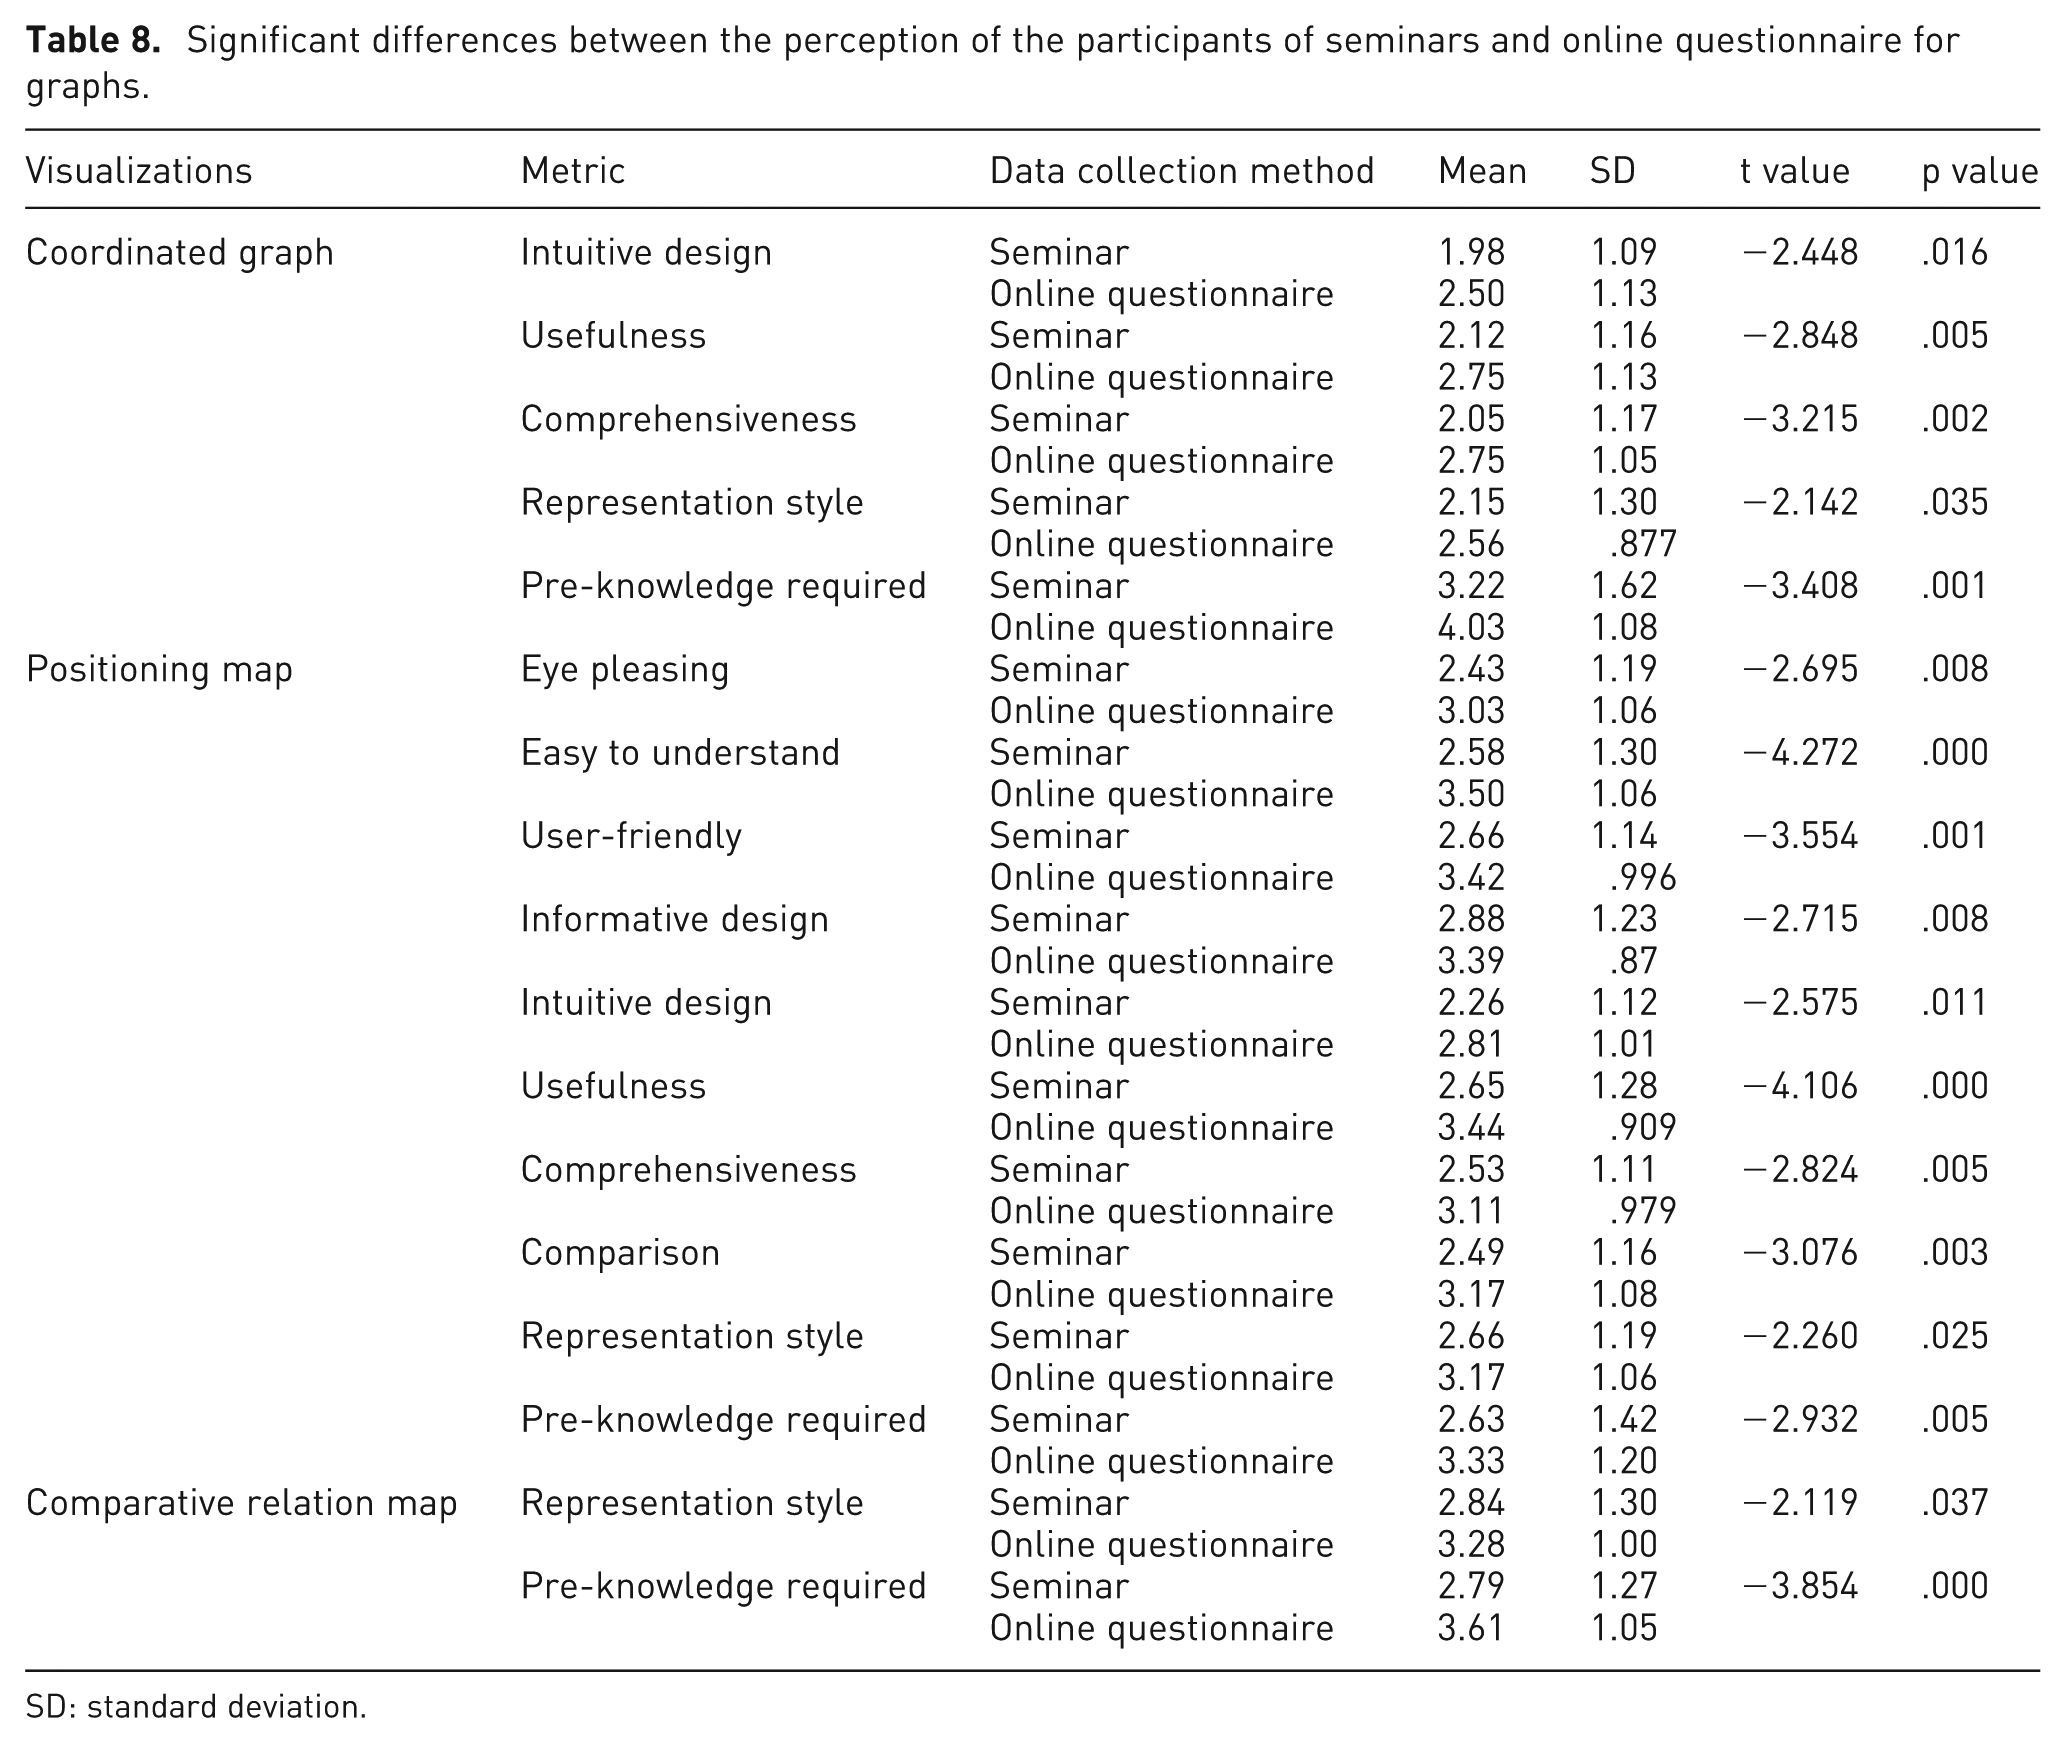
The results with significant differences between the perception of the two groups for graphs are shown in Table 8. The intuitiveness, usefulness, comprehensiveness, and presentation style of the coordinated graph were appreciated more by the participants of the online questionnaire than the participants of the seminars. The participants of the online questionnaire highlighted high pre-knowledge requirement for the coordinated graph than the other group. Likewise, the participants of online questionnaire significantly agreed on visual appeal, understandability, user-friendliness, informativeness, intuitiveness, usefulness, comprehensiveness, comparison, presentation style, and pre-knowledge requirement of the positioning map more than the participants of the seminars. Similarly, the participants of online questionnaire were attracted toward the presentation style of the comparative relation map and reported high pre-knowledge requirement than the participants of seminars.
Significant differences between the perception of the participants of seminars and online questionnaire for graphs.
SD: standard deviation.
The results with significant differences between the perception of participants of seminars and online questionnaire for hierarchical visualizations are shown in Table 9. The tree map appeared more user-friendly to the participants of seminars; however, they required less knowledge to comprehend it, as most of them are familiar with tree map visualization. In contrast, the participants of online questionnaire favored the visual summary in terms of the eye pleasing, user-friendly, intuitive design, usefulness, comprehensiveness, comparison, and representation style metrics. They also highlighted higher pre-knowledge requirement than the other group.
Significant differences between the perception of the participants of seminars and online questionnaire for hierarchical visualizations.

SD: standard deviation.
The results with significant differences between the perceptions of participants of seminars and online questionnaire for bar chart are shown in Table 10. The results indicated a significant difference in the perception between two groups; the participants of online questionnaire favored the comparison ability of the bar chart more than the participants of the seminar. The perception among the participants of the seminar and online questionnaire significantly varies on the easy to understand, user-friendly, informative design, usefulness, comprehensiveness, comparison, and representation style metrics of the line graph and pie chart, where the participants of online questionnaire showed more agreement. There is only one significant difference on the bar chart with symbols between these two groups, where the participants of online questionnaire inclined toward the comprehensiveness of the bar chart with symbols more than the participants of seminars. In contrast, the participants of seminars reported high visual appeal, understandability, and informativeness of the glowing bars.
Significant differences between the perception of participants of seminars and online questionnaire for bar chart.

SD: standard deviation.
The maximum differences exist between the groups on the positioning map (10 metrics) followed by the visual summary (8 metrics), opinion wheel (7 metrics), line graph and pie chart (7 metrics), rose plot (5 metrics), and coordinated graph (5 metrics). The users reported less difference for glowing bar (3 metrics), tree map (2 metrics), comparative relation map (2 metrics), bar chart (1 metric), and bar chart with symbol (1 metric). Mostly, the participants of online questionnaire required more pre-knowledge for the interpretation of the visualizations due to lack of face-to-face communication, as they were unable to clarify the underlying concepts of the visualizations.
Identification of important visualization metrics
In order to achieve the second objective, that is, the identification of important information visualization metrics, we used descriptive statistics, that is, mean+ value. We considered the metric important if their mean+ value is greater than 3. Thus, the important metrics are eye pleasing, easy to understand, user-friendly, informative design, usefulness, and representation style (Table 6).
It is observed that users prefer eye pleasing, easy to understand, and user-friendly visualizations. Another important factor is how much decision-oriented information visualization presents. The usefulness and representation style of visualization are other vital metrics in the usability of visualizations. Intuitive design metric scored lowest mean+ value among all metrics. The reason behind this lowest score might be that users consider how informative and easy to understand visualizations are instead of how intuitive they are. The participants focused on these metrics more while evaluating the visualizations. These metrics played an important role in the ranking of the visualizations and user satisfaction and should be considered while designing new opinion visualizations. As a result, user’s satisfaction with these systems will be increased, and users can take full benefits from these systems.
Conclusion
The objectives of this study are (1) to rank the visualizations of the opinion mining systems, (2) to investigate the differences between perceptions of the two groups of the respondents (the participants of the seminars and the online questionnaire), and (3) to identify important visualization metrics. To collect data, a questionnaire survey was developed and data were collected via the online questionnaire survey and by conducting seminars. It is concluded that simple, easy to understand, less dimensional, less pre-knowledge required with good presentation style visualizations were rated higher than others. The top five visualizations are bar chart, glowing bar, tree map, line graph, and pie chart. The results revealed that the participants of the online questionnaire required more pre-knowledge to comprehend the visualizations than the participants of the seminars. It was found that the important metrics are eye pleasing, easy to understand, user-friendly, informative design, usefulness, and representation style. The results of this study could aid in the design and development of visualizations for the opinion mining system.
Footnotes
Funding
This study was supported by University of Malaya (RP002B-13ICT).