




Abstract
In this article, we describe a general purpose system that, given as input a segmented/classified image, automatically provides different visual outputs exploiting solid colors, color boundaries, and transparent colors. Moreover, if the names of the classes are given, the system automatically places a textual label in the less salient sub-region of the corresponding class. For color-class association and class label placement, we take into account the underlying image color and structure exploiting both saliency and superpixel representation. The color selection and the color-class association are formulated both as optimization problems and heuristically solved using a Local Search procedure. Results show the effectiveness of the proposed system on images having different content and different number of annotated regions.
Introduction
In image segmentation and classification applications, the user may want to visually code and associate ancillary information, such as names, to the different classes depicted in the image. The decision of how to visually code the different classes and eventually where to place the textual annotations is a problem often referred as view management. 1 Such a problem commonly arises in different domains, such as visual retrieval, 2 video surveillance, 3 medical imaging,4,5 cartography, 6 remote sensing, 7 and augmented reality. 8 Among visual features, color is widely employed to visualize the output of a segmentation-classification process. While in some applications, the color-class association is strongly driven by conventions (e.g. in cartography), in many other domains this process cannot be easily automated since there are no consolidated conventions or common guidelines. While several heuristic procedures have been proposed to select high-contrast color palettes (see the following section), the problem of color-class association is not completely solved as a serious problem arises because the chosen colors must be displayed together and assigned to classes that maybe spatially adjacent. In practice, this is mainly based on a trial-and-error approach and demands a concerted effort on the part of the user. In many dynamic applications (e.g. augmented reality, video surveillance) or when very large datasets have to be processed,9–11 this activity should be automated as much as possible.
In this work, we propose a general purpose system that, given as input a segmented/classified image, provides different visual outputs exploiting solid colors, color boundaries and transparent colors. In the first case, each class is filled with the associated color, thus resulting in a pseudo-color representation of the image; in the second case, colored region boundaries are displayed on the original image; in the third case, transparent colors are overlaid on the original image. For the second and third outputs, class labels (if available) are automatically placed. In the overlay solutions, to select the colors and to place class names, we take into account the underlying color distribution and structure of the image using both a superpixel representation and saliency map. Both the label placement and the high-contrast color selection problems are NP-hard.12,13 In this work, we model them as optimization problems and describe a method for heuristically solving them using a Local Search (LS) procedure.
The main contributions of this work are as follows:
The introduction of a new general purpose system able to provide different visual outputs exploiting solid colors, color boundaries, and transparent colors. The system is completely unsupervised and its core is constituted by algorithms able to work in any color space, with any color distance, and with any color palette.
Introduction of the use of transparent colors by taking into account underlying image colors, in order to maximize visibility in all the use cases in which the system can be used.
The formalization of the high-contrast color selection and color-class association as a single problem, and the design of an efficient optimization algorithm to solve it.
A systematic way to automatically find the best locations where to place class labels.
The possibility to download the system (http://www.ivl.disco.unimib.it/activities/cc4visual-im-class-results/) and easily expand its functionalities.
Related work
The great majority of the automatic approaches in the state of the art consist of heuristic procedures proposed to define high-contrast sets of colors without considering their association to the image classes (leaving color-class association to the user). For example, Kelly 14 conceived a list of 22 maximally contrasting surface colors, such that each color of the list is maximally different from the one immediately preceding it. Later Carter and Carter 15 formulated the first algorithm to compute easily discriminable sets of colors. Several authors16–20 have devised algorithms that can also fulfill a number of ergonomical requirements. In 1995, Campadelli et al. 21 presented an abstract formulation of the problem of selecting high-contrast color sets, defining it as a combinatorial optimization problem on graphs. More recently, Carter and Huertas 22 have studied the ability of different metrics and several color spaces to enhance the discriminability of small visual targets with ultra-large color differences. Glasbey et al. 23 proposed a greedy method for the selection of set of colors for categorical image and showed that its performance is comparable with that of a simulated annealing algorithm. Breslow et al. 24 proposed an algorithm for generating color scales for both categorical and ordinal coding; their method uses a positional space partition strategy to generate a lightness scale and then applies the method developed from Campadelli et al. 13 to select discriminable colors according to the lightness constraint. Rodriguez-Pardo and Sharma 25 proposed a dynamical solution to the problem using a hierarchical clustering followed by a simple truncation to select the desired number of high-contrast colors at run time. Radlak and Smolka 26 proposed a methodology for deriving optimized visualization based on maximizing local distance between colors. They present visualization results using a new color contrast measure optimized with a genetic algorithm (GA). Their method can be used to obtain pseudo-color encoded images of segmentation results.
Concerning color-class association, as an alternative to automatic approaches, some interactive systems for color coding have been also proposed.27–31 They share the idea of using a fixed color palette of high-contrast colors and rely on the user intervention to associate them to the image classes. In this article instead, both the search of a high-contrast set of colors and the color-class association are performed automatically together with the placement of the class label.
The proposed system
The processing pipeline of the proposed system is reported in Figure 1. Given an image to be coded, its classification/segmentation, the set of available colors (in the following, color palettes), and (optionally) the labels of the classes, the system generates different proposals ranging from solid color solutions (see Figure 1(a) and (b)) to color boundary and transparent color overlay solutions (see Figure 1(c) and (d)). For the latter solutions, the optimal locations for the region labels are also produced in output.

Workflow of the proposed system.
Each proposal depends on the input palette, the number, and the spatial relationship of the classes in the image to be coded. To generate such proposals, the problem of selecting high-contrast color sets is jointly addressed with the color-class association problem, in order to maximize the color discriminability among adjacent classes. For color boundary and transparent color overlay solutions, a further problem is faced: the chosen colors have also to be at maximum contrast with respect to the underlying image colors. Finally, to place the class labels, the less salient sub-region able to contain the entire label must be found for each class. To take into account the content of the image to be coded and the spatial relationship of the classes, suitable image descriptions in terms of superpixel representation, saliency, and class adjacency representation are exploited.
The proposed system takes as input an RGB image
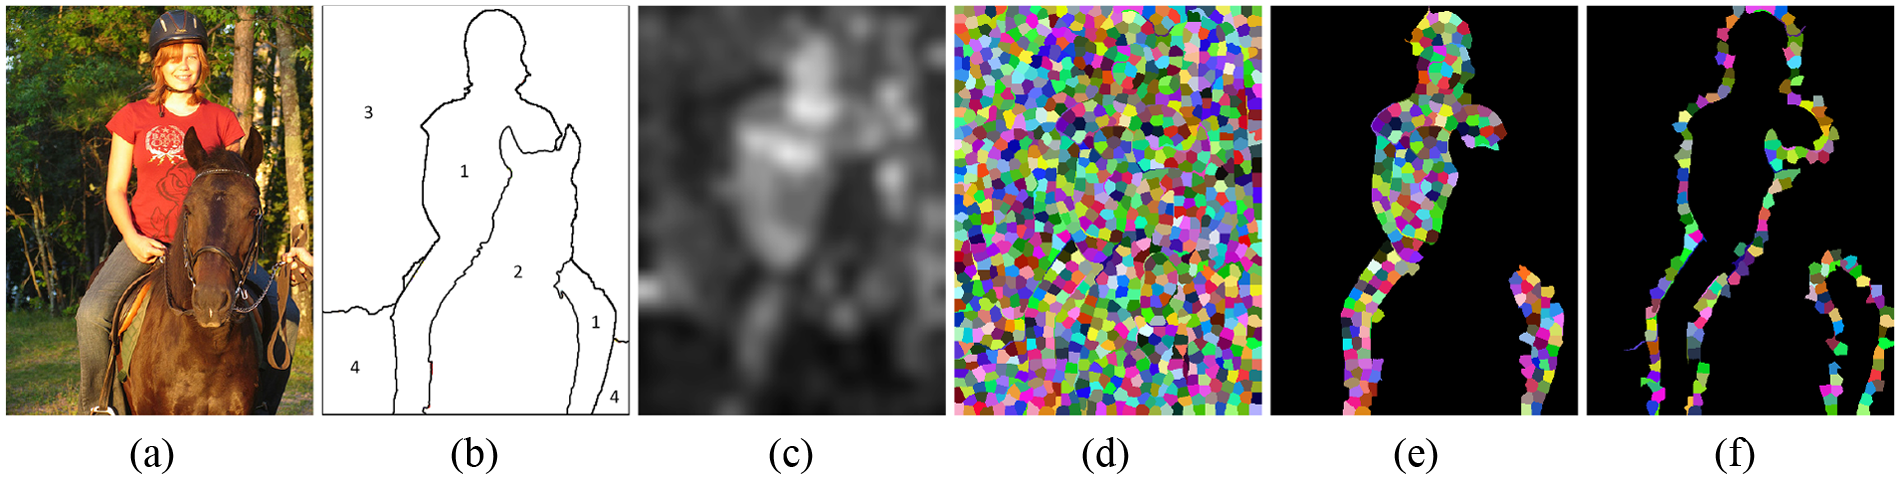
(a) Original image, (b) image segments, (c) saliency map, (d) superpixel map, (e) superpixels belonging to
Both
The looping on the regions then begins. For each region

The pixels of the saliency map

If

By design, only one label for each class is placed. In case of classes composed of multiple regions, the label is placed only in the largest region in the less salient part.
The next step is the identification of the part of the image adjacent to

The final stage of the proposed system is to find a set of colors
The pseudo-code of the algorithm implemented in the proposed system is given in algorithm 1.
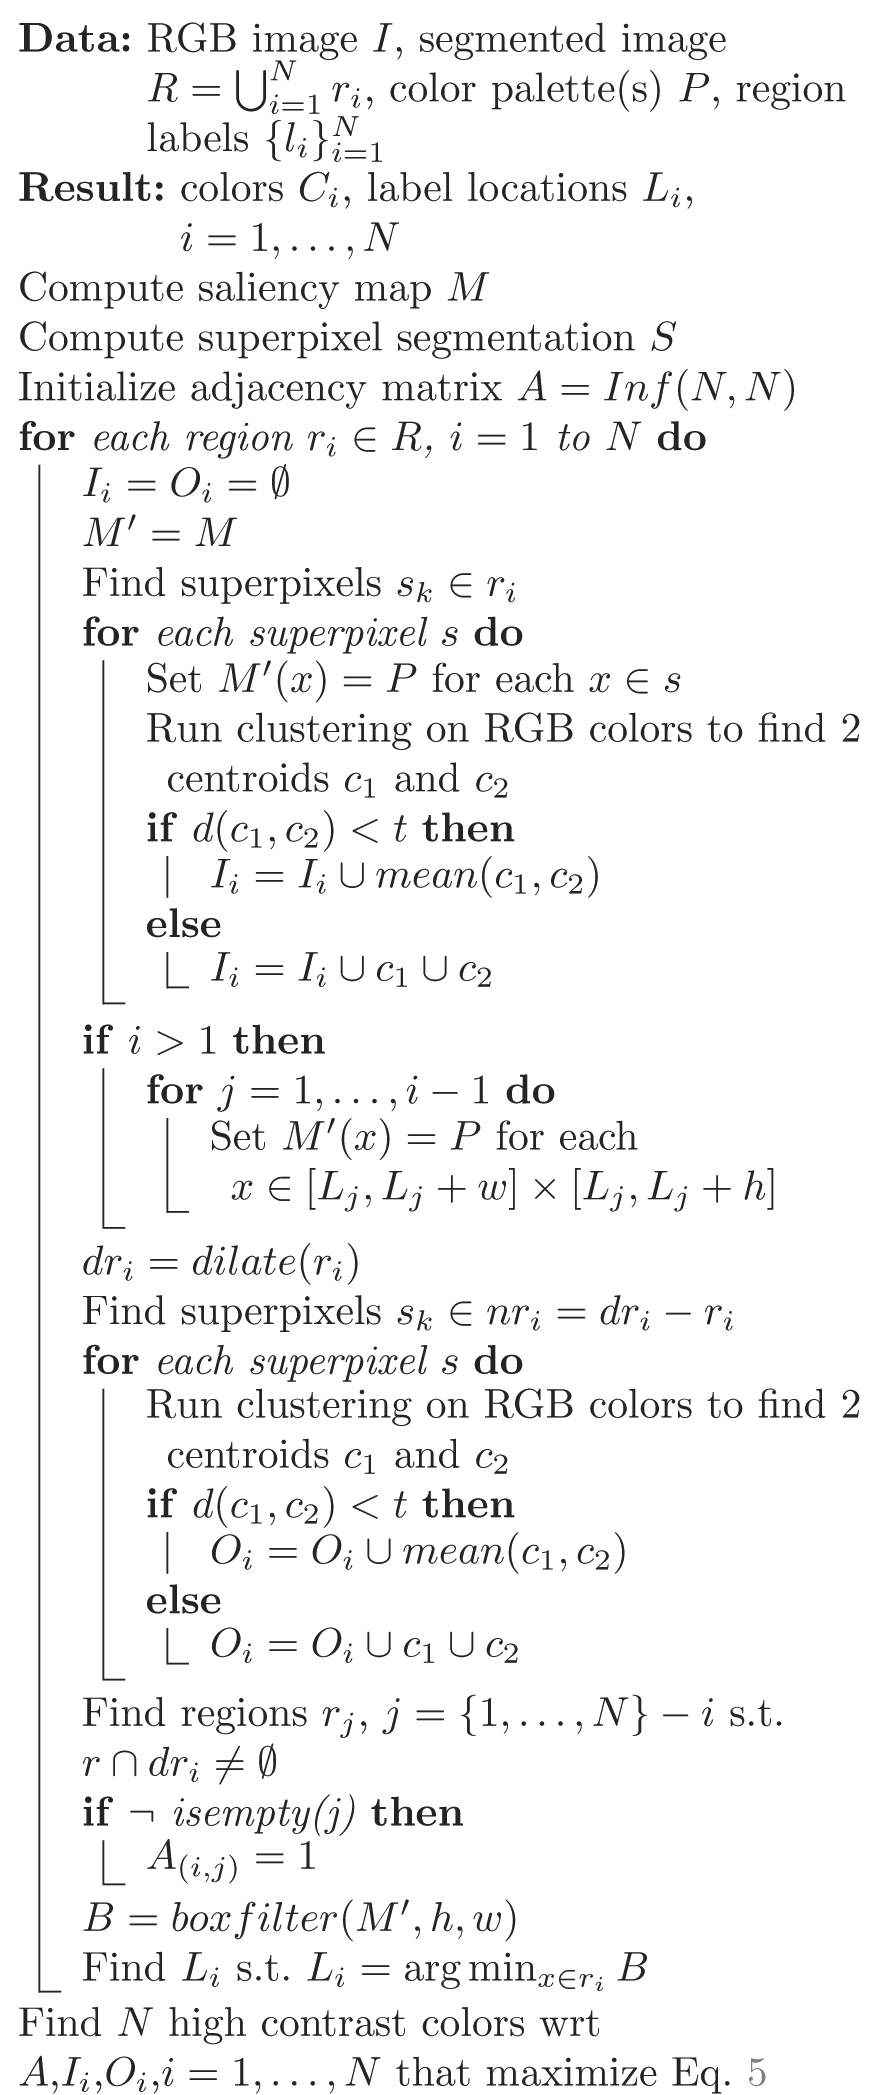
Pseudo-code of the algorithm implemented in the proposed system.
HCC algorithm
Given a palette
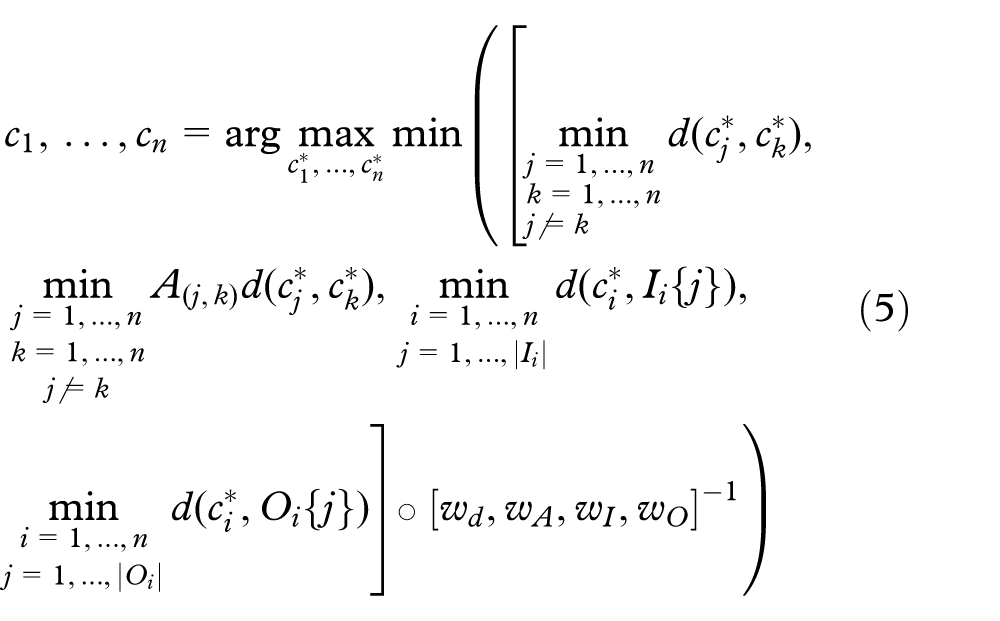
where the operator
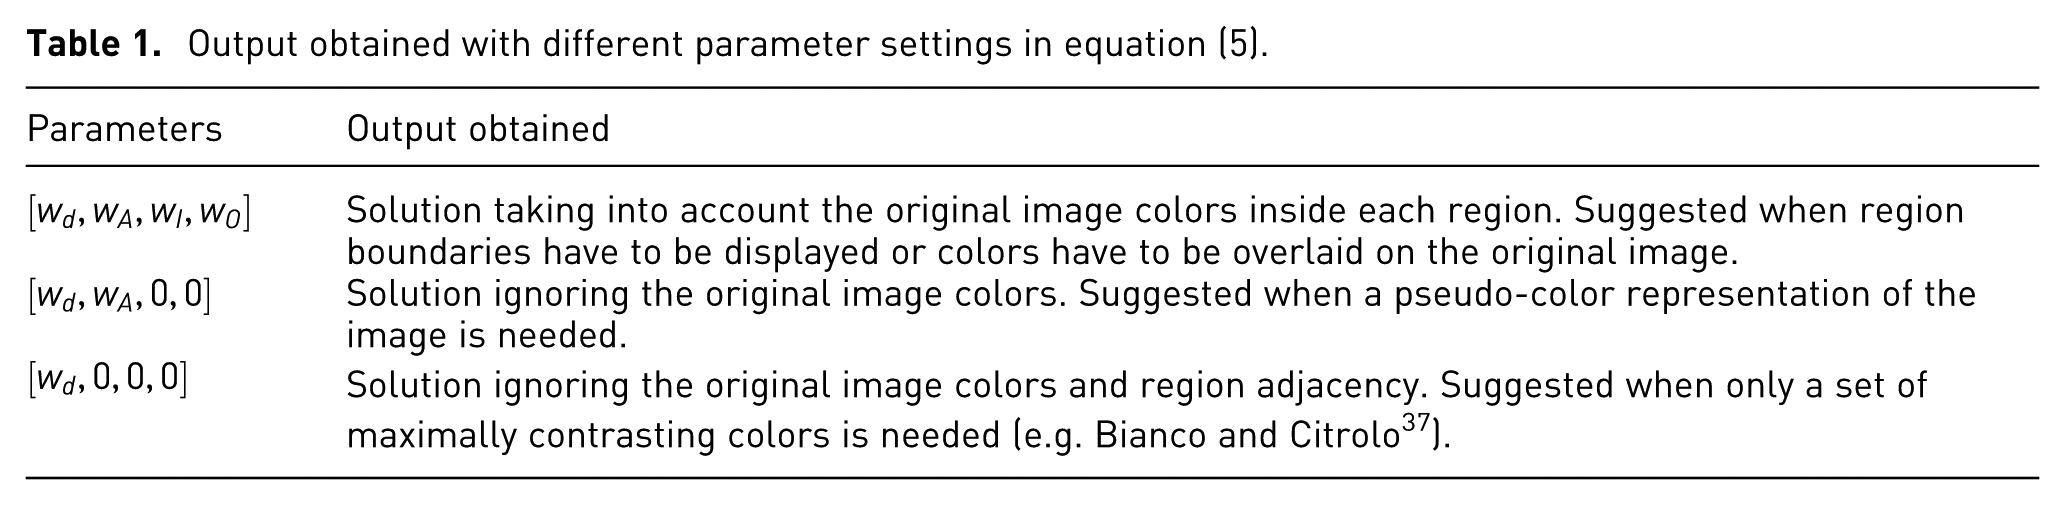
Some of the possible outputs are reported in Figure 1. They are obtained by acting on the weights
Output obtained with different parameter settings in equation (5).
The optimization problem is solved with the LS procedure introduced in Bianco and Citrolo. 37 The LS procedure is based on the concept of neighborhood, which is defined as follows

In this work the 1-neighborhood
Experimental results
The proposed method can work with any color palette having any cardinality, described in any color space given that a color distance is defined. The default color palette is the Munsell Atlas which contains over 1300 colors. This choice is due to the fact that the classified images may not only be displayed on the screen but also printed. Since the gamuts of feasible colors of common displays and color printers differ considerably, a high-contrast color coding on the screen may be drastically modified when printed. Since many colors cannot be reproduced in print, restricting the selection of color to the Munsell Atlas greatly limits this drawback. 30
Three other different color palettes
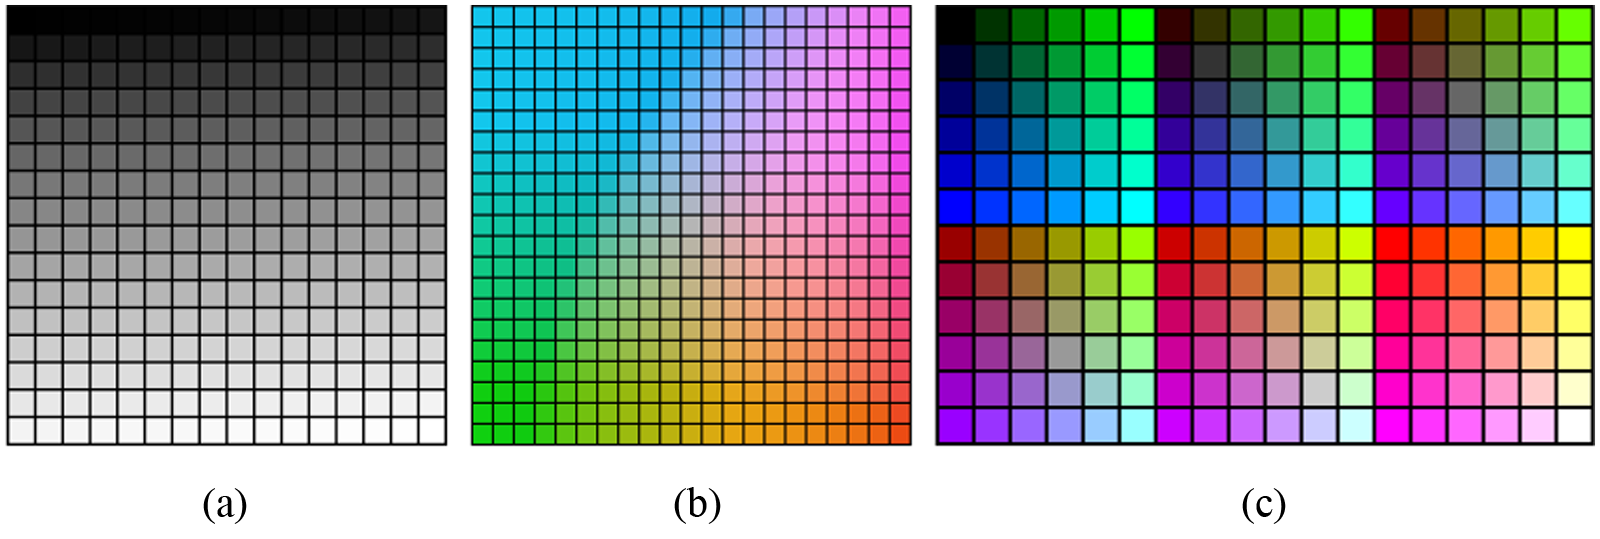
Color palettes used in this work: (a) gray-scale, (b) iso-luminance, and (c) web-safe.
We report in Figure 4 the colors selected for the three palettes for different set cardinalities

Colors selected for the three palettes for different set cardinalities
Some example results taking into account the image spatial layout and color-class associations are reported for different application domains: Pascal VOC 2012 segmentation challenge,
39
texture classification, images annotation, and webpage layout segmentation. For all examples, the distance
Concerning the superpixel segmentation, the threshold
In Figure 5 for each example, we report the original image, its segmentation with number overlaid representing the class id, and different proposals: the results using the gray-scale and iso-luminance palettes (with
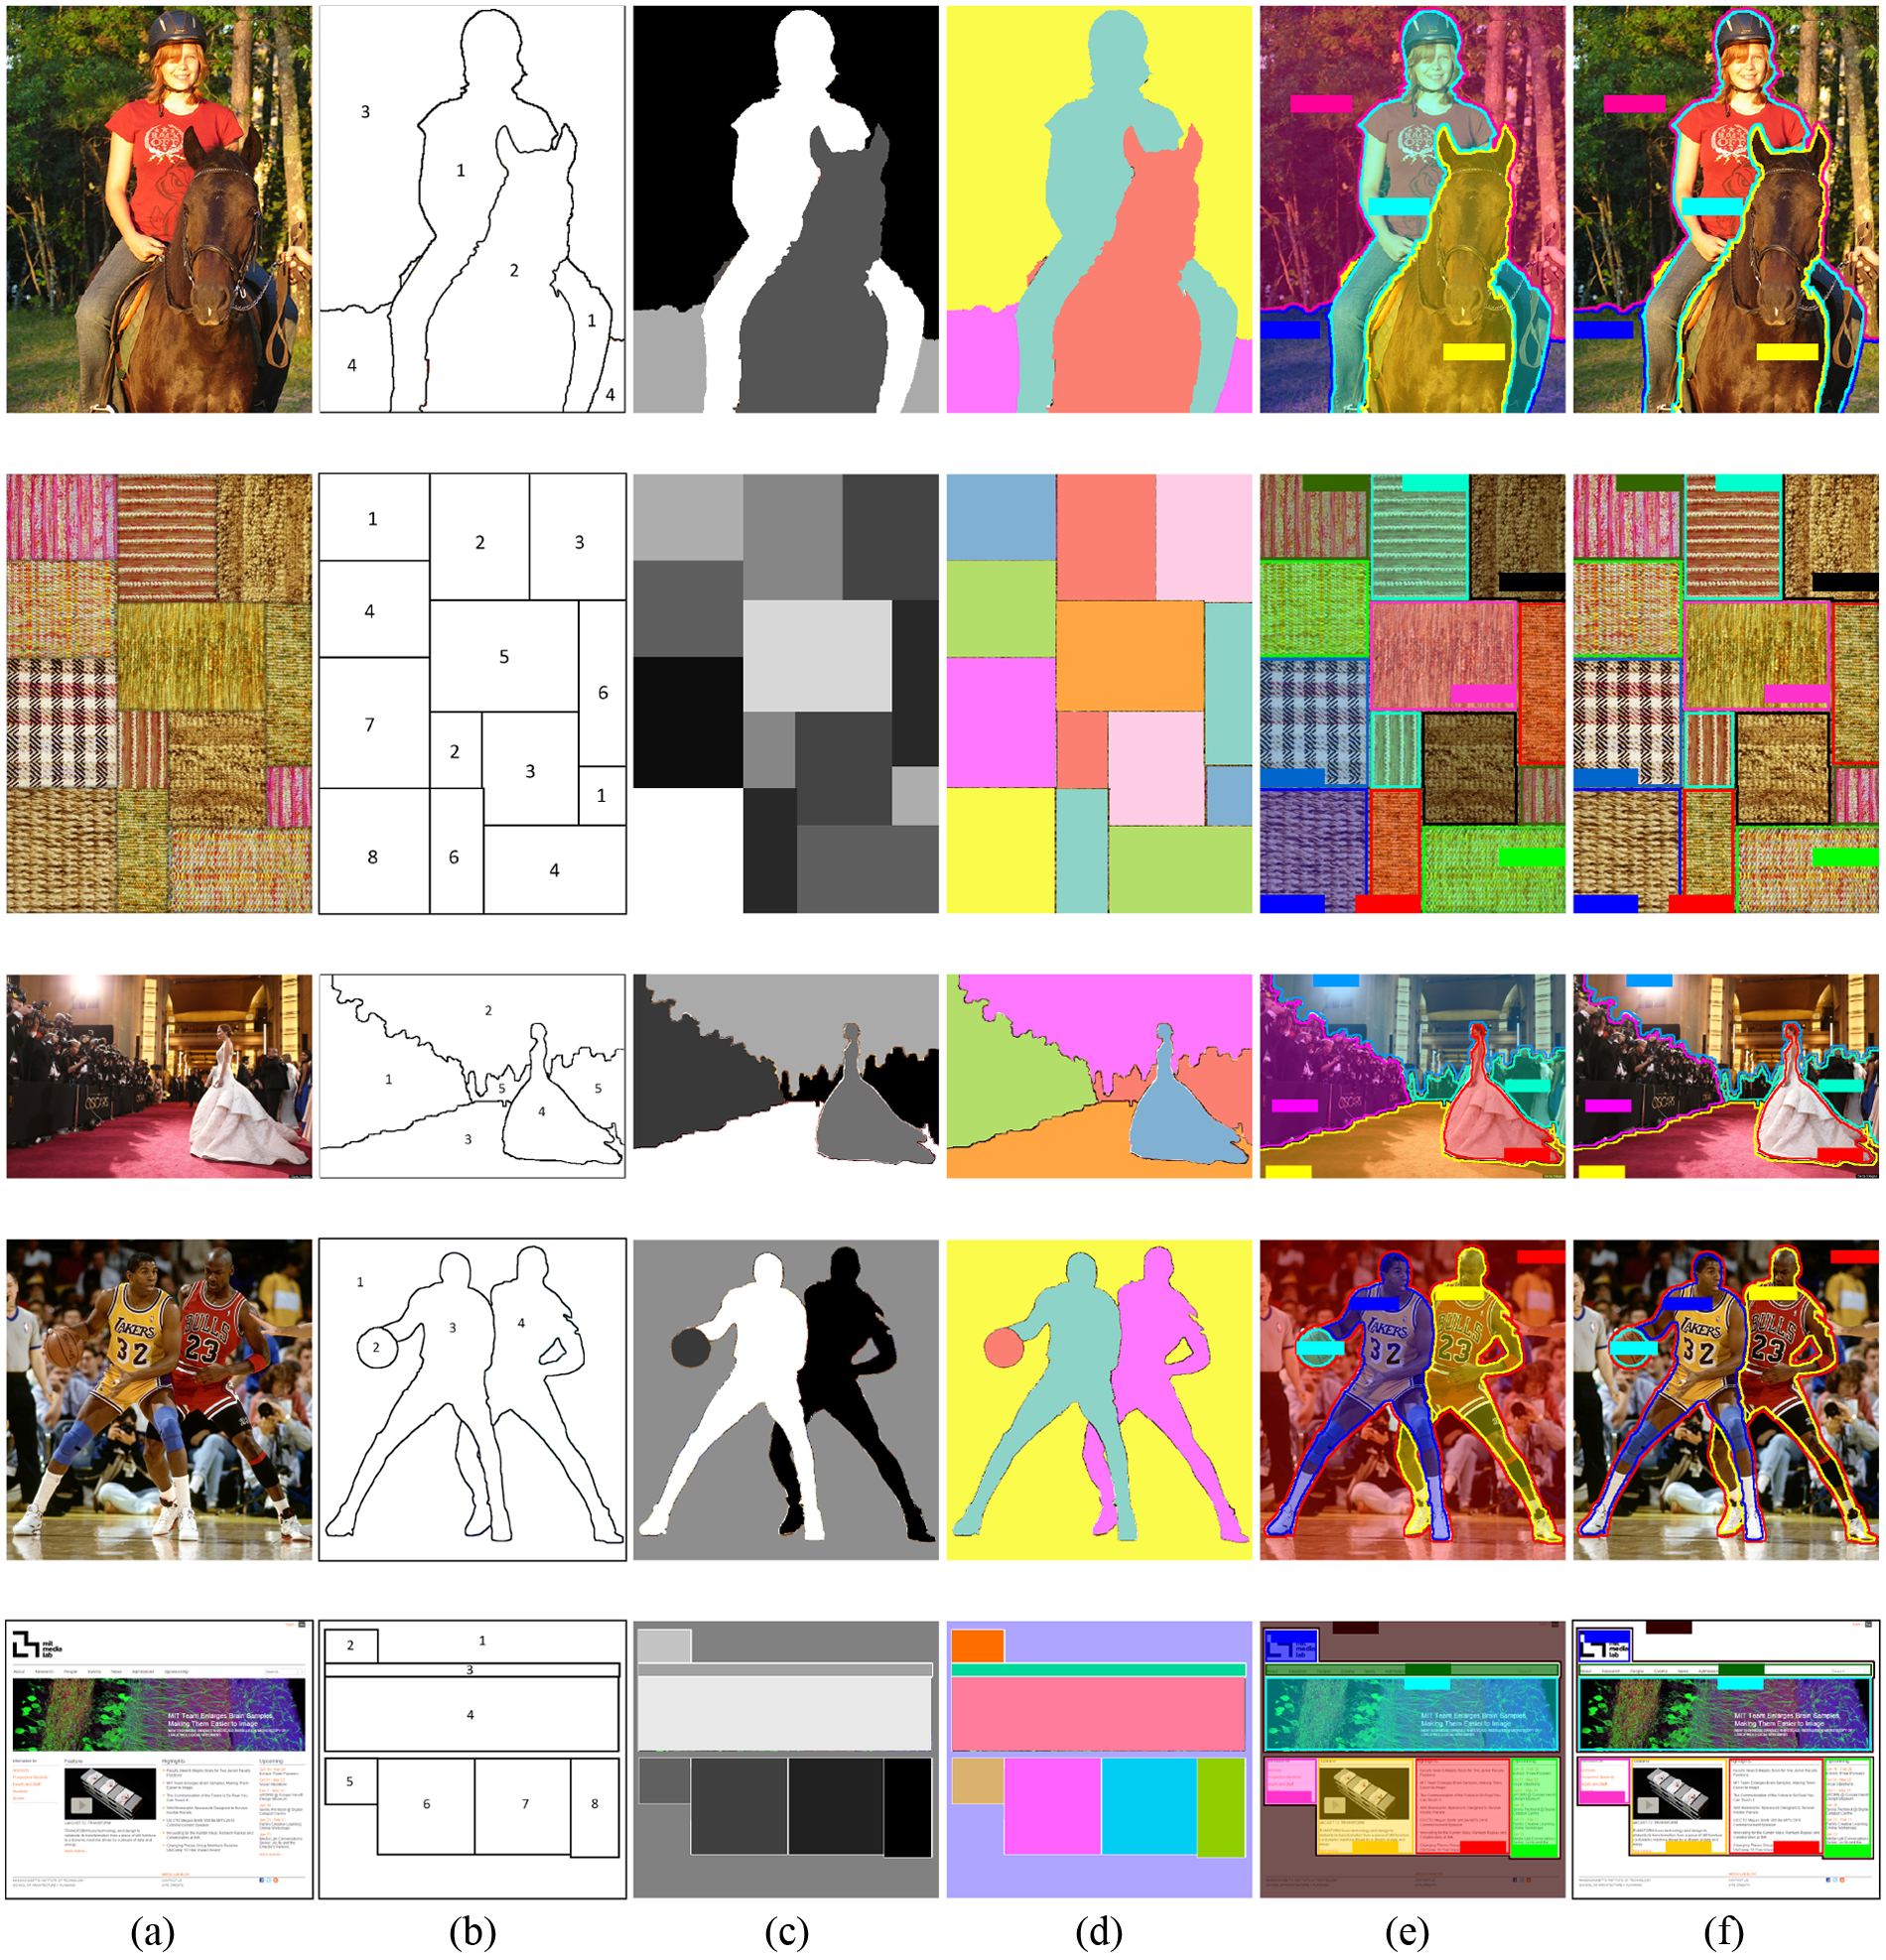
Examples of results obtained by our method: (a) original image, (b) its segmentation with overlaid region identification numbers, pseudo-color results using the (c) gray-scale palette and (d) iso-luminance palettes, and region boundaries (e) with and (f) without overlaid colors using the web-safe palette (both with labels overlaid).

RAGs of the images reported in Figure 5.
In Figure 7, we report the chromaticity plane of the CIELab color space showing the position of the chosen colors with respect to image colors for the first image in Figure 5 using the web-safe palette. The image colors
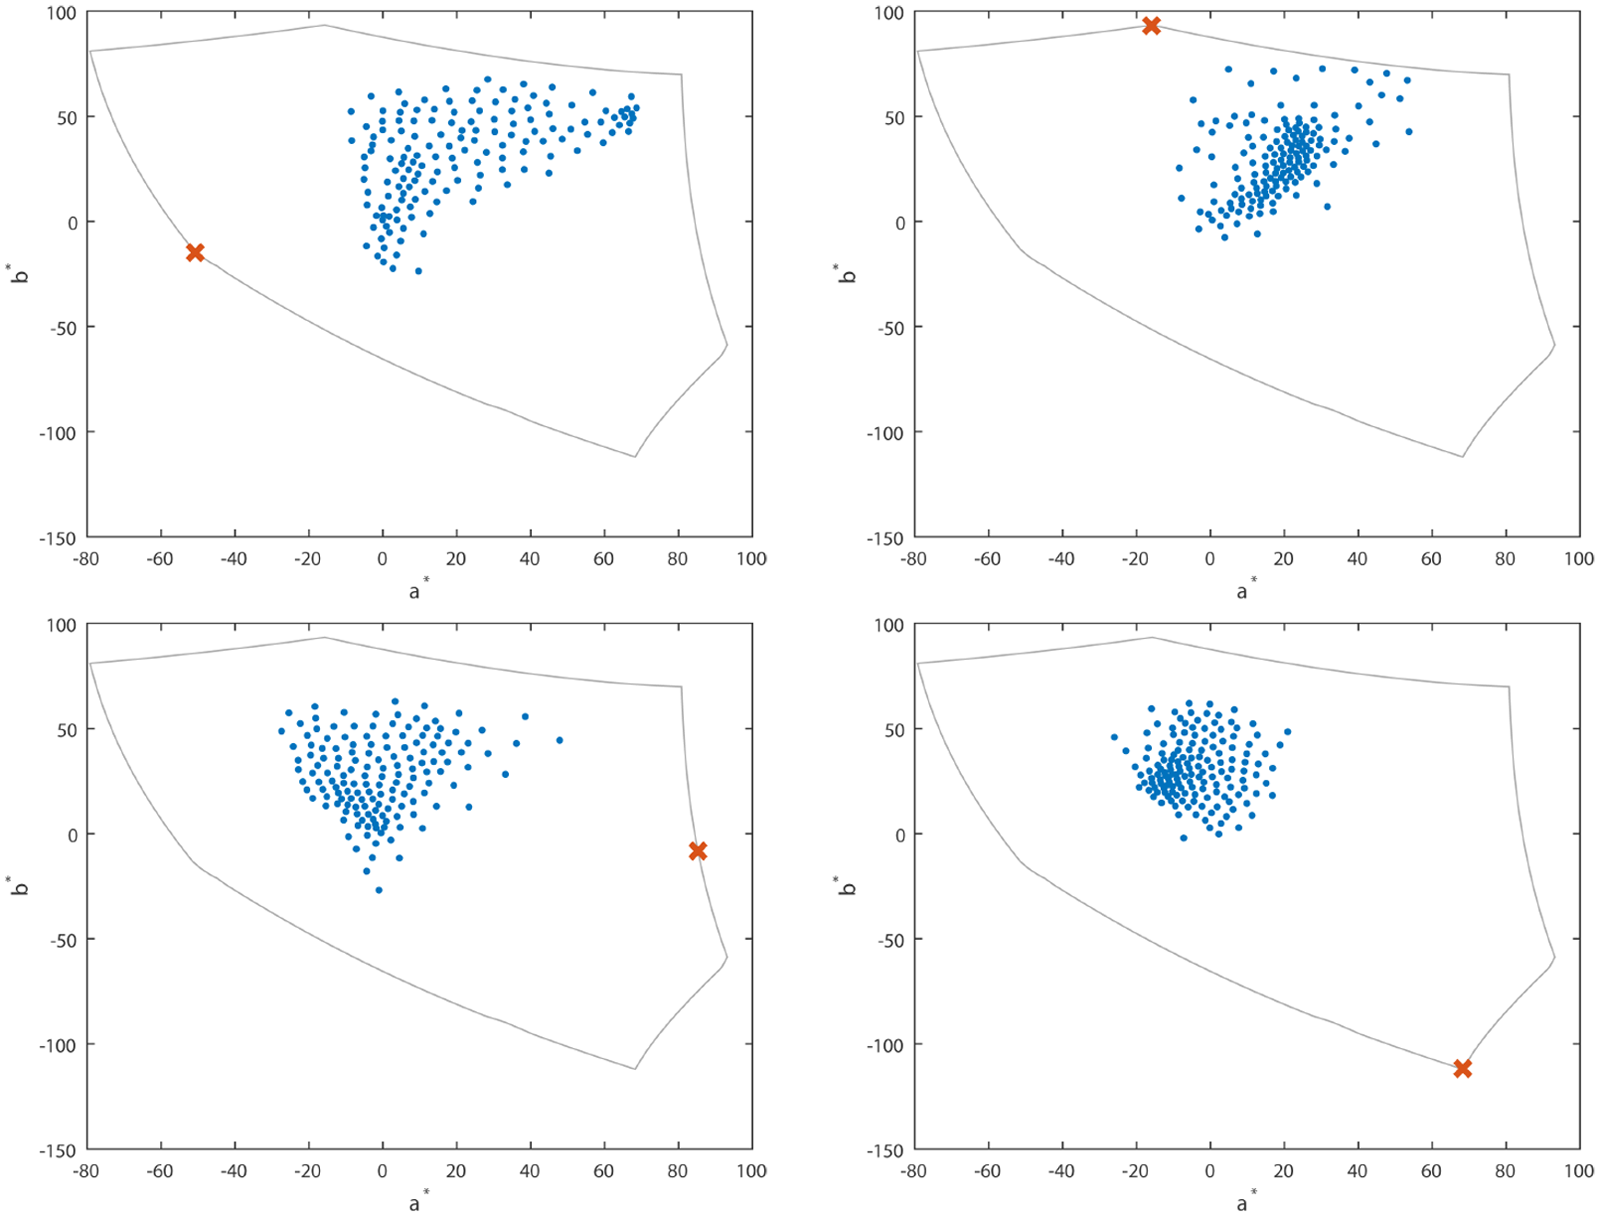
Chromaticity plane of the CIELab color space showing the position of the chosen colors with respect to image colors for the first image in Figure 5 using the web-safe palette. Image colors
Finally, we numerically compare the results obtained by the proposed algorithm with those obtained by two alternative solvers to the LS proposed in this article: the first one is a color selection and placement solution obtained by multiple random selections; the second one is based on GAs that are often used to solve high-contrast color selection problems.
26
Concerning random selection, we performed 1,000,000 random independent runs and report the results of both the best solution found and the average solution. Concerning GA, we performed 100 independent runs with 200 individuals each and report the results of both the best solution found and the average solution. The results are reported both in terms of fitness and in terms of the four elements of which it is composed of: the distance between colors
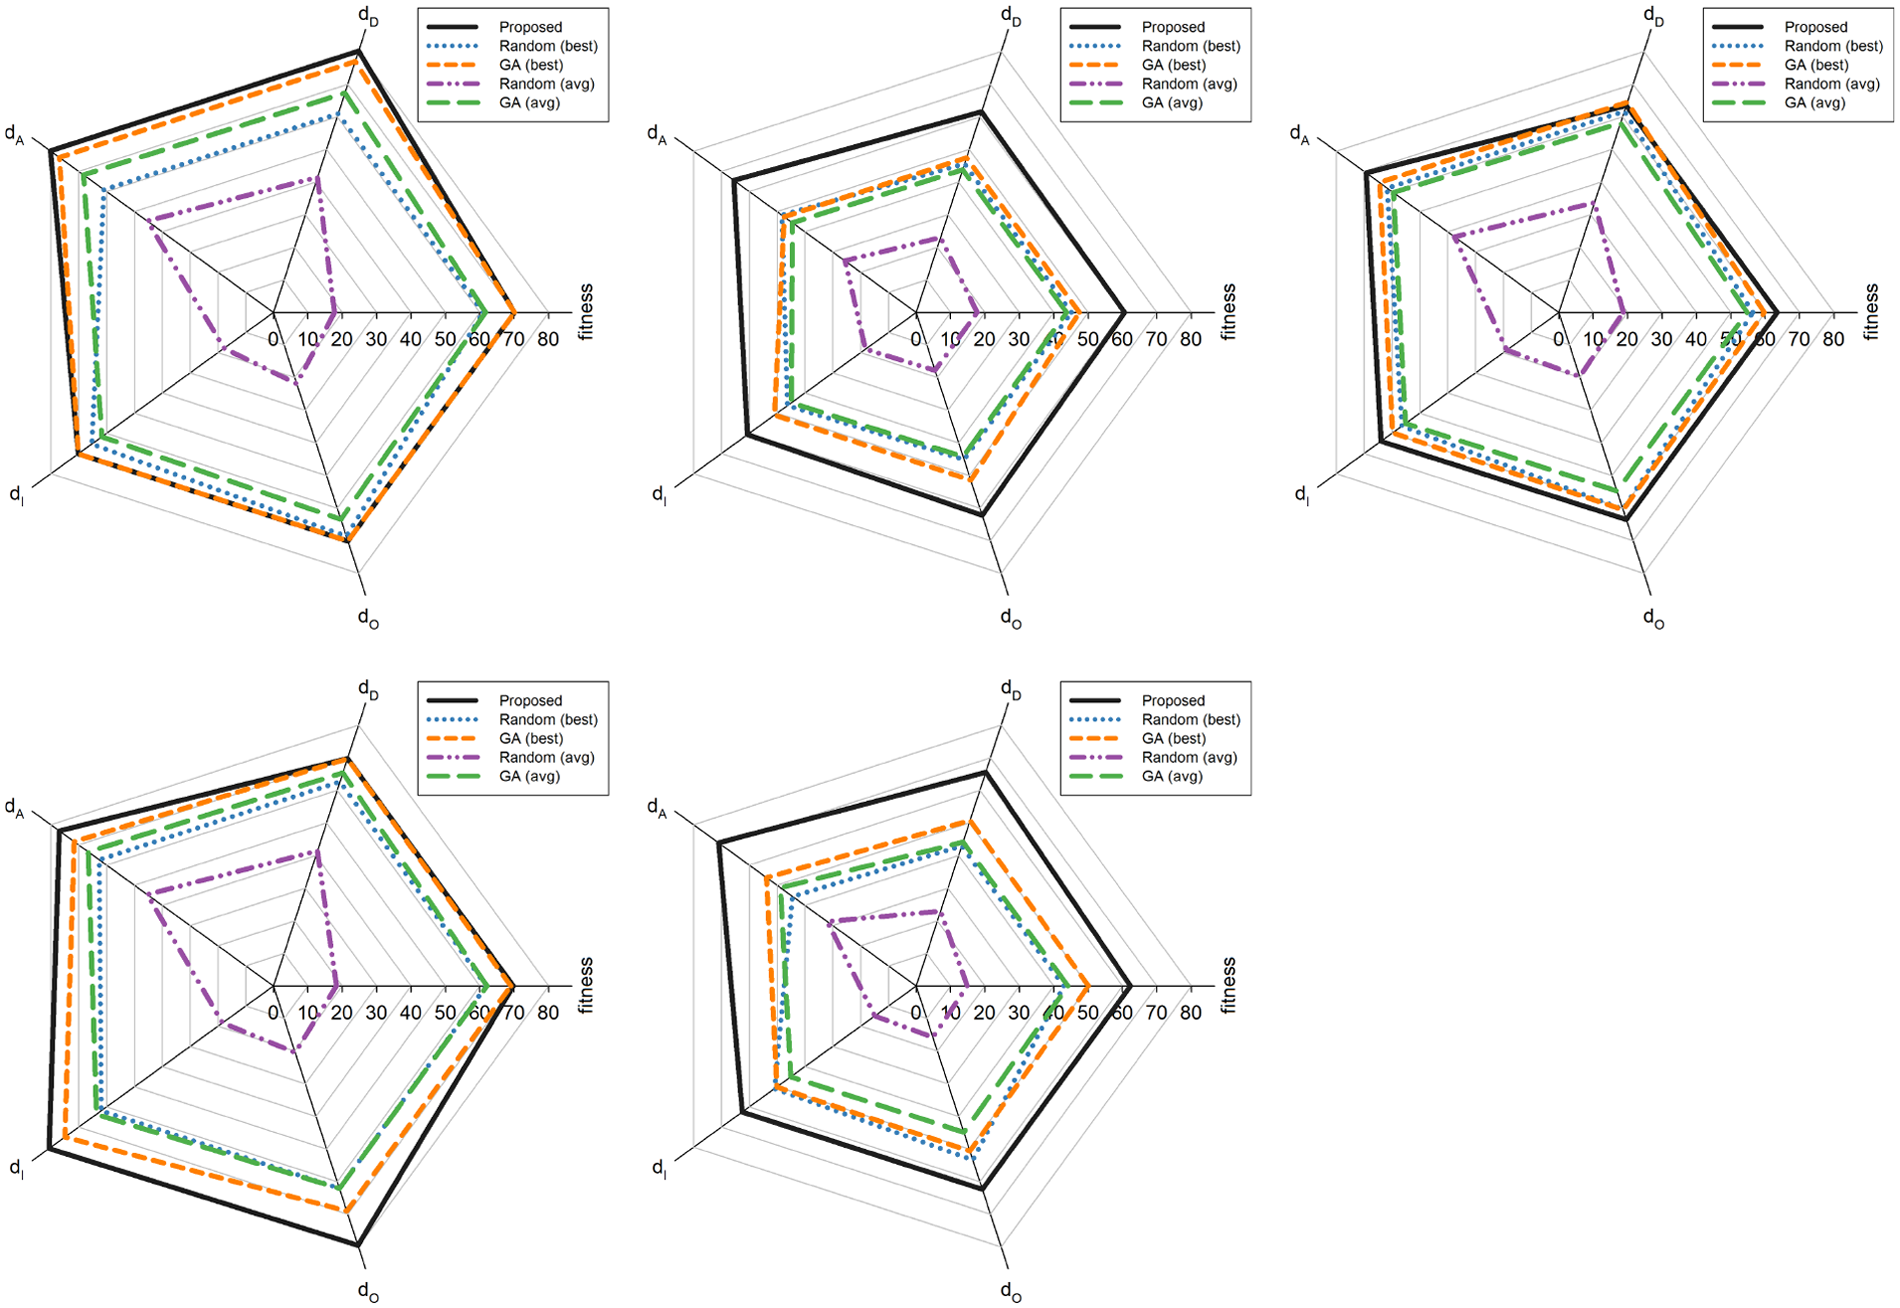
Radar plot visualizations of the fitness values and the four terms of which it is composed, obtained by the random selection (red) and the proposed method (blue) on the five images in Figure 5. For the random selection, the higher fitness over 1000 independent runs is reported.
Comparison of fitness values obtained in terms of CIELab

GA: genetic algorithm.
For the random selection, the higher and the average fitness over 1,000,000 independent runs are reported. For the GA selection, the higher and the average fitness over 100 independent runs with 200 individuals each are reported.
Comparison of execution times for the random selection, the GA selection, and the proposed method on the five images in Figure 5.

GA: genetic algorithm.
For the random selection, the average and total time for 1,000,000 independent runs are reported. For the GA selection, the average and total time for the 100 independent runs with 200 individuals each are reported.
To test the robustness of the proposed method to the initialization, 100 independent runs are performed with random initialization. The radar plots of the solution obtained with the proposed initialization and the average solution obtained with random initialization are reported in Figure 9. The average drop in performance using a random initialization is less than 6.5%, which is one order of magnitude lower than the one that we have passing from the best random solution to the average random one (i.e. 66.8%), and almost half of the one that we have passing from the best GA solution to the average GA one (i.e. 10.0%). Furthermore, even with random initialization, the results obtained by the proposed method are on average almost 4.4% better than those obtained by the best GA solution, confirming the robustness of the proposed method to the choice of the initial conditions.

Radar plot visualizations of the fitness values and the four terms of which it is composed, obtained of the proposed method with the proposed initialization (solid line) and the average solution obtained with random initialization (dashed line) on the five images in Figure 5. For the random initialization, the average values over 100 independent runs are reported.
As a final experiment, we run the same experiments as before changing the working color space used from CIELab to CIECAM02-UCS.
42
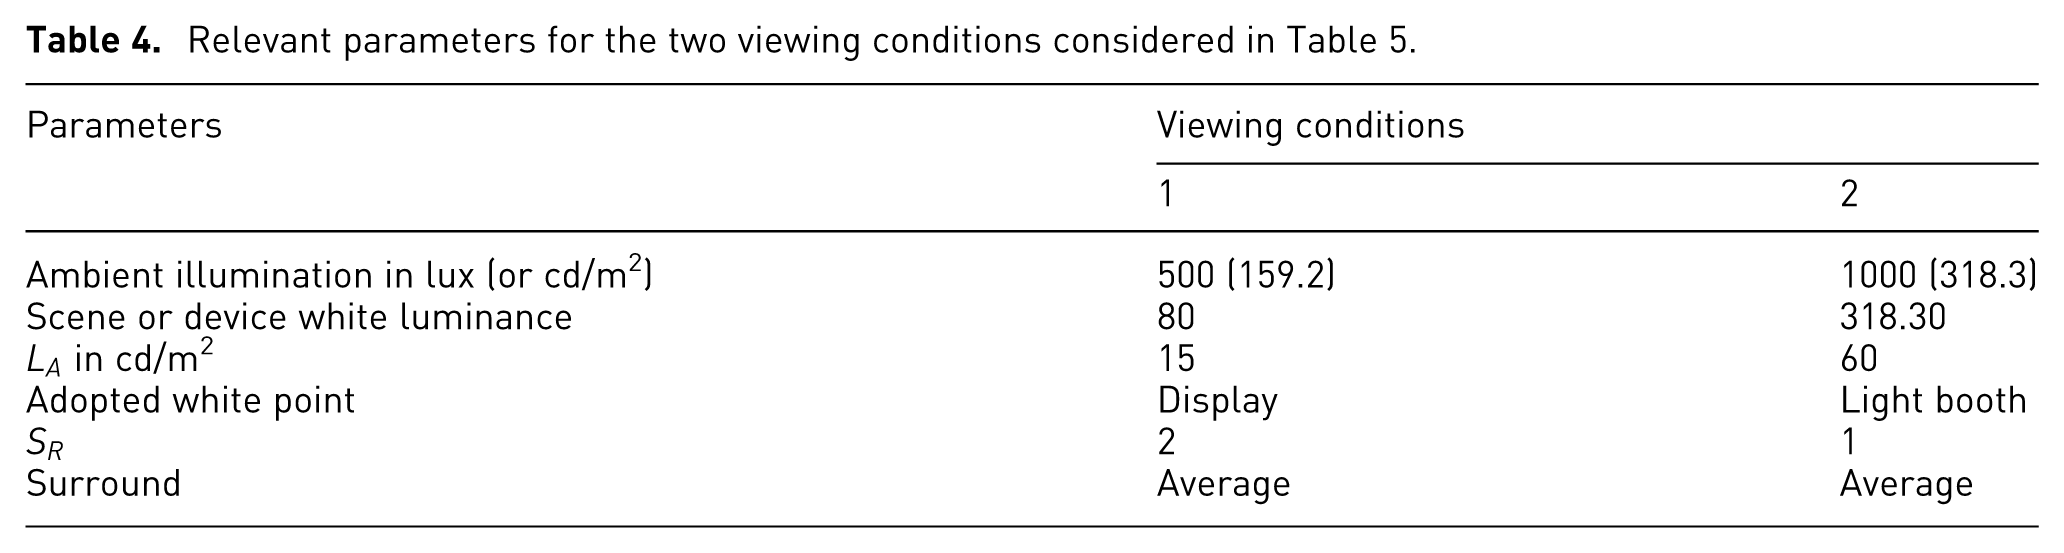
The CIECAM02-UCS is an extension of CIECAM02 that better fits both small and large color differences. As mentioned at the beginning of this section, to be properly used, CIECAM02 and its extensions require the final viewing conditions to be known and specified. We run the experiments considering two different viewing conditions: self-luminous display with CIE D65 white point under office illumination and print evaluation in a light booth under CIE D50 standard illuminant. The relevant parameters of both the viewing conditions are reported in Table 4. The distance
Relevant parameters for the two viewing conditions considered in Table 5.
Comparison of fitness values obtained in terms of CIECAM02-UCS
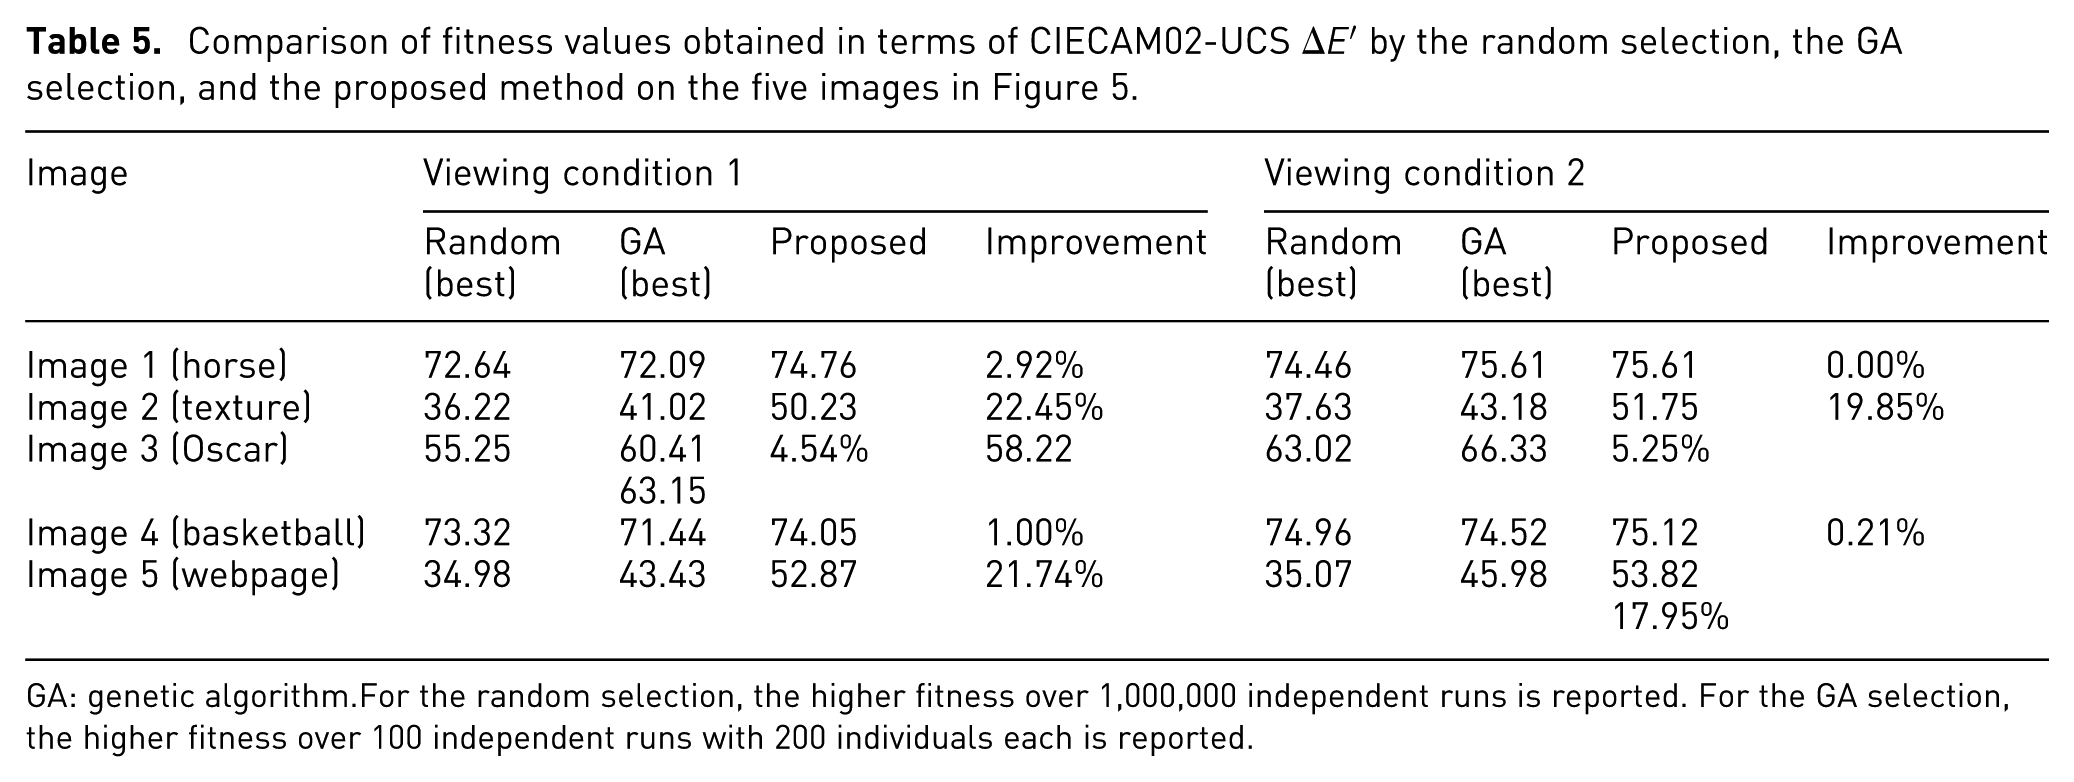
GA: genetic algorithm.
For the random selection, the higher fitness over 1,000,000 independent runs is reported. For the GA selection, the higher fitness over 100 independent runs with 200 individuals each is reported.

Colors selected for the three palettes for different set cardinalities
Conclusion
Color is pre-attentively observed and used to segment the visual environment. This characteristic makes it particularly effective in visualizing image classification and segmentation results. A problem that may arise is that we often have more items to be represented in an image than easily discriminable colors. Moreover, selecting a high-contrast color subset is only part of the solution since the colors must be assigned to the image classes and displayed together. In this article, we proposed a general purpose system that given as input a segmented/classified image automatically provides different types of outputs ranging from solutions to be used when a pseudo-color representation of the image is needed, to solutions to be used when region boundaries have to be displayed or transparent colors have to be overlaid on the original image, specifically: different pseudo-color representations (obtained using different color palettes), colored region boundaries displayed on the original image, transparent colors overlaid on the original image, and if available, the automatic placement of the class labels. Both the color selection and class-color association are formulated as an optimization problem and heuristically solved using a LS procedure. Experimental results show the effectiveness of the proposed method on images having different content and different number of annotated classes. Results are compared with the best solution obtained in 1000 independent random selections, showing an average improvement of 51.6% in the fitness values. Finally, we also included a method for the automatic placement of class labels on the image exploiting an image description in terms of saliency.
The proposed system is available at http://www.ivl.disco.unimib.it/activities/cc4visual-im-class-results/ and could be used in existing image and video annotation software such as LabelMe, 9 Ilastik, 43 Sloth, 44 VATIC, 10 and iVat. 11
As future work we plan to investigate the use of a combination of different image descriptions to better identify the less prominent sub-regions of the image. We also plan to conduct a user study to investigate where users prefer to place class labels and integrate these preferences directly in the fitness function. 45 The whole system could be validated in specific use cases, for example, remote sensing where the color-class association should take into account the semantic and therefore the colors could be a priori fixed or limited to a certain portion of the gamut (e.g. we could be interested to use a particular green for fields or limit the associated color to the gamut of greens). In the actual system, it is already possible to fix one or more colors, but this functionality should be extended. The system could be further extended to include also options for visually impaired and color-blind users. We also plan to conduct a user study to evaluate the proposed system and to integrate more complex relationships among the chosen colors such as color harmony. 46
Footnotes
Appendix 1
Funding
The author(s) received no financial support for the research, authorship, and/or publication of this article.