
Abstract
In current Game Research, gaming service platforms such as PlayStation Network, Steam, and Twitch.tv represent a still poorly investigated topic. Despite the millions of monthly viewers and members, little efforts have been done to shed light on their dynamics and trends. This article aims to address such a lack by presenting the findings of an empirical inquiry guided by the key concepts of “platform” and “actor–network theory” with the support of a novel network visualization technique. Specifically, the role-playing game Dark Souls 3–related activity on Steam and Twitch.tv was collected for the first 20 days from the release (12 April–1 May 2016). Targeted data concerned several variables among which: most viewed streamers, streaming types, debating topics and reviews’ highlights on Steam (etc.) through screenshots, user-generated content, and text gathering. Data were processed and then visualized with the network-oriented software Gephi for uncovering associations and patterns in the targeted online environments. The action game The Division worked as an exploratory case study and counter-example for stressing the proposal. Although with some limitations, the visualization strategy adopted (four networks for each platform) proved to be effective in framing and communicating the results in a straightforward way. Finally, findings enlightened a phenomenon (i.e. gaming service platforms), that is, getting increasingly central in digital entertainment, and might inform further investigations with alternative designs and focuses.
It can be argued that visualization techniques are slowly taking a foothold in game analysis. Relevant efforts have been done in harnessing this approach for better understanding playing audiences and deepening data from logging software, web analytics, and other qualitative/quantitative inquiries. Aside from the academic attention to such an opportunity, also private companies are increasingly involved in this challenge as proven by Xsolla and Quantic Foundry. Broadly speaking, visualization can be interpreted as a strategy aimed to shed light on dense and blurry phenomena. Its objective is to capture a meaning that is puzzling to achieve with alternative methods. Coherently, information about game behaviors, attitudes, and play styles can be collected, re-ordered, and made speak aloud with a proper visual filter. The current computational potential and the rise of big data have made this opportunity even more significant: latent patterns can be traced out by digging and clarifying large databases with few rationalized images. Accordingly, in game visualization, the focus is usually on (a) behavioral data (e.g. the most adopted weapon, number of kills), (b) the attitudinal information provided by players (e.g. game preferences, self-assessment of the experience), and (c) contextual game trends (e.g. numbers of reviews on Steam, viewers on Twitch.tv). The last category is probably the least unfolded due to the complexity of the related platforms involved, which proved to be demanding to explore independently from visualization prerogatives. Therefore, little efforts have been done in studying and researching gaming service platforms—that is, multi-function online environments that allow users to experience digital games beyond the mere play—like Twitch.tv, Steam, and PlayStation Network (for exceptions see Gandolfi, 1 Milner 2 and Sifa et al. 3 ). However, their relevance in the current game culture is remarkable in terms of audiences involved (e.g. Twitch.tv and Steam have millions of users) and policies applied, which go beyond the mere boundaries of a sectorial niche. Digital entertainment is becoming a widespread service and such a turn advocates a proper attention from scholars, practitioners, and stakeholders.
The aim of this article is to address such a lack by presenting through a novel network visualization the results of an empirical inquiry focused on Dark Souls 3 (DS3) and the related activity on Twitch.tv and Steam. The Division (TD) will be also referred as a counter-example to problematize and stress this visualizing intervention. Case studies and grounds explored were selected for their popularity, accessibility, and mutual differences. The study’s objective was to shed light on the multiple articulations of these two platforms and sketch an integrated overview of the “metagame”—that is, the life of the game outside the game itself. 4 The consequent hypothesis is that a network layout informed with data can support a better understanding of how a ludic product lives outside its textual boundaries. Suggestions from User Game Research, Game Design, and Media Studies guide this deepening following the key concepts of “platform” 5 and “actor–network theory.” 6 Finally, Gephi software (0.9.1 version) was adopted as main visualization tool because of its network-related orientation.
The article is structured as follows: section “Visualizing gaming service platforms” regards the use of visualizations in game research and digital games as multi-faced media; section “Research design” describes the research design and the visualizing strategy chosen; section “Results” reports the results, which are deepened and problematized in section “Discussion and conclusion.” To summarize, the study uncovered relevant patterns and trends in experiencing gaming through the two gaming service platforms investigated. However, some limitations emerged with regard to the visualization technique deployed and future developments can be planned accordingly.
Visualizing gaming service platforms
As anticipated, visualization techniques are increasingly deployed in game analysis. Manovich 7 defines data visualization as “a transformation of quantified data which is not visual is into a visual representation” (p. 20). Addressing digital games, as argued by Drachen et al. 8
the human brain is amazingly powerful at finding patterns and correlations, so good that it often finds patterns that do not exist. We can, however, use this power to gain insight into the meaning of the telemetry data being collected. (p. 181)
Raw data usually include game variables, such as location, movement, kill ratio, and number of deaths. By involving specific samples of players and/or mining large datasets, the outcome could be noteworthy for understanding user experiences and gathering insights from a design perspective. Aside from the most common visualization types (e.g. charts, graphs), well-established techniques are heat-maps (that often combine level planimetry with gameplay’s variables) and tree networks.9–11 For example, the latter was used in deepening relations among gamers in Massively Multiplayer Online Role-Playing Game (MMORPG). 12 Regardless, the core component of these visualizations is always a metric, which is a quantitative measure of gameplay, business factors, or community traits. 13
Regarding the analytic concepts applied to structure a visualization, “MDA (Mechanics–Dynamics–Aesthetics) framework” 14 and “personas” were widely adopted as driving criteria of interpretation. It can be argued that the former is one of the most popular models in deconstructing games. 15 According to its structure, mechanisms (“particular components of the game, at the level of data representation and algorithms”) trigger dynamics (“run-time behavior of the mechanics acting on player inputs and each other’s outputs over time”) aimed at peculiar esthetics (“desirable emotional responses evoked in the player”) 14 (p. 2). The latter regards categorized types of players according to selected variables (e.g. playstyle, favorite weapon). 16 This framing can rely on top-down previsions (what designers/researchers expect) or game metrics collected (how the player concretely acts). By confronting these two sides, it is possible to reach a more aware picture of the ludic dynamics observed.
It is worth noting that in this overview, the aforementioned gaming service platforms are missing. Indeed, their influence is not just contextual but might affect even MDA-based reflections and the consequent personas. Within Game Studies, several scholars have addressed the “game culture” topic4,17–19 and proved that “gaming capitals”
17
(p. 31) and related spaces (e.g. forums, websites, magazines) play an important role in the perception of games. In digital entertainment, it can be argued that Twitch.tv and Steam are two of the leading platforms in terms of video streaming and purchase/community needs, respectively. As argued by Heaton,
20
visualizing
is constantly changing in response to our evolving world contexts … [referring] to visual imagery and artifacts that enable people to comprehend and deconstruct the social, political, aesthetic and cultural world they inhabit … [also] through learned behavior that unites new technologies, media and social practice. (pp. 79–80)
This assumption means a continuous attention to emerging trends, actors and processes in visualizing a targeted phenomenon, and gaming service platforms match such a description.
This switch of perspective requires a wide interpretation of video games. Although their media status is highly debated,21–23 the sector can fit into the umbrella definition of “socio-technical apparat[a] that operate a mediation with communication” 24 (p. 17). To summarize, digital entertainment and other cultural/creative industries are ruled by multiple technological, cultural, and social dynamics that are recursively tied. In such an interplay, the aforesaid gaming service platforms contribute to identity, representation, and consumption processes and can influence production and stakeholders’ policies. 25 The use of the word platform is not casual indeed. According to Gillespie, 5 media can function as computational—that is, “an infrastructure that supports the design and use of particular applications,” figurative—that is, “a metaphysical [platform] … for opportunity, action and insight,” and political—that is, a tool for political goals and debates—platforms (pp. 349–350). Therefore, they provide a range of practices with opportunities but also constraints. Pursuing this line, Twitch.tv and Steam imply specific computational and figurative features that affect users’ actions, for instance, the former frames streaming with a main screen for the performance and a secondary chat that can be filtered in several ways. Otherwise, the latter has different categories in which players can debate, upload screens and artworks, and review games. As a consequence, online discourses, user-generated content (UGC), and performances hosted are influenced, as well as their impact on game perceptions and understandings. The concept of “platform” was already used in Game Studies,26,27 yet it was not applied to current online platforms related to gaming nor empirical researches (for an exception, see Consalvo and Vazquez 28 ), and the focus was mainly on technical/hardware aspects. Conversely, in this article, the interplay between users’ activities/performing practices and ludic features is under the spotlight with the support of visualization techniques. Players are framed as active audiences,1,17,18 whose interpretations and positions within platforms’ boundaries contribute to the overall meaning of digital games.
Research design
In order to stage such an inquiry, the analysis described in these pages aims to shed light on how these platforms work toward a specific game by addressing two categories of data: game-related information (e.g. location, playing mood, characters) and platform-related information (e.g. topics of discussion, type of streaming), which are related to platform affordances. Therefore, the leading research questions become:
First research question. What are the most popular types of performance, styles of play, and streamers on Twitch.tv and how are they related?
Second research question. Similarly, what are the most popular debating topics, game features, and references on Steam’s sections and how are they related?
Third research question. Are there similarities or connections between the two platforms in terms of dynamics and instruments of inquiry required?
The desired outcome of the first and second research questions is to frame the trends on these game-service environments and reflect on how it is possible to explore their structures. The third research question regards the comparison between Twitch.tv and Steam (following potential correlations rather than causalities, which are challenging to advance due to their reciprocal differences) for staging a triangulation of data and stressing the author’s assumptions.
Indeed, the hypothesis leading this article is that a visualization strategy informed by the actor–network theory (ANT) and a network layout (see below) could be supportive in heuristic terms. From an operative perspective, data visualizations are usually performed through a quantification (if the object-data are not quantified yet) and then a representation (make visual the object-data) 7 (p. 12). As claimed by Azzam et al., 29 we are referring to “a process that (a) is based on qualitative or quantitative data and (b) results in an image that is representative of the raw data, which is (c) readable by viewers and supports exploration, examination, and communication of the data” (p. 9). In this section, the three steps will be properly deepened and rationalized within the research context.
Case study, counter-example, and selected platforms
DS3
DS3 is the last exponent of the popular series started with Demon Souls in 2010 by From Software and then Namco Bandai. It could be described as an action-RPG characterized by a dark-fantasy setting and a high difficulty, which is a distinctive feature of the brand itself (the official claim is “prepare to die”). The player is asked to progress through 19 different locations improving his/her character (according to 10 initial classes and 10 attributes) and defeating several types of enemies. Ruling the game relies on a combination of dexterity with the joypad and strategic thinking, while cooperative and Player Versus Player (PVP) modalities are provided in order to make the experience easier and harder, respectively. Published in 12 April 2016, the game received the acclaim of critics (metascores of 90% (PC), 89% (PlayStation 4), and 87% (XboxONE) on http://www.metacritic.com) and players (3 million copies sold in less than 1 month according to Namco Bandai). This popularity justified its selection as a case study along with the intelligibility of the gameplay (see below for more details).
TD as a counter-example
TD was published on 8 March 2016 by Ubisoft after 3 years of development by Massive Ubisoft with the support of Red Storm Entertainment. It is a massive multiplayer online action game set in a future but realistic New York with several Role-Playing Game features. It was well assessed (metascores of 79% (PC), 80% (PlayStation 4), and 80% (XboxONE) on http://www.metacritic.com) and economically successful (according to Ubisoft, it broke several sale records and led March 2016’s charts). In this study, it functioned as an initial testing ground for the Twitch.tv-related analysis and a criterion of comparison in terms of views, posts, and reviews. It was selected because of its temporal closeness (1 month before) to DS3 and some similar features, such as RPG elements and a third-person perspective. In turn, the differences were worth as well in order to stress and problematize the inquiry. TD relies on a hub structure—that is, an increasing number of missions that can be undertake more times with and against other players—and a more complicated gameplay in terms of characteristics and equipment, while DS3 is more linear and single-player based. Therefore, the expectation was that the former’s streaming was more complex to frame and understand.
Twitch.tv
Launched in 2011 and purchased by Amazon in 2014, Twitch.tv is the leading streaming platform related to digital entertainment. In 2015, it reached the milestone of 28 million active users. 30 Users can stream live their gaming performances or watch others’ plays with a chat feature. Game-related channels are provided for a significant variety of content, from speedruns—that is, attempts to finish the game in the fastest way possible—to game-related shows. Developers and publishers are increasingly harnessing Twitch.tv for promotion and testing (e.g. Blizzard-Activision for Overwatch), while some twitchers (i.e. streamers) have reached a relevant popularity with millions of followers. In this exploration, the emphasis is on streamers’ performances rather than on related discussions by viewers.
Steam
Steam was created by Valve Inc. in 2003 and counts 12.5 million active users as of November 2015. Its structure is a combination of community, distributive, gaming, and assistance services for gamers (especially PC gaming). For the analysis, only the discussion (a sort of forum), screen (in which users upload and/or rank screenshots from the game), art (similar to the previous one but regarding other media content—e.g. drawings, GIFs (Graphics Interchange Format), memes), and review (with users’ impressions) sections of DS3’s and TD’s hubs have been considered because of their relevance (news, guides, and streaming sections are scarcely frequented, and business data do not fit into the scope of this article).
The two games were selected because of their genre—that is, action-RPG, which was proved to be successful on Twitch.tv 1 (competitive multiplayer, speedruns), and popularity, which was a predictor of a high online activity—the targeted data of this article. The open beta of TD was played by over 6 million players according to Ubisoft, 31 and DS3 was the last chapter of a popular franchise. In those months, they were among the most sold and discussed games. Twitch.tv and Steam were selected because of their centrality in gaming discourses and specific affordances. Differently from isolated forums and generalist social media, they are both suits of multiple tools and features specifically focused on digital entertainment. Therefore, they provided an opportunity to explore popular but peculiar platforms and sketch reciprocal differences by harnessing a comparative lens.
Data collection
Regarding DS3, data were manually collected from 12 April (publication date of DS3) to 1 May 2016. Each day at 12:00 p.m. (US East Coast Time), the 10 most viewed videos on Twitch.tv were recorded (three to five screenshots per streaming with the video-recording software Camtasia) in terms of performer’s name, current viewers, location (i.e. area of the game), mood (style of play), and type of performance. Concerning Steam, for the same period, the first 30 threads (and related posts) in the discussion section, the daily five most ranked screenshots, the five most ranked artworks, and the five most ranked reviews were gathered at 12:30 p.m. (US East Coast Time). The rationale of the daily ranking instead of the weekly one (an available option) was due to monitoring the dynamics day per day, while the latter list is more static and with a re-capitulatory function.
From a user perspective, these sources of information were the first to appear when DS3’s channels on Twitch.tv and Steam are accessed. The more detailed focus on the discussion section is because of its dynamicity, while other categories are based on a more stable ranking system (based on likes and preferences). Analytic and visualizing processing took place from May to August 2016. In the same period, the game was played and finished several times (PC version) by the author in order to acquire an adequate competence about its functioning. The exploratory study of TD lasted 10 days (8–18 March 2016) regarding Twitch.tv streaming, while general statistics (spectators of the 10 most viewed twitchers and number of posts and reviews on Steam) and Steam-related data were gathered until 28 March 2016. The 20-day research period after the publication was chosen because the first weeks are usually the most active for a digital game (see Figures 1–4 in next pages as an indirect demonstration). The investigation was approved and monitored by the author’s university Institutional Review Board (IRB) committee.
DS3 on Twitch.tv.

TD on Twitch.tv.

DS3 on Steam.
TD on Steam.
Data analysis
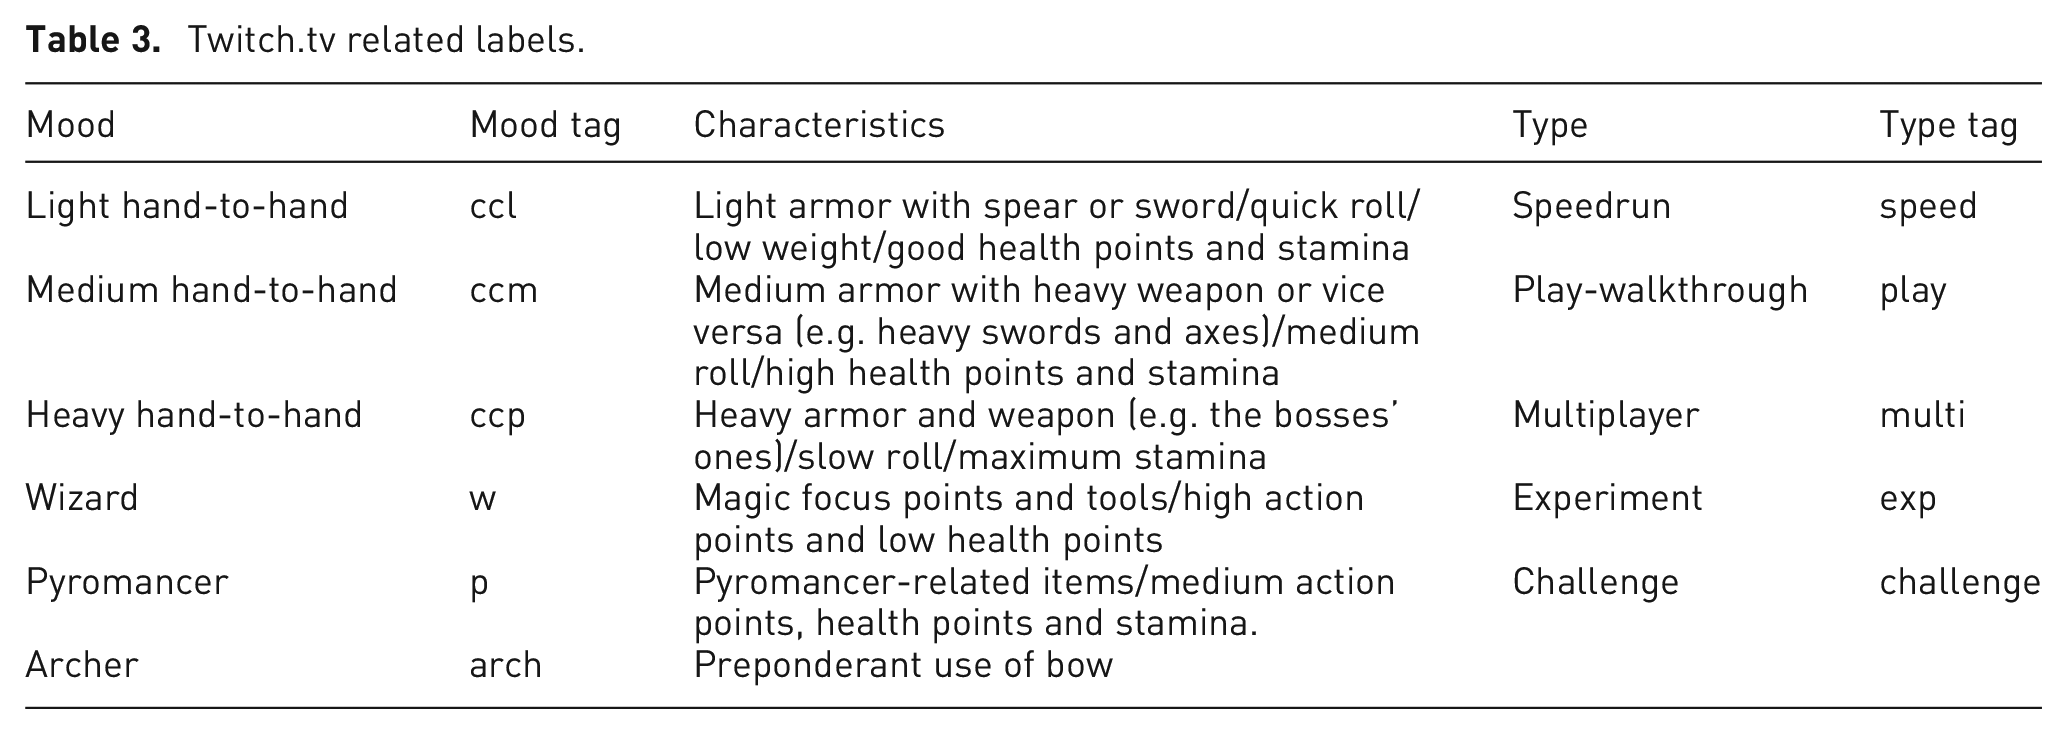
Data were grouped into four temporal units (each composed by 5 days: 12–16 April, 17–21 April, 22–26 April, 26 April–1 May) in order to sketch short-term trends. For each unit, the following analysis was directed. Concerning Twitch.tv, the five most viewed streamers, locations, play moods, and streaming types were gathered. While the first two categories are intuitive to recognize, the others are apparently more challenging to frame. Play moods concern the main style of play adopted by the performer. While it is not always possible to comprehend the specific class selected (e.g. knight, warrior, cleric) from a screenshot, it is doable to understand the core approach—that is, broader families of strategies (see Table 3 for details) adopted that can embrace one or more classes—due to avatar’s traits and equipment displayed on the screen. Conversely, the types of performance were based on Twitch.tv’s trends 1 and direct observation. They were categorized into speedrun (finishing a game as fast as possible), play-walkthrough (first experience with the game/introduction to the game), multiplayer (multiplayer play, from cooperative to competitive modalities), experiment (playing new characters/strategies), and challenge (trying to rule the game with unusual tactics/rules) (see Table 3). These labels were immediate to assign due to the performance’s titles (that usually report the type of streaming, for example, “boss speedrun,” “new game/character”) and indicators on the screen (e.g. timers for speedrunning, PVP-related elements).
About Steam, threads and related posts were processed with Nvivo v.10 software. The aim of this “discourse analysis” 32 was mainly to collect the leading “conversations”—that is, the core debating topics 32 (pp. 28–29). The first analytic labels for framing the textual content were gameplay—that is, game rules and practices—and esthetics—that is, the symbolic and representational system. This distinction echoes the influential one between “core”—that is, the interactive/agential system (from mechanics to progression systems) supporting a game—and “shell”—that is, the figurative and depictive dimension (from graphics to main plot) of a game—suggested by Mäyrä 19 (p. 17). Then, the former dimension was subdivided into mechanics (the game rules), 21 practices (actions and strategies applied by players), 4 and difficulty (the feedback system of the game in terms of progression, accessibility, and challenge). 23 In turn, the latter was articulated in setting (e.g. the world narrative), story (plot and characters), and esthetics (e.g. graphics, art). 23 Regarding contextual factors, the main categories were community (related to the playing audience), publisher (e.g. support, policies, patches), and related games (e.g. previous episodes, competitors) and cultural products (e.g. other media, non-gaming references). In the end, these tags were re-ordered and tied to the specific features of DS3 (e.g. difficulty, avatar, bosses, technical issues, Namco-Bandai’s policies). Accordingly, the coding followed a two-cycle process 33 (p. 234). First, several codes were deployed in order to map features and topics in great detail (e.g. single technical issues, references to specific fights and weapons, level design of particular areas, similarities with previous chapters), and then a thematic re-formulation was staged (e.g. difficulty, continuity) to re-group findings and make the outcome clear and concise.
The intent was guided according to three “building tasks”: (1) significance, that is, what and who is relevant; (2) practice, what activities are under the spotlight; and (3) connection, which relations between elements (e.g. traits, practices) are significant 32 (p. 102). When possible and manifest, a summarizing value was given when single threads acclaimed (+)—that is, appreciating and highlighting—or criticized (−)—that is, disapproving and complaining about—game elements: foster community (C), for example, exchanging information and tips, creating a feeling of community, and sharing; constructively address (S), that is, advancing improvements and solutions: game problems and deficiencies; and have fun about ludic dynamics (F), for example, joking about rules and characters. The reference is to the direction of the whole thread and not just the first post, which could struggle with the main orientation that leads the discussion (e.g. a negative start that generates opposite and then positive reactions). Such labels were assigned according to the orientation of the majority of posts and derived from previous researches on game-related forums. 34 The same analysis was conducted toward reviews, although their alignment was mainly + or −. In turn, screenshot and art sections were mostly measured in terms of locations, characters, and mechanics displayed due to their esthetical orientation. Their value was remarkable as well because static and dynamic pictures “do not just ‘say’ things (carry ‘messages’), but seek to do things as well” 32 (p. 57) and must be considered in a textual analysis 32 (pp. 194–195). Moreover, when possible, a summarizing value was associated with them as well (e.g. F for a comical GIF about a game mechanic). For each unit, the five most debated (overall number of related threads’ posts) topics, the five most helpful (total number of “helpful” gathered) reviews’ elements, the five most liked elements in the screenshot section, and the five most liked elements in the art one were framed. In conclusion, the objective was to collect both game data (as the one usually gathered but with the mediation of a platform) and contextual ones in multiple forms (visual, textual, metrics) in order to reach a triangulated and wider overview 35 according to platforms’ features. As mentioned above, this grounds of inquiry—comparison 34 also informed the third research question for testing and problematizing the author’s hypothesis.
Such filters (e.g. five most helpful reviews) were applied for two reasons. First, they facilitated the analysis due to the difficulties in gathering data from Twitch.tv and Steam in an automatic way. Second, they made the inquiry straightforward by focusing on the top results displayed from a user perspective. This was particularly relevant in dealing with Twitch.tv’s trends related to DS3 and TD, which were characterized by few popular streamers and then a numerous grouping of marginal ones. As a consequence, the resulting visualizations became particularly informative by removing secondary sources.
Visualization strategy
After the analysis, findings were processed with Gephi in order to build networks aimed to visualize trends and even potential relations between different categories and data entries. This software is an open-source tool developed by students of the University of Technology of Compiègne in 2008 and designed for network visualizations and cluster analysis. Briefly, its system is based on nodes (i.e. the points in a network) and edges (i.e. the undirected or directed ties that connect the nodes) than can be manipulated manually or according to specific algorithms. Gephi was selected for its flexibility and accessibility, which are proven by its widespread and multidisciplinary use in these last years. 36 The visualization strategy of the study was partially influenced by the ANT, which is a constructionist approach ideated at the beginning of Science and Technology Studies (STS).6,37 From its perspective, a network is a dynamic entity of actors and interconnections deeply intertwined rather than a group of static nodes and ties. 38 Therefore, ANT considers human, social, and material variables equal in portraying and influencing action, 39 and claims that heterogeneous elements (actors, concepts, etc.) are reciprocally defined through their associations and interplays in building meaning. Such an outcome is based on schemes of actions, affordances, and possibilities among the different actors involved in a specific situation. According to its premises, every significant actor (i.e. the so-called mediator) has an equal role in influencing the whole picture, which in turn affects its own identity. The reference is to the so-called generalized symmetry principle, which stated that ties between nodes are a network’s reiterative product rather than a static prerequisite. Furthermore, relations would be both material (among things) and semiotic (among concepts) and at the core of actors’ identity. 40 Therefore, this approach is especially pertinent in deploying preliminary investigations toward complex environments to go beneath their surfaces. To summarize, ANT is a method to uncover relations within a multi-type network. Critics have observed that ANT is characterized by contingent findings 41 and a descriptive emphasis, 42 but this possibility is not incompatible 43 with the explorative orientation of this study, which aims to combine concepts (e.g. leading topics in discussion sections) and things (e.g. streamers) and frame their connections without a well-established thesis (just a tentative list of mediators—that is, from a visualizing perspective, the nodes of the network) but considering their mutual co-existence in the targeted gaming service platforms (with more strong arguments, structured theories like social shape of technology and normalization process theory could have been adopted). ANT was used in international relations, 44 web design, 45 public transport, 46 and cyber-security, 47 often combined with qualitative methods like ethnography and qualitative interviews. However, it was scarcely harnessed in Game Studies (for an exception see Cypher and Richardson 48 and Jessen and Jessen 49 ) and to inform visualization techniques.
On the contrary, in the study depicted in this article, an ANT-oriented visualization was used to combine and relate dissimilar objects (e.g. locations, play-modes, artworks, streamers) to frame their recursive bonds instead of imposing causal interpretations. Such a hybridity of elements makes this process different from other possible approaches. For instance, social network analysis (SNA) relies on similar nodes and fixed bonds to uncover community structures, concentrations, and influences.50,51 SNA was indeed used to deepen social media52,53 and social structures54,55 with homogenous elements (e.g. twitter accounts, acquaintances), which do not match the visualizing purposes of this study—that is, enlightening and communicating the relations between different types of information in multi-function environments. Otherwise, alternative visualization strategies that could have been considered span set diagrams (ordered categories of content/artifact), image collages (combination of images), and scatterplots (for comparing two variables).56–58 Nevertheless, these techniques deal with one or few variables and mainly for merely descriptive goals or following a driving thesis (e.g. a prescriptive hierarchy). Contrariwise, ANT allows a novel visual on gaming service platforms providing the opportunity to explore their whole complexity by comparing divergent actors (from leading debating topics to most popular screenshots, from twitchers to streaming type) and reflecting on leading ties and correlations.
Regarding Twitch.tv, four networks have been developed (one for unit, manual layout, default curved): each has four families of nodes framed by color (type: blue/mood: green/twitcher; purple/location: orange) and large according to the related views. However, the node size always ranges from 8 to 48 to maintain a comparable proportion between the different units/networks (for the quantitative differences, see Figure 1 and Tables 1 and 2). The thickness of the edges depends on how many times two nodes appeared in the same streaming (e.g. style of play and type of streaming) with a stable size from 0.5 to 53.5 to preserve the comparison. These specific dimensions and proportions were chosen by the author to improve the readability of the networks and their intertwined evaluation.
Units 1 and 2 on Twitch.tv.
Units 3 and 4 on Twitch.tv.
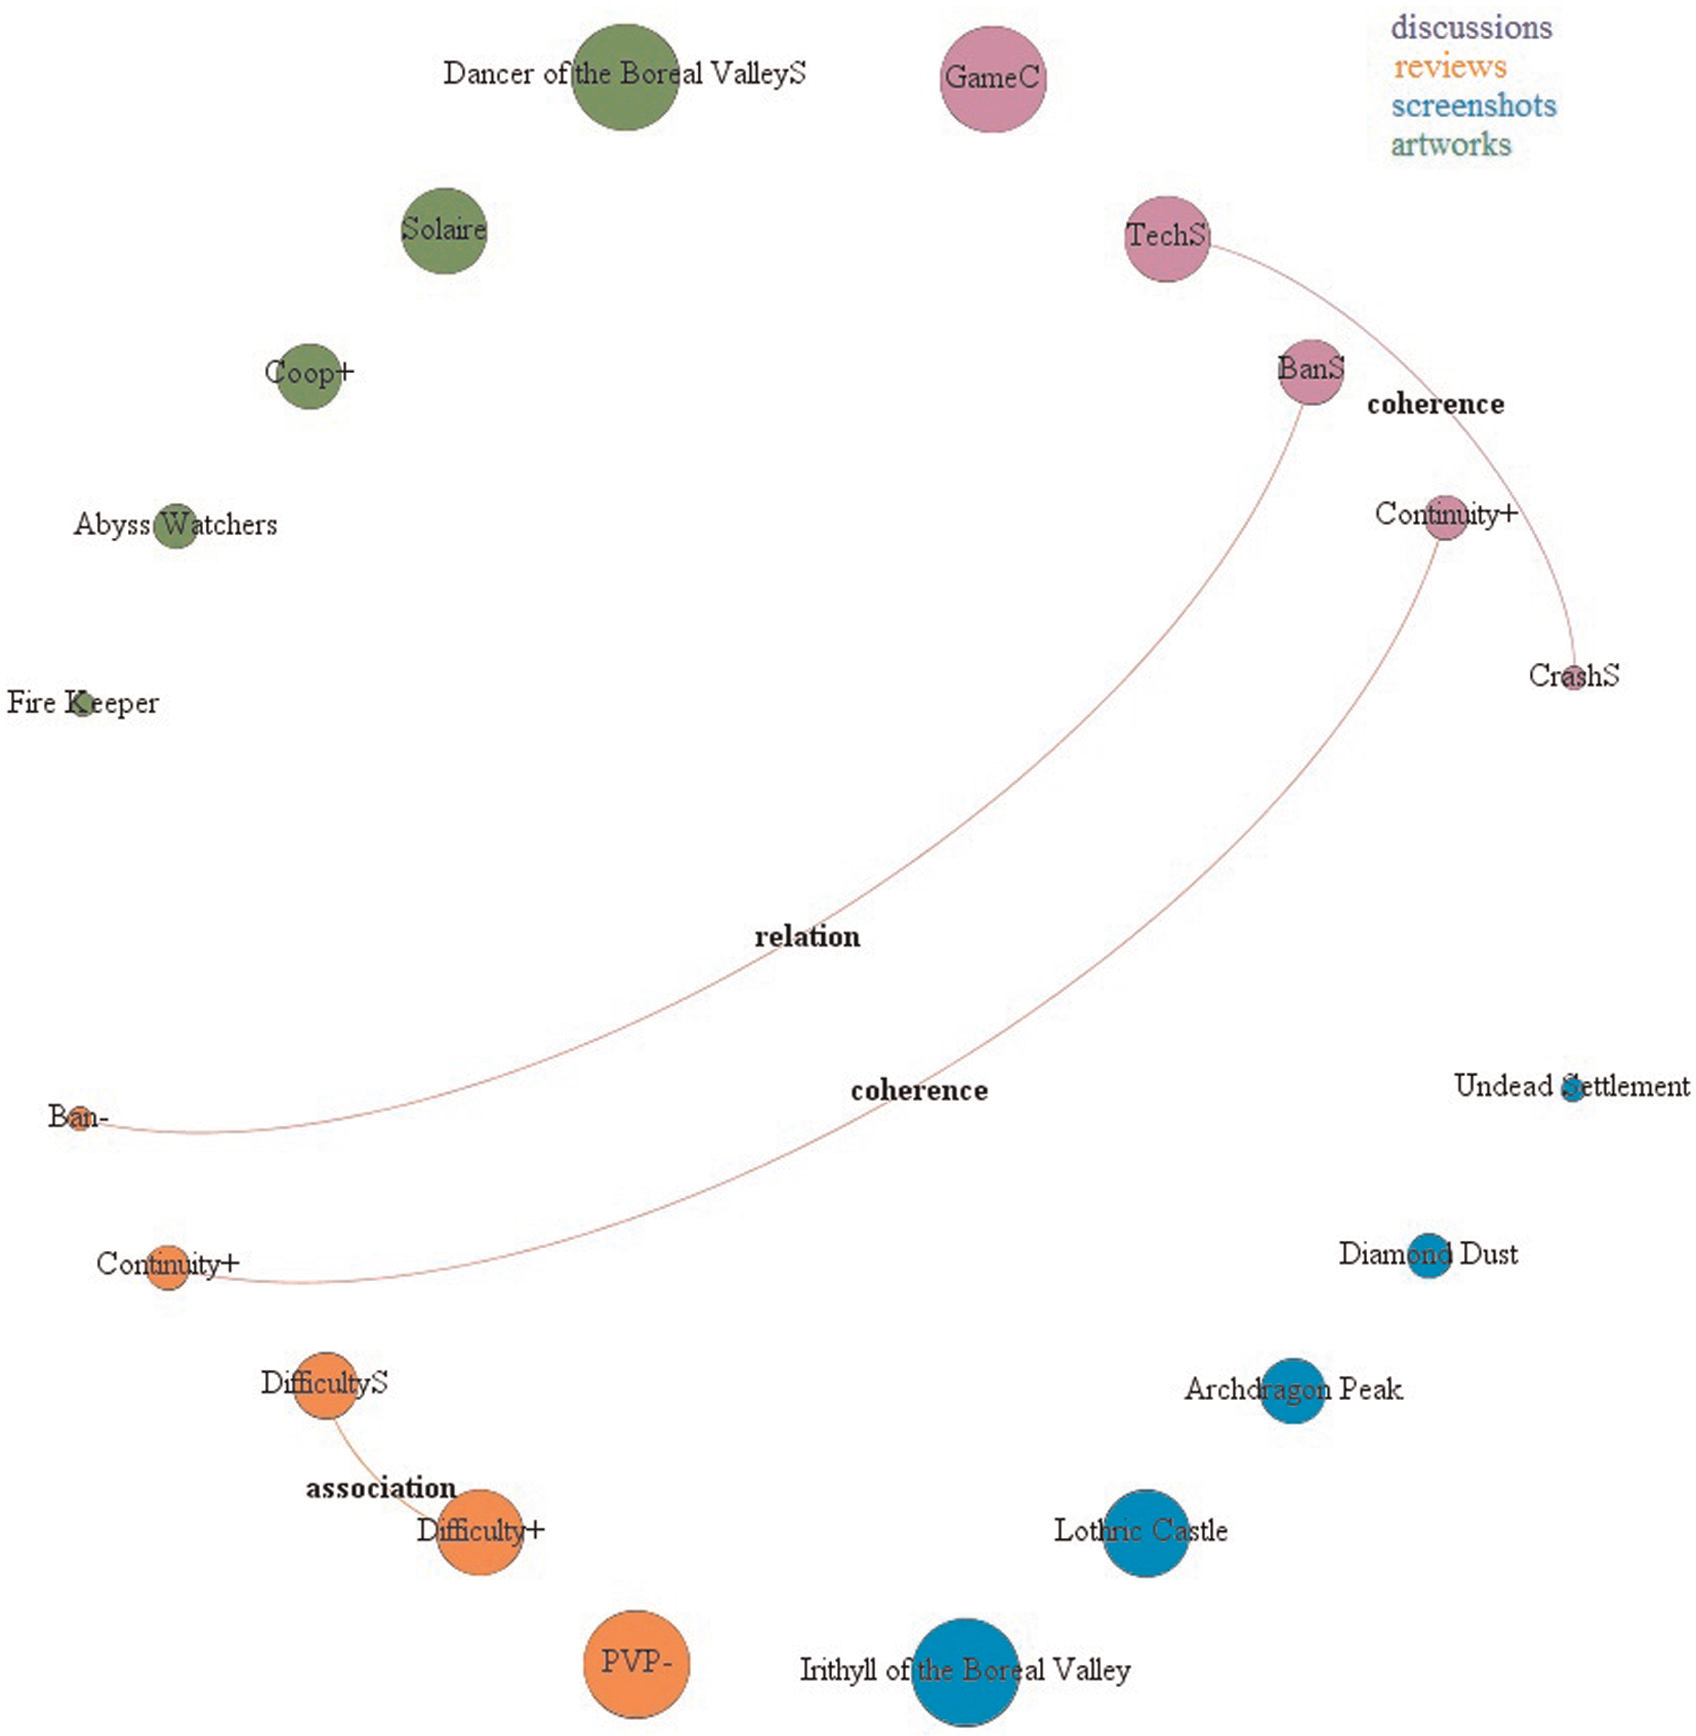
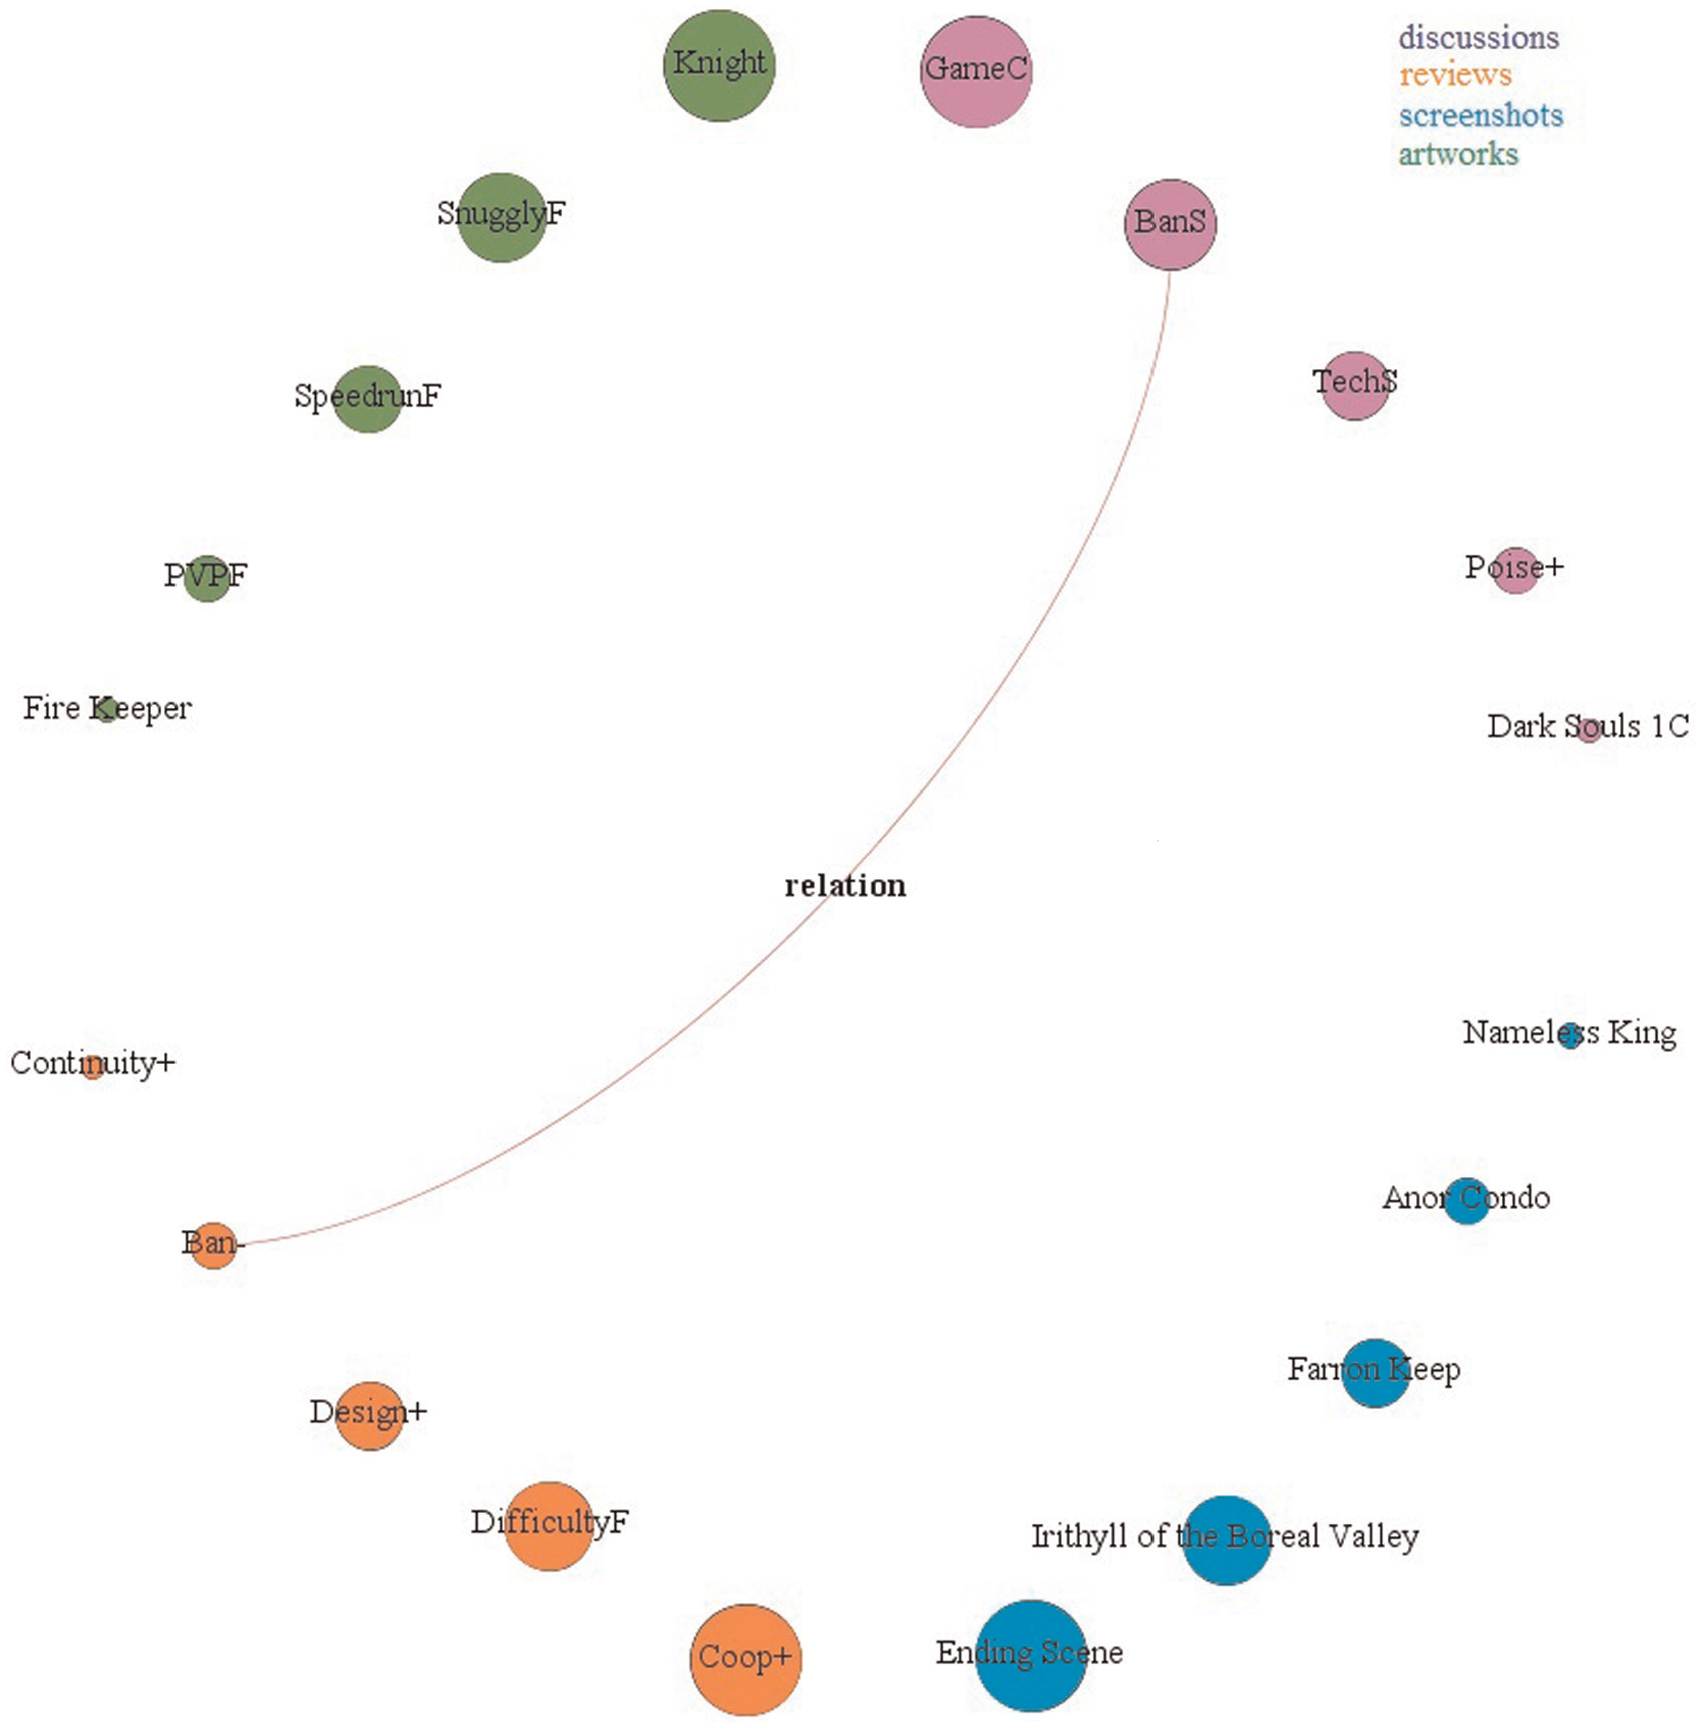
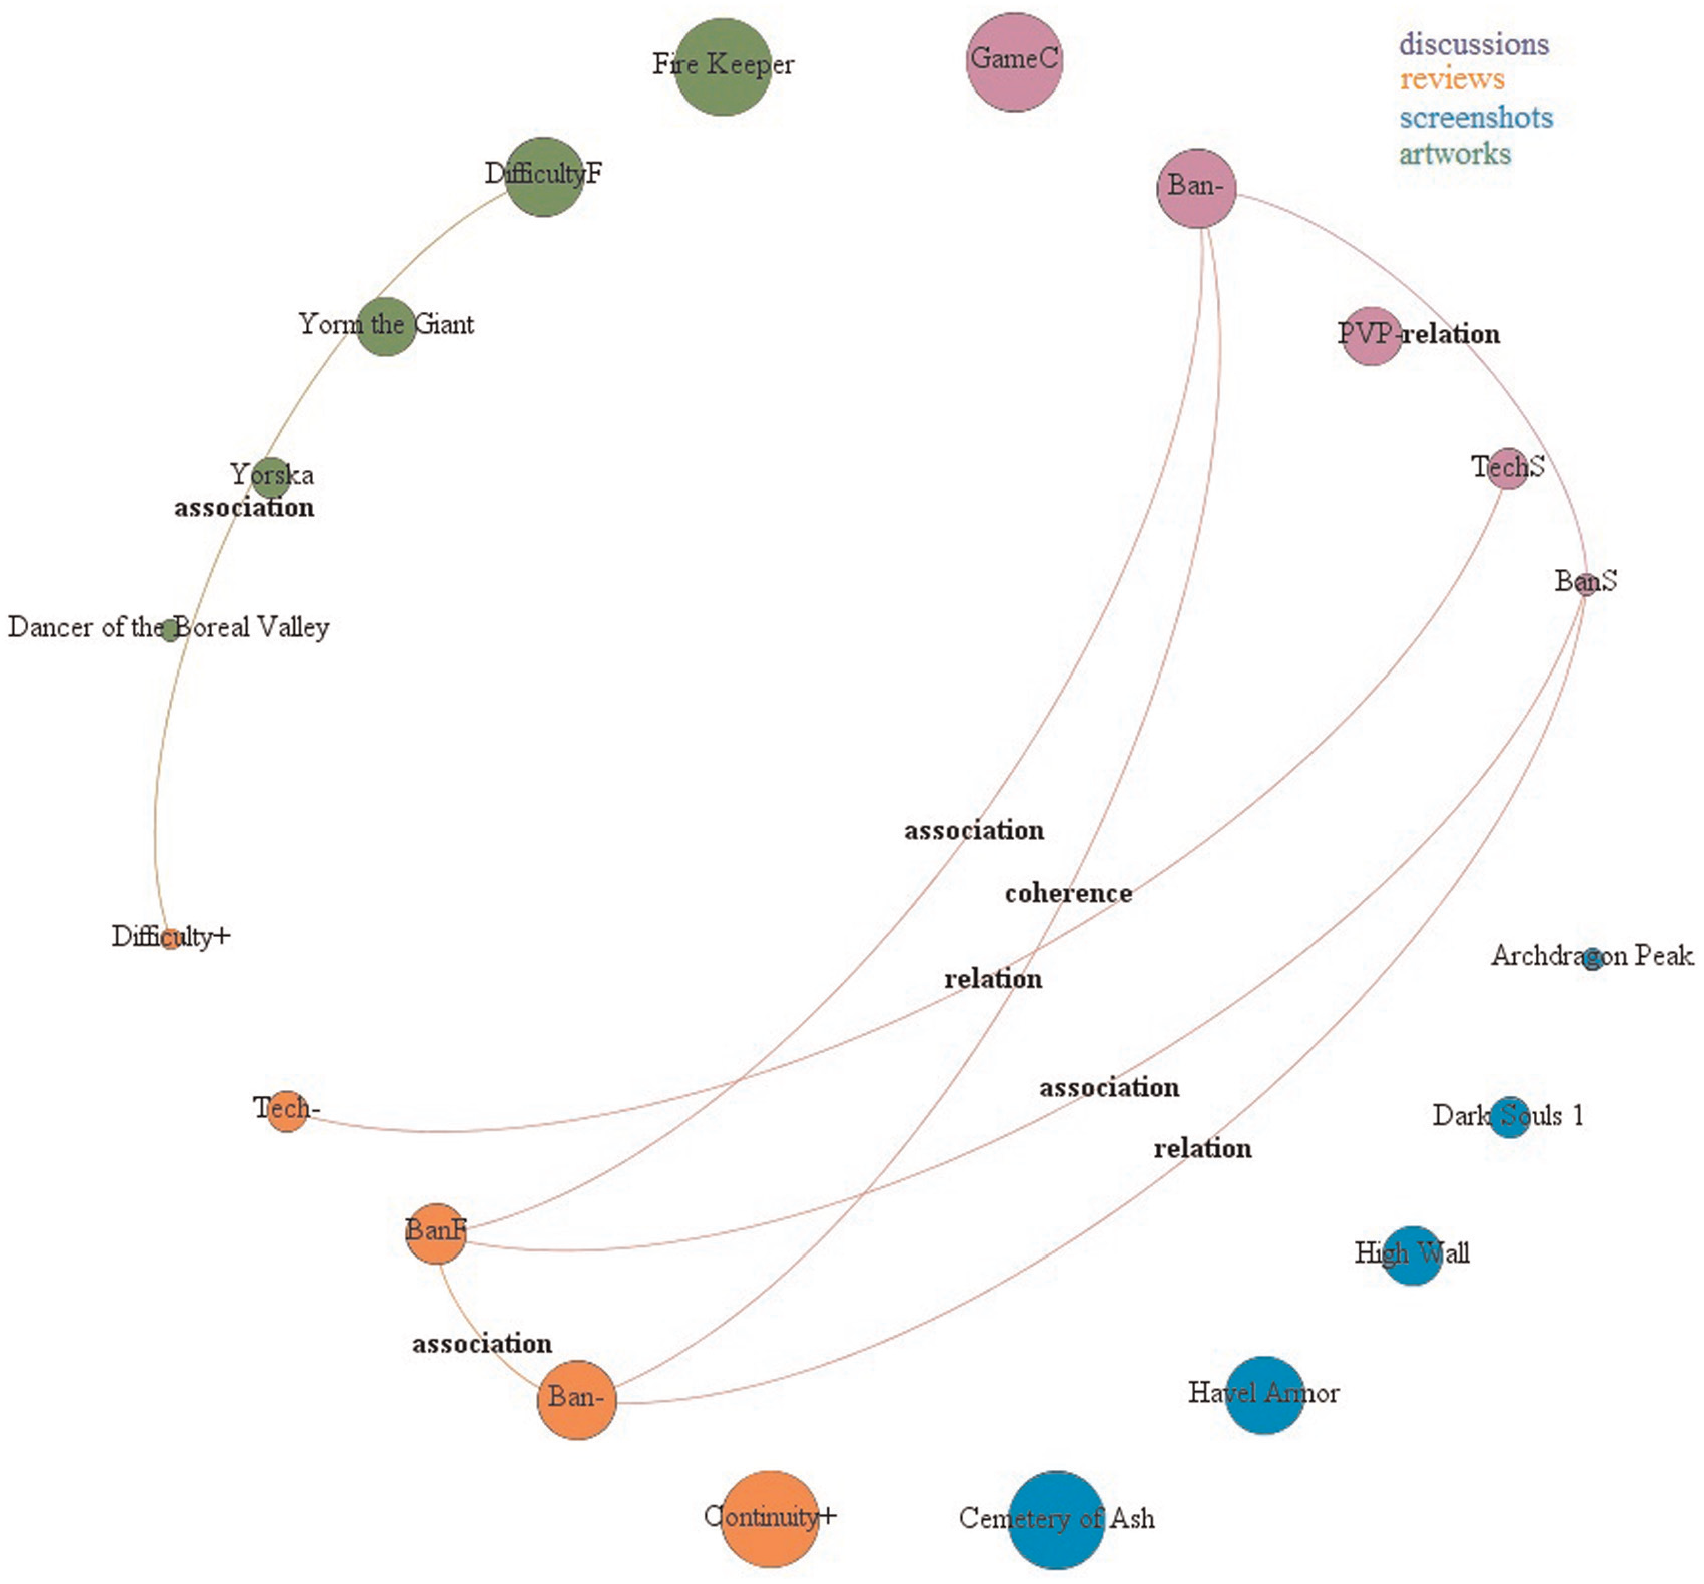
Concerning Steam, four networks were built (one for unit, manual layout, default curved) with four families of nodes according to the source section (discussion: purple/reviews: orange/screenshot: blue/ artwork: green). Their size depends on the ranking (from fifth to first) to compare the four categories, which rely on different types and scales of data (for instance, a topic can have thousands of posts but the most liked screenshot just some dozen likes). Edges were added when two nodes were connected by incoherence (when they do not match; e.g. level design+ in discussion and level design− in reviews), association (when two nodes address the same element without a glaring orientation—e.g. difficulty+ in reviews and difficulty in artworks), coherence (when there is a continuity; e.g. design+ in discussions and design+ in reviews), and relation (when there is a mutual support, for example, a leading topic in reviews is the technical bugs, and a leading theme in discussion is support for fixing them). Being these ties potential correlations, the edges were all undirected and with the same thickness (i.e. 4.0).
In conclusion, the inquiry can be considered a set of
exploratory analyses … [, in which] … there is no initial hypothesis, even the initial selection of relevant variables becomes a critical step. … The exploratory approach aims at summarizing the main characteristics of a given dataset by inspecting it.
59
(p. 259)
Accordingly, the driving hypothesis and data selection are significantly wide in order to outline more pertinent research questions for future investigations. Therefore, the desired contribution of this article is twofold: theorizing game-service platforms with the support of data visualization techniques and, in doing so, suggesting a new visualization strategy informed by a novel theory for the field.
Results
General trends
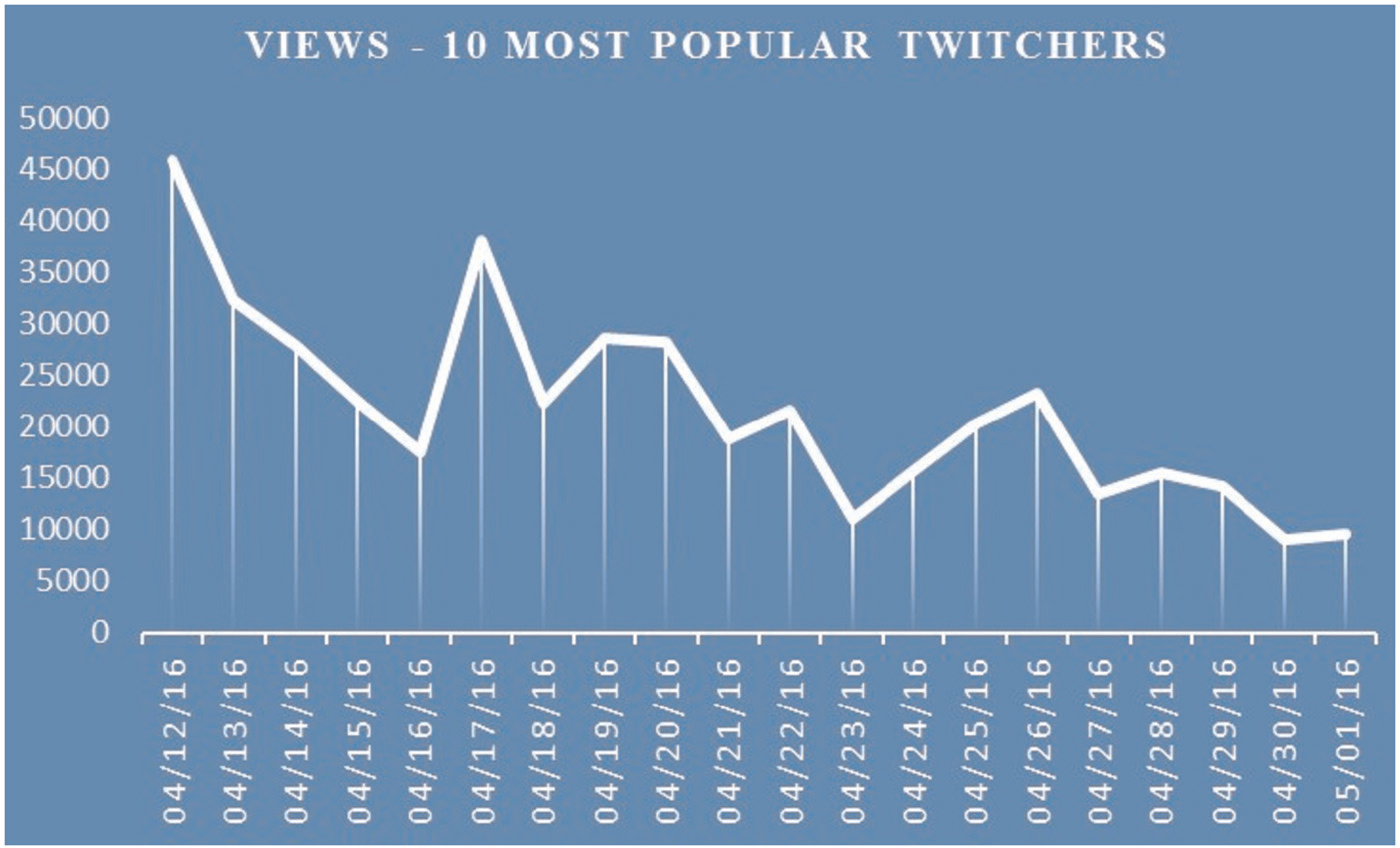
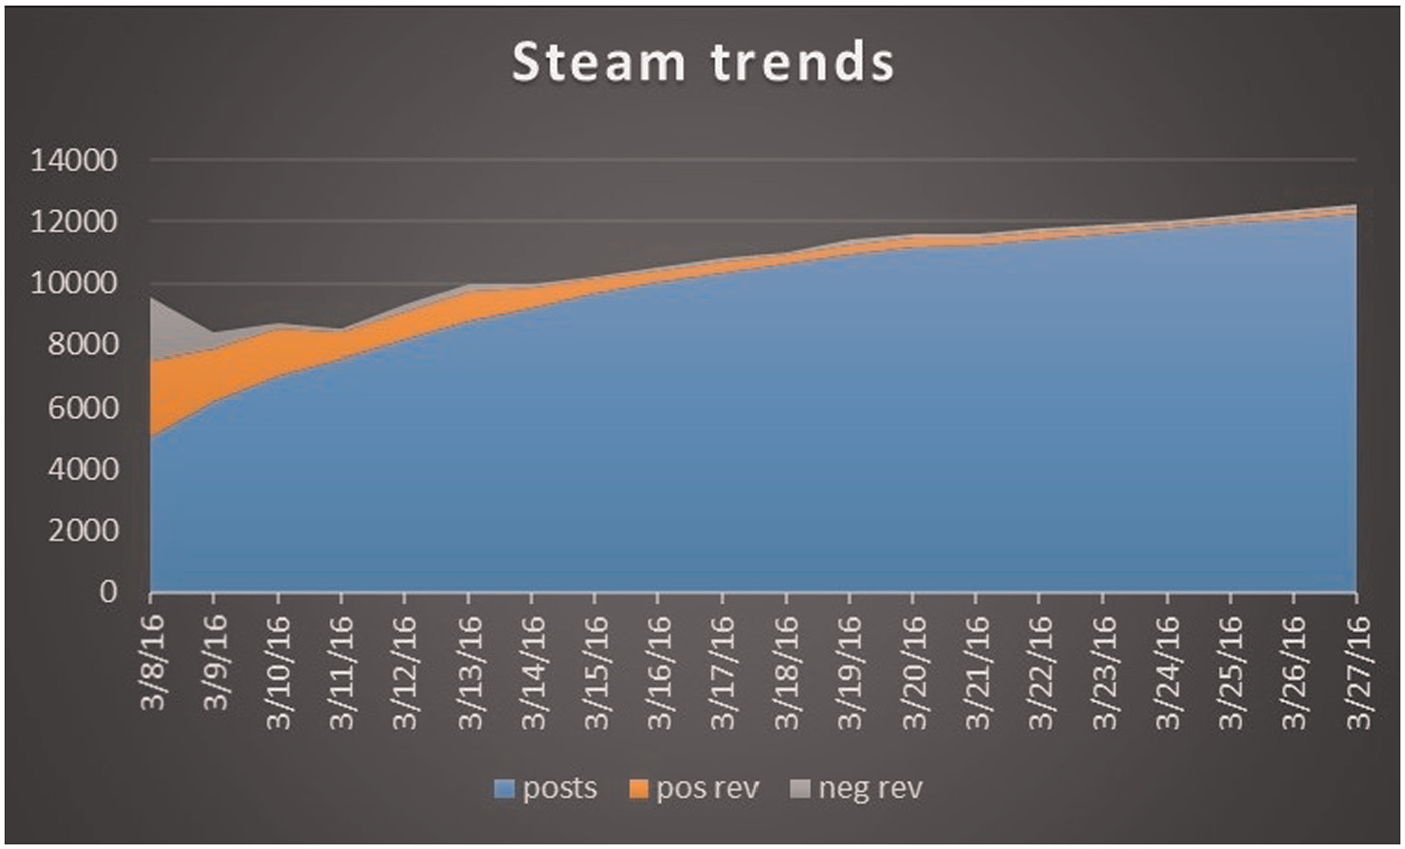
Before deepening Twitch.tv and Steam in more detail, it is worth visualizing the overall activity on the two platforms. Regarding the former, the total views of the 10 most viewers are displayed per day (Figure 1—DS3 and Figure 2—TD). Concerning the latter, the overall number of posts and positive/negative reviews (gathered with the website http://www.steamspy.com) are reported (Figure 3—DS3 and Figure 4—TD).
The trends are similar between the two games, with a decrease in activity on both the platforms in the first 20 days from the release. It can be easily argued that DS3 was more popular on Steam than TD, which by the way showed a higher ratio of negative reviews in comparison with positive assessments. Finally, the peaks on Twitch.tv (for DS3 04/17 and 04/26, for TD 03/12 and 03/16) were due to the momentary presence of popular streamers (especially the one who will be labeled as twitcher A in next pages).
Twitch.tv
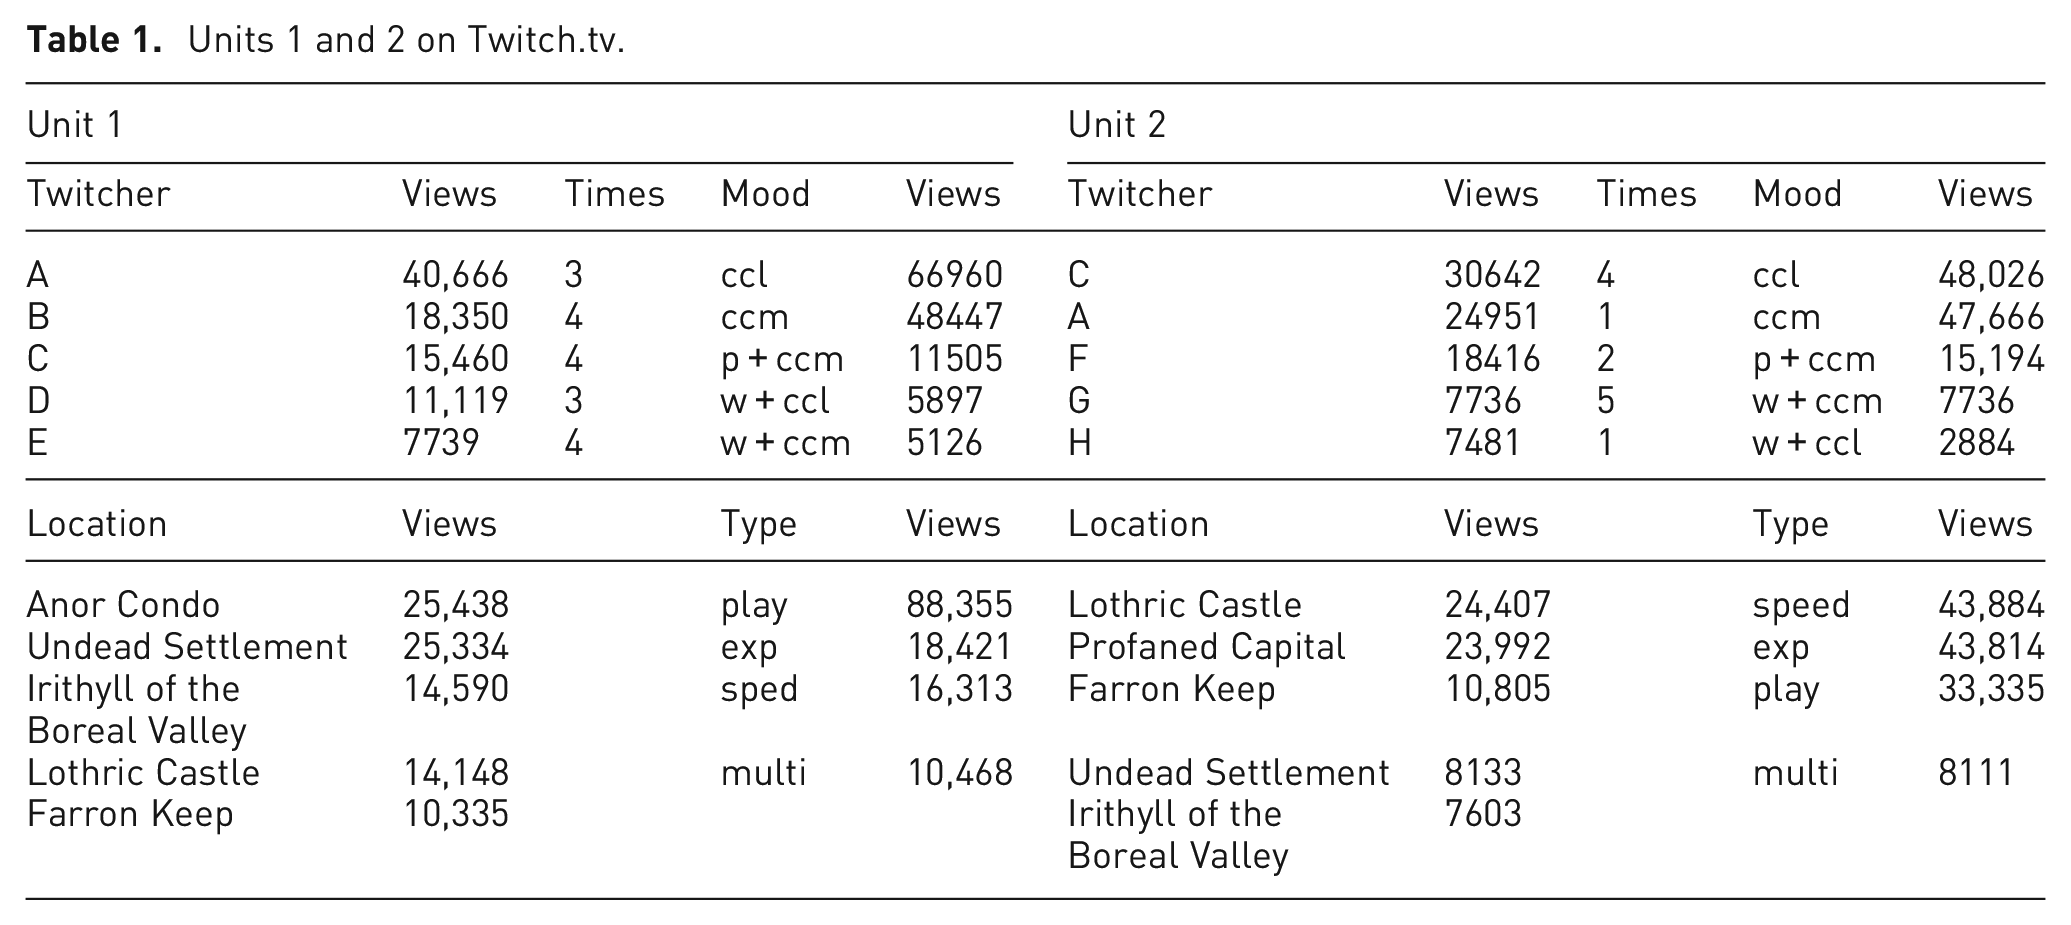
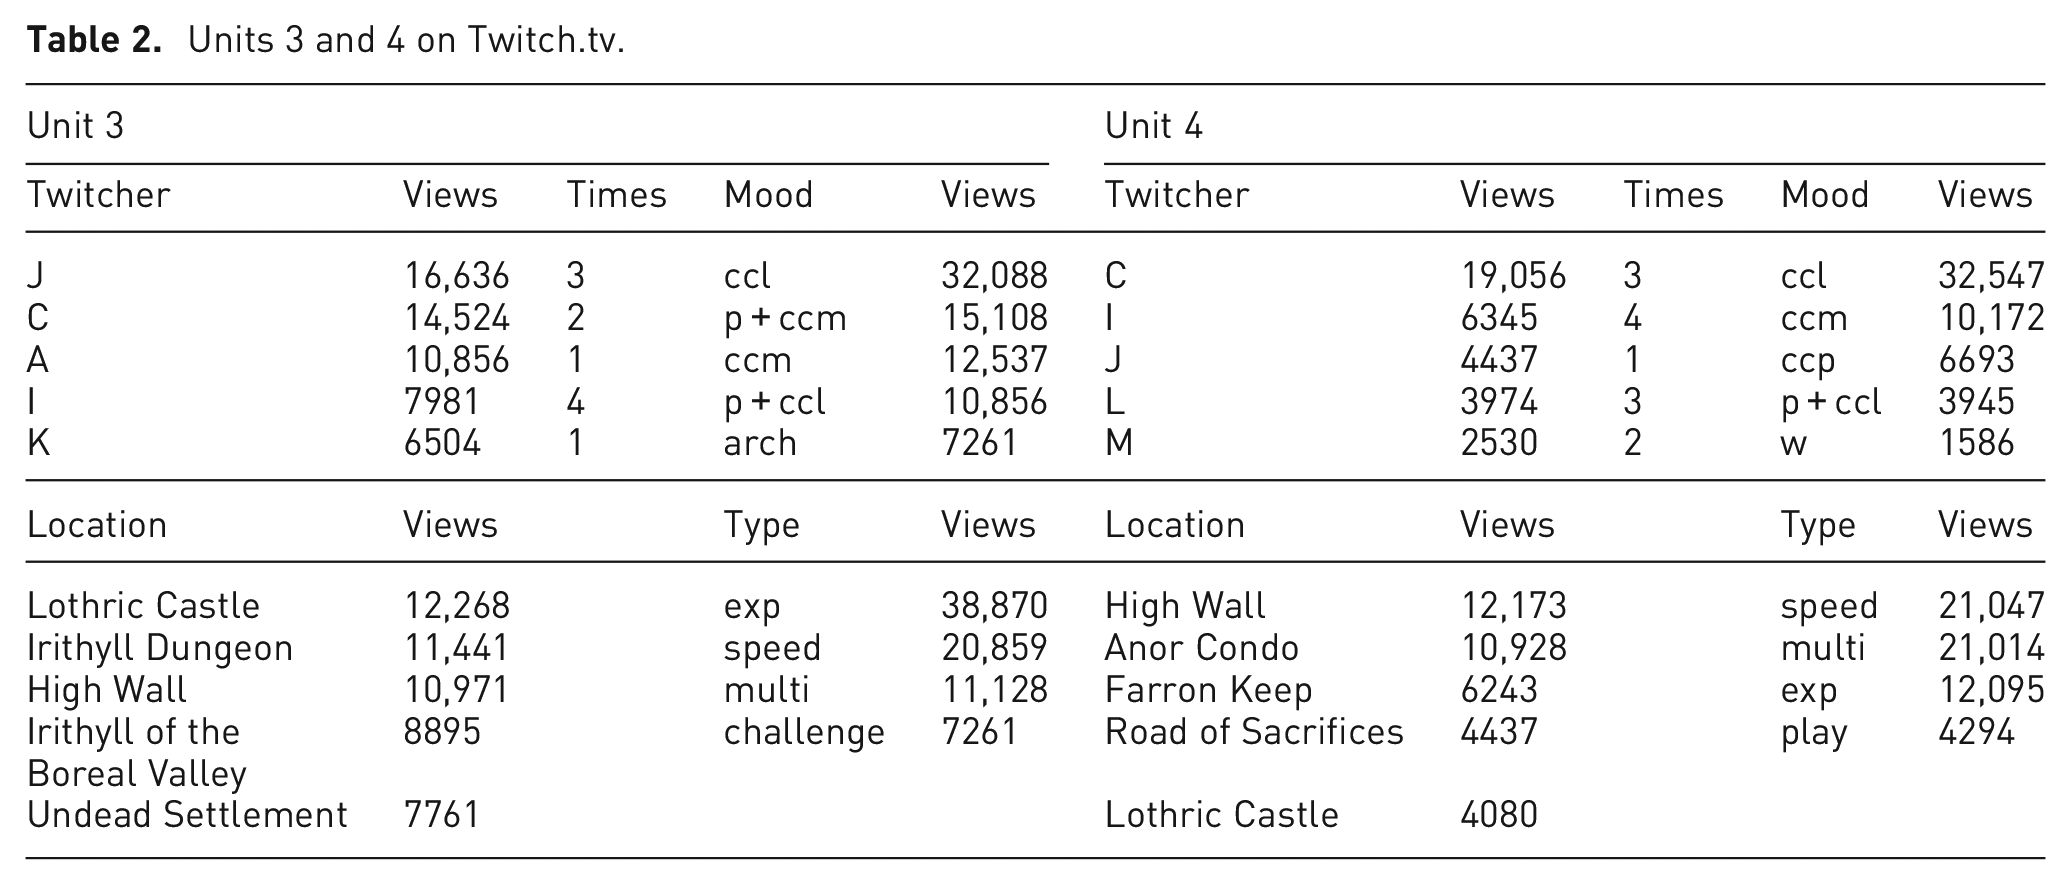
Tables 1 and 2 depict the processed data (first five positions for each unit; “times” refer to how many times the twitcher was in the first 10 positions) from which the visualizations (Figures 5–8) were developed, while Table 3 reports the acronyms used in visualizing Twitch.tv-related networks.
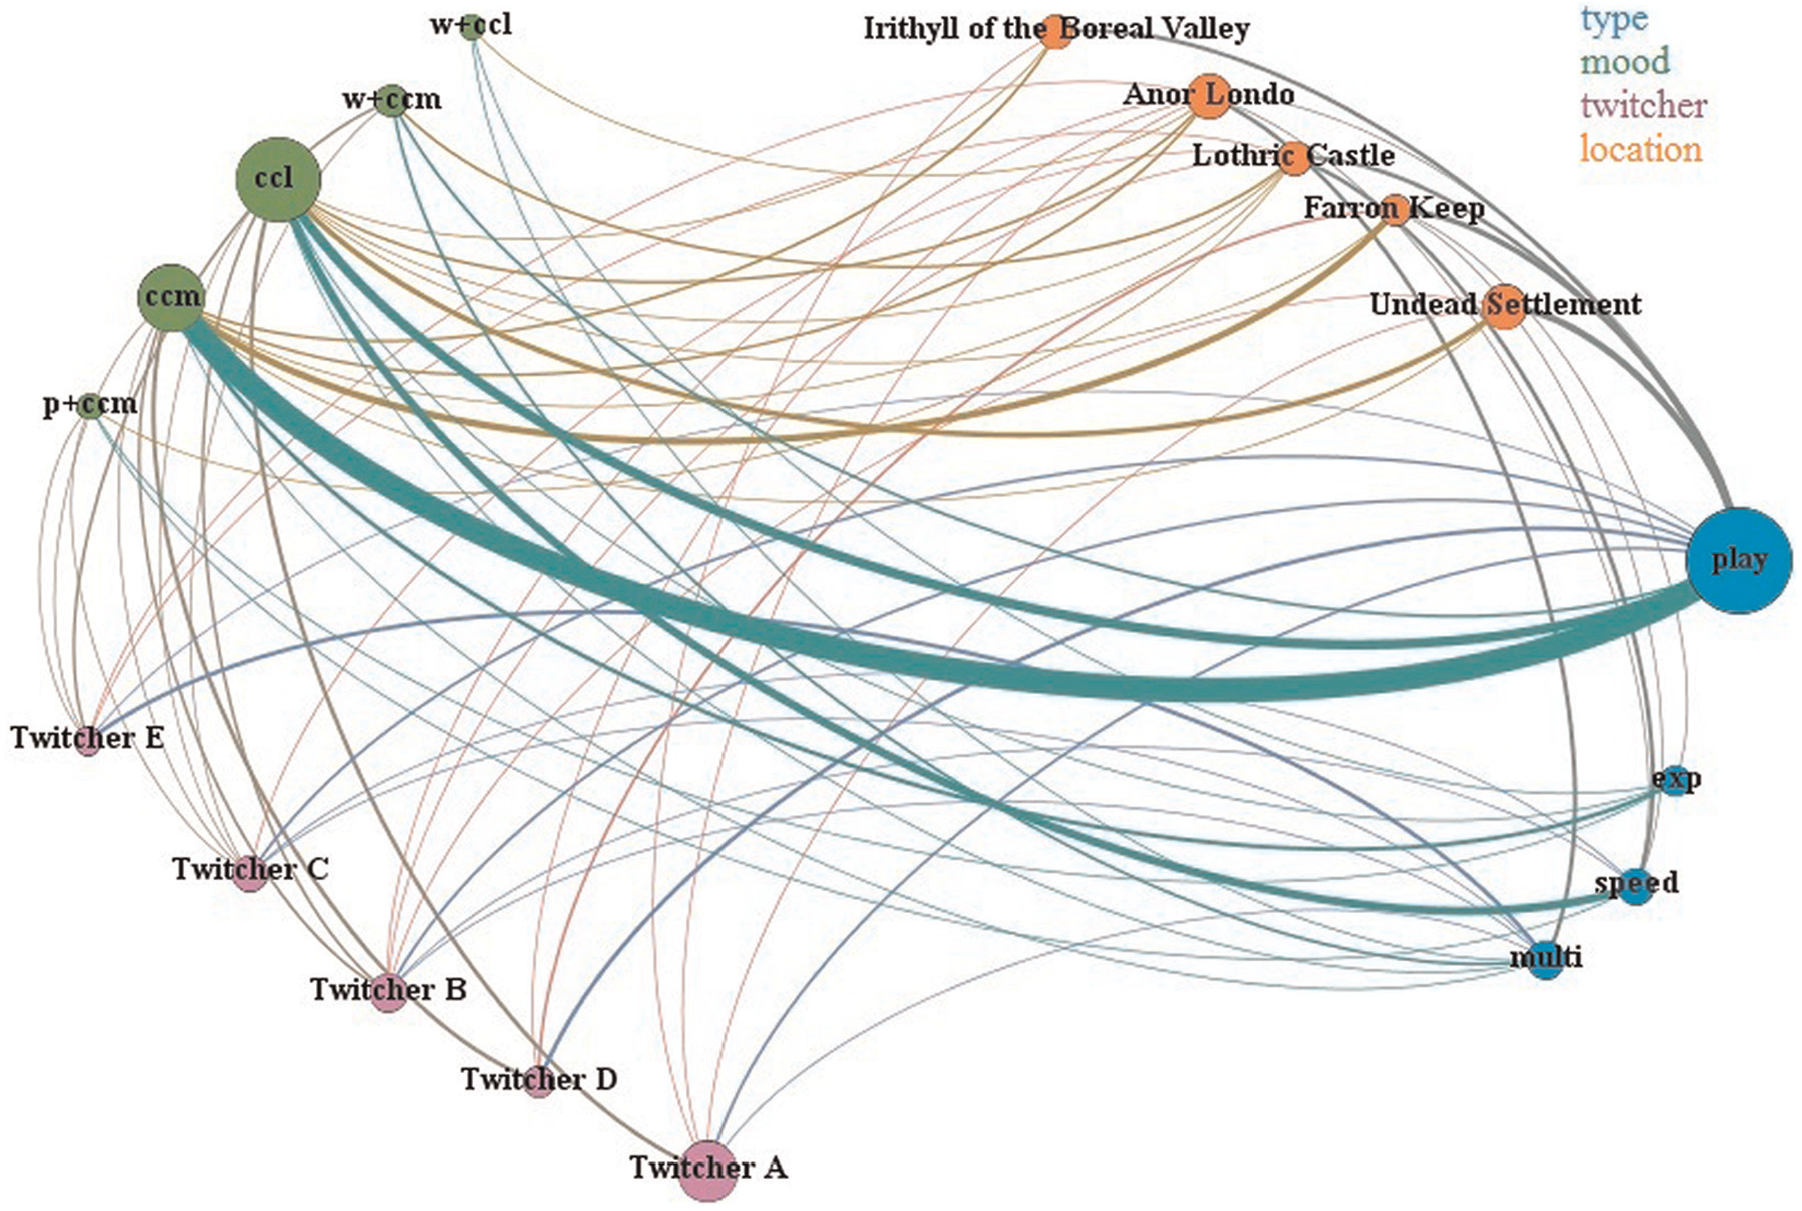
Twitch.tv—Unit 1.
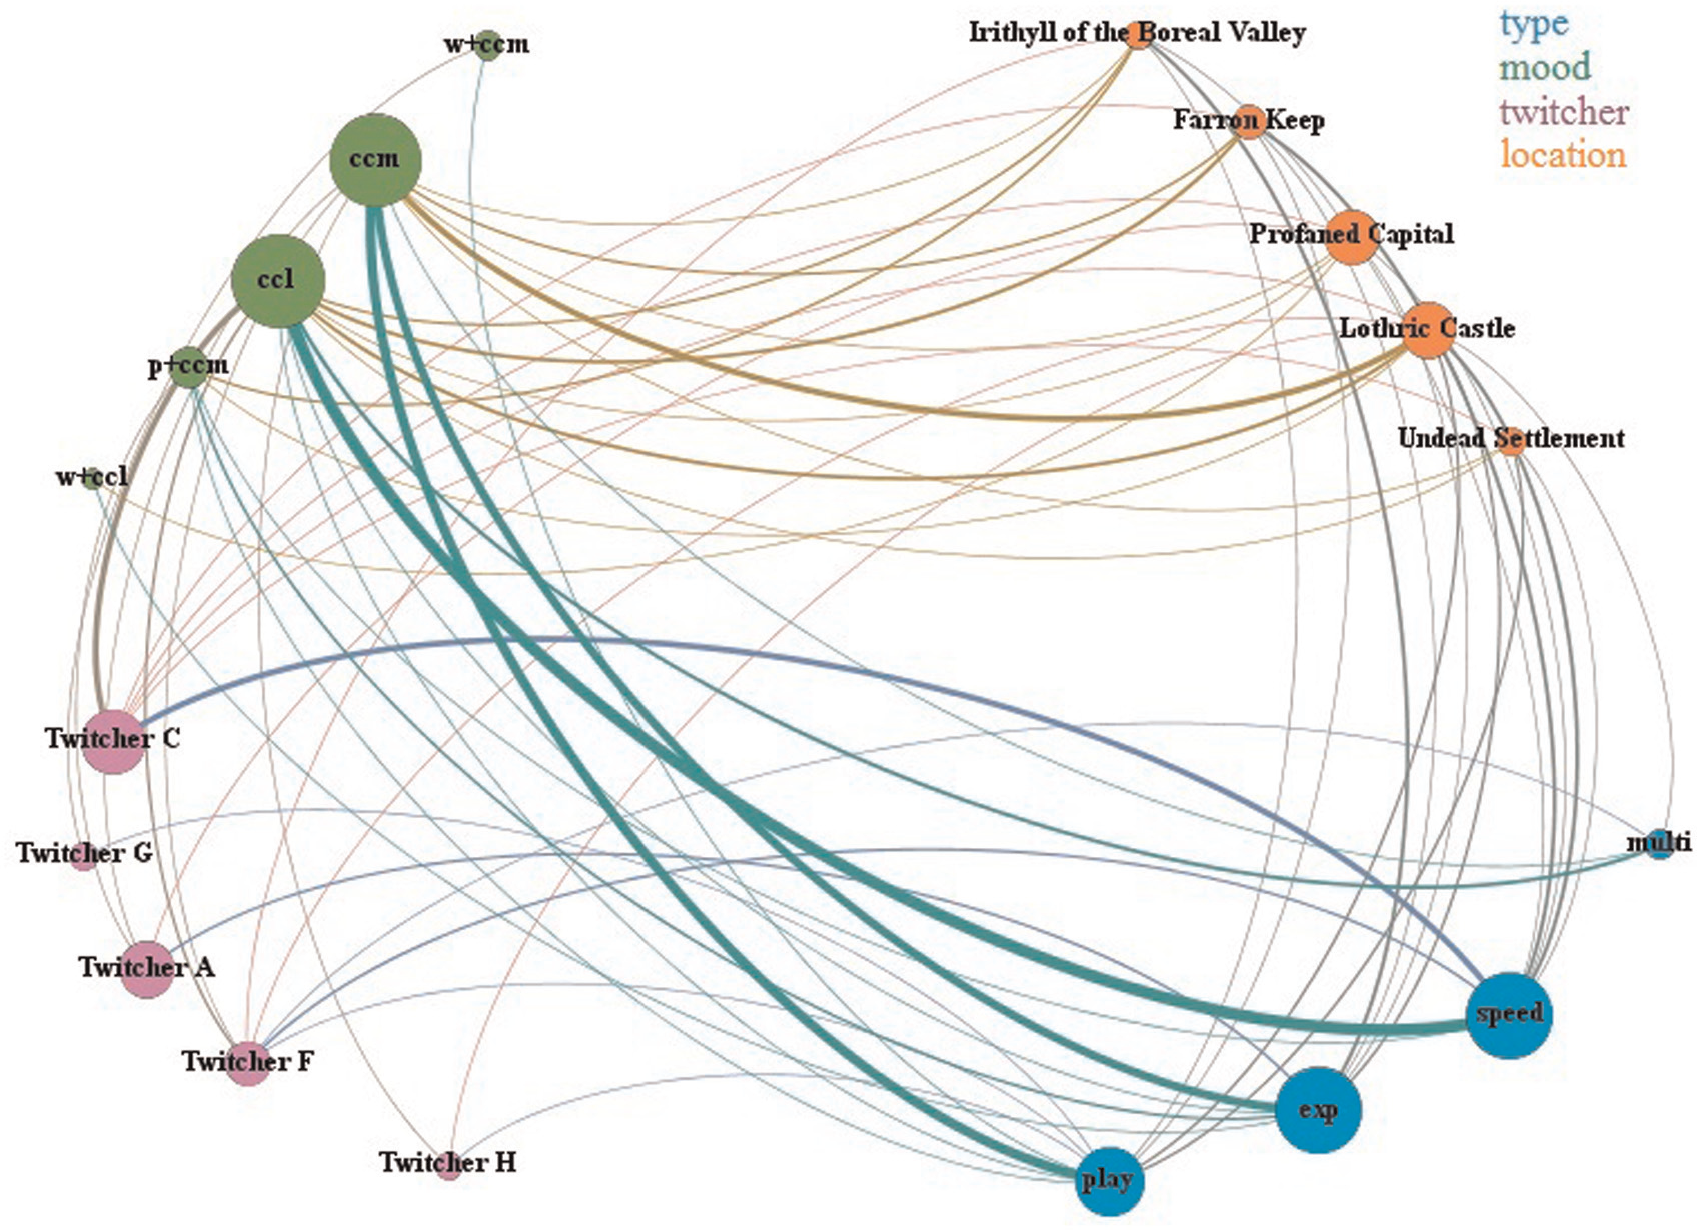
Twitch.tv—Unit 2.
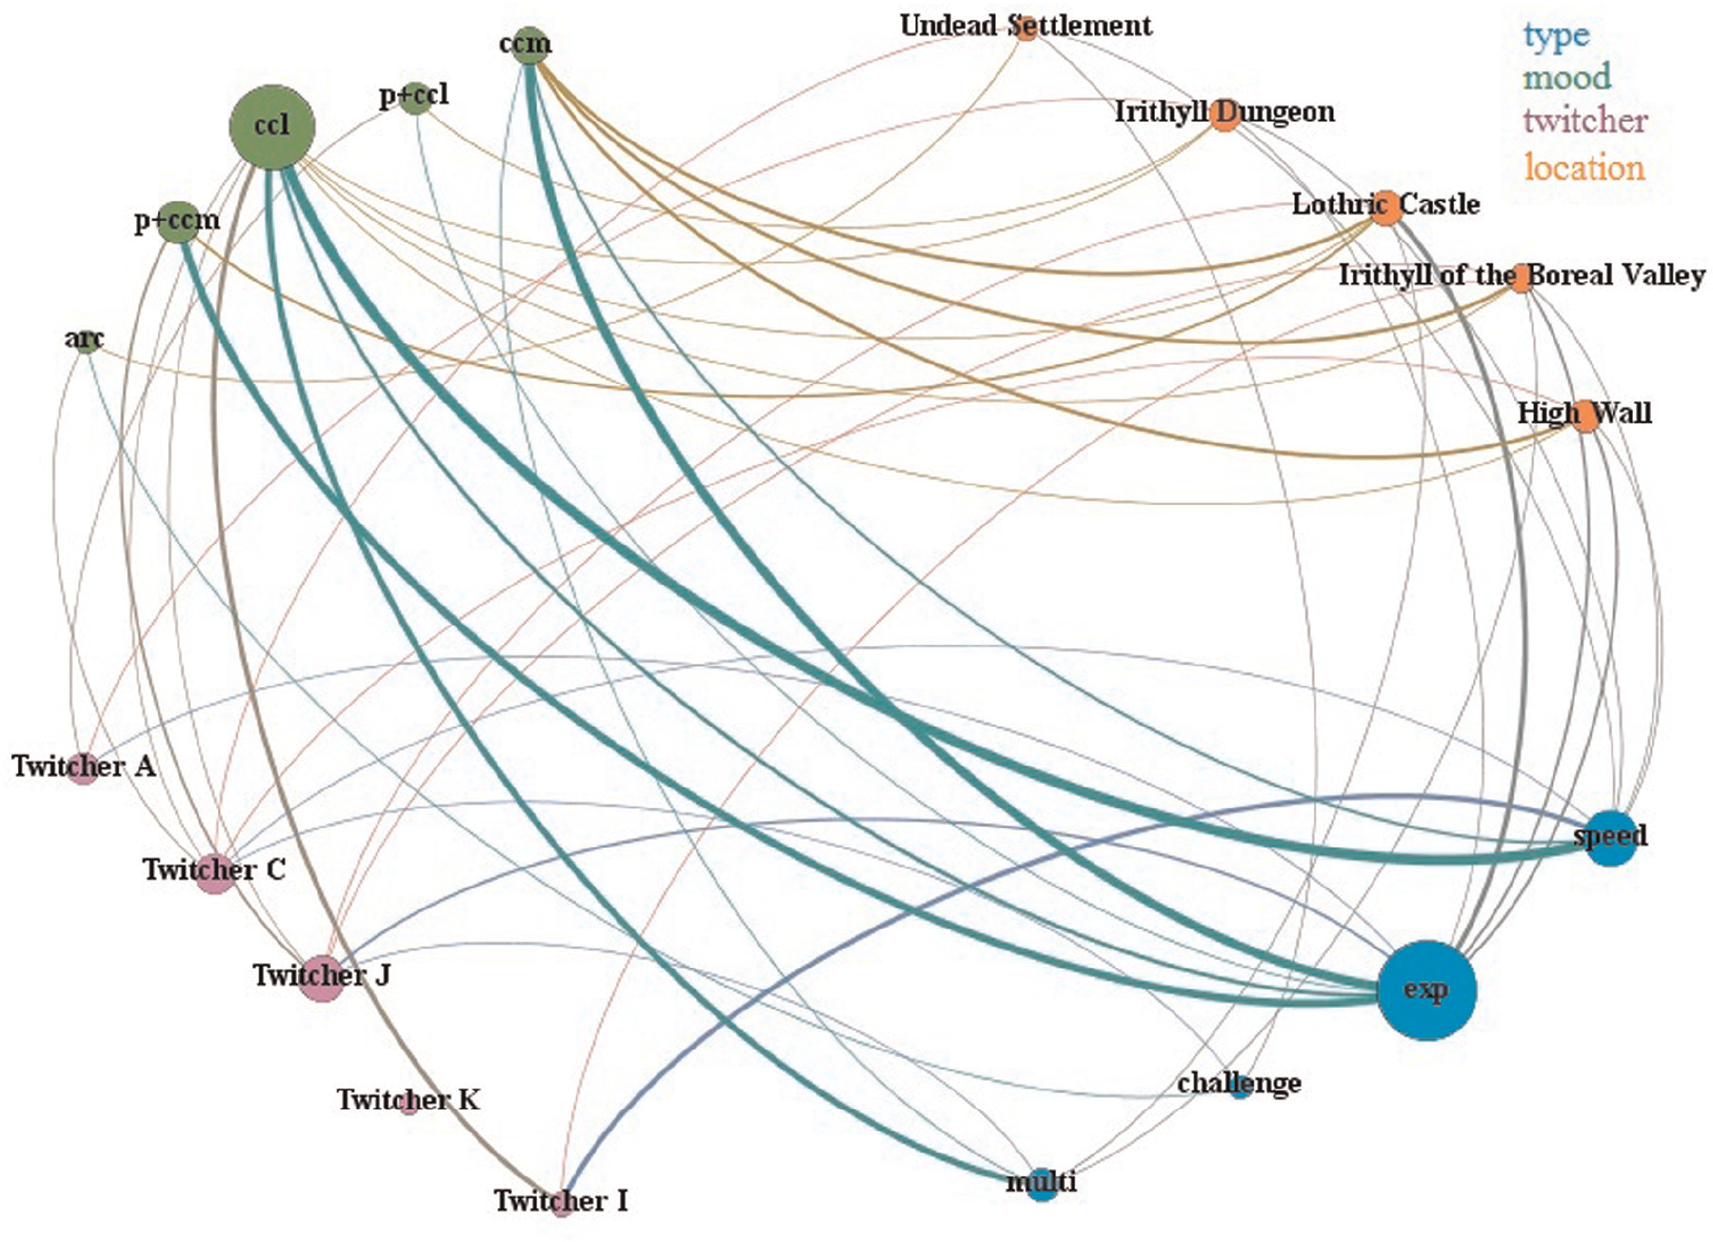
Twitch.tv—Unit 3.
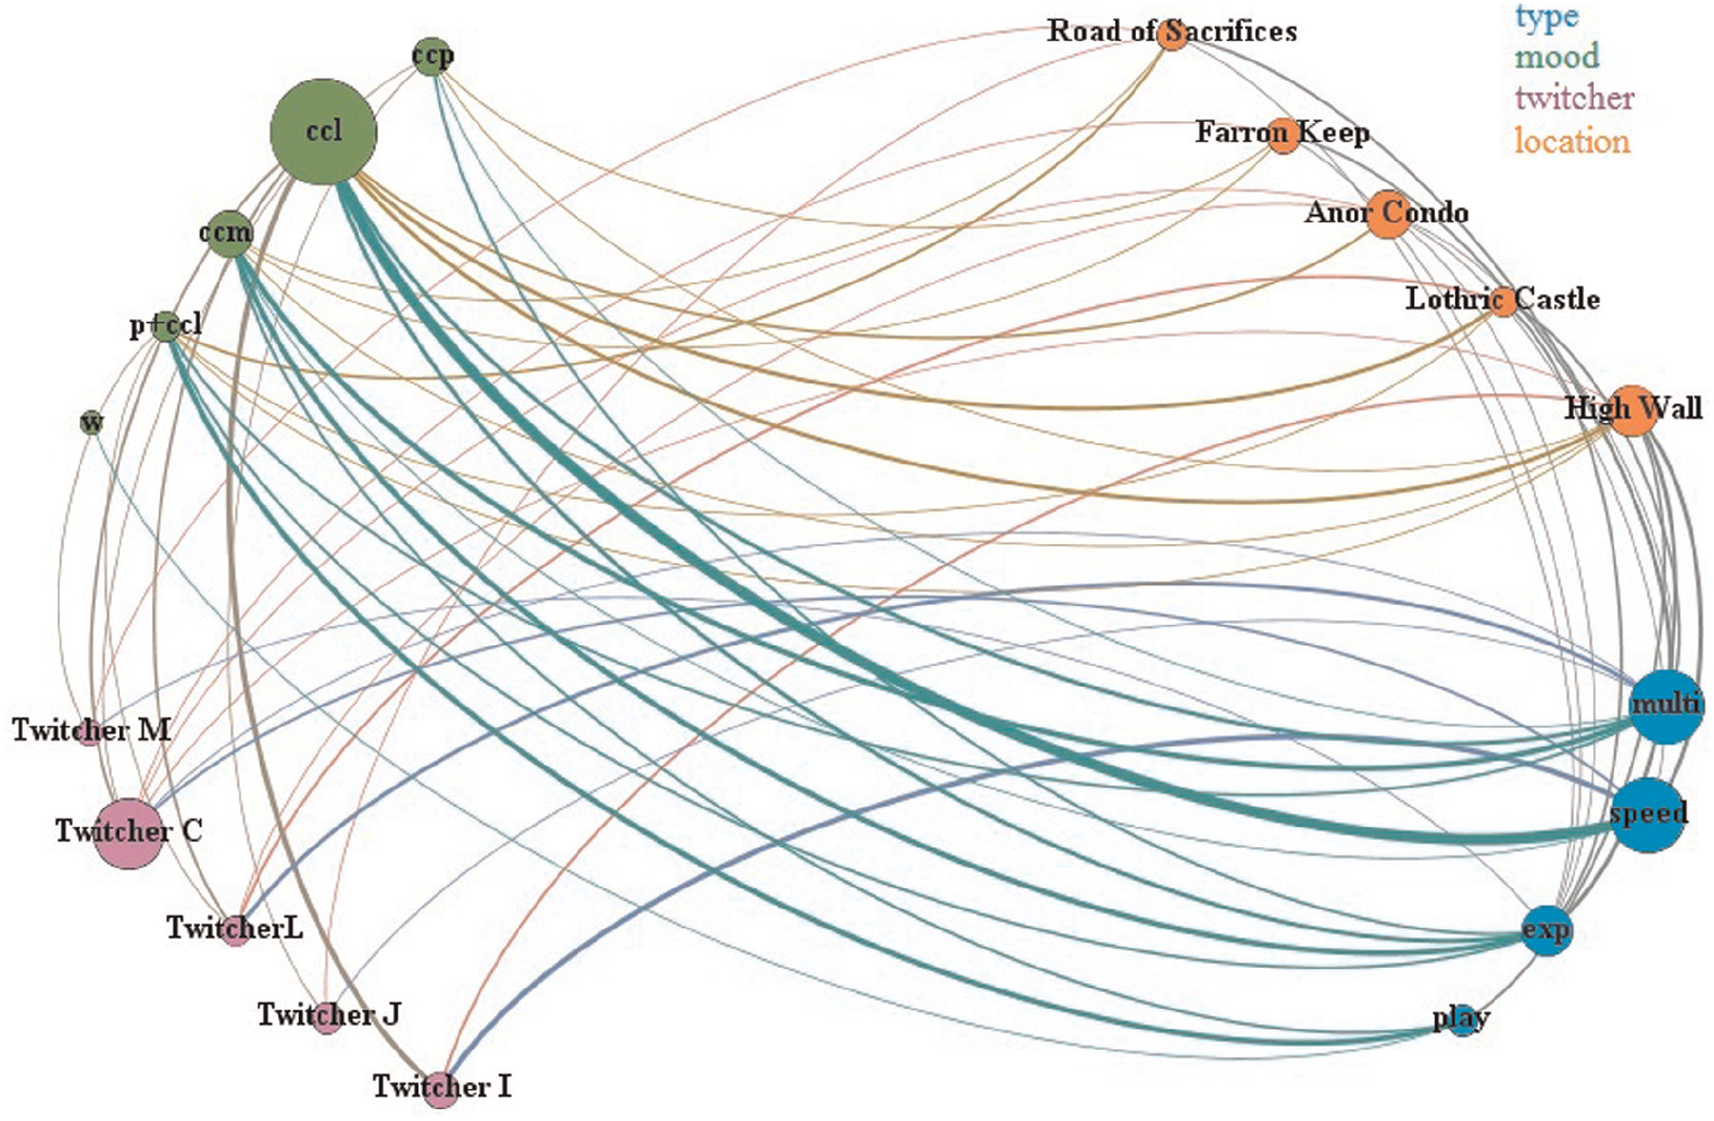
Twitch.tv—Unit 4.
Twitch.tv related labels.
The comparison between networks reveals some relevant findings about DS3’s most popular streaming trends. First, in Unit 1 play-walkthroughs were preponderant due to the newness of the game. A ccm approach (e.g. knight, warrior) was usually associated with it because of its flexibility and effectiveness in completing the game. The further units were more variegated probably due to the expertise developed by the streamers (anonymized for privacy concerns): experiments (especially in Unit 2), speedruns, and multiplayer became in charge with a relevant connection to ccl (e.g. tied to classes such as assassin, thief, deprived), which is a strategy based on speed and agility: related characters can inflict critical damage in the quickest way possible. In addition, the class pyromance (per se and combined with other moods) acquired a significant popularity among performers since Unit 2. It can be argued that this preference is because the equipment for casting the related magic is without weight, so it is sustainable to add with relevant benefits in attack and no moving penalties. Unsurprisingly, locations were constantly changed, while twitchers were extremely diversified in terms of popularity and then extremely influent in structuring the core trends of DS3 on Twitch.tv (especially twitcher A and twitcher C). In other words, the streamer per se was the most effective variable in attracting the audience. This outcome is compatible with the peaks in Figures 1 and 2 and other findings about the platform. 1 Furthermore, in the exploratory study of TD two twitchers (A and K) had already emerged as game-changer presences.
Regarding the Ubisoft’s hit, as expected, the analysis of frames was more challenging to stage. Indeed, the elements visualized within the TD’s screenshots captured were poorly informative. The fundamental traits (e.g. level, equipment) of the avatar are not completely displayed, while the game environment and dynamics (based on stances and a multiple progression) are less linear than DS3’s ones. It can be argued that the visual readabilities—that is, what a frame tells us about the game portrayed (the elements that informed the column “characteristics” in Table 3)—of the two case studies are divergent. Figure 9 (DS3) and Figure 10 (TD) (i.e. screenshots captured from Twitch.tv streaming with identifying elements removed) refer to such a dissimilarity, with the DS3’s recognizing elements (i.e. main indicators, equipment) circled in red. Although in focused gameplay/esthetical analyses (e.g. Lewis et al., 60 Marczak et al., 61 and Rose 62 (pp. 62–82)) this criterion may appear secondary, in broader researches (as the one depicted in this article), it can significantly affect the usefulness of the data collected.
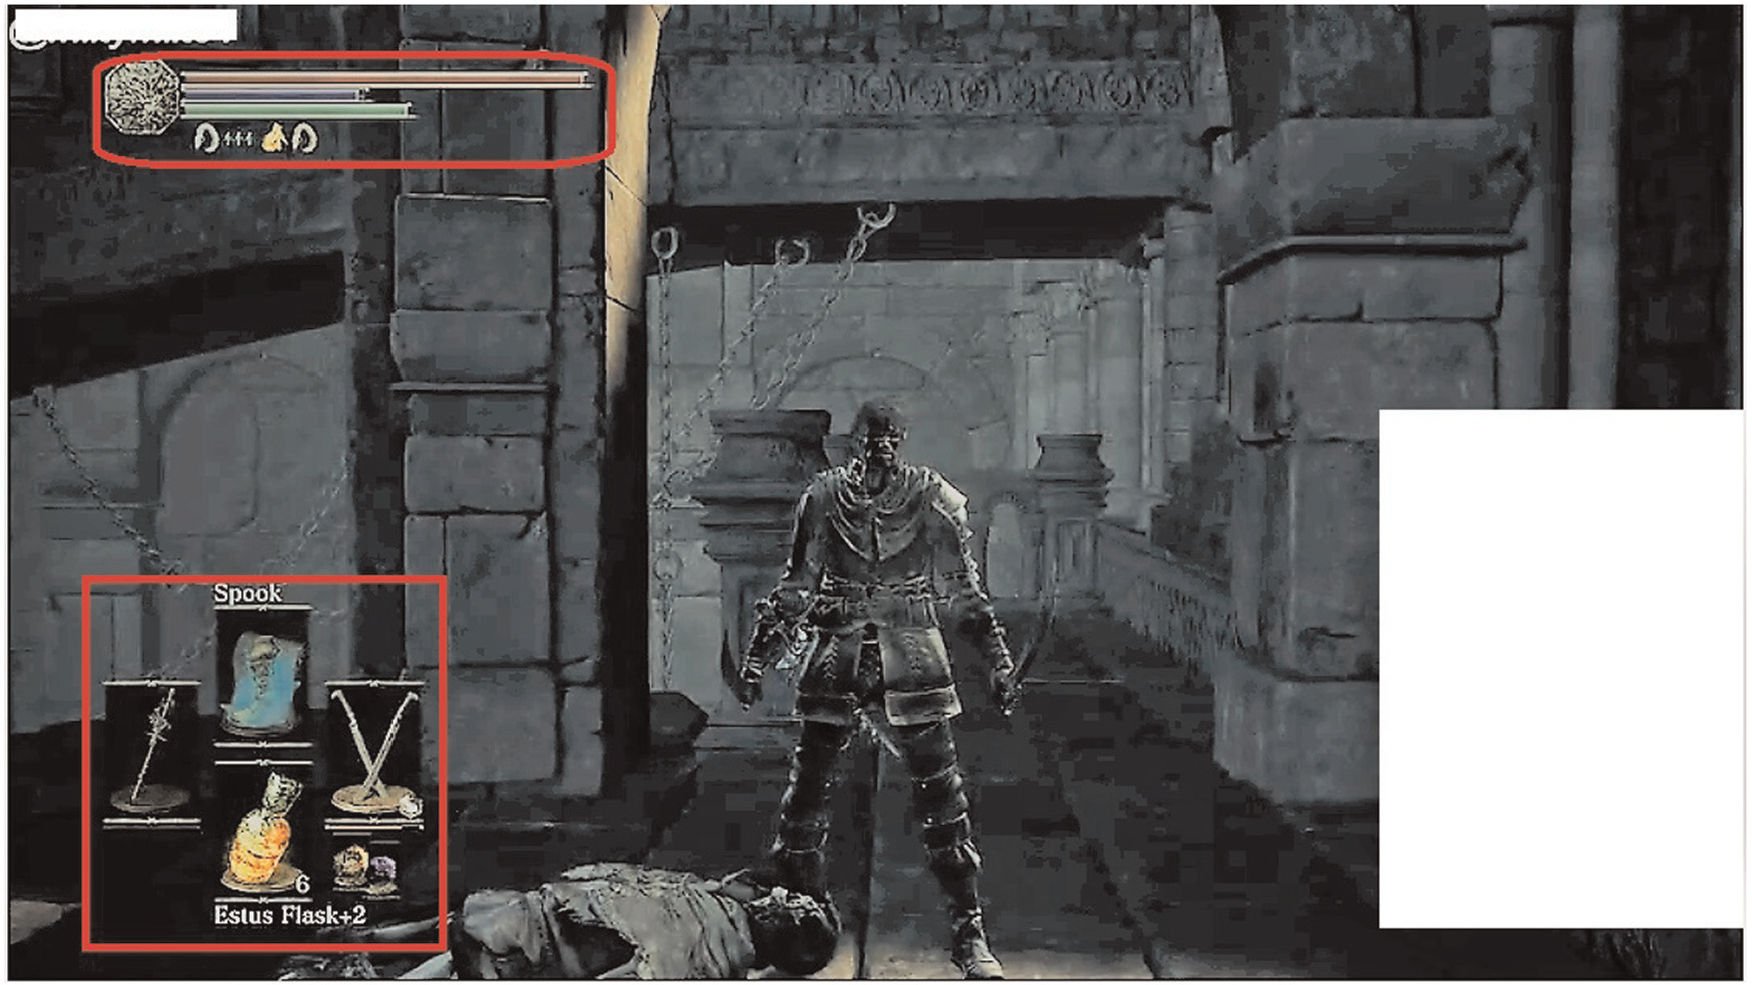
DS3 frame.
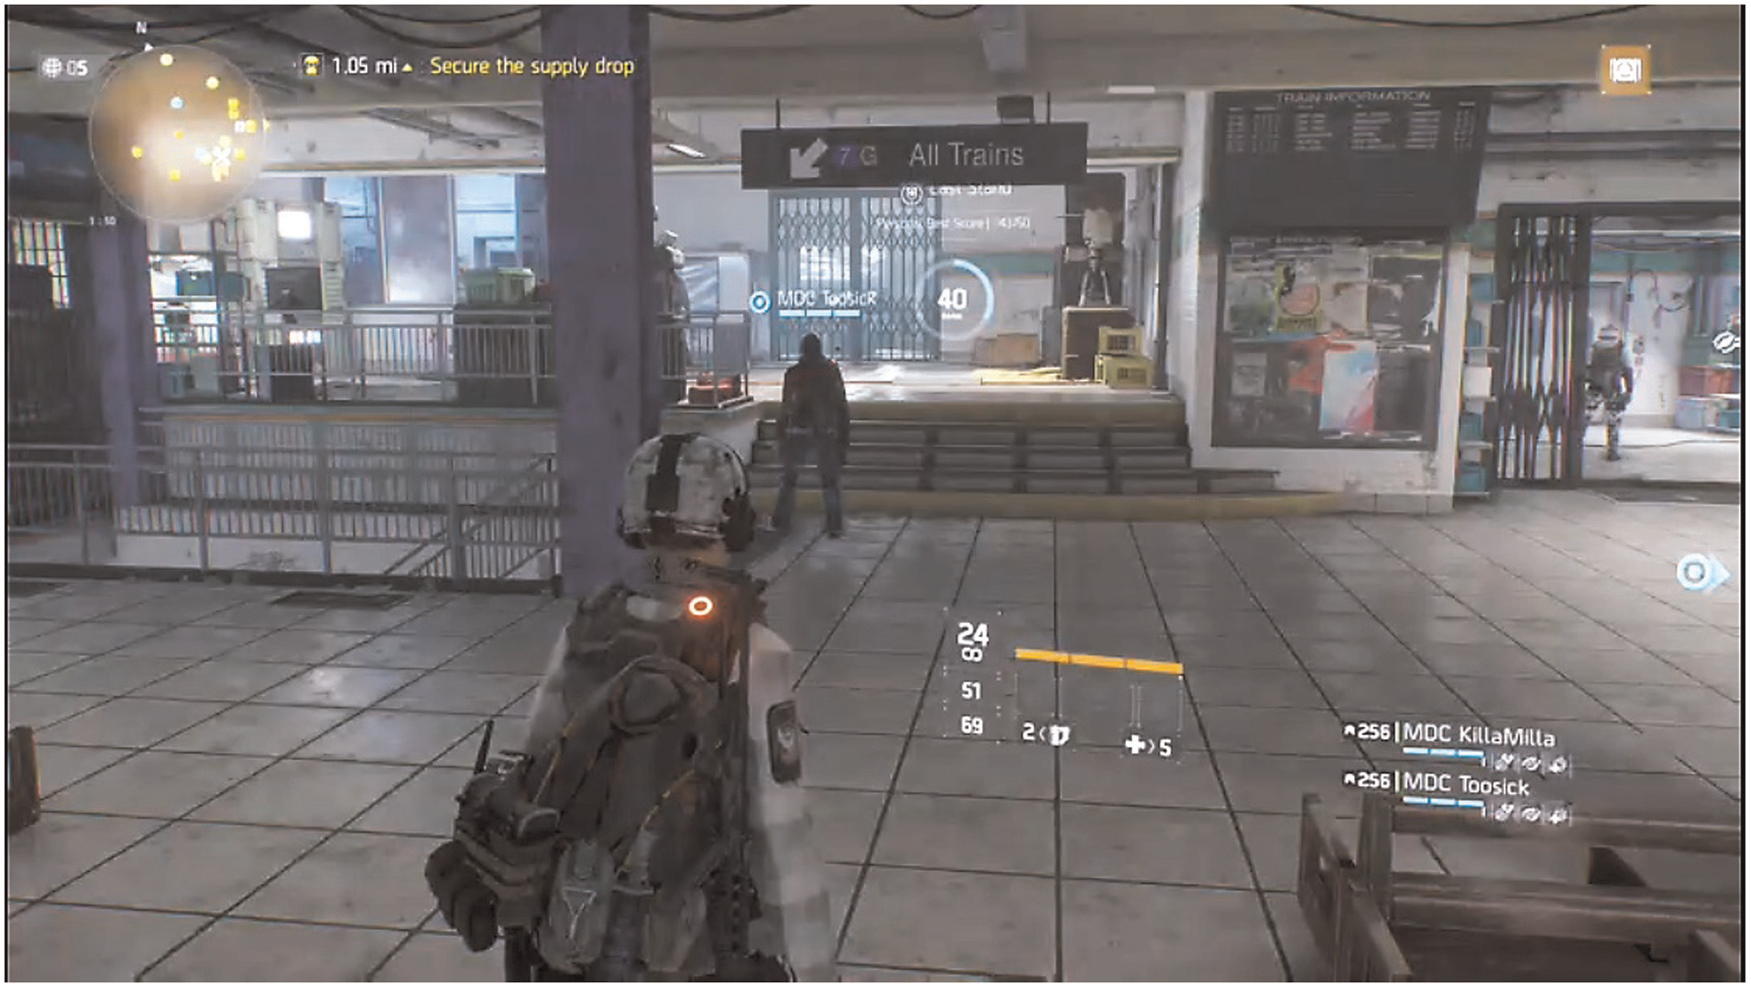
TD frame.
Steam
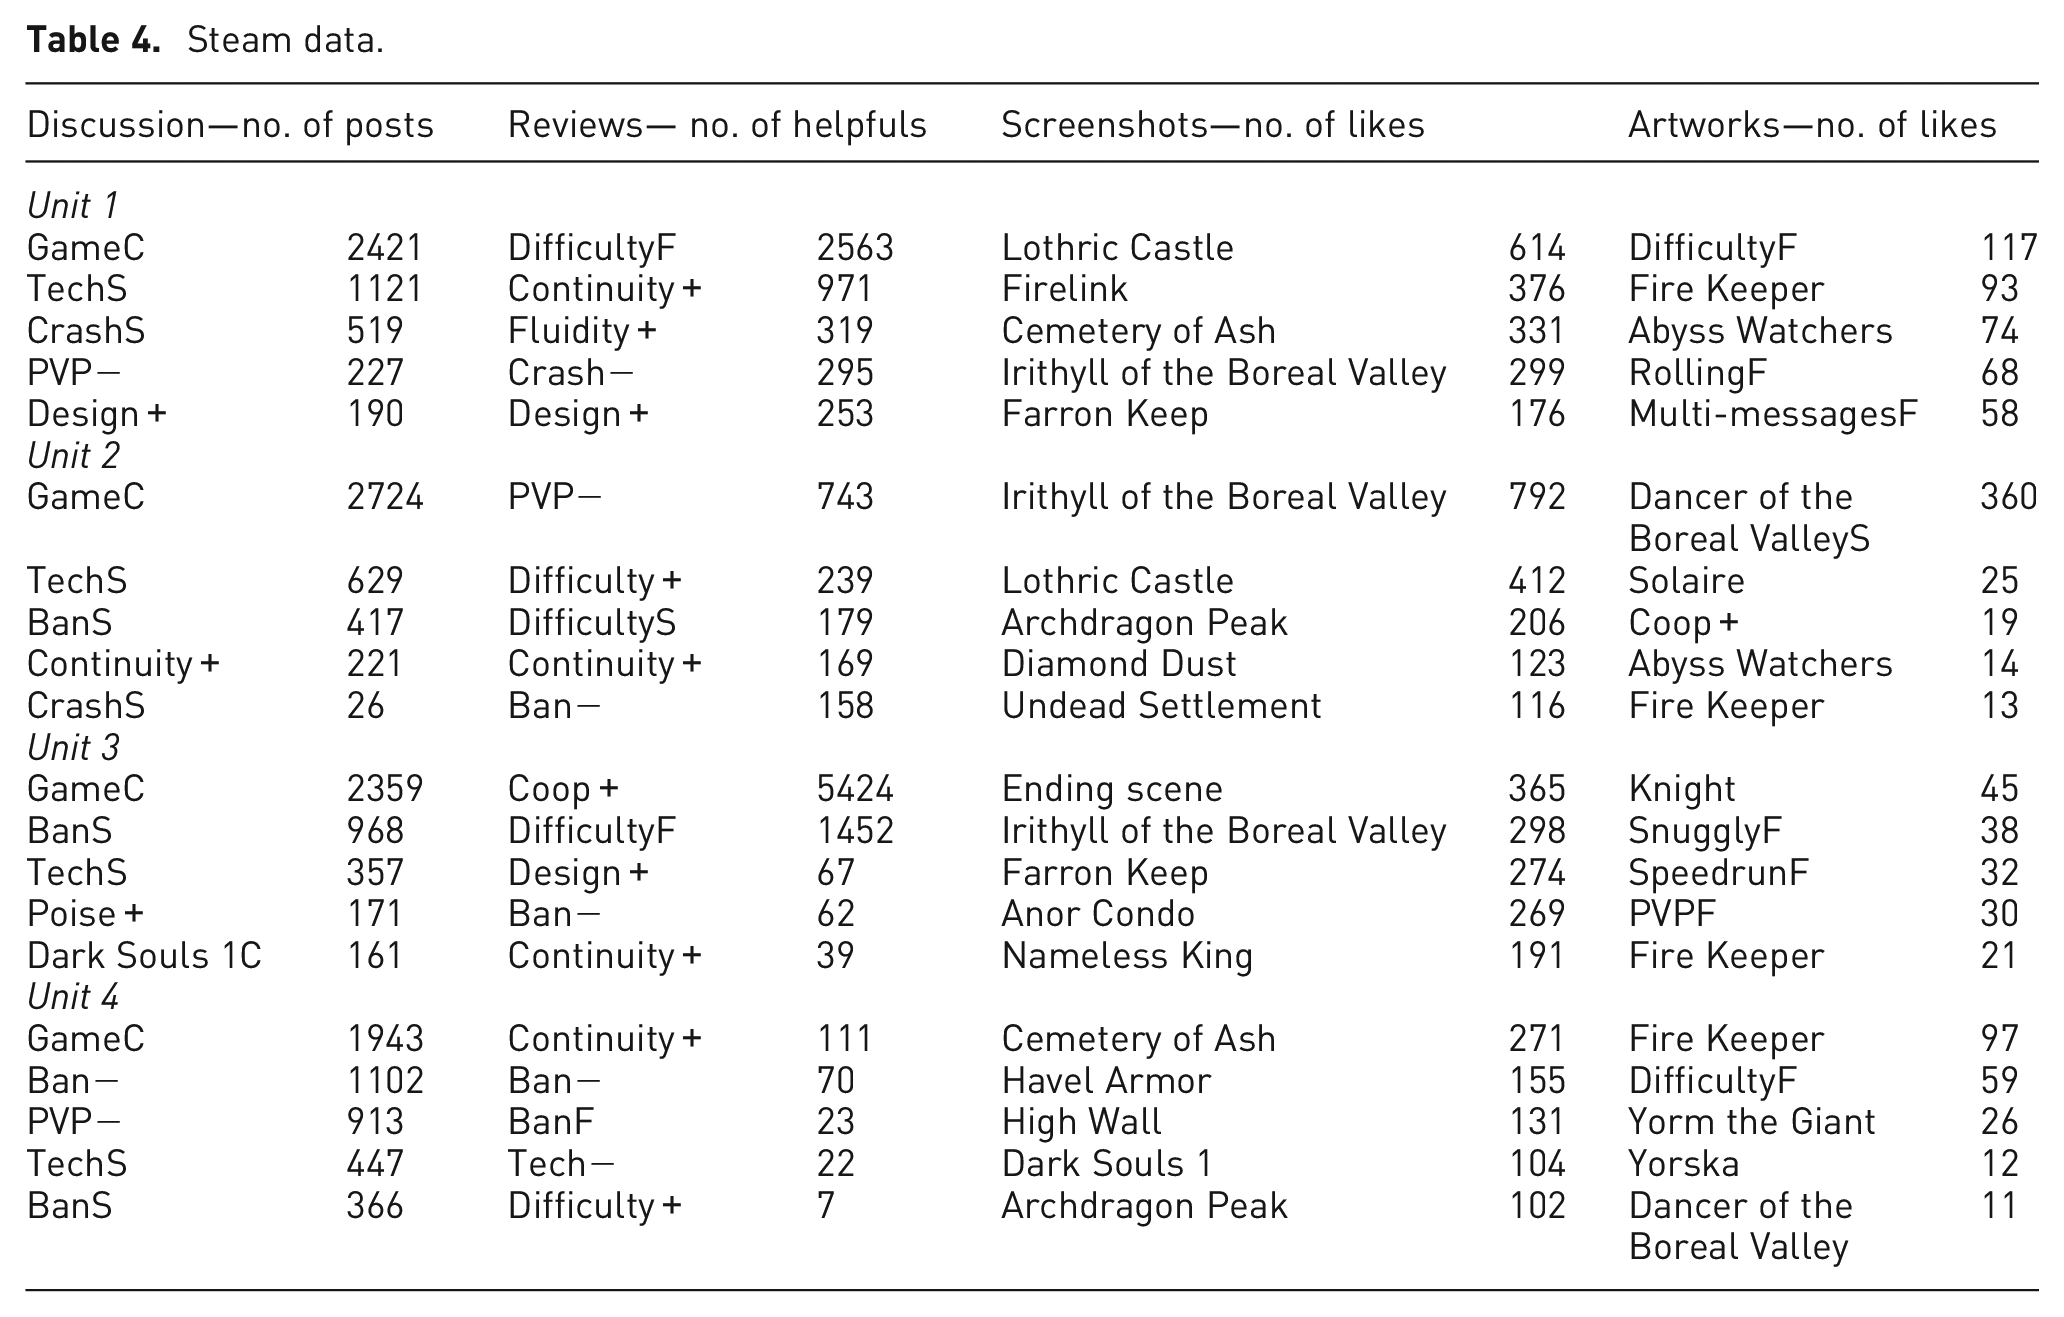
In Table 4, the processed data are reported according to each unit, while Figures 11–14 refer to the consequent networks.
Steam data.
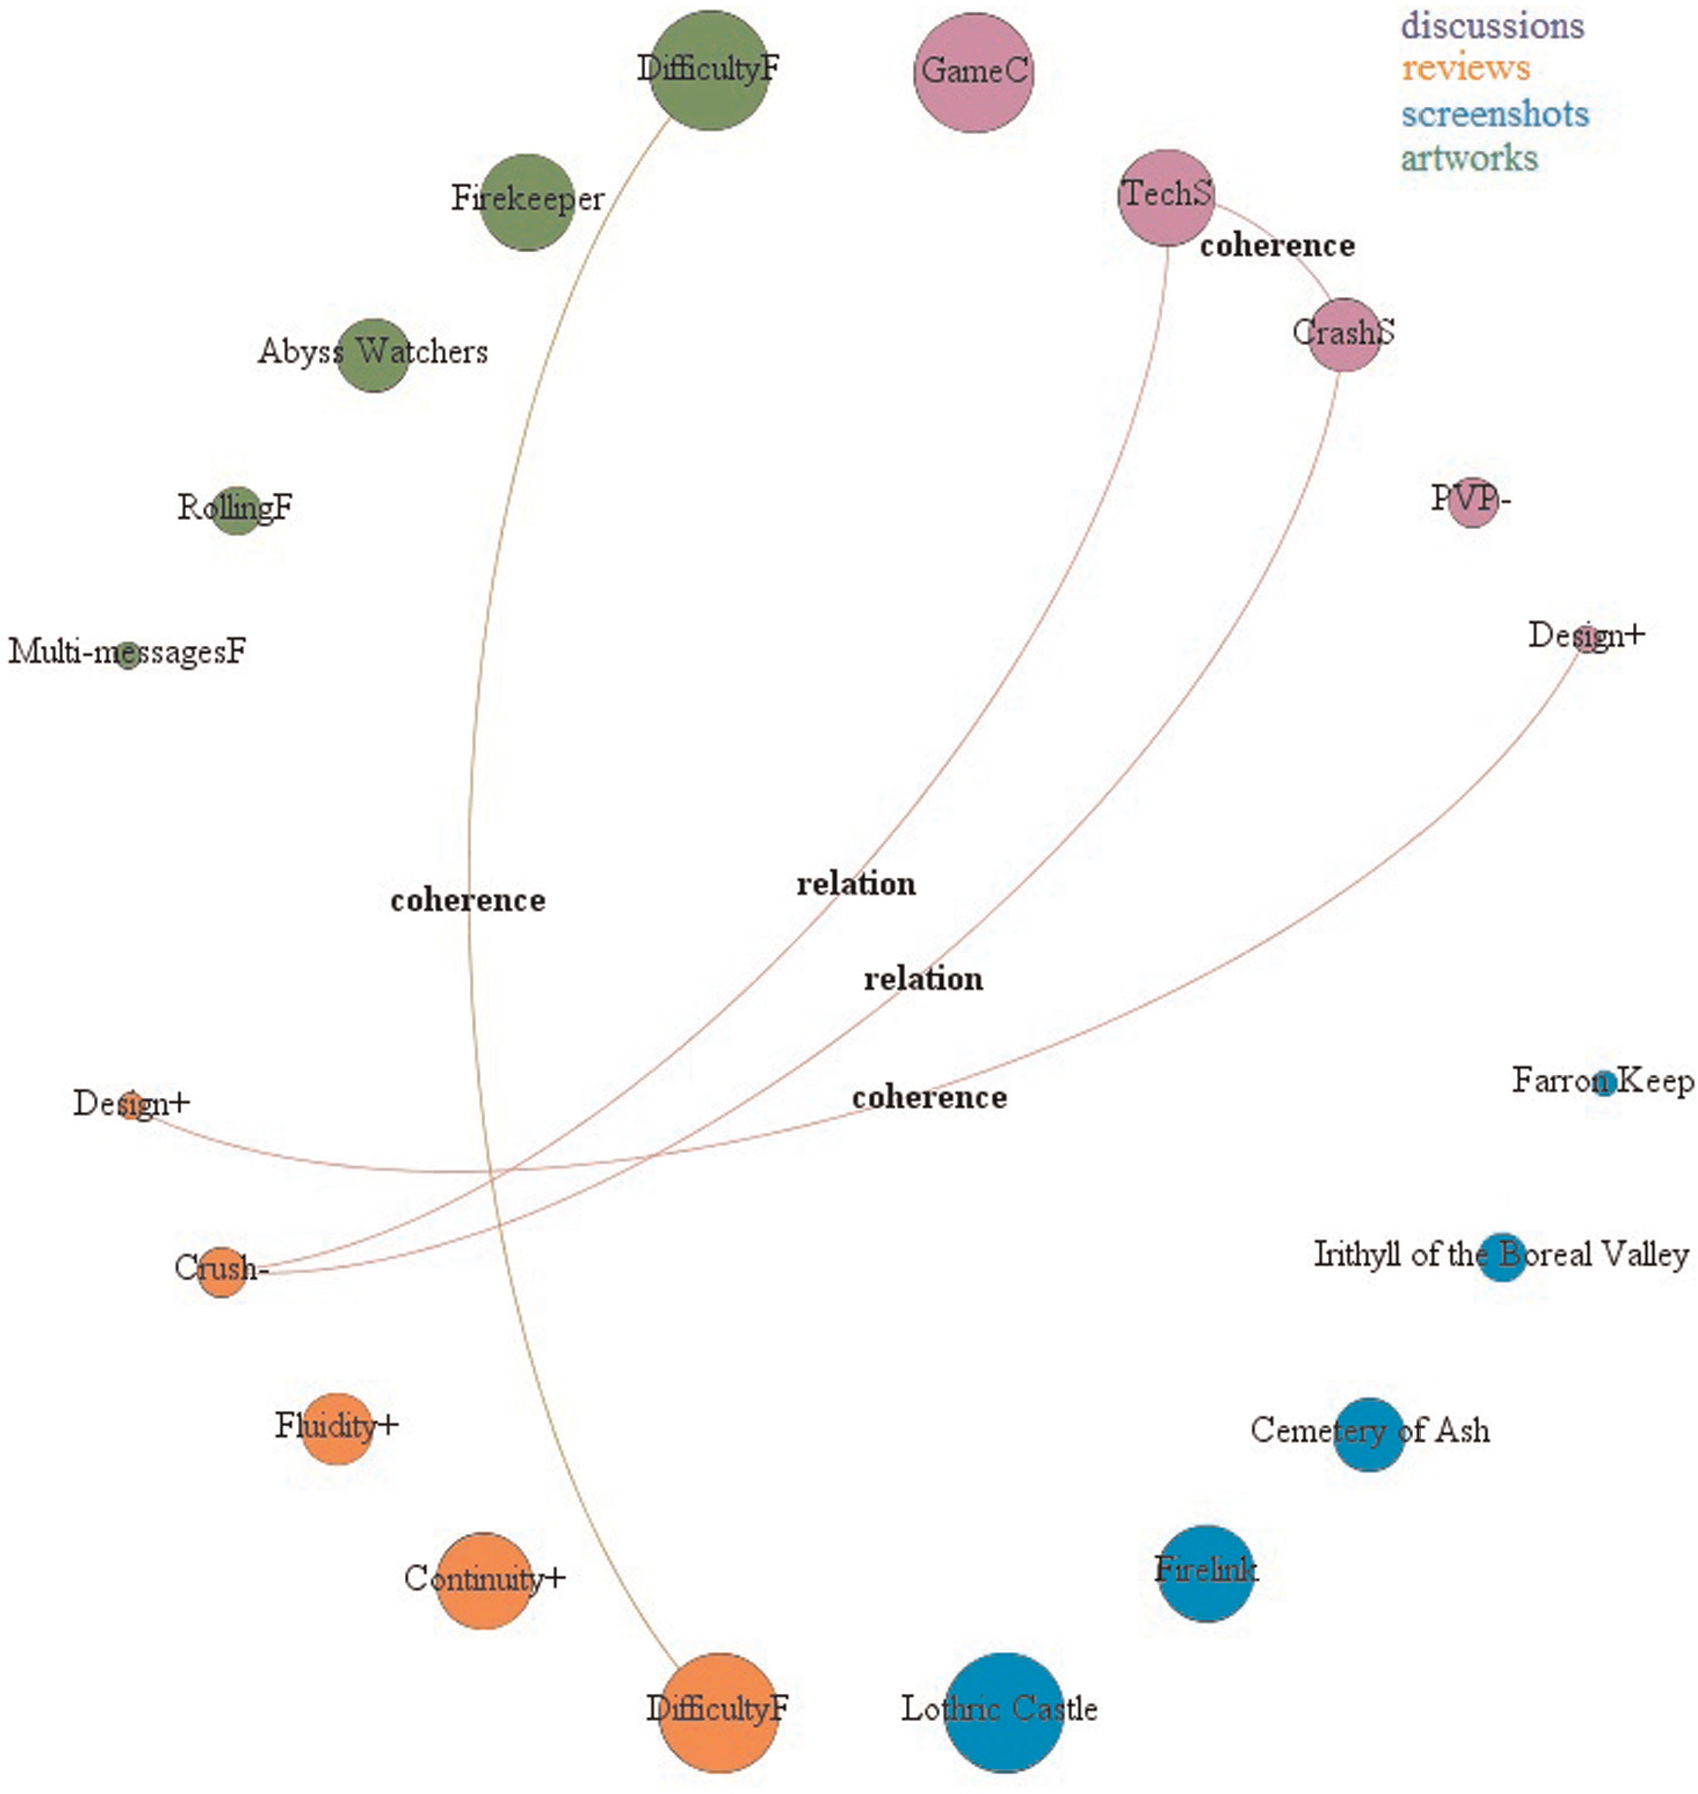
Steam—Unit 1.
Steam—Unit 2.
Steam—Unit 3.
Steam—Unit 4.
By observing the four networks, it clearly emerges a significant autonomy of each section in developing its own discourse about DS3. Discussions concern current issues in terms of technical support, debates about the game features, and request about specific mechanics. The thread that mostly contributed to “GameC” (the first topic in terms of popularity in each unit) was for connecting Russian players (Google translator tools were adopted to understand the general orientation of the posts with the help of a native speaker), followed by tech related threads—that is, gathering of technical issues and related assistance—(e.g. especially related to CrashS and TechS), which were often pinned by the forum admins (a further proof of how platform’s affordances can influence users’ activities). Forum threads tended to stability, and focused on primary needs—that is, making the game work and overcoming linguistic barriers (the thread in Russian worked as a mini-forum with heterogeneous topics, from game reports to strategies and technical bugs). In turn, reviews were more dynamic with a constant turnover. They depict the remarkable continuity with the previous chapters and especially the first Dark Souls (this reference was observable also in discussions and art and discussion sections—e.g. regarding the related character Solaire), although the more fluid gameplay was tied to Bloodbourne (a spin-off of the series published in 2015 and characterized by more frenetic dynamics). Level design and difficulty were usually emphasized as positive elements, and the cooperative mode worked as an inspiration for a particularly appreciated narrative review (tied to Coop+). Screenshots highlighted the esthetical quality of game details and locations with a specific prominence of Irithyll of the Boreal Valley, while the artwork section was characterized by an escapist focus (e.g. funny GIFs about the difficulty of DS3) and portraits of the boss Dancer of the Boreal Valley (especially referring to a strategy to beat him) and the Fire Keeper (the character that assists the protagonist in leveling up). Regardless, some topics were transversal across the Steam’s sections. For instance, the difficulty of the game was appreciated and became the subject of a multitude of UGCs confirming and strengthening the main identity of the Dark Souls brand. Passing to critiques, since Unit 2, the banning policy of Namco/Bandai represented a widespread topic, which activated a rise of negative inputs from the users and supporting reactions aimed to retrieve the game data lost. Finally, it is worth noting that PVP was disapproved because of other players’ behaviors rather than due to its mechanics per se.
The exploratory deepening of TD on Steam was particularly interesting and will be the focus of another article, which is currently under development. However, some differences from DS3’s data could be sketched out. First, the negative reviews (already mentioned in relation with Figure 4) were against the publisher itself and its policies (abuse of downloadable content (DLC), clone sequels, insufficient technical support) aside from the case study, while several posts in the discussion section defended Ubisoft and the game. Therefore, the initial TD-related activity on Steam seemed to be strongly affected by contextual factors. Second, game plausibility was celebrated in association with real New York’s places and skyline. Third, the Western theme was redundantly used (screenshot, artworks) in describing game dynamics (also based on diffidence among players), showing a cross-cultural reference that is absent in dealing with DS3.
Discussion and conclusion
The overview depicted in these pages aimed to represent a first step toward a game platform analysis mediated by a visualization technique. Despite the heterogeneity of the data collected and the cautious and explorative orientation of the study, results showed trends that may tell us more about digital games within gaming service platforms. It can be argued that the first two research questions were answered and Gephi-mediated networks have successfully supported this process. For instance, DS3’s twitchers first play-walkthrough, then experiment new strategies, and finally join online competitions and try speedruns; the choice of the mood evolves accordingly. In addition, the performer per se is the key element in attracting viewers rather than other variables. In turn, Steam is a more articulated environment with distinct sections. Nevertheless, specific topics can spread with a positive (Difficulty+) but also negative (Ban−, Crash−) outcomes. It was fascinating to notice how the community activated itself to provide a solution to the technical issues and built a bridge between different sources of content (e.g. discussion and reviews). The network visualization with Gephi allowed to detect these insights quickly with a remarkable potential of divulgation, and the ANT perspective theoretically supported this specific application, which can be defined as hybrid and speculative. Coherently, visualizing is an active and creative process rather than a passive and automatized attitude. 63 It allows researchers to categorize and trigger connections and even pro-active associations, and this study fits into such orientation starting from data collection to the visual communication of results. Further developments can address new methods and case studies to stress and problematize the driving hypothesis of the article, which is intentionally broad. Moreover, alternative approaches should be advanced to overcome the rank-based relation in visualizing Steam and its multiple contents (as the one adopted in Figures 11–14) and address Twitch.tv chat. Indeed, the latter is a significant space of debate within the platform, and it was overlooked in this study due to the emphasis on streamers. In addition, the fragments of discussion from the frames were not indicative enough to inform pertinent conclusions and uncover potential (dis)similarities with debating topics and highlights on Steam.
Regarding the third research question, the comparison showed little similarities between the two gaming service platforms indeed. Despite the alike trends in terms of popularity (see from Figures 1–4), potential common points (e.g. common strategies) were missing. Moreover and as already mentioned, the visualization technique worked better with Twitch.tv. This difference can be explained by the fact that the streaming portal’s actors (e.g. twitchers, locations) shared the same variable (i.e. number of views). Conversely, when they are associated with divergent parameters and functions (e.g. number of likes, number of posts, assessment rather than debating), the use of ANT shows limits in informing proper data rendering (i.e. Steam’s rankings are displayed as equals, but this was an author’s decision). Therefore, the hypothesis is narrowed down suggesting other visualization approaches and/or informing research theories with more prescriptive premises.
Implications can be significant for both researchers and practitioners. The former group may know more about these overlooked topics and expand the analysis itself by deepening other variables, gaming service platforms, and digital games. To pursue this line, after the publication the whole dataset (day by day with related frames, codes, and associations) will be made available online for free on the author’s website. Moreover, being such inquiry significantly wide, the focus might be more intensive and detailed by following specific categories of streamers and/or genres. The latter audience has the opportunity to acquire new knowledge about these settings, which provide several opportunities for better understanding players and online communities. It is not a case that YouTube, Sony, and Microsoft are activating services and features (e.g. within the console browser, YouTube Gaming) with strong similarities with Twitch.tv and Steam. Finally, these data can be compared with game metrics to comprehend if they match or not (e.g. is what and how I play different from what I watch?).
Regardless, the study presents five main vulnerabilities. First, there is a bias related to data gathering, the filter applied for framing the final dataset for visualization (e.g. top five positions, mediators selected), and the criteria of proportion and categorization. Regardless “The act of measuring, in itself, operates a bias, potentially affecting the analysis and the interpretation of the data,” 59 (p. 260) and the discursive analysis tools and references followed worked as instruments to reduce such a subjectivity. In addition and as mentioned above, this selection aimed to collect the more relevant entries from a user perspective, removing secondary information and building straightforward visualizations. Moreover, several traits and frames gathered were already embedded in DS3 (e.g. locations, moods) and/or activity on the two platforms (e.g. streaming types, threads’ titles) in an evident way. Second, data collection relied on snapshots of a specific moment with all the consequent limitations. Nevertheless, this choice was due to the partial inaccessibility of the two platforms for the peculiar purposes of this study, which go beyond players’ behaviors and statistics about reviews, views, and so on. Indeed, this type of information is more immediate to access and explore—for example, with the Steam Web Application Programming Interface (API), which is available for free. Third, the data acquiring process was challenging to perform due to its manual dimension, which could entail further anomalies. However, the recording software Camtasia properly supported the analysis and reduced this risk. Fourth, the analysis uncovered just one case study and a related counter-example, which means that further researches are needed to stress this approach, which was already relativized in deepening the latter on Twitch.tv. Indeed, DS3’s screenshots were particularly immediate to frame because of their intelligibility (e.g. quite linear progression, comprehensible mood). On the contrary, TD’s hub structure and non-informative characters’ outfit made streaming challenging to enlighten. Fifth, Steam is a PC-oriented platform, and this specific alignment partially affects the findings. For instance, the importance of the topics regarding technical issues is due to computer-based problems and questions (and it was also highlighted by discussion section’s admins), which did not occur in console versions.
In conclusion and despite these considerations, the desired outcome of this article is to have addressed a still new topic in Game Research by harnessing an alternative type of visualization. The intent is to have provided enough evidence and insights to inform further inquiries with similar scopes and rationales. For the long term, the hope of such a pro-active proposal is to represent the beginning of a path toward a game-service persona, originated by platform-related outputs and comparable with other ideal, observed, and data-driven types of players.
Footnotes
Funding
The author(s) received no financial support for the research, authorship, and/or publication of this article.