
Abstract
Current web-based visualizations are designed for single computers and cannot make use of additional devices on the client side, even if today’s users often have access to several, such as a tablet, a smartphone, and a smartwatch. We present a framework for ad hoc computational clusters that leverage these local devices for visualization computations. Furthermore, we present an instantiating JavaScript toolkit called VisHive for constructing web-based visualization applications that can transparently connect multiple devices—called cells—into such ad hoc clusters—called a hive—for local computation. Hives are formed either using a matchmaking service or through manual configuration. Cells are organized into a master–slave architecture, where the master provides the visual interface to the user and controls the slaves and the slaves perform computation. VisHive is built entirely using current web technologies, runs in the native browser of each cell, and requires no specific software to be downloaded on the involved devices. We demonstrate VisHive using four distributed examples: a text analytics visualization, a database query for exploratory visualization, a density-based spatial clustering of applications with noise clustering running on multiple nodes, and a principal component analysis implementation.
Introduction
Modern browsers have a lot to offer visualization developers, such as advanced accelerated graphics and support for multi-touch, gesture-based, and pen-based interactions. They also offer seamless integration with the entire web ecosystem, including remote databases, sophisticated web services, and online geographical map systems. Most importantly, the web browser is now ubiquitous on all devices—from laptop to smartphone and tablet to smartwatch—and requires no specific download or installation to run sophisticated applications. For these reasons, it is not surprising that the web is now one of the most popular target platforms for visualization. Accordingly, a host of toolkits, frameworks, and middleware exists for visualization development, such as D31 for creating declarative visual data–driven representations, PolyChrome 2 for duplicating visualizations across multiple devices, and VisDock 3 for providing cross-cutting interaction techniques to visualizations in a standardized tool dock.
However, the browser is still not an ideal computational environment for executing the kind of high-performance algorithms—such as cluster analysis, graph layout, or probabilistic topic modeling—that many visualization and, in particular, visual analytics applications require. One reason for this lies with JavaScript (one of the programming languages of the web browser) itself: it is an interpreted and weakly/dynamically typed scripting language that was never intended for high-performance computation. While it is possible to write high-performance program using JavaScript, this requires special care and in-depth knowledge to avoid the many pitfalls inherent in common JavaScript coding idioms. Browser-based JavaScript until recently had no support for multi-threading, which is critical for concurrent implementations of many popular algorithms. As a result, JavaScript libraries for scientific computing and other heavy computational domains were for a long time basically inconceivable. Fortunately, the HTML5 standard brings the Web Worker API (http://www.w3.org/TR/workers/), which allows for splitting computation across multiple concurrent threads of execution. This API, as well as the continuous improvement of browser JavaScript interpreters such as Google’s V8 engine (in Google Chrome), has led to JavaScript and the browser now also becoming a platform for scientific computing.
A major gap in web-based visualization development remains: distribution of computation across multiple devices. A common ecosystem 4 of a web-based visualization involves a user that has access to multiple devices in their immediate physical surroundings. For example, if the user is accessing the visualization using a laptop, they may also have a smartphone in their pocket, a smartwatch on their wrist, a tablet in their backpack, and a personal computer in their office. While offloading computation to a server-side or cloud-based component is certainly possible, it would make a lot of sense if the user was also able to fire up their additional client-side devices and use them for opportunistically offloading any heavy computation required by the visualization tool. Naturally, if users are analyzing a large dataset that requires significant computation, they can offload this to the cloud or a dedicated server. While cloud computing is capable of computational intensive jobs, however, it requires prior preparation, and creating a public server is by itself a considerable effort requiring a server-grade workstation along with data import and export interfaces with public access enabled. In contrast, opportunistically utilizing idle devices to help with the computation can be a simpler, off-the-shelf solution sufficient to extend visual analysis to larger scale. One aspect to note here is that in this article, we focus on datasets with a size of hundreds of thousands of items for visualization purposes. Compared to the server-based or cloud-based solution, this “local cloud” of co-located physical devices brings benefits to both end-users and developers. More specifically, the end-user can avoid any mobile network fees and minimize latency by confining the communication to the local area network (LAN), whereas the developer can implement concurrent computation using JavaScript in the visualization client and without having to worry about deploying a separate service for this purpose.
In this article, we propose VisHive (Figure 1), a JavaScript toolkit for creating this type of ad hoc, opportunistic clusters consisting of local, networked devices that are directly integrated in a web application, thus requiring no new server-side or client-side software. VisHive distributes stages in the visualization pipeline to multiple devices (see Figure 2). Many steps in this pipeline can be distributed by chunking the data and developing independent procedures in computational methods, thus facilitating faster computation. Using VisHive is straightforward for developers: they create a single web application using the framework and provide the computational logic that transforms data into visualizations. The assumption is that this logic has inherent parallel aspects: it can be applied to chunks of data or multiple steps within the logic at the same time. The framework takes care of the rest using the surrounding devices for creating the visualization interface.
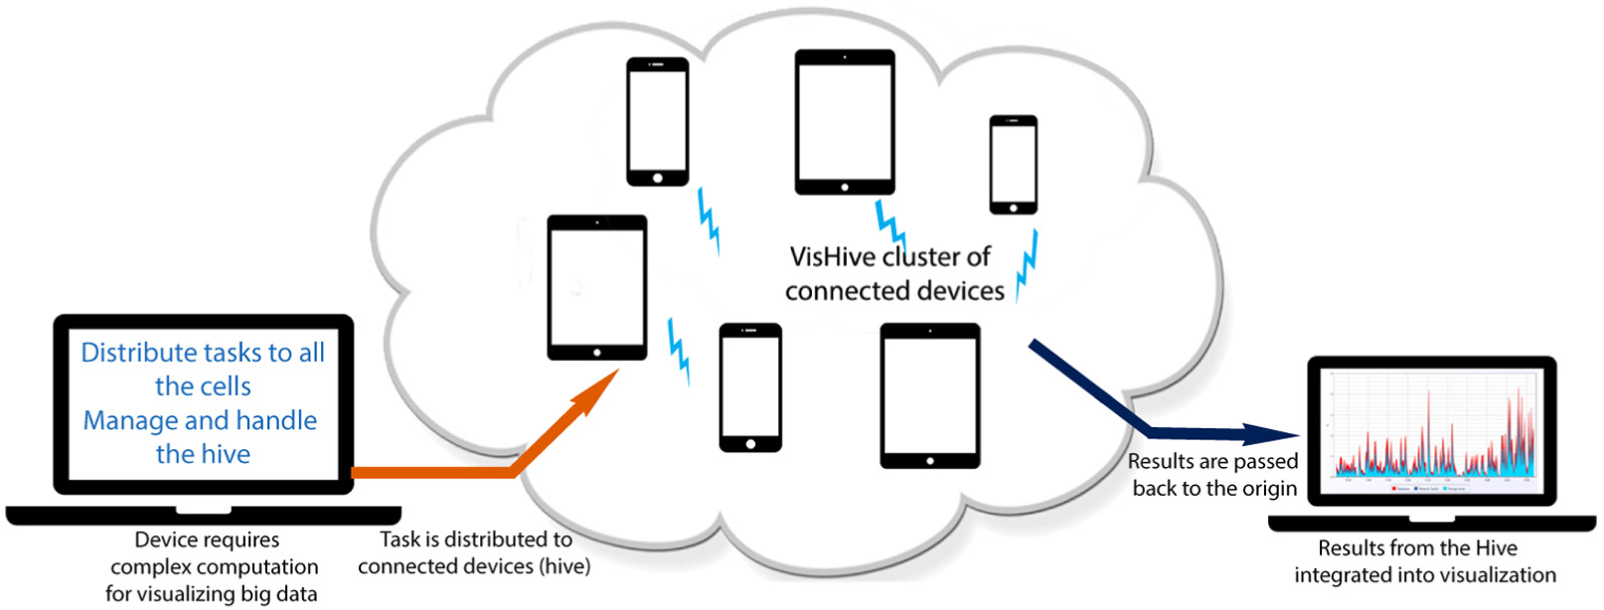
VisHive creates ad hoc and opportunistic clusters from the local devices available to a user. Here, laptops, smartphones, and tablet devices are connected into a cluster to handle complex computations. Connected devices contribute computational power using VisHive.
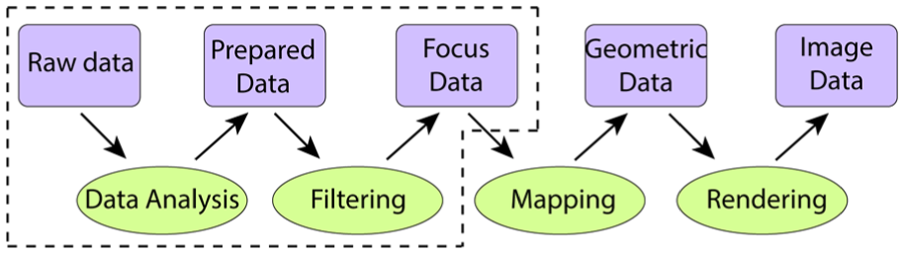
Basic visualization pipeline 5 (from http://www.infovis-wiki.net/index.php/Visualization_Pipeline). Data transformations, rendering, and view transformations can be processed in a distributed manner. The stages within dashed bounds are those that the proposed parallelism focuses on.
To demonstrate the utility of VisHive, we also present several examples of web-based visualizations using the toolkit instantiated from the framework to implement computationally expensive distributed algorithms:
Wikipedia text analytics: A distributed text analytics tool that dynamically crawls webpages from Wikipedia, analyzes them, and visually represents the text frequencies in a node-link diagram. It progressively adds nodes and links when new pages are crawled (data analysis, filtering, and mapping).
Incremental database query: 6 A large-scale query from a very large database is shared across multiple nodes to incrementally calculate descriptive statistics, such as mean, variance, minimum, and maximum (data analysis, mapping, and rendering).
Density-based spatial clustering of applications with noise (DBSCAN): a distributed implementation of the density-based spatial clustering algorithm. The algorithm manages noise and does not require specifying the number of clusters a priori. Clustering results are visualized before and after applying the algorithm (data analysis, mapping, and rendering).
Distributed principal component analysis (PCA): a distributed eigenvector approach for PCA for dimensionality reduction (data analysis and rendering).
Performance measurements for these VisHive examples on various combinations of devices—laptop, tablet, and smartphone—show a significant time improvement using the toolkit compared to single-device computation.
The framework provides a new opportunity to conveniently build visualizations that integrate opportunistic offloading of computation to surrounding networked devices. However, the framework augments rather than replaces server-based, cloud-based, or cluster-based computational frameworks that are commonly being used to power web applications and visualizations today. To facilitate this mission, our implementation of VisHive is built in JavaScript using standard web technologies, thus requiring no separate download for each participating cell; off-the-shelf devices can immediately run the toolkit. In summary, our work has the following contributions:
A framework for ad hoc computational clusters integrated with the standard visualization pipeline, thus supporting opportunistic offloading computation to nearby devices;
A toolkit called VisHive implementing ad hoc computational clusters as a JavaScript library that runs in modern web browsers with no further downloads;
Four examples of using the VisHive toolkit to improve the performance of visualization applications; Performance measurements showing significant speedup for VisHive applications running on multiple devices compared to single-device implementations.
In the remainder of this article, we first give a background on the literature in this area. We then discuss the design space of ad hoc computational clusters for visualization. We specifically discuss computational challenges for visualization. This is followed by a description of the VisHive toolkit itself. We present our examples and give code snippets of how they are implemented. We conclude with a performance evaluation, a discussion of the results, and our concluding thoughts.
Background
In this section, we discuss existing literature on distributed computing, especially on mobile devices, web-based visualization methods, and visual analytics for big data. We focus on the specific components relevant to the design and construction of VisHive.
Distributed computing on mobile devices
There is significant previous research on building distributed computing framework on clusters consisting of mobile devices. They use different approaches for cluster maintenance and communication for information transmission. Lin and Gerla 7 first proposed a mobile network where nodes would be organized into non-overlapping clusters that are independently controlled and dynamically loaded. The proposed cluster algorithm is robust to node failure or addition/deletion. Wang and Kim 8 presented a bandwidth adaptive clustering approach for mobile ad hoc networks that maintains clusters using local topology information only. In their approach, the member nodes forward only the maintenance messages probabilistically based on available bandwidth. This ensures adaptability to network conditions and reduces message overhead. Lee et al. 9 discussed the challenges and advantages of utilizing mobile devices for distributed analytics based on an implementation of the Hadoop framework. Based on a performance analysis of their implementation, they concluded that current mobile devices face significant limitations on transmitting and receiving reliable transmission control protocol (TCP) data streams, which is required to avoid interruptions during distributed analytics. In our setting for VisHive, the physical proximity of devices (within several meters) pushes us to use more reliable and high-speed data transmission protocols, that is, wireless LAN.
A number of computation offloading frameworks have also been proposed for computationally intensive mobile applications.10–12 Such applications are said to be elastic in nature, and each approach partitions problems at different levels of granularity at runtime. In most cases, the distributed application processing platform is composed of a mobile device that runs a local application, a wireless network medium, and a remote cloud server node. In cases where there are insufficient resources on the mobile device, an elastic mobile application can be partitioned such that any computationally intensive components of the application can be offloaded during runtime. Cuckoo, a computation offloading framework for smartphones developed by Kemp et al., 13 allows computation offloading from Android phones to a remote server. In comparison, Hassan and Chen 14 showed in their study of computing-intensive mobile applications that outsourcing these computations to nearby residential computers or devices may be more advantageous than public clouds due to network impact. This is also one of the motivations for our work. Shiraz et al. 12 showed that current mobile computational offloading frameworks implement resource-intensive procedures for offloading. This involves the overhead of transmitting application binary code as well as deploying distributed platforms at runtime. Runtime computational offloading is also useful in decentralized distributed platforms, such as mobile ad hoc networks. Shiraz et al. note, however, that remote server nodes are unpredictable and computational offloading should therefore be performed on an ad hoc basis at runtime. This motivated us to design our framework as an ad hoc network of nearby mobile devices that perform computations on demand.
Visualization on the web
Toward the turn of the century, the pervasiveness of the web had led to many changes, including one important application: visualization in the browser. Rohrer and Swing 15 note that the web is essentially a fundamentally new medium for visualization. Today, virtually all computational devices—both personal computers and mobile devices—provide full-fledged web browsers as part of their standard software distributions. Mobile devices have grown increasingly capable and have enjoyed widespread adoption, even in countries with less advanced technical infrastructures. For this reason, mobile computing has quickly become the universal computing platform of the world. 16
Web-based visualization toolkits include Protovis 17 and D31 as well as more generic graphics toolkits such as Processing.js, Raphaël, and Paper.js. Most prominent of these is D3, proposed by Bostock et al., 1 which provides a direct binding between the input data and the document object model (DOM). Because of its prominence, we use D3 as the target platform for web-based visualization in VisHive.
Meanwhile, work in distributed computing is trying to achieve the same success using the browser and the web as the base platform for parallel and high-performance computing. Martínez and Val 18 first proposed the idea of using standard web technologies for distributed computation across multiple devices in 2014 and later presented the Capataz 19 framework for distributed algorithms across the web. While similar in scope if not in goal to VisHive toolkit (Capataz lacks visualization integration), their framework uses a client/server architecture with a dedicated web server. VisHive, meanwhile, is a pure peer-to-peer (P2P) system and requires no specific server-side code or even dedicated computational server.
Big data analytics and visualization
Big data visualization typically involves two main challenges: perceptual and computational scalability. 20 Perceptual scalability is outside the scope of this article; representative work includes that of Ahlberg and Shneiderman 21 for filtering, Sarma et al. 22 for spatial sampling, and Carr et al. 23 for aggregation for scatterplots. Furthermore, techniques to handle big data have been introduced for specific data types and application domains. For example, Fisher et al. 24 showcase techniques for tackling business intelligence, Wong et al. 25 discuss challenges facing extreme-scale visual analytics, and Steed et al. 26 developed a visual analytics system for the analysis of complex earth simulation datasets.
Recent years have seen an influx of work on computational scalability for visualization. Liu et al. 27 developed a visual analysis system called imMens, which uses WebGL for data processing and is based on the principle that scalability should be limited by the chosen resolution of the visualized data and not the total number of records. Nanocubes 28 is another approach focused on visualizing and analyzing very large datasets based on a compact data cube representation. Choo and Park 29 propose methods such as data scale confinement, classification of pre-clustered data, and linear transforms of higher dimensions to deal with scalability for visualization.
Finally, a recent trend in tackling big data for visualization is progressive visual analytics (PVA) 30 and incremental visualization, 31 where partial results from complex and lengthy computations are visualized during the process, allowing the user to better guide the analysis. Several PVA and incremental visualization systems exist; for example, in a recent work, Badam et al. 32 propose a computational steering interface for controlling and guiding PVA and incremental approaches while they are executing. Our work in this article is primarily focused on computational scalability, since the framework is intended to increase the performance of a visualization application using multiple devices at a low level of abstraction. For this reason, the proposed framework is not a competitor to PVA and incremental visualization; in fact, the toolkit can help provide the underlying backbone for progressive and incremental visual analytics.
Computational challenges for visualization
With the rise of big data and increasingly sophisticated analysis methods, scale remains the dominant computational challenge for visualization. Put simply, the bandwidth, memory, and computational demands of modern data problems are often too large for a single workstation to manage. These challenges are exacerbated by the fact that visualization is increasingly being moved to the web 15 and thus no longer have full access to the computational power of a desktop computer; in fact, with the proliferation of mobile computing, it is even more likely that a visualization is viewed on a mobile device such as a tablet or a smartphone than a personal computer altogether. 16
The standard solution for resource-hungry visualization applications is to turn to client/server solutions, where a thin client in the user’s browser offloads the bulk of any computation to a server with significant capacity. However, in this article, we propose a complementary solution based on opportunistically creating ad hoc computational clusters utilizing local devices in the vicinity of the user. In the following, we discuss the strengths and weaknesses of both approaches.
Standard: cloud or server-based computing
If the visualization client is insufficient for a resource-heavy computation, the standard solution—particularly for web-based ecologies, where there already is a server infrastructure in place—is to offload the computation to a server on the Internet (or in the cloud). This requires the use of server-side middleware, such as Node.js (http://nodejs.org/), Flask (http://flask.pocoo.org/), or Ruby on Rails (http://rubyonrails.org/), which will communicate with the client using protocols built on top of hypertext transfer protocol (HTTP).
Strengths: Flexible, powerful, and standardized.
Weaknesses: Non-trivial setup, prior planning, potentially costly, and security concerns.
Novel: ad hoc computational clusters
Our main contribution in this work is ad hoc computational clusters on the client that take advantage of opportunistic ecosystems of devices in the near vicinity. The goal is to simply leverage the idle computing power of these devices to mitigate scale for visualization computations. By virtue of integrating this distributed computing capability within the visualization client itself, our framework provides a tighter loop that allows for several parts of the visualization pipeline to be offloaded onto multiple devices.
Strengths: Lightweight, no setup, no downloads, no prior configuration, leverages existing, and idle computing power.
Weaknesses: Limited in scale, bandwidth-intensive, and requires distributed computing knowledge on behalf of the visualization programmer.
Design framework: ad hoc computational clusters for web-based visualization
The web is becoming a ubiquitous medium for sensemaking through visualizations, 1 sharing visual insights from data, and harnessing collective intelligence. 33 However, there is a lack of research in ad hoc mechanism for executing computationally intensive algorithms commonly needed for visualization and visual analytics on the local client. As discussed in the previous section, the goal of our ad hoc computational cluster framework is to facilitate the creation of ad hoc device clusters using standard web technologies. The driving scenario behind the framework is the fact that people today tend to carry more than a single device with them at all times. Leveraging these devices together can help scale our analytics applications to the challenges of big data.
In general, visualizations follow a transformative pipeline that turns data into interactive graphical representations through multiple stages. 34 To target visual analytics of big data, we need distributed frameworks integrated with the visualization pipeline using connected local devices to generate a visual representation and handle user interaction. For this purpose, in the following, we list seven design guidelines driving the ad hoc computational cluster framework.
Networked devices
The fundamental requirement for a distributed system is a network of connected nodes. Thus, the framework should be capable of connecting multiple devices into a distributed system.
D1 Cross-platform support: The devices used by analysts for personal computing and sensemaking can be diverse, ranging from personal computers to mobile devices. Therefore, the framework should work independent of the underlying platforms, modality, and physicality of these devices.
D2 Ad hoc connectivity: A user should be capable of opportunistically creating a cluster from available devices. This includes adding to or removing devices from the clusters at any point.
P2P networks are ideal for this purpose35,36 as they do not set a hierarchy among the devices and they do not require a dedicated server infrastructure to create clusters.
Responsive distribution
Once the devices are connected into a distributed system, supporting computation on the device cluster requires intelligent management of the connected devices. The challenge in this case is to ensure that adding or removing devices at any point does not interfere with user activity within the visual analytics system.
D3 Responsive computation management: All available devices should be free to contribute processing power to computational activities. Computation jobs assigned to devices within a cluster should not only be based on the processing power and available memory on the device but also based on their current use.
D4 Fault tolerance: Devices entering the cluster should immediately be assigned new jobs, and devices leaving it should be able to return a job unfinished so that other devices may take up the remainder of the job. This mechanism should also be robust in the face of device or network failure.
Supporting visualization and interaction
Visual analytics systems often utilize computationally complex algorithms. For example, browsing histories of users can be used to generate and visualize spanning trees in order to understand their web traversal history. 37 Machine learning and data mining models are also used to identify specific features, visualize interesting patterns, and prompt user exploration.38,39 While some of these models are inherently parallelizable in their logic, it should also be possible to configure how the underlying algorithm can spread across the clusters of varying sizes and resources.
The data transformation, rendering, and view transformations are the basic data manipulation processes in the visualization pipeline (Figure 2). Our goal is to distribute tasks to the whole computational cluster and make the processes parallel within the pipeline and to reduce the overall delay of visualization systems.
D5 Distributed processing: Algorithms for distributed processing, such as MapReduce, 40 should be applied to chunks of data across the ad hoc clusters. The framework should also support defining a distributed version of an algorithm at each stage of the visualization pipeline (Figure 2) with features to adapt the algorithm to the specific cluster.
D6 Data-driven distribution: The distribution of jobs to multiple devices should be adapted to the dataset itself based on the attributes, data types, and sources. Computations in the visualization pipeline involve transforming data of one form (input) to another (output) at each step. Similar to popular big data systems (e.g. Hadoop Distributed File System (HDFS) 41 and Google BigTable 42 ), it should be possible to create job chunks for devices in the cluster by splitting any dimension of the data. For example, in spatiotemporal data, jobs can be created either by splitting data based on time or space, in order to reveal incremental details in the visualization when the data are being processed by the cluster.
D7 Handling user interaction: User interactions are essential for interactive visualization in visual data analysis. Interaction steers the visualization pipeline to focus on specific data subsets and encodings to promote focused visual analysis. Specifically, corresponding computations should respond to user interactions; outdated computations should be stopped and new computations should be started based on the user’s focus conveyed through interaction.
The VisHive toolkit
The VisHive toolkit is developed for building ad hoc and opportunistic clusters of computing devices for web-based visualization. It is implemented completely in JavaScript to target the web platform, thus providing cross-platform support (D1). It uses the WebRTC standard by W3C (http://www.w3.org/TR/webrtc/) for establishing P2P connections across web browsers. Since the web is the target platform, the devices—called cells—are connected into a device cluster—known as a hive—as soon as they open a VisHive application webpage on the web browser (D2). The toolkit provides modules for structural definitions of distributed algorithms based upon the attributes of the hive (D3) and handles entering/leaving cells in the hive (D4). The toolkit integrates closely with the visualization pipeline, allowing developers to handle the stages in the pipeline in parallel using the connected devices (D5, D6, and D7). Figure 3 shows the network architecture of an VisHive toolkit example. The VisHive toolkit is open source and can be accessed online at: https://github.com/zhecui/vishive.
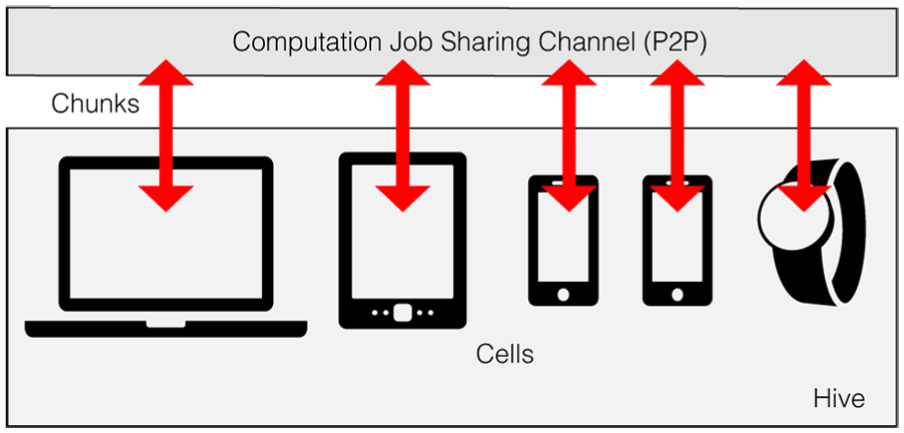
Example VisHive application network architecture.
System/network architecture
The VisHive toolkit consists of five components to fulfill the design requirements above (Figure 4):
C1: Job partition layer that divides a high-level computation operation into computation jobs (chunks);
C2: Communication layer to share chunks across cells;
C3: Computation layer that runs the tasks and combines the results from all cells and passes them to the web visualization;
C4: Job control layer handling cells entering and leaving the hive (fault tolerance);
C5: Matchmaking service that connects multiple devices in a specific physical space into clusters (hives).
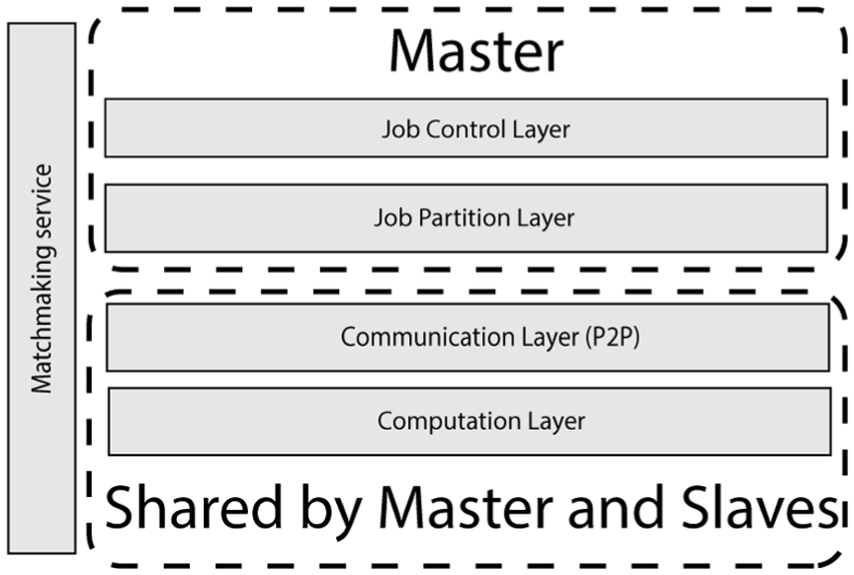
VisHive toolkit infrastructure containing five components to create and manage distributed computation jobs (chunks). Master manages job control and partition. Both master and slaves share communications and can join as a cell for computation. Matchmaking service can reside on any devices, including master and slaves.
Figure 4 depicts the VisHive architecture with these components. VisHive uses a P2P network architecture established across the browsers of the cells using WebRTC technology, popularly used for real-time video calls over the web browser (https://apprtc.appspot.com/). Our implementation uses the open-source PeerJS framework (http://peerjs.com/) for establishing P2P connections across the cells. The P2P connection creates the communication layer (C2) for transferring chunks to the cells within the hive. Only the matchmaking service (C5) is centralized and requires a dedicated server component (this is commonplace for many P2P applications); other components are based solely on standard web technologies. Providing a centralized matchmaking server is easy and can be achieved with scalability to serve a large number of hives.
The control of the distributed system lies inherently with the instance that the user actively interacts with. The toolkit is not designed for collaborative visualization; thus, VisHive supports just one active user interacting with a distributed application on a device. This way, the controlling instance, or master, takes the help of other idle devices, or slaves, to share computations among them. One thing to note here is the difference between a typical P2P architecture and our implementation. While the devices are connected by the P2P network, the VisHive master keeps track of computations assigned to each of the slaves to collect the computed results back from them. The master, therefore, manages the splitting and sharing of computations. This structure is resilient as it takes advantage of the P2P connection, while flexibly allowing any device to act as the master based on the user’s focus. In general, if the user focuses on a device, results are expected to be shown on that device, so it acts as the master.
Matchmaking and communication
Hives are initialized on the matchmaking service, a modified web server built in Node.js that typically runs on a local device such as a laptop or, alternatively, on a remote cloud-based server. The first device to connect to the hive automatically becomes the master; this can be manually changed. Additional cells are connected by navigating their browsers to the matchmaking URL, thus adding them to the P2P communication channel. As these cells join the hive, they share details on their capabilities based on the client and operating system.
The matchmaking server only manages the P2P session for the hive. It does not handle data management, job allocation, or computation. These are the responsibility of the master, which is a special cell. Since the VisHive toolkit targets ad hoc and opportunistic device clusters (e.g. between an analyst’s smartwatch, smartphone, and laptop), this registration process ensures that distribution happens in an environment-aware fashion.
After the cell registration process, individual cells are capable of accepting the computation chunks involved in each stage of the visualization pipeline (C1). When a master shares computation jobs with the slaves in the hive, the cells accept the jobs and look up the input data from the job definition. Cells will then perform the required computations on the input using the shared computational models and send the output back to the master to be recombined.
Masters and slaves
Regardless of whether a cell is a master or a slave, they use the same JavaScript codebase, thus making application development simple (Listing 1). The client programmer simply has to provide a master implementation, consisting of the visualization and interaction part of the web application, as well as a separate slave implementation, which handles the computation. The programmer also has to provide an implementation for recombining results. This follows practice in distributed algorithm design, such as MapReduce. 43
JavaScript code for initializing VisHive in a standard web-based visualization.
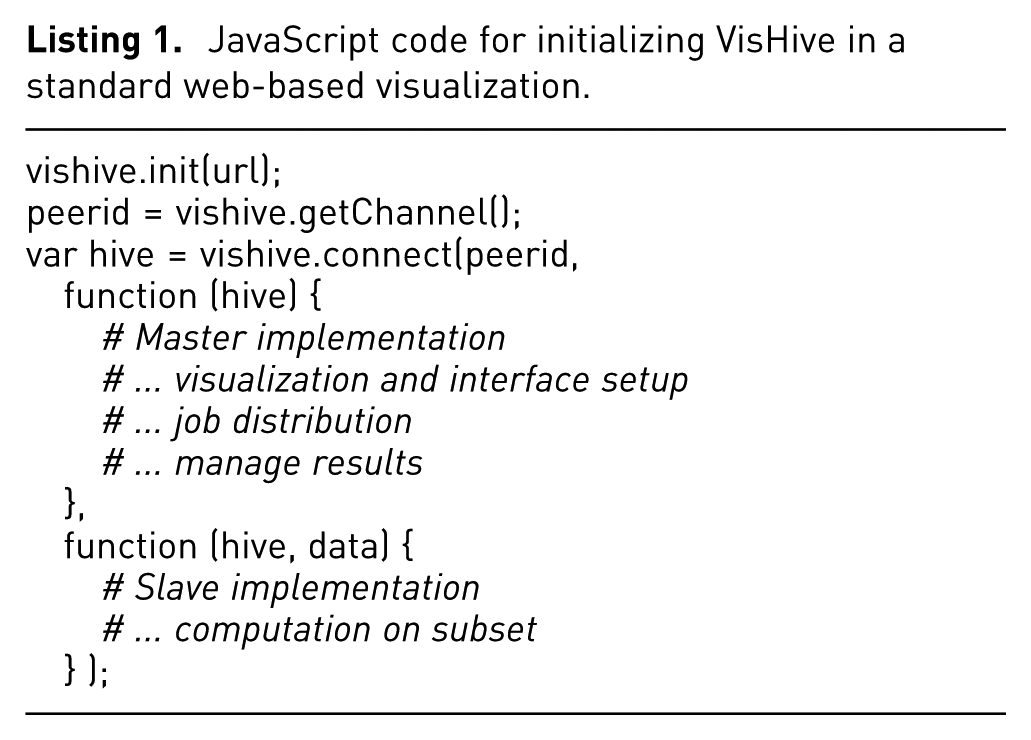
Due to VisHive’s clear separation of concerns between masters (interface and visualization) and slaves (computation), a hive consisting of only a master would not make any progress on the computational task. In practice, VisHive allows the master to also run a slave instance in a parallel thread (web worker) to allow the application to perform the computation on the same device. This ensures that progress can be made even if no computational resources are available other than the device on which the master is running.
Note that the master–slave architecture is independent of the matchmaking service mentioned above. The matchmaking server can reside on any device within the same network. It may or may not be one of the devices in the hive. It only manages establishing the connections between participating devices. This is quite common in P2P architectures. 35
Job allocation and control
Job allocation and control within the VisHive distributed system is handled by the C1 and C4 components of the toolkit. Each computation job (chunk) is treated as a mapping from input to output generated by shared computation logic, similar to the MapReduce model 43 for processing big data on parallel and distributed systems. The default configuration for job partitioning involves splitting the input data for a high-level computation into jobs that each slave works on parts of the data. The job allocation module creates the chunks based on the available resources on each cell and the number of cells in the hive (including the master and the slave cells).
Take mean calculation, for example. Assume that the dataset has 1000 entries and one column data point for simplicity, and there are four devices available for computation. The job allocation is to split the dataset into four chunks (250 entries one chunk for an even split) and to assign each chunk to each device (sending data). Devices compute mean of the partial dataset and send results back. The actual allocation process of how to split data is provided as API (discussed in later section), so the user can define their own data chunks.
Explicit application logic created by the VisHive application developer (end-user developer) for splitting a computation (and input) into chunks is also supported.
Fault tolerance
The job control component (C4) is responsible for automatically detecting when existing cells leave or new cells enter the hive. Leaving the hive also includes device or network failure, when devices leave unexpectedly. This is detected by the master, in which case the assigned chunk is retracted and added to the top of the queue for reassignment. Similarly, a cell that enters a hive gets added to the queue of available computation cells immediately. When master fails, the matchmaking service assigns the next device that first joins the hive as the master.
When a slave cell receives a job chunk to process but does not respond back to the master in a timely manner (this may be due to disconnection, node failure, or slow computation), the cell will be regarded as failing and this chunk of job will be reassigned to other available cells. In this way, VisHive deals with cells entering and leaving the hive at any time. Generally speaking, to make the system simple and easy to maintain, master treats all non-responsive cells as failing. This may cause duplicate jobs when one cell has network problems, causing the master to assign the job to another cell, only to have the original cell return with the result. While this does waste computational resources (for one chunk), it is an efficient way for VisHive to operate reliably.
VisHive provides all of the mechanisms for distributed algorithms, but does not actually implement any specific algorithm. Thus, it is up to the application developer to implement the data processing algorithms in the visualization pipeline, including how the data are split to distribute the jobs. In particular, the toolkit assumes that any conflicts occurring during the integration process that are application-specific are handled by explicit application logic developed by the client programmer.
Visual interface
The VisHive toolkit is closely integrated with the visualization pipeline. 5 Following this model, each stage of the pipeline involves transforming an input into an output. Beyond supporting the main visualization interface, the toolkit provides a console (Figure 5) that contains the status of all the devices within the existing computational cluster. Implemented as a separate widget that can be hidden as needed, the console both gives controls and shows the status of the current hive, connected cells, and any ongoing computation progress. This supports monitoring progress in each of the visualization stages. For example, data cleansing involves converting the raw data into a structured data structure, which requires going through individual data points, parsing them, and processing through each cell. This can be managed through the interface. In case of large datasets, this operation can be expensive due to the sheer amount of data. VisHive can split the data into chunks and assign them to different computational jobs that can be processed across the cells in the connected hive (C1), while enabling real-time updates and control of the process.
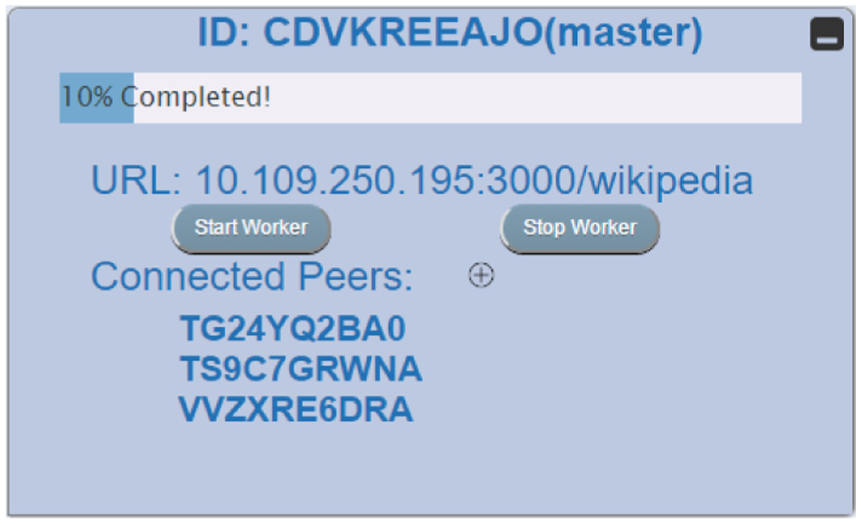
VisHive console widget showing controls and status for the hive, its cells, and the current computation.
Implementation notes
VisHive is a pure JavaScript toolkit implemented using the PeerJS toolkit for P2P communication and using the D31 toolkit for rendering visualizations. More specifically, VisHive events can be explicitly bound to D3 joins so that the visualization can be automatically updated when the data are loaded, a chunk is calculated, or the computation is finished. For example, the “plot” function in VisHive API (Listing 2) handles D3 state (enter, update, and exit) execution. When the function is called, it recomputes the join and maintains the correspondence between elements and data. 44 In this way, visualizations in VisHive are integrated with D3 joins. With the exception of the matchmaking service, all components run directly in a modern web browser without requiring specific software. The matchmaking service can either be run locally, in which case a Node.js installation is required, or on a remote cloud server.
VisHive API declaration in JavaScript.
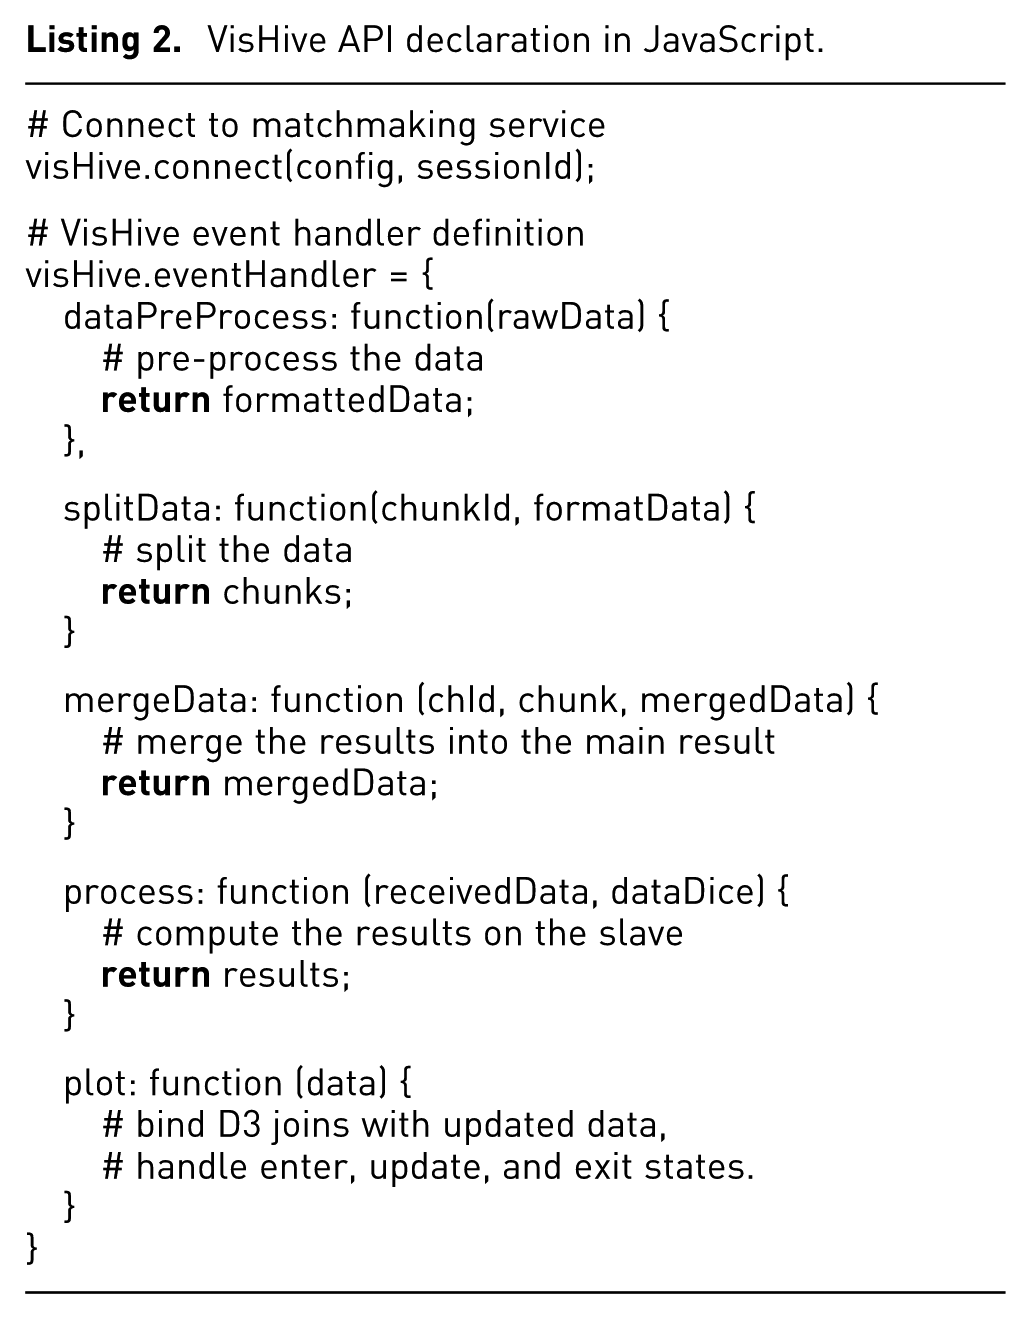
VisHive API
To demonstrate how to use the VisHive toolkit to aid with distributed computing for visualization, we here discuss the functions in the API that developers can override to integrate into the VisHive toolkit. Codes for function declarations are in Listing 2. The API contains five main functions: data preprocessing, split, integration/reduce the results, job process on devices, and visualization.
Examples
To showcase the utility and the flexibility of the VisHive toolkit, we implemented four examples that demonstrate different common computational needs for visualization applications: (1) a distributed text analytics visualization, (2) a distributed incremental database query for exploratory visualization, (3) a clustering algorithm, and (4) eigenvector calculation for PCA. To detail the implementation use cases, we provide the pseudocode and explanation of the progressive text analytics visualization example.
Distributed text analytics for large document corpora
Visualizing results from text analytics can reveal characteristics of and relations between articles in a document corpus. However, many information retrieval algorithms involving word frequency counting are limited due to significant processing time for large-scale document collections. This process can be made faster through multiple devices, each working on a different part of the document corpus.
Our text visualization example is designed for visualizing Wikipedia by counting word frequencies for Wikipedia articles in a distributed manner, crawling text documents from Wikipedia web, calculating Term Frequency - Inverse Document Frequency (TF-IDF) scores across multiple devices, and visualizing articles and their relationships using a node-link diagram (Figure 6). We use TF-IDF 45 for simplicity; other, more sophisticated, text analytics metrics are also possible.
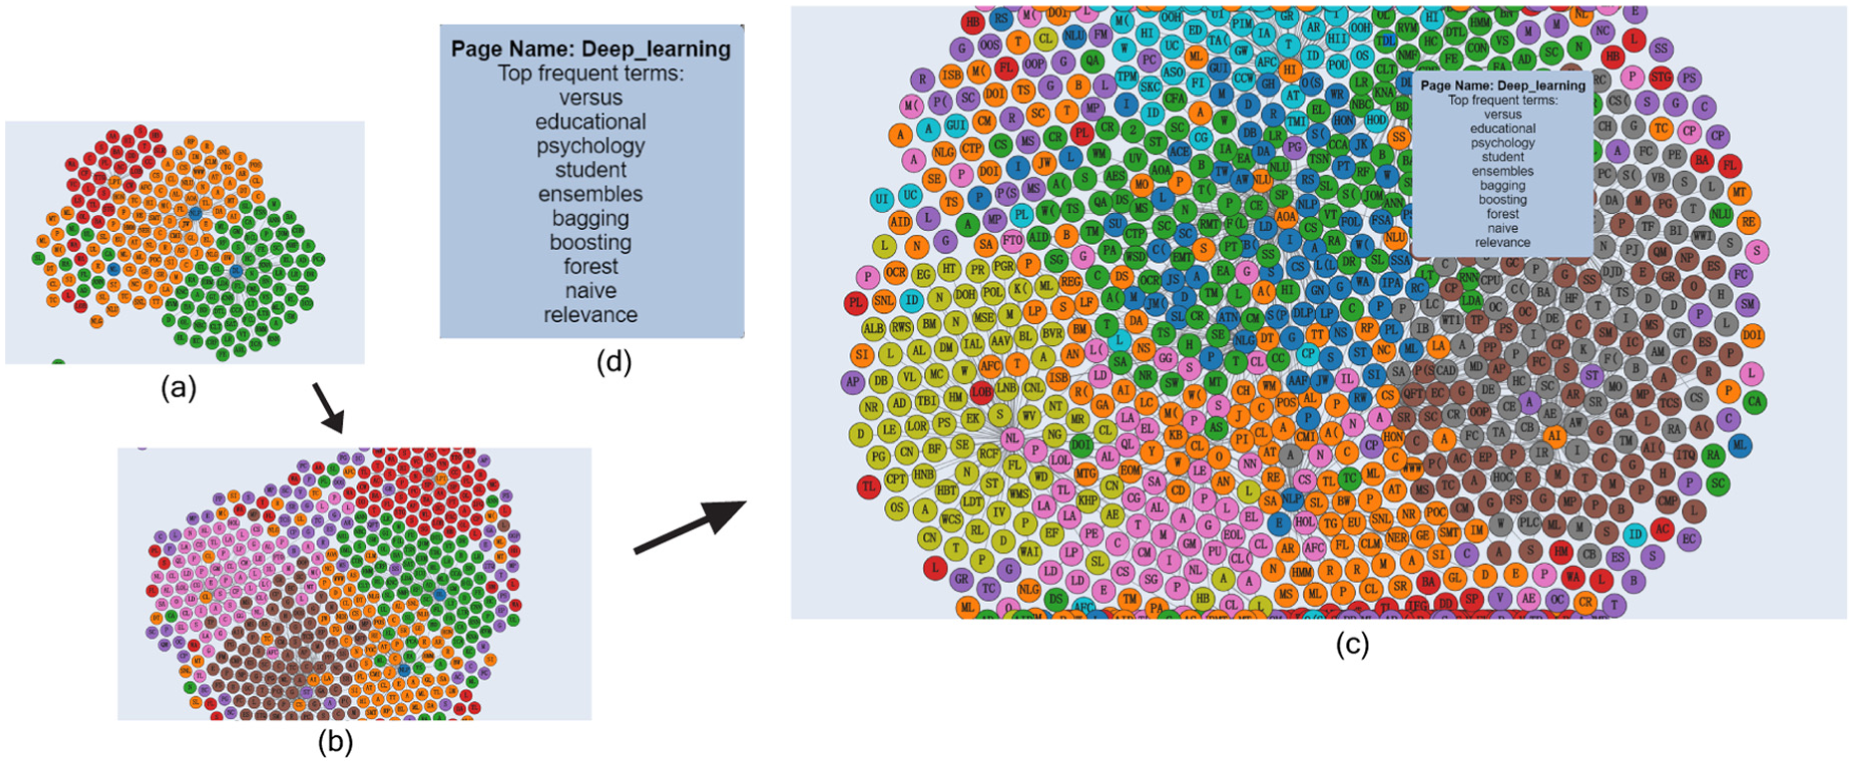
Node-link diagram visualization for different number of Wikipedia articles. (a) 200 nodes, (b) 500 nodes, and (c) 1000 nodes. (d) The tooltip with top frequent terms for one article (deep learning); nodes are Wikipedia articles, labeled initials of article name (e.g. DL = “Deep Learning”); links represent hyperlinks between pages; mouse hover shows info on each page.
Implementation
In our distributed implementation, the master assigns article links (English) from a central first in–first out (FIFO) queue to cells in a breadth-first article crawler. Cells retrieve the articles using the Wikipedia API (https://www.mediawiki.org/wiki/API:Main_page), calculates the word frequency table for the article, and identifies all of the internal Wikipedia article hyperlinks. The frequency table is returned to the master, updating the central word frequency table as well as the TF-IDF rankings for the existing nodes. Furthermore, new hyperlinks that have not yet been crawled are added to the central queue. The corresponding node-link visualization on the master is updated with top keywords once all the results are returned from all the slaves. Master deletes the existing scalable vector graphics (SVG) and renders new one using D3 when new computations are finished due to user interactions.
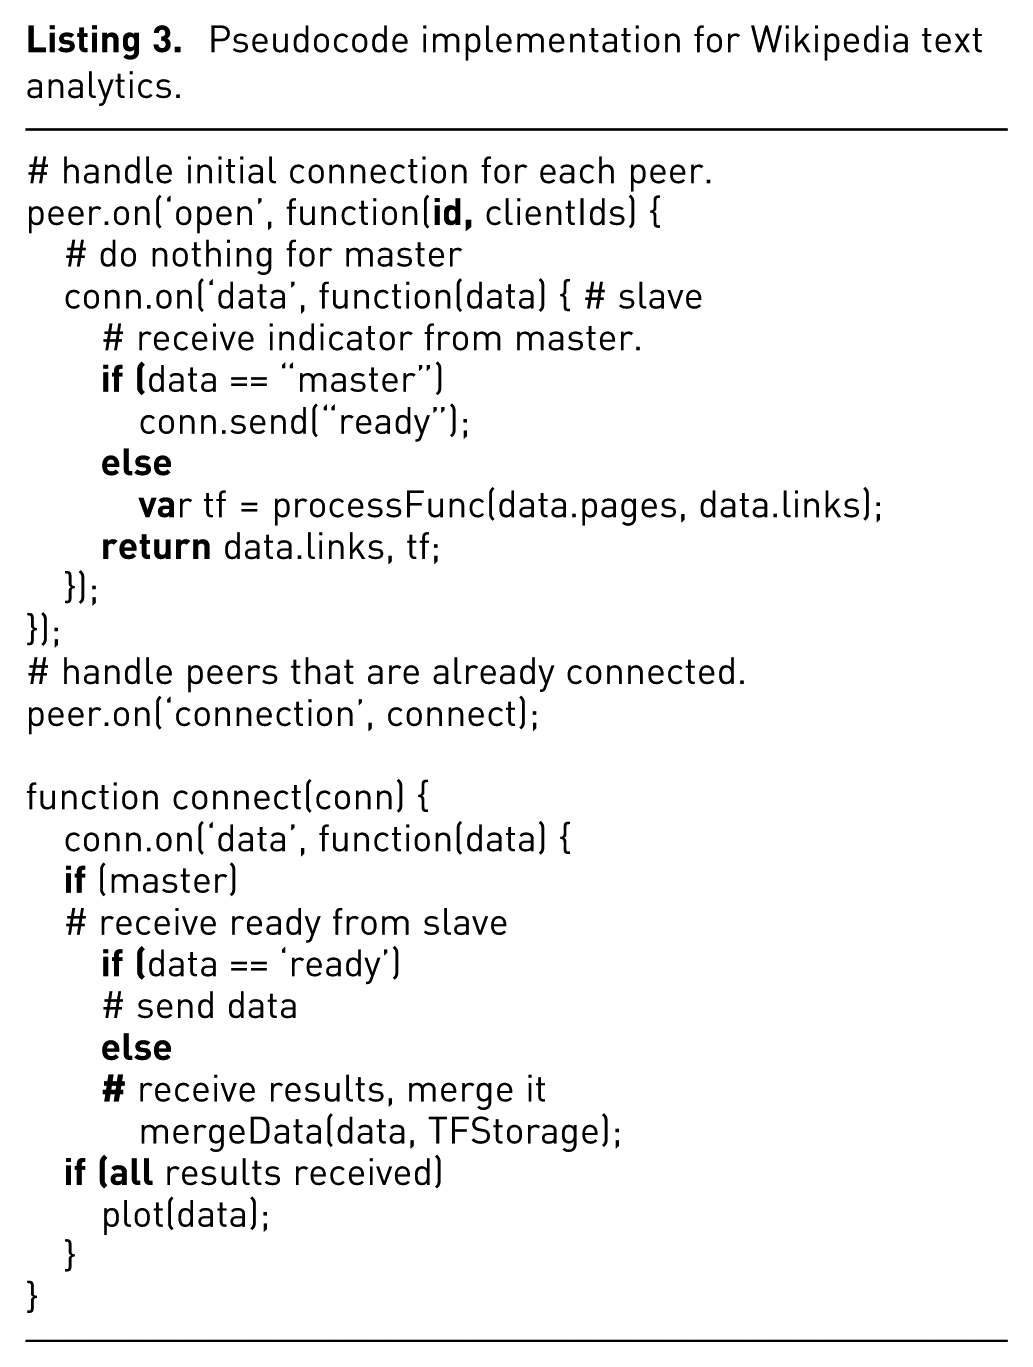
Figure 6 shows screenshots of the master visualization with 200, 500, and 1000 nodes crawled on a laptop, where the queue has been seeded with a specific Wikipedia article. We use force-directed layout framework in D31 to visualize relations between articles. Nodes represent pages, and links are hyperlinks between pages. Each node is labeled with initials of the page name. Tooltips with article name and top 10 keywords (using TF-IDF) will show up when the mouse is hovered on the node. Listing 3 shows the pseudocode to handle master/slave data transferring and processing. String “ready” is sent from slave to indicate master that the device is ready for computation. Once master receives the message, it sends one chunk to the slave for processing.
Pseudocode implementation for Wikipedia text analytics.
Exploratory visualization: incremental database query
In the new era of big data, even when all the data are available in a massive-scale database, querying the data can be forbiddingly expensive. However, many times the analyst is not interested in detailed results from a query but only need some rough idea of the contents of the data to serve as a stepping stone in the analysis. 24 For example, given a very large dataset of numeric attributes, the user may want to quickly calculate some descriptive statistics while discarding the actual data itself. From a visualization perspective, partial visual analysis is a quick and efficient way to get an overview of the data. It follows Shneiderman’s 46 visual information seeking mantra of “overview first, zoom and filter, then details on demand” and insert user interaction before zooming in, which saves both computational resources and shortens the time for analysis.
Implementation
In this example, we use VisHive to implement an incremental database query based on the idea proposed by Fisher. 6 The master splits the entire dataset into manageable chunks (row indices for, say, 1000 rows each) that can be assigned to cells that are part of the hive. A job in the cell simply consists of retrieving the chunk data, calculating some partial descriptive statistics (min, max, mean, and variance), and then discarding the data before sending back the results to the master. The master combines the results. For simplicity, we use a large flat file as the database. The approaches such as MPI-BLAST 47 have achieved parallel implementation of databases but require framework setup.
Distributed DBSCAN algorithm
DBSCAN 48 is a density-based clustering algorithm that groups points based on their proximity. It is also one of the most common clustering algorithms since, unlike k means, it does not require the user to specify the number of clusters a priori, it allows for arbitrarily shaped clusters, and it is robust to noise and outliers. Our algorithm of distributed DBSCAN applies to the data preprocessing stage of the pipeline involving computations of distances between pairs of points.
Implementation
Our DBSCAN implementation for VisHive (Figure 7) uses a distributed algorithm based on first computing the distance metrics (Euclidean, Manhattan, or other distance metrics) of each pair of candidate points in a distributed manner. Specifically, the master divides total points into chunks and assigns a chunk (group of points) to a cell. Each cell computes the distance metric between the chunk of points and all the other points. The master then combines all the distance metric, computes the matrix decomposition, and sums up the clusters of points in the final merging stage.
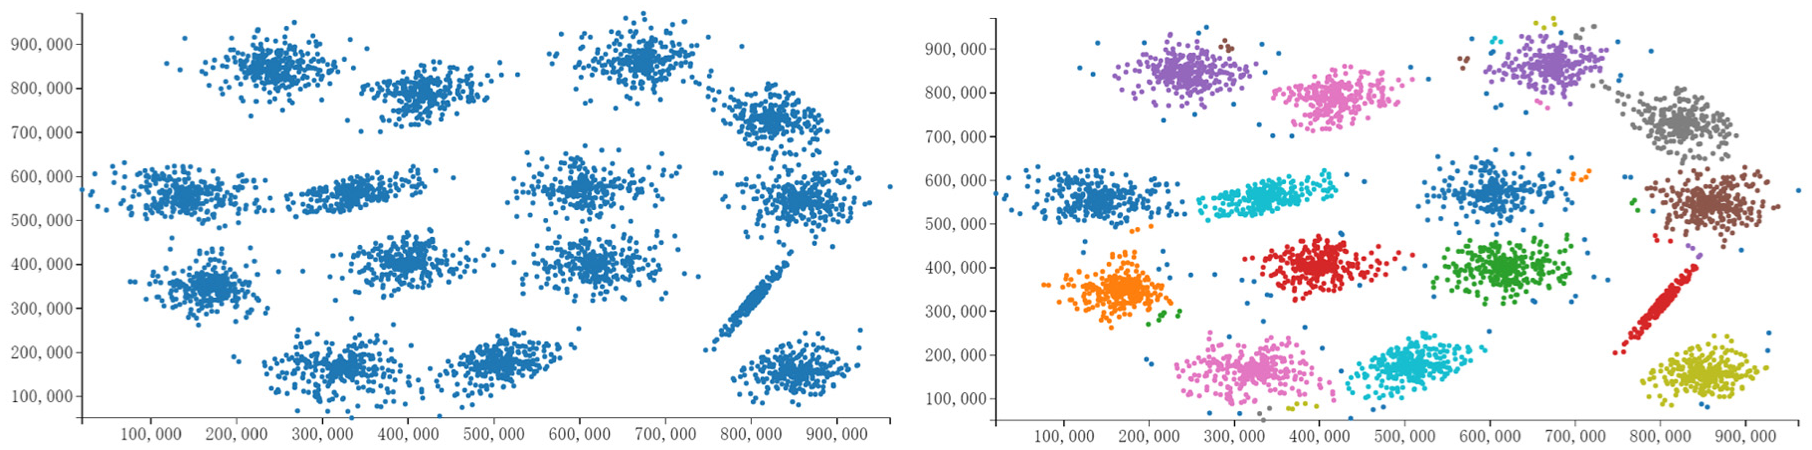
DBSCAN implementation of 5000 points using VisHive, including before (left) and after (right) the algorithm has been applied. Different colors represent different clusters.
Figure 7 shows a scatterplot of the points before and after the DBSCAN algorithm. Clusters are represented in different colors.
Distributed PCA
PCA is a common approach to dimension reduction in data science that is based on projecting a high-dimensional dataset into lower-dimensional subspace using a set of values of linearly uncorrelated variables called principal components. These components are selected so that they each have a maximal variance in order to best model the data in the dataset. Determining the orthogonal components actually involves deriving the eigenvectors of the covariance matrix. Similar to the previous example, PCA is an important tool for data analysis and visualization since it reduces high-dimensional data to lower dimensions. These projections (e.g. three dimensional (3D) to two dimensional (2D)) are common for visualization tasks.
Implementation
Our VisHive implementation of distributed PCA splits the entire matrix on the master based on rows, and participating cells compute the partial covariance matrix for sub-matrices. This can be achieved using singular-value decomposition (SVD) or eigenvalue decomposition. The master will finish the algorithm by estimating the whole covariance matrix based on results of sub-matrices, computing the global principal components, and choosing the first k dimensions that the cells can utilize in projecting chunks of the dataset in a second distributed phase.
Performance evaluation
We evaluated the VisHive toolkit using our four example implementations from the previous section. In order to study the impact of concurrent computation, we varied the device hardware conditions for the cluster and measured the total completion time. The WiFi used is the standard high-speed university wireless network. One thing to note is that we use web workers (multi-threading) in all the evaluations with laptops so as to enable task running on the master. Each performance test was run 20 times for an algorithm and a specific device combination. Table 1 shows the average performance results in seconds.
Computation time (in seconds) for our four different example implementations for five different device combinations involving laptops, smartphone, and tablet.
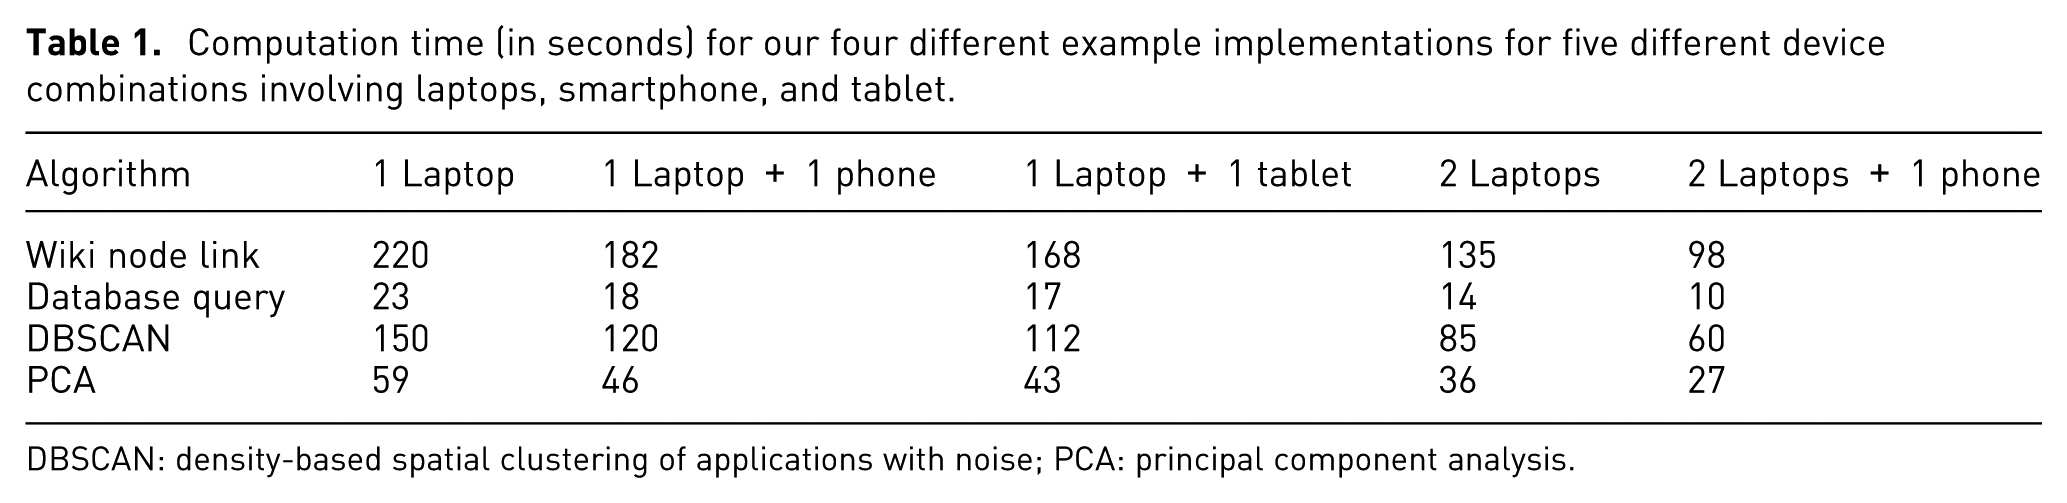
DBSCAN: density-based spatial clustering of applications with noise; PCA: principal component analysis.
Our four examples had the following dataset conditions:
Wikipedia text analytics: 1000 Wikipedia articles;
Incremental database query: 200,000 rows and 10 columns of floating point values stored in a flat file;
DBSCAN: 5000 2D floating point values;
Distributed PCA: 10,000 × 200 floating point matrix.
The hardware used in these experiments was the following:
Laptop 1 (master): A Windows laptop with 4 Intel core i7 CPUs and 8 GB of memory;
Laptop 2: A MacBook Pro with 4 Intel core i7 CPUs and 16 GB of memory;
Smartphone: A Huawei Ascend 7 Mate running Android with a HiSilicon Kirin 925 CPU (four Cortex-A15 cores).
Tablet: A Samsung Galaxy S10 with Quad-core Krait 400 CPU.
As can be seen from the performance results in Table 1, there are significant improvements in completion time when involving additional devices beyond the initial laptop master. In particular, when three devices are involved, the completion time is less than half of the original for all four examples. We take this as an indication that the overall idea and current implementation behind the VisHive toolkit is sound.
In addition, we instrument our code to measure the actual time spent in computation and data transfer (includes sending data and returning results) for different devices. For laptops, the average ratio of transferring time over total computation time is between 10% and 20%, whereas it is 25%–35% for smartphones. We also evaluated the performance by adding more smartphones into the hive to detect data transferring overhead. When three or more smartphones are involved, the overall computation time does not increase significantly due to the heavy transferring time on mobile devices. The time is mainly determined by network situations and input/output (I/O) speed, and this varies across devices and networks. Since smartphones have much smaller I/O throughput, when data become larger, I/O constraints will hinder massive deployment of the toolkit. These limitations are discussed below.
Discussion
Our work on the VisHive toolkit in this project is focused on distributing JavaScript code and computational tasks across multiple devices. Meanwhile, IPython 49 Notebooks—a web-based interactive shell for Python—are quickly becoming the main platform for scientific computing in the web browser. One of the reasons for the success of IPython for scientific computing is the immense ecosystem of Python packages available for all conceivable computational needs. Obviously, VisHive is not a replacement for IPython, but rather fills a niche that is very different from the greater mandate of IPython: integrating computation in a web-based visualization setting, which is already going to be JavaScript-based given the current state of visualization toolkits for the web. IPython, in contrast, is still a speciality software that is not considered useful for the general population, is therefore not integrated with standard browser installations and thus requires a separate download.
The same argument extends to general server-based, cloud-based, or cluster-based computational platforms. VisHive is not intended to replace such platforms, but instead provides an example solution for the common situation when a user has access to multiple local devices that could be formed into an ad hoc cluster to help with computation performed in the browser running one of them. Since mobile devices as well as personal computers are exclusively designed for focused use—that is, with one user using a single device, and not many devices at once—these additional devices are underutilized anyway. Our toolkit offers a lightweight approach to leverage these devices that is easily integrated with current web development practices.
Another aspect to note is that VisHive does not provide any explicit support for how to distribute computation so that it can be assigned into manageable chunks, sent off to separate cells, performed separately, and then recombined correctly by the master. Our focus in this work has been on the distributed computation mechanism itself and not the distributed algorithms you would run on the individual cells. There exists vast amount of work in fields such as parallel computing, distributed systems, and high-performance computing that can begin to guide the design of suitable algorithms that can be run on top of VisHive.
While VisHive can provide advantages and convenience to performance in visualization without additional costs but a browser, there are some essential limitations for this framework that are stated in the following:
Comparison to existing distributed computing: Even if VisHive aims for computational offloading, it is not a replacement of any existing distributed computing frameworks. The main scalability issues include the following: Large clusters: VisHive is not well suited for deploying tasks to a large number of devices. Our approach utilizes nearby available resources to aid computation that are otherwise often ignored. We have tested with up to 10 devices connected to form a cluster. However, due to the limited computing resources of the web browser, performance is poor when the number of devices are larger than 10. From our experience, the optimal number of devices is between three and six, which aligns with the typical number of devices one person would have in the office. Bandwidth: Since VisHive hosts all the data on the master and slaves and masters exchange tasks and data, the toolkit requires significant bandwidth and memory for large datasets.
Limitations for mobile devices: While we have illustrated a framework in this article for the advantages of using mobile devices to speedup computation, such devices are not always ideal for this purpose: Battery: Battery life is a precious resource for most mobile devices. In fact, many mobile devices are designed to go to sleep if left inactive to conserve energy, which typically suspends JavaScript execution. Computational resources: Many mobile devices provide limited computational resources so as not to be worthwhile to include in an ad hoc cluster to contribute to a task. In a typical VisHive setting (with two to four devices), the same amount of computation takes 3–4 times longer in mobile devices compared to a laptop. This may be due to the I/O constraints and less powerful CPUs on the mobile devices. Networks: VisHive may trigger additional wireless network charges if an algorithm requires each participating device to download a duplicate of the dataset. However, as discussed in the evaluation section, data transfer over wireless networks take an inevitable portion (usually between 10% and 35%) of task processing time, which limits large-scale computation tasks.
It is important to acknowledge that VisHive is not devoid of a server, as a NodeJS server is used in the current VisHive implementation for matchmaking purposes, and matchmaking usually happens once for each device to initiate P2P connection. However, when one device fails and rejoins the cluster, matchmaking happens again. While it is easy to connect cells and establish the hive, a server is not the optimal solution for matchmaking in many situations, especially for mobile devices. Typing in IP address is also slow and complicated, and sometimes raises security issues. One alternative way is to use Bluetooth or other near-field communication protocols. These protocols are applicable for portable devices, but have restrictions on data transfer speed and the distance range of connecting devices. Another approach is that cells take a picture of QR code to join the hive. The prerequisite for this method to work is a camera and QR code identification application or mechanism on the device. Finally, we also envision creating a centralized and common matchmaking server that could easily scale to matchmaking for thousands of concurrent VisHive clusters.
Nevertheless, we think that VisHive outlines an exciting area for the future as the toolkit is easy to use without any additional package installations, and computation and network connectivity become increasingly cheaper in the future. We also believe that VisHive can encourage other ideas from the field to better tackle these limitations.
Conclusion and future work
We have presented VisHive, a JavaScript toolkit that allows for connecting multiple devices into an ad hoc cluster using just the web browser as the computational platform. Devices become cells in a hive where a master allocates and recombines jobs to slaves that perform the actual calculation. The communication between the cells is performed using direct browser-to-browser connections in a P2P architecture, thus requiring no central computation management server or connection to the Internet. The matchmaking service needs to reside on a server within the same local network to provide connections in the cluster. We briefly discussed the VisHive API and declaration of some functions for public access. To showcase the utility of the technique, we presented four example implementations of distributed algorithms, including a distributed web crawler with text analytics, an incremental database query, a density-based clustering algorithm, and a dimension reduction method. Our performance evaluations using these four applications show a significant speedup basically linear with the number of connected cells.
We see many potential refinements and improvements of the VisHive toolkit in the future. For example, we envision continuing our work on making all steps of the visualization pipeline in a distributed manner, including not just data transformations and the visual encoding but also the view transformations and input management. Furthermore, we are interested in investigating how to use the slave cells not just as headless computational units but also for collaboration (for multiple users) or for supporting the main device with additional views and input surfaces (for a single user with multiple devices). Finally, we would like to study the usability aspects of firing up multiple devices to offload a main device and how this discovery and handshaking process can be streamlined.
Footnotes
Funding
The authors thank the reviewers for their feedback during the review cycle. This work was partially supported by the U.S. National Science Foundation award IIS-1539534. Any opinions, findings, and conclusions or recommendations expressed in this material are those of the authors and do not necessarily reflect the views of the funding agencies.