
Abstract
In this paper, the system of emotion visualization and the system of emotion recognition and judgment are established. Twenty subjects were selected for the test on the above two systems, meanwhile the emotional trend changes given by emotion judgment system based on the set of optimal signal feature and based on conventional machine learning-based method are compared. The results show that the emotional trend changes given by emotion visualization based on picture and scene change are roughly consistent with those obtained by emotion judgment system. As to the real-time ability and interactivity of emotional judgment, the emotion visualization based on scene change is better than that based on picture change; the emotion judgment system based on the set of optimal signal feature is better than the system based on the conventional machine learning-based method. The test experience of subjects has an impact on the test results. Multi-dimensional interactive environment is easier to affect people’s emotional changes than single dimensional interactive environment.
Introduction
According to different user needs, system orientation, and degree of emotion recognition and expression, the application of emotion computing in human-computer interaction system can be divided into different levels. Early systems did not need to identify and analyze users’ emotions, but simply used some intuitive signs to express emotions, for example, the sign of smiling face is used to show the welcome and friendliness of the system to users, which is a one-way interactive way of expressing emotion without considering users’ feedback. With the increase of people’s need to identify emotions, the importance of emotion computing is also increasing, and more and more software and hardware of intelligent human-computer interaction also appear one after another. So far, in the field of human-computer interaction, the application of emotion computing mainly focuses on an interactive adjustment and variability. The status of input and output are adjusted at any time according to the results of interaction between users and devices and the transmitted information.
People’s emotions have a corresponding relationship with physiological signals which can be presented in many forms, and emotion visualization is one of the forms, that is, presenting physiological signals in the form of pictures. Emotion visualization has been widely used in various fields, so it has attracted more and more attention, 1 for example, emotion visualization of text information, the positive or negative emotions obtained from text on the internet are given in the form of pictures. Another example is the analysis system of interactive emotion visualization based on TWITTER timeline, which can extract the change curve of user’s mood. 2 Emotion visualization is also common in the field of art and design, for example, audience can experience visual conceptual design in museums, 3 and the emotional state of the audience watching the works can be recorded through wearable devices, and then the emotional experience of different works of art is expressed using different colors. Based on the data of emotion computing data, the emotion visualization system can go deeper into people’s spiritual level.
Emotion visualization through music has been studied,4–6 and there have been some application results. Alexander et al. 7 let two experienced music scholars employ western musical notation, and used graphic realization of a digital audio program to visually represent the sonic features of conversation where a patient has an emotional “choke” moment. Plewa and Kostek 8 presented an approach to represent graphically the mood of songs based on self-organizing maps. They proposed the parameters describing mood of music and calculated the employing correlation with mood dimensions based on the multidimensional scaling. Taylor et al. 9 described an immersive music visualization application which enables interaction between a live musician and a responsive virtual character. Giannakopoulos 10 presented an open-source python library that provides a wide range of audio analysis procedures including: feature extraction, classification of audio signals, supervised and unsupervised segmentation, and content visualization.
Through the above research, we can see that the following problems need to be further discussed and clarified: (1) The conventional machine learning-based method is usually used to judge the emotional trend through physiological signal data, whether we can establish an emotional judgment system through a better way to obtain more accurate emotional judgment results? (2) In the emotion visualization system, the change of physiological signal caused by the subject’s emotional changes can be shown through picture or scene. Up to now, it is not known which way, that is, picture or scene, is more effective to reflect the changes of psychological signals. (3) Has the test experience of subjects the effect on the test results? Therefore, the aim of this study is to explore above three issues, and the paper consists of the following contents: (1) an emotion visualization system is established, that is, the physiological signal changes caused by emotional changes are collected when people receive external information, and then the visualization software based on color-emotion relation is used to switch the changes of physiological signals into corresponding pictures or scenes, thus people’s emotional changes through visualization can be judged; (2) a system of emotion recognition and judgment is established, that is, the physiological signal changes caused by emotional changes are collected, and then the set of optimal signal feature was obtained, thus the judgment model of emotional changes is built; (3) 20 subjects were selected for the test on the above two systems, meanwhile the emotional trend changes given by emotion judgment system based on the set of optimal signal feature and based on conventional machine learning-based method are compared.
Emotion trends
Emotion recognition and judgment as well as emotion visualization should be based on emotion evaluation and classification. The valence-arousal (V-A) model is referenced for the emotion evaluation in the present study. In V-A model, V as a horizontal axis indicates the degree of emotional pleasure, and A as a vertical axis indicates the degree of emotional arousal. After referring to the discrete emotion classification, four poles of the two-dimensional emotion classification model are extracted, and are used to represent four emotions: tired, tense, happy, and depressed, respectively. Then the emotion classification system based on V-A model is extended from two-dimensional coordinates into a plane, and four quadrants of the plane are used to express high-arousal and positive-valence (quadrant I: HAPV), high-arousal and negative-valence (quadrant II: HANV), low-arousal and negative-valence (quadrant III: LANV), and low-arousal and positive-valence (quadrant IV: LAPV), respectively, as shown in Figure 1. In this way, four kinds of emotion trends were extracted.

Valence-arousal model.
System of emotion visualization
Visualization refers to the process of transforming data and information into visual form, and can make the data and information more intuitive and easy to understand, so as to facilitate users to quickly receive and understand information.11,12 An effective visual interface can facilitate people’s work, make some operations simple and fast, and help people understand some large-scale or very abstract data and information.
Emotional visualization is mainly divided into two aspects. One is the direct visualization of emotion. In some way, the abstract emotion is first concretized in quantity or morphological characteristics. This concretization can be in the form of data information or figurativeness, and then the data and figure used to express emotion are displayed visually. The other is assisted visualization of emotion, that is, the interactive experience related to other senses of users is transformed into data information with the help of emotional calculation, and then displayed the data information with the method of visualization.
Direct visualization of emotion
Visualization has always been used in emotion research, for example, the emotional ring proposed by Plutchik 13 gave color elements corresponding to emotions as shown in Figure 2.
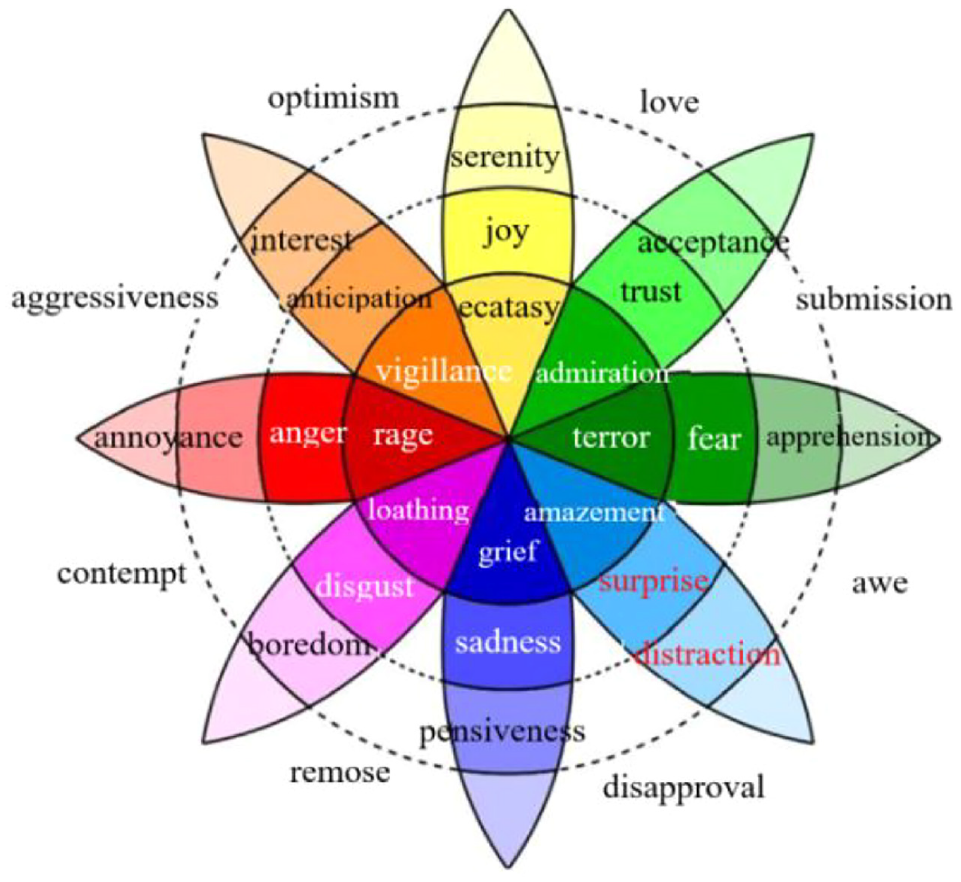
Color emotional ring. 13
Emotional color itself is also an expression of emotional visualization. Different hues and color scales are combined to form various colors and give people different feelings which depend on many factors. 14 The color sense mainly includes the sense of temperature, scale, weight, and distance. The sense of temperature refers to people’s perception of cold and warm degree of visual picture. The sense of scale includes two aspects, one is to represent the wide or narrow space of picture, the other is the scale that affects visual effect of picture objects. The sense of weight depends on purity and lightness, the colors with low purity and lightness are easy to give people a heavy feeling. The sense of distance is that people have different feelings about the distance of colored picture. Objects with same area and same background have different visual effects due to different colors. People’s intuitive perception of color has an impact on emotion.
Physiological and psychological factors also affect people’s perception of color. 15 Human sensory organs can convert physical stimuli such as sound and shape into nerve impulses and then transmit them to the brain, so as to produce sensation and perception, for example, light affects blood circulation and muscle function, blood circulation slows down and muscle skills weaken under blue light irradiation. As the light color changes from blue to green, yellow, orange, and red, the blood circulation and muscle function will be gradually enhanced. There is a close relationship between people’s emotional changes and human functions, so people’s emotional fluctuations can be reflected in the changes of human functions.
Assisted visualization of emotion
The difference between assisted visualization and direct visualization of emotion is that the former takes emotion recognition as an auxiliary reference to realize the visualization of sensory information such as hearing, taste, and smell, which is mostly used in the visualization of emotions generated by music; the latter directly visualizes the emotion recognition results or calculation data.
The automatic detection and visualization of emotion generated by music has attracted people’s attention. Detecting the emotion generated by music content is a very effective method of emotion recognition. 16 On the contrary, expressing the abstract music content through the visualization of emotion generated by music can help the audience better understand the music. At present, there are some related studies, for example, Chen et al. 17 recorded people’s facial expressions while people listening to music and classified the emotion through the analysis of expression, and then extracted the key features of emotion based on the method of emotion recognition, finally matched the two to generate corresponding images to help the audience better understand the music. As another example, Grekow 18 proposed an emotion-based music visualization system which can be modified in real time and has the function of automatically detecting emotional state. In the process of playing music, different music segments are labeled with emotion labels which can be used to modify the visual effect. However, there are differences in everyone’s esthetics, which leads to different understanding and preferences for music. Therefore, the most studies are focused on the emotion recognition based on the characteristics of music (such as power, loudness, rhythm, etc.).
Establishment of visualization of emotion
The physiological signal (e.g. skin electricity and pulse wave) changes caused by emotional changes are collected when people receive external information (e.g. listening to the music), and then the visualization software based on color-emotion relation is used to switch the changes of physiological signals into corresponding pictures or scenes, thus the system of emotion visualization is established to judge people’s emotional changes.
In the construction of software system, the tool is Unity3D which is a game development engine with multi-platform developed by Unity Technologies. In Unity3D, C# or JavaScript are used as the programing language, which allows users to easily make 3D and 2D video games. In addition, Unity3D also has simulation properties such as rigid body components, collision formation and gravity, and has powerful serial communication function and rich particle animation system. Unity3D also plays a huge role in the field of interactive products other than games, such as architectural visualization, real-time animation, virtual interactive scenes, and so on.
Data transmission channels and data processing capabilities are required in order to establish the system of emotion visualization, while Unity3D shows its powerful functions in these two aspects, and has a strong function of real-time parallel processing of complex data and strong ability of data transmission between different devices. It is the best tool for the construction of emotion visualization system.
System of emotion judgment
The establishment of emotion recognition and judgment system through physiological signals includes three basic steps (see Appendix 1).
Test results and analysis
The data obtained through the signal sensor and optimal features are defined as floating-point data variables based on the private float function. For the skin electrical signal, it is easy to intuitively see the change of emotion trend from the waveform, so the data of skin electric signal are recorded through Time.deltatime* (The interval in seconds from the last frame to the current one) speed function and Debug. Log() function (Logs message to the Unity Console) in order to reduce the amount of calculation and speed up the calculation speed.
Physiological signals are constantly changing, so the time length of the calculation segment should be consistent with the test as much as possible, and the calculation should be carried out every 10 s.
Test content and object
Eleven men and nine women participated in the test. There were 10 subjects who participated and 10 subjects who did not participated in the acquisition test of physiological signal before.
Music is used to awaken the subjects’ emotions because music has a high success rate of emotional arousal and is less affected by individual differences. The physical properties of music are divided into energy properties (volume, loudness, etc.), rhythm properties (rhythm, clause, etc.), melody properties (tone, style, etc.), and timbre properties (spectrum, waveform, etc.). 4 Therefore, the influence of music on emotion is unified, for example, the music with high tone and bright timbre gives people a sense of pleasure, and the emotional trend corresponds to the right half of the V-A model as shown in Figure 1; while the music with low tone and heavy timbre gives people a sense of sadness, and the emotional trend corresponds to the left half of the V-A model. The speed of timbre rhythm and the cutting of clauses will determine the upper and lower range of emotion in the V-A model. Based on the relationship between music physical properties and emotion recognition, the database related to them has been established, for example, Benchmark database, 19 Latain music emotion database. 20
Design of emotion judgment system
For illustrating the performance of the emotion judgment system established in Appendix 1, two approaches of emotion judgment are designed in the test as shown in Figure 3.

Two approaches of emotion judgment.
In Approach 1, the conventional machine learning-based method is used to judge the emotional trend through physiological signal, that is, the support vector machine (SVM) toolkit of C# language is used after “Accord. Machine Learning. Vector Machines. Learning” (contains algorithms for training SVM) and “Accord. Statistics. Kernels” (Kernel functions are used in kernel methods) are introduced.
In Approach 2, the emotion judgment system based on the set of optimal signal feature as shown in Appendix 1 is used to judge the emotion trend. The real-time ability and interactivity of the two approaches in emotion judgment are compared through tests.
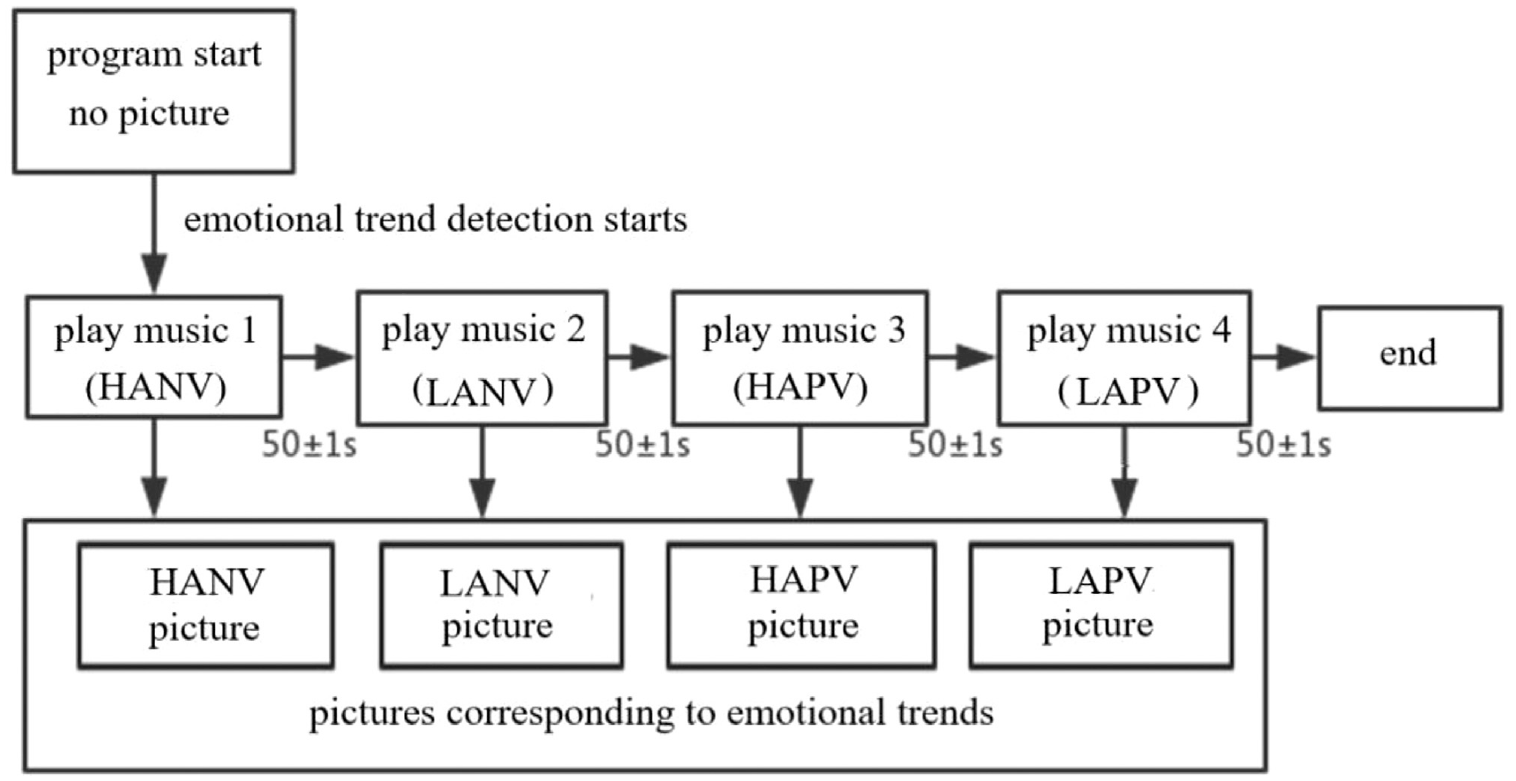
Test of emotion visualization based on picture change
The test process is shown in Figure 4. The subjects wore sensors of skin electrical signal and pulse wave signal, and then the system plays music with different emotions to awaken the subjects’ emotions, the physiological signal changes caused by the subject’s emotional changes are shown through different pictures.
Experimental process based on picture change.
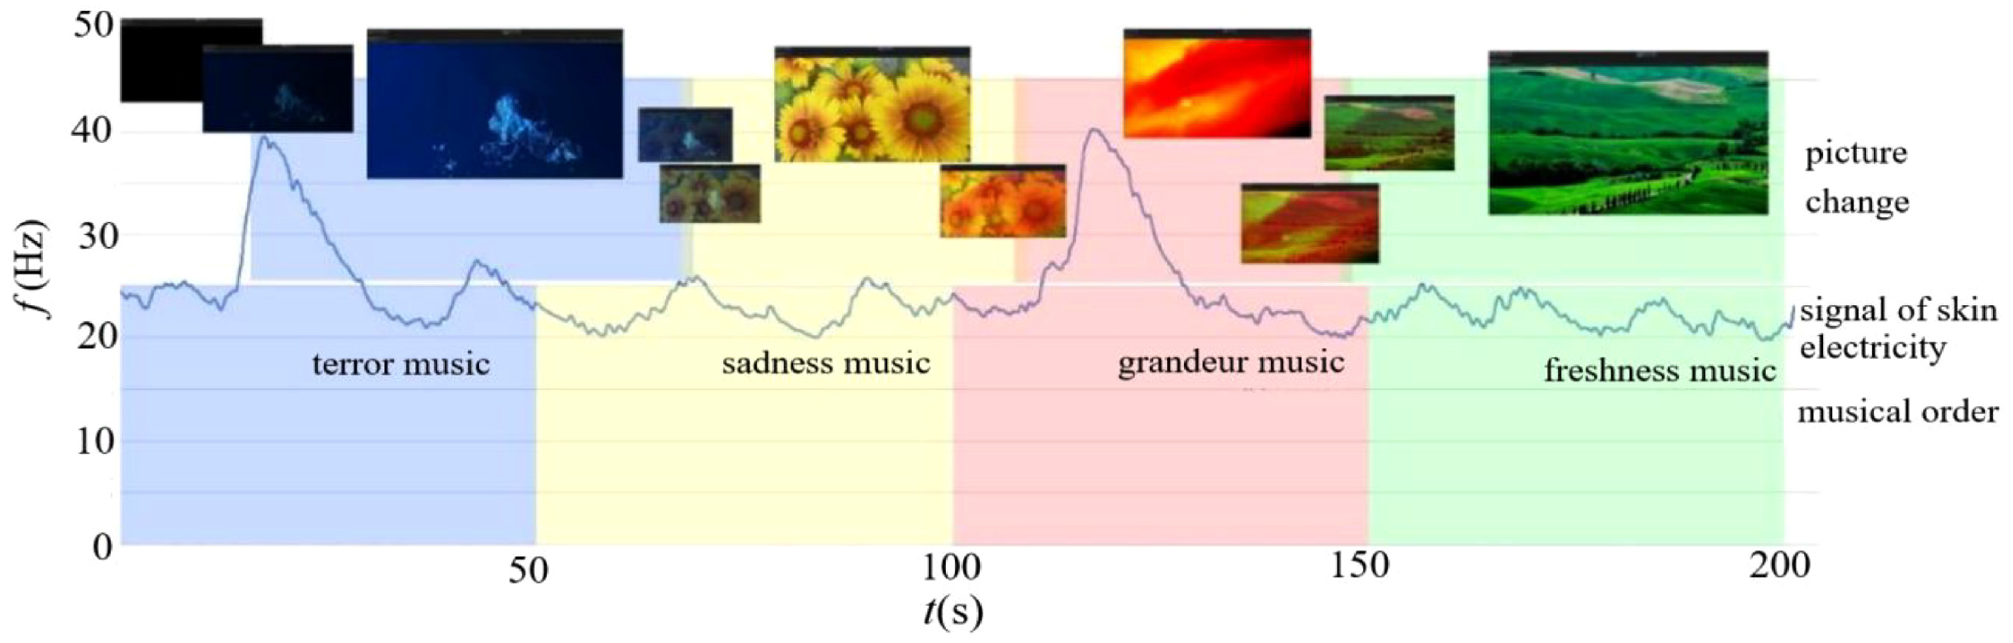
Music material comes from the previous research results on the relationship between music and emotion, which has a high recognition rate. Music is played in HANV-LANV-HAPV-LAPV order, and corresponding style is terror-sadness-grandeur-freshness. The tone of the picture is based on the relationship between color and emotion, and corresponding hue order is blue-yellow-red-green as shown in Figure 5. Each piece of music lasts for 50 ± 1 s because the duration music of each piece in the music material library is 50 s.

Pictures used in the test.
In the test, the picture switching deviation rate (the ratio between the deviation time of picture switching and the duration of music, starting with the start time of music and taking the total duration of music as the unit 1) of 20 subjects was recorded as shown in Figure 6. Each subject underwent two rounds of tests, Approach 1 as shown in Figure 4 is used to judge the emotion trend in the first round of test, and the results are shown in Table A1. Approach 2 is used to judge the emotion trend in the second round of test, and results are shown in Table A2.
Contrast between the emotion awakened by music and the picture.
It can be seen from Tables A1 and A2 and Figure 7 that: (1) the maximum value of the overall average deviation is 21.4% ( in Figure 7), indicating that the emotional trend change obtained by emotion visualization are roughly consistent with those obtained by emotion judgment system; (2) the values of the average deviation for subjects who participated in the test before are smaller than that for subjects who did not participate in the test (
 <
<  ;
;  <
<  in Figure 7), indicating that the test experience of subjects has an impact on the test results; (3) the values of the overall average deviation obtained by Approach 2 are smaller than that obtained by Approach 1(
 < in Figure 7), indicating that, on the real-time ability and interactivity of emotional judgment, the emotion judgment system based on the set of optimal signal feature is better than that based on the conventional machine learning-based method.
Picture switching deviation rate d: : 1–10 with approach 1; : 11–20 with approach 1; : overall with approach 1; : 1–10 with approach 2; : 11–20 with approach 2; : overall with approach 2.
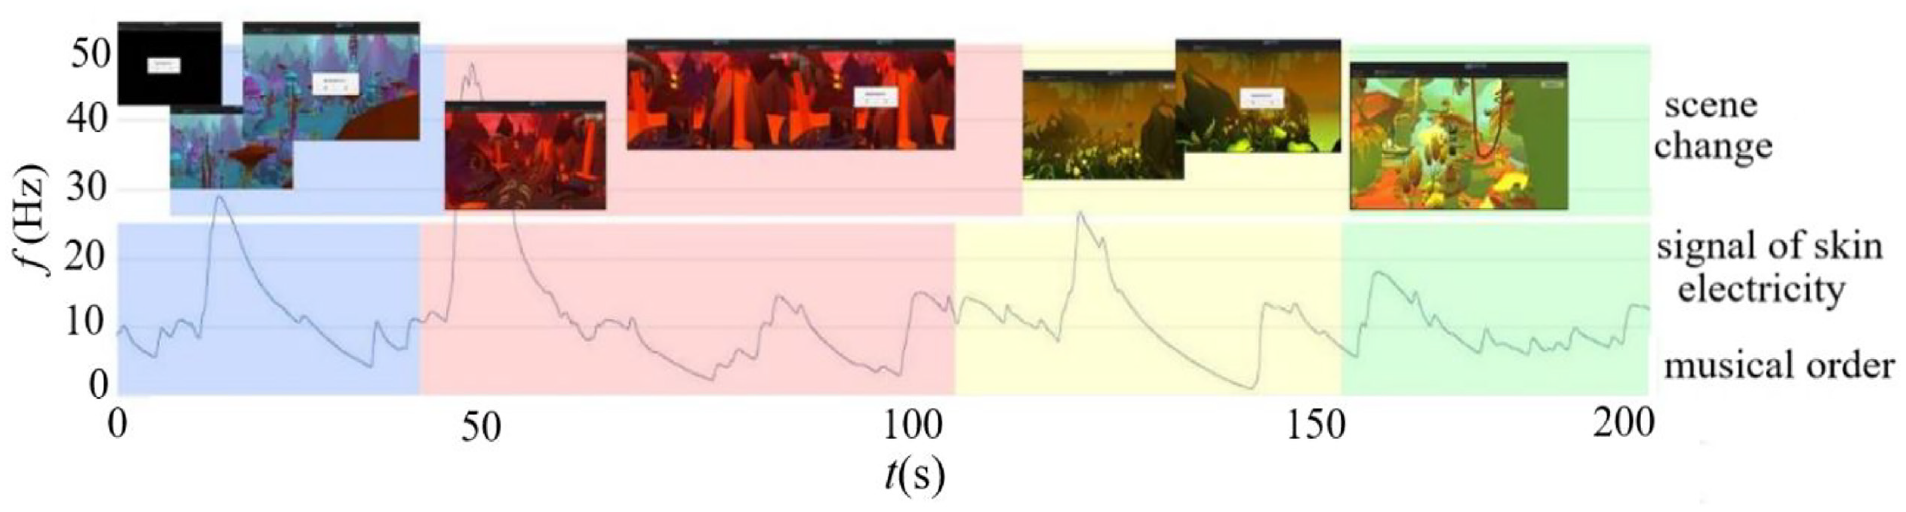
Test of emotion visualization based on scene change
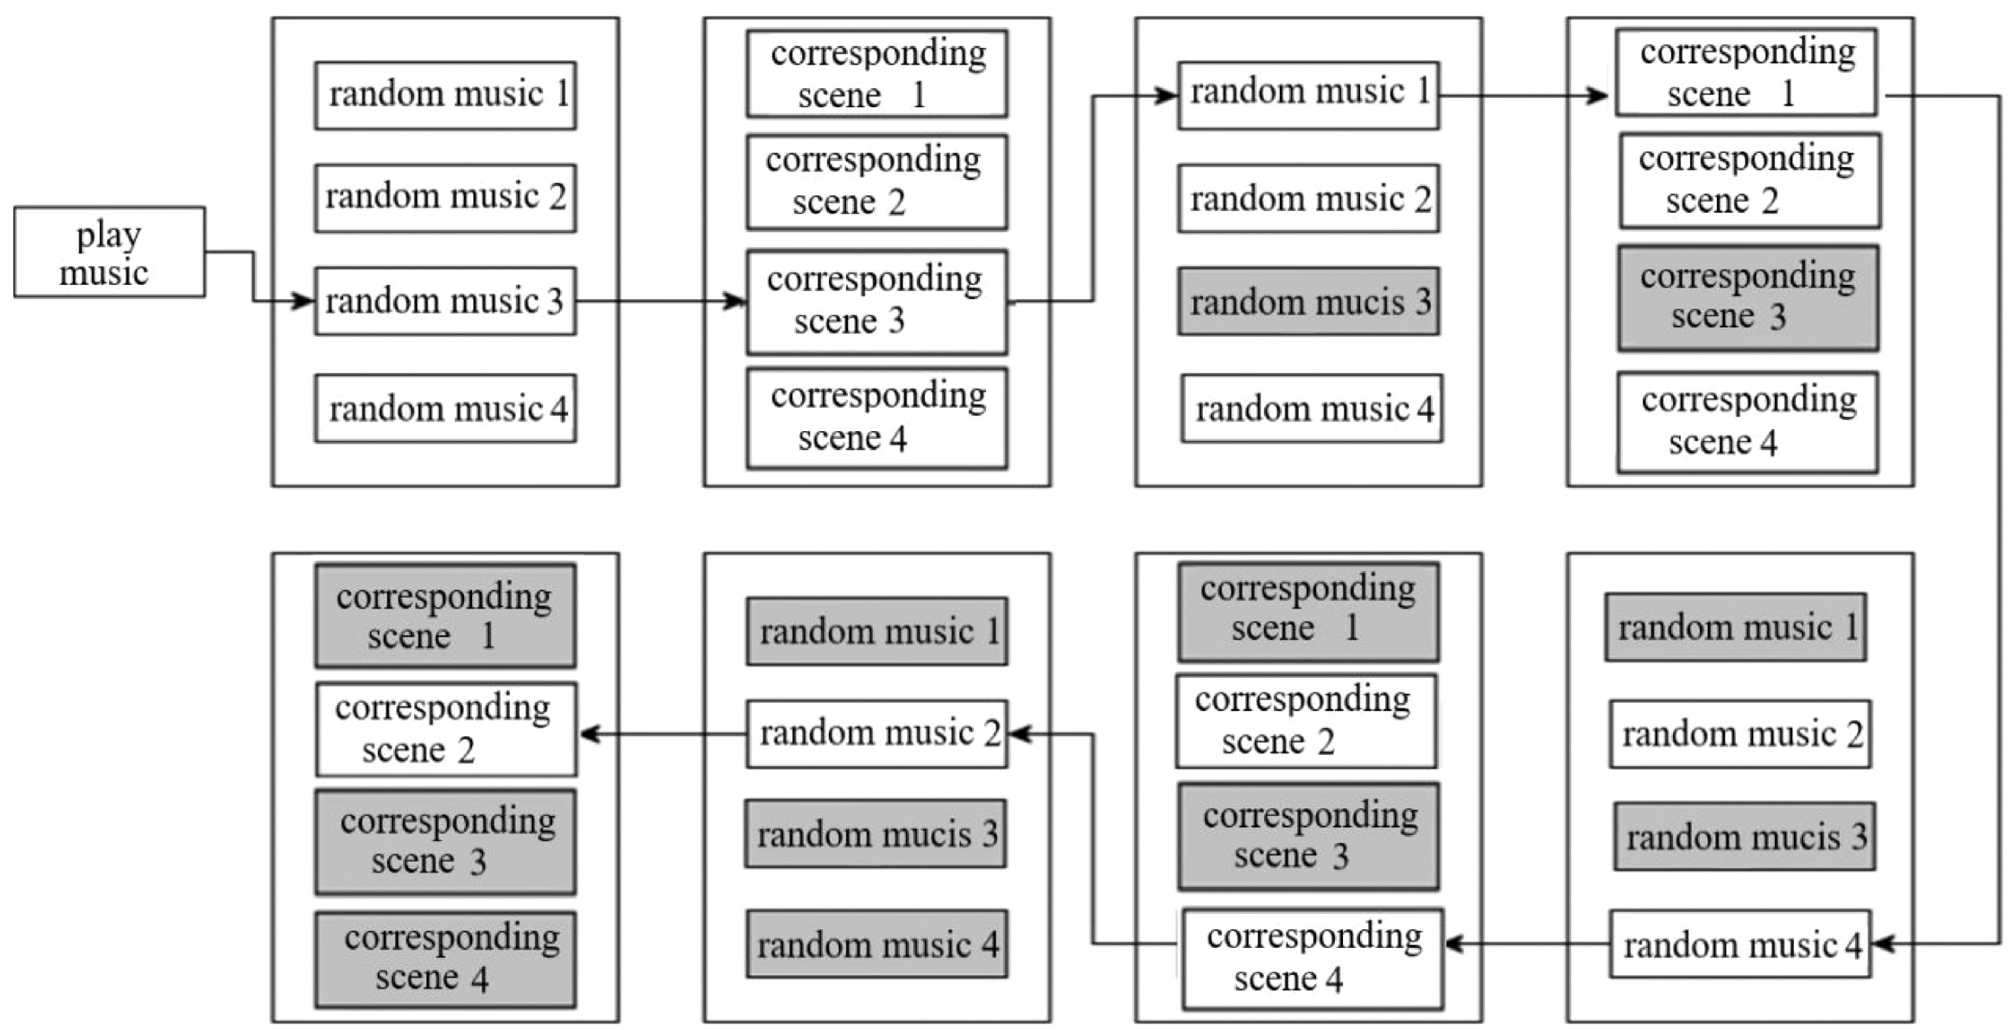
The principle of test of emotion visualization based on scene change is the same as that based on picture change as shown in previous section, except that the four scenes in Figure 8 are used instead of the four pictures in Figure 5. The hue of the scene is based on the Unity Asset Store of the relationship between color, content, and emotion, while picture only provides the relationship between color and emotion. The subjects wore sensors of skin electrical signal and pulse signal, and then the system randomly plays one of the four kinds of music as shown in Figure 9, which is performed using Random.range () function. The playing time of each piece of music is not limited until the subjects choose “switch music.” When the music is played, the emotion awakened by the music is detected and is displayed with corresponding scene on the screen as shown in Figure 9 (the scene model is from the Unity Asset Store: https://assetstore.unity.com/). The scene switching deviation rate of 20 subjects was recorded as shown in Figure 10. Each subject underwent two rounds of tests, Approach 1 as shown in Figure A2 is used to judge the emotion trend in the first round of test, and the results are shown in Table A3. Approach 2 is used to judge the emotion trend in the second round of test, and the results are shown in Table A4.

Scene used in the test.
Test process based on scene change.
Contrast between the emotion awakened by music and the scene.
It can be seen from Tables A3 and A4 that: (1) the maximum value of the overall average deviation is 16% ( in Figure 11), indicating that the emotional trend change obtained by emotion visualization are roughly consistent with those obtained by emotion judgment system; (2) the values of the average deviation for subjects who participated in the test before are smaller than that for subjects who did not participate in the test ( < ; < in Figure 11), indicating that the test experience of subjects has an impact on the test results; (3) the values of the overall average deviation obtained by Approach 2 are smaller than that obtained by Approach 1 ( < in Figure 11), indicating that, on the real-time ability and interactivity of emotional judgment, the emotion judgment system based on the optimal feature set is better than that based on the conventional machine learning-based method; (4) comparing Tables A3 and A4 with Tables A1 and A2, the values of the overall average deviation based on scene change are less than that based on picture change ( < , < in Figure 12), showing that, on the real-time ability and interactivity of emotional judgment, the emotion visualization based on scene change is better than that based on picture change. This is attributed to the material of emotional arousal. In the picture change, only music is used as the material for emotional arousal. However, in the scene change, in addition to music as the material, there is also the environmental effect caused by the scene picture, which has more degrees of freedom and higher emotional arousal to the subjects. This also shows that multi-dimensional interactive environment is easier to affect people’s emotional changes than single dimensional interactive environment.
Scene switching deviation rate d: : 1–10 with approach 1; : 11–20 with approach 1; : overall with approach 1; : 1–10 with approach 2; : 11–20 with approach 2; : overall with approach 2.
Comparison of picture and scene switching deviation rate d: : overall for picture switching with approach 1; : overall for picture switching with approach 2; : overall for scene switching with approach 1; : overall for scene switching with approach 2.
Conclusion
In order to further study the effectiveness of emotion visualization and emotion judgment system, the system of emotion visualization and the system of emotion recognition and judgment are established. Twenty subjects were selected for the test on the above two systems, meanwhile the results using emotion judgment system based on the set of optimal signal feature and conventional machine learning-based method are compared. The main conclusions are summarized as follow.
The emotional trend changes obtained by emotion visualization based on picture and scene change are roughly consistent with those obtained by emotion judgment system, and the emotion visualization system established in this paper is effective.
About the real-time ability and interactivity of emotional judgment, the emotion visualization based on scene change is better than that based on picture change; the emotion judgment system proposed in this paper based on the set of optimal signal feature is better than the system based on the conventional machine learning-based method.
Multi-dimensional interactive environment is easier to affect people’s emotional changes than single dimensional interactive environment. The test experience of subjects has an impact on the test results.
Footnotes
Appendix 1
Appendix 2
Scene switching deviation rate given with Approach 2.

| Subjects | Participated in test before | HANV (%) | LANV (%) | HAPV (%) | LAPV (%) |
|---|---|---|---|---|---|
| 1 | Yes | −3.77 | −11.46 | −9.57 | −1.73 |
| 2 | Yes | −15.69 | −4.30 | −14.16 | −2.24 |
| 3 | Yes | −12.96 | −13.06 | x | −7.98 |
| 4 | Yes | −0.25 | −7.18 | −16.55 | x |
| 5 | Yes | −18.42 | −10.07 | −4.42 | −6.36 |
| 6 | Yes | −3.23 | −12.08 | −7.93 | −14.81 |
| 7 | Yes | −1.18 | −3.82 | −10.68 | −10.01 |
| 8 | Yes | −13.21 | −3.51 | −14.21 | −8.11 |
| 9 | Yes | −2.08 | −8.17 | −11.19 | −1.38 |
| 10 | Yes | −10.98 | −10.37 | −2.06 | −5.87 |
| Average deviation of 1–10 | 11.52 | 13.39 | 5.74 | 2.22 | |
| 11 | No | x | x | x | x |
| 12 | No | −17.28 | −11.10 | −16.34 | −18.91 |
| 13 | No | −13.12 | −9.74 | x | −16.32 |
| 14 | No | −15.77 | −17.83 | −9.11 | −8.91 |
| 15 | No | −19.50 | −12.09 | −15.30 | x |
| 16 | No | −12.71 | −21.11 | −18.72 | −12.88 |
| 17 | No | −6.77 | −14.68 | −15.08 | −14.52 |
| 18 | No | −19.53 | −11.35 | −14.12 | −20.52 |
| 19 | No | −16.47 | −9.08 | −7.33 | −13.47 |
| 20 | No | −16.32 | −17.99 | −10.45 | −9.67 |
| Average deviation of 11–20 | 16.59 | 18.17 | 12.41 | 9.72 | |
| Overall average deviation | 14.06 | 15.51 | 9.01 | 5.75 | |
Funding
The author(s) received no financial support for the research, authorship, and/or publication of this article.