



Abstract
Widely employed by innovative organizations, a well-designed simple data visualization has been shown to enhance user experience and aid in decision making; while a more embellished visualization may cause overload, it has the potential to create deeper processing and learning. Furthermore, individual characteristics may impact on how users seek information on these different types of visualization. This study proposes that thinking styles (analytical vs holistic) and domain expertise moderate the effects of data visualization types on decision performances in terms of decision accuracy, decision confidence, memory recall, and cognitive load. To test our hypotheses, an experimental study involving visual manipulations in the context of personal finance was conducted on two types of visualizations (simple and clutter). Results suggest that simple visualizations enhance decision accuracy and reduce cognitive load. We also find that cognitive load is further reduced when analytical thinkers are presented with simple visualizations. These findings can help designers understand how user characteristics may be considered when designing and evaluating visualizations for decision makers.
Keywords
Introduction
Data visualizations can present complex information in ways to enhance understanding 1 and support decision-making. Visualizations continue to evolve with different features incorporated into elaborate dashboards for managers. However, there seems to be a division on the value and impact of excessive information and embellishments, labeled “chart junk” 2 on a cluttered visualization. Visualizations can be designed as simple and easy to understand or cluttered. Cluttered visualizations may provide more information but can become a barrier to cognitive processing. 3 Clutter may also hinder attention to relevant information, reduce the search process, cause low task performances, increase errors and reduce judgment.4,5 While previous studies have looked at cluttered visualizations in a negative light filled with chartjunk and information overload, some authors find the challenge with clutter is to determine the middle ground between excessive data and insufficient information. 6 Other studies found that a cluttered formats outperformed simple formats in recall due to unique and novel embellishments.2,7 However, for many visualizations in the business world, specifically finance, clutter and embellishments may hinder users when specific information needs to be found to support decision making. Ognjanovic et al. 8 studied financial information visualizations by examining display clutter and found that clutter has a negative impact on judgment performance. The authors stated that “more research is needed to provide comprehensive insights into the consequences for visual attention and judgmental performance” (p. 174). In this study, we extend Ognjanovic’s study by looking at individual characteristics that can impact performance.
By examining individual characteristics, designers can find guidance on how to manage cognitive efficiency when creating visualizations. 9 Ziemkiewicz et al. 10 state that “making sense of visualization requires understanding how users vary and why” (p. 1). Some users may require more mental transformations and utilize more working memory when seeking information on visualizations while others are able to use less working memory, making it easier to illustrate data, identify patterns and make decisions. 11 Prior studies have investigated how individual differences with different cognitive abilities cause them to use visualization differently.12,13 Understand how user characteristics help with solving problems on visualizations will help guide the design of better visualizations and hence improve efficiency and accuracy for complex tasks. While it is not possible to design visualizations for every user, there is a push to create visualizations that are more inclusive and understand that user differences can impact the performance of the tool. Prior studies discuss cognitive factors like spatial ability, verbal ability and working memory as well as personality factors that may predict patterns when using visualizations. 10 In the article, the authors state that “more studies must be performed both to confirm the factors already found and to investigate new factors” (p. 90). While this is true, we find that there is a gap in the literature regarding the effects of an individual’s thinking style when interacting with visualizations.
When tasks are more specific based on objectives, an analytical thinking style is invoked to complete the decision-making process; while a holistic thinking style is invoked with tasks that are more subjective and require the user to think through the tasks as a whole. When using visualizations, most decision-makers tend to complete more objective tasks, such as “what months had the highest sales profit?” or “which product was the least performing in the previous year?” In addition to an individual’s thinking style while completing tasks using visualizations, we believe that domain experience will affect decision accuracy. Experience describes the accumulation of knowledge that influences a user’s behavior when they are faced with a familiar situation. Hence, decision-makers with more domain experience would be more likely to understand where to look for information when completing specific tasks. Our goal in this study is two-fold: (1) to investigate the effects of simple and cluttered visualization types on decision performance and (2) to examine the moderating effects of thinking style and domain experience on decision performance. In this study, we conduct an experiment using two different visualization types, simple and cluttered, where participants complete various objective tasks that include goal-specific and memory recall. Overall, we found that participants with an analytical thinking style have higher levels of accuracy and lower levels of cognitive load when using simple visualizations.
We introduce hypotheses in Section 2 based on a survey of literature on types of data visualizations, individual thinking styles, and domain expertise in the context of decision performances. In Section 3, we introduce research methodologies including experiment designs and data collection. Regression models and results are presented in Section 4, followed by discussions of findings in Section 5. We conclude our study by identifying contributions, managerial implications, research limitations and future research steps in Section 6.
Literature review and hypothesis development
Visualizations can support decision performance in several ways, including decision accuracy, decision confidence, memory recall and cognitive load.14,15 Although decision accuracy is rather intuitive, other indicators warrant further investigation.
Decision confidence is based on how confident the user is about their final decision. Positive decision confidence can lead to satisfaction with the choice, a quick decision and a positive experience. In contrast, negative decision confidence may result in stress, perceived difficulty, low confidence in the choice, and even the failure to differentiate between relevant and irrelevant information. 16 When information is easily processed, individuals are more likely to understand the information correctly leading to a positive experience. Greifeneder and Keller 17 reported that when individuals were able to retrieve information about an issue easily from memory, they held a more positive attitude toward that issue. Similarly, when attributes or features of products were easier to process, the products were more likely to be positively evaluated. 18 Individuals consider easy to process information more pleasant than hard to process information. 19 Thus, a simple visualization would evoke more satisfaction, familiarity and feelings of intelligence than a cluttered interface. 19
Recall in memory refers to a mental process of recovering information from the past without any cues to help retrieve the information. To recall information from a visualization, it must be memorable. Borkin et al. 2 states that unique features on the visualization may increase memorability. For example, in this study the answers to the tasks were colored in red if the profits were negative and green if otherwise.
Eberhard 20 found that cognitive load is a research gap that should be explored further when conducting experiments using different visualization formats in a systematic review of literature on visualization and decision-making. Cognitive load refers to mental efforts that demand the use of working memory. 21 Given the scope of our current study is to investigate the impact of visualizations on decision performances, we ground our research upon Cognitive Load Theory (CLT).
According to the human information processing model developed by Atkinson and Shiffrin 22 , the human brain processes information through three sequential stages: sensory memory, working memory, and long-term memory. Sensory memory retains and passes on the most important information to work memory while filtering out irrelevant information. Working memory classifies information into patterns or categories and passes them to long-term memory where information is stored in knowledge structures, called “schemas.” However, due to limited capacity and behavioral preferences, working memory may discard most of the information.
To design effective instructional methods that avoid overloading working memory with irrelevant information and promote learning, Sweller 23 developed the CLT which investigates the amount of information that working memory can hold at one time. CLT shows that working memory can process visual and auditory information separately. Also, learning activities that build upon existing knowledge schemas may expand the capacity of working memory without the overloading pressure since those knowledge schemas are treated as a single item with automated processes. CLT states that tasks fit specific formats and predicts that cognitive effort will increase to compensate the mental representation whenever a mismatch between tasks and formats occurs. The redundant or unnecessary information may cause the extra toll on the working memory and consequently interfere with the learning process.
A cluttered visualization type filled with chartjunk has been identified in many different domain areas and involves different approaches such as layout, size, background, irrelevant information, and mass of images. While clutter and chartjunk may cause low task performances, increase errors and reduce judgment, 5 it has been reported that further information processing may be required and could improve memory. 24 Bateman et al. 7 tested comprehension and recall of graphs using two versions: embellished and simple graphs. They found that the embellished graph outperformed the simple graph in recall but there were no differences in comprehensions. Borkin et al. 2 also found that unique visualization types had significantly higher memorability scores than simple graphs; stating that “novel and unexpected visualizations can be better remembered” (p. 9). However, when completing more objective tasks where a specific answer is needed, a simple visualization may provide better performance in terms of accuracy and recall. Furthermore, clutter may hinder attention to relevant information, reduce the search process, cause low task performances, increase errors and reduce judgment.4,5 As discussed above about CLT, when the task matches the visualization, a lower cognitive load could lead to a higher confidence of the decisions. In addition, Ognjanovic et al. 8 found that a cluttered financial visualization could lead to a negative impact on judgment performance. Therefore, we hypothesize:
In the next section, we investigate how individual characteristics may moderate the effects on performance while using a specific visualization.
Thinking style on visualization
Individuals have different experiences, personality and cognitive abilities that influence how they process information, solve tasks and understand the problem domain. Previous studies have identified that users can have different ways to approaching tasks while using a visualization tool10,25. Thinking style affects information consumption and decision-making. Individuals with different thinking styles have varying learning orientations, information processing and decision-making styles. 26 There are two dominant thinking styles: (1) holistic thinking– intuitive processing that is fast, automatic, effortless, and without requiring working memory; and (2) analytical thinking– reflective processing that is slow, effortful, analytical, rule-based and requires working memory. 27 During the decision-making process, objective and measurable decisions are associated with a more analytical thinking style, which is slow and effortful, while subjective decisions are associated with a more holistic thinking style, which involves fast, effortless information processing. 28
Thinking style and visual types may impact an individual’s choices and task performance. Thinking style identifies an individual’s preference for dealing with problems, but not the actual abilities. 29 It has been found that people with similar abilities exhibit different behaviors and methods to deal with problems based on their specific preferences. 30 When there are more images on the visualization, a feeling of cognitive overload would occur because more efforts are needed to evaluate the visual display full of features. As such, a cluttered visualization may require more mental transformations and demand more efforts on the individual. Additionally, previous studies have found that low processing is associated with more time-consuming and analytical thinking style; while high processing is associated with intuitive, automatic and holistic thinking style. 31 Chang 32 found that individuals who tend to process information holistically experience greater imagery than those who tend to process information analytically. Therefore, we hypothesize as follows:
Domain expertise on visualization
The information-reduction framework 33 states that expertise optimizes the amount of information processed by neglecting irrelevant information and actively focusing on relevant information. This means that experts with domain expertise should know which information to focus on to complete a task. However, Gegenfurtner et al. 34 found in their meta-analysis that visualization moderates the amount of expertise needed to complete tasks because visualizations may be easier to understand. In a study regarding volleyball refereeing, Arslanoglu et al. 35 found that as referees became more experienced, their thinking style became more intuitive, indicating that the system is more automatic, more holistic and based on consciousness. This implies that as experience increases, one would feel more comfortable making decisions quickly due to previous knowledge or expertise in the area. Hence, individuals with higher levels of domain expertise should be more familiar with interpreting financial visualizations and may achieve a higher level of performances when using a simple visualization. Therefore, we hypothesize as follows:
We summarize our research framework in Figure 1.

Research framework.
Methodology
Experiential procedure
A total of 227 graduate and undergraduate business students across two large U.S. universities participated in the experimental study, out of which 103 students are between 18 and 24 years old, 87 students between 25 and 34 years old, 21 students between 35 and 44 years old, 12 students between 45 and 54 years old, and four students above 54 years old.
The study was an online computer-based experiment in which students were given extra course credits as an incentive to participate. In the study we first asked students to take a financial knowledge test to determine their domain expertise, then presented them with various visualization displays, and asked the recall question on the next page. Participants were not able to go back to the visualization to help answer the recall task, which was based on memory. After the experiment, participants completed the situation specific thinking style (SSTS), decision experience survey, and cognitive load survey.
Visualization layout
In this study, we used 3M’s stock data collected from Yahoo Finance for a visualization display. The layout of the visualization was similar to standard stock information shown on other tools like Yahoo Finance, Google Finance, and eTrade. We had a simple version and a cluttered version of visualization for the 3M stock. The simple visualization is identified with a lower-density layout with fewer images that are specific to answering the objective tasks. Therefore, a simple visualization in this study provided three graphs in floating tiled dashboard (Figure 2). The cluttered visualization is identified with a chaotic, high-density layout with visual clutter and complexity, hence, becomes a barrier to cognitive processing. 3 Therefore, the cluttered visualization in this study provided three graphs including other stock information equaling to six images in floating tiled dashboard (Figure 3).

Simple visualization.
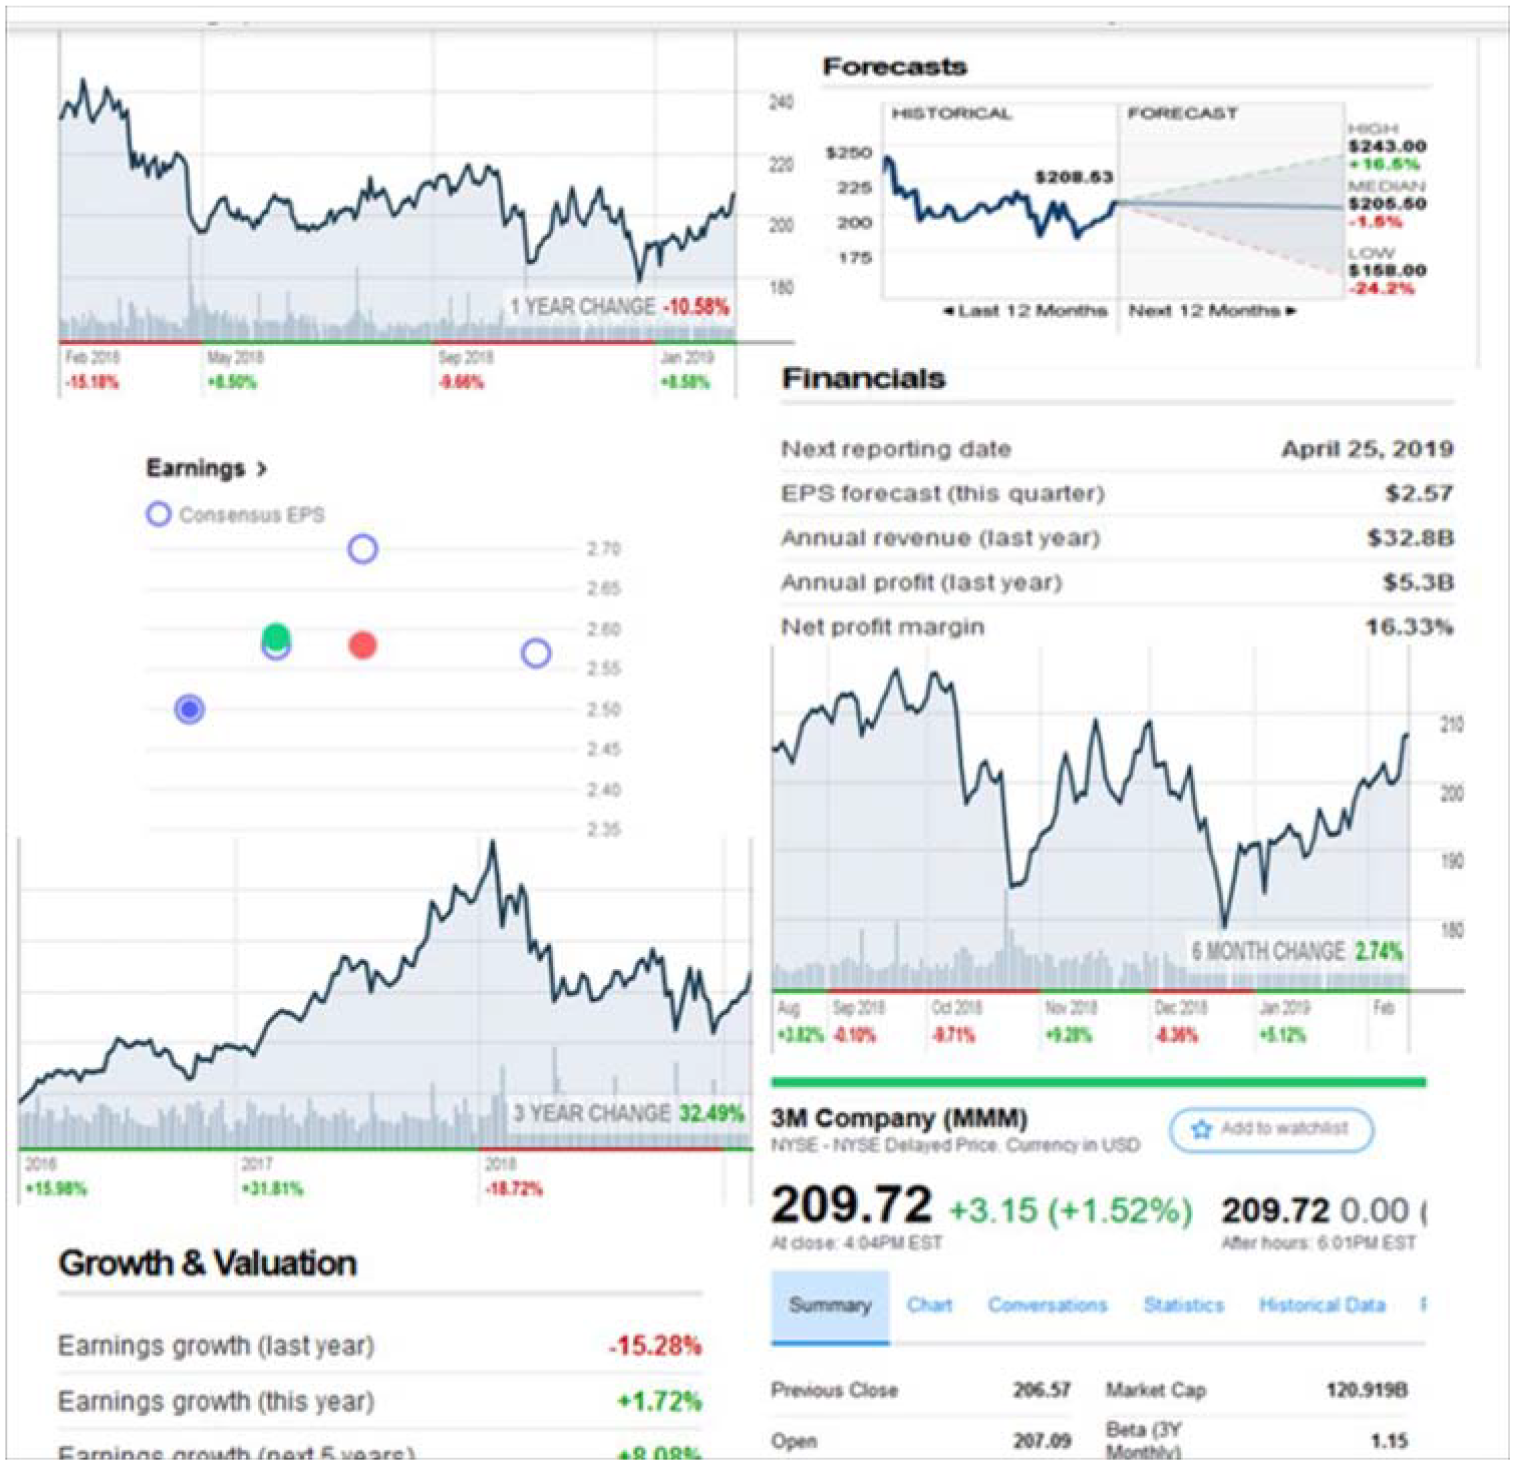
Cluttered visualization.
Experimental tasks
Tasks: Tasks could range from intuitive to objective and the type of task determines the type of information processing that will be evoked by the task. 14 Objective assessment pertains to tasks with measurable accuracy; while intuitive or subjective assessment pertains to tasks that measure a user’s perception or feelings. 36 In this study, our experiment used objective assessments for all participants.
The objective assessment comprised of two accuracy tasks and one recall task provided in Table 1. Two accuracy tasks were positioned directly below the visualization format, allowing respondents to view the visualization while answering the analytical tasks. One memory recall task was placed on the next page and respondents were not allowed to backtrack to the visualization to help answer the recall task. The recall task could only be answered based on memory of the visualization. Overall, there was a definite answer for each of the three tasks in the objective assessment as provided in Table 1. The answers provided in Table 1 were located on both the simple and cluttered visualization on the graphs for 6 months, 1 year and 3 years changes in 3M stocks. The simple visualization, presented three time-series graphs of 3M stock changes (6 months, 1 year and 3 years) presented as depicted in Figure 2; while the cluttered visualization presented additional information, including the three time-series graphs of 3M stock changes (6 months, 1 year and 3 years) as depicted in Figure 3.
Experimental questions and answers.

Measures
Visualization: In our analysis, simple visualization is coded 1 while cluttered visualization is code 0 for the purpose of regression analysis.
Thinking Style: There are many scales to determine a person’s disposition to a thinking style. Situational-specific thinking style (SSTS) looks at thinking style or momentary thinking orientation adopted by a consumer in a specific situation, which is based on Rational-Experiential Inventory (REI) developed by Epstein and his colleagues 37 to measure differences between a user’s innate tendencies to adopt analytical and holistic thinking styles. In this research, we determine a respondent’s dominant thinking style based on a comparison of the respondent’s scores on both analytical and holistic tendencies following instruments developed by Epstein et al. 37 . If a respondent scores higher in analytical tendency than in holistic tendency, respondent is coded as an analytical thinker; a holistic thinker if otherwise. In our regression analysis, analytical thinker is code 1 while holistic thinker is coded 0.
Domain Expertise: Domain expertise is a raw score based on five financial questions, ranging from 0 to 5.
Decision Accuracy: Decision accuracy was measured based on the score of two questions related to the visualization, ranging from 0 to 2.
Decision Confidence: Decision confidence is defined as feeling satisfied, confident, pleased and delighted with the decision. Based on a scale developed by Turetken and Sharda 38 , we developed a multi-item Likert scale that asked questions regarding how confident respondents were with their answers today and satisfaction with the experience.
Memory Recall: Memory recall was measured by asking users to answer a question after recalling previous information on the visualization. Since users were not allowed to backtrack to the visualization, they had to answer the recall question based on memory.
Cognitive Load: Cognitive load is a cognitive construct, defined as the ease or difficulty of processing information. 19 The cognitive fit theory suggests that when there is a mismatch between visualization and task, users will have to invest more effort in the decision-making process because they need to adjust their mental load to accommodate the mismatch. We measure cognitive load using the Likert scales on six questions developed by Hong et al. 39 that combine cognitive decision effort and cognitive convenience. Therefore, scores for cognitive load range from 6 to 30 based on a five-point Likert scale for each of the six questions.
Regression models and results
Given the four indicators for decision performances – decision accuracy, decision confidence, memory recall, and cognitive load, we run regressions separately using each of the four-performance indicators as a dependent variable (DV). To test the moderating effects of thinking styles and domain expertise for each performance indicator, we run both main-effects and moderator-effects models for each DV.
The main-effects models are provided in Model 1 for the decision accuracy, Model 3 for decision confidence, Model 5 for memory recall, and Model 7 for cognitive load. Our main-effects models are specified as follows: Decision Performances = f (Visualization, Analytical thinker, Domain expertise, Age as a control variable).
The moderator-effects models are provided in Model 2 for decision accuracy, Model 4 for decision confidence, Model 6 for memory recall and Model 8 for cognitive load. By including interaction terms, the moderator-effects models are specified as follows: Decision Performances = f (Visualization, Analytical thinker, Domain expertise, Visualization × Analytical thinker, Visualization × Domain expertise, Age).
Descriptive statistics are reported in Table 2. Correlations are reported in Table 3, which shows that collinearity may not be a concern due to low levels of correlations. To further mitigate the potential threat of multicollinearity caused by interaction variables, 40 we mean centered the variable Domain experience following Cronbach 41 and Jaccard and Turrisi 42 . The variance inflation factors (VIFs) of all models are all below 4, indicating no significant multicollinearity among the predictor variables. Regression results are reported in Table 4, which shows that all models except Models 5 and 6, which use memory recall as DV, are significant.
Descriptive statistics.

Correlations.

Regression results.

Robust standard errors are in parentheses. *, **, and *** denote 10%, 5%, and 1% significance levels for two-tailed tests, respectively.
Note that simple visualization has a highly significant coefficient of 0.28 in Model 1 (Decision Accuracy with main effects) and a significant coefficient of 0.33 in Model 2 (Decision Accuracy with moderator-effects), suggesting simple visualization does improve decision accuracy. Also note that Simple visualization has a coefficient of −2.10 for Model 7 (Cognitive Load with main effects), suggesting that simple visualization helps reduce cognitive load. Unfortunately, Simple visualization is not found to be significantly associated with either Decision Confidence or Memory Recall based on the results of Models 3, 4, 5, and 6. Overall, we find partial support for H1 that simple visualization enhances decision performances in terms of greater decision accuracy and lower cognitive load.
In addition, Analytical thinker is found to be significant in Model 1 (coefficient of 0.36%, p < 1%) and Model 7 (coefficient of −2.04%, p < 1%). The result suggests that analytical thinkers achieve better decision accuracy and use a lower cognitive load than holistic thinkers when completing an objective assessment task. However, we do not find a significant association between Analytical thinker and Decision Confidence or Memory Recall. As for Domain expertise, it has a significant coefficient of −0.64 in Model 7, indicating that subjects with greater domain experience in finance use less cognitive load. Unfortunately, Domain expertise is not significant in Model 3 (Decision Confidence with main effects), and Model 5 (Memory Recall with main-effects) is not significant overall. In summary, we find partial support for H2 and H4.
Also note that the interaction term of Simple Visualization × Analytical Thinker has a significant coefficient of −2.42 in Model 8, suggesting that analytical thinkers use further less cognitive load when presented with simple visualization. This result supports H3 that the impact of simple visualization on decision performances varies with thinking styles. Unfortunately, the interaction term Simple Visualization × Analytical Thinker is not significant in Model 2 (Decision Accuracy), Model 4 (Decision Confidence), or Model 6 (Memory Recall).
We further note that the interaction term Simple Visualization × Domain Expertise is not significant in any of the four moderator-effects models, suggesting that the impact of simple visualization on decision performances may not vary with the level of domain expertise. Therefore, we have not found support for H5 regarding the moderating effects of domain expertise. The summary of the results is provided in Table 5.
Summary of results.

Discussion of findings
Prior research provides valuable perspectives on the benefits of visualization; however, there is a lack of studies on the effect of visualization types on individuals with different thinking styles. Our study contributes to the current research on effectiveness of different visualization types and sheds light on its effects on decision making for individuals with different thinking styles and domain experience. From a cognitive load perspective, we posit that objective tasks completed on a simple visualization are matched. The objective assessment tasks can be identified to be more analytical. Our results show that simple visualization has a positive effect on decision accuracy. However, it does not contribute to their confidence or ability to recall as suggested by the results in Models 3 and 4 (Decision Confidence) or Models 5 and 6 (Memory Recall). While we remain hopeful for our reasonings, the measures for decision confidence and memory recall in the research design may not be ideal. Memorability of visualizations can be difficult since the designer needs to identify which type of pre-attentive attributes will stand out to the user. Borkin et al. 2 conduct a study on unique visualization types, which included pictorial, grid/matrix, trees and networks and diagrams. They found that these unique visualization types had significantly higher memorability scores than common graphs like circles, area, points, bars and lines. While the authors state color does increase memorability, this was not the results shown in this study. In both of our visualizations, there was nothing memorable that stood out to the users regardless of the color provided to identify the answers. Furthermore, the simple visualization did not result in better performance than the cluttered visualization in terms of memory recall.
The study shows that participants had better decision accuracy using the simple visualization than the cluttered visualization based on the results from Model 1 using main effects and Model 2 using interaction terms. While some previous studies found clutter and chartjunk increased deeper processing and improved memory, 24 our study contradicts these findings and aligns with the findings of Baldassi et al. 5 . Lallé and Conati 43 also found that users with low visualization literacy outperformed users with high visualization literacy. Based on the results, we find that a cluttered visualization causes a negative impact on decision-making regardless of experience. We believe that there may be an opportunity to investigate at what point a simple visualization turns cluttered for decision-making. The difference between the simple and cluttered visualizations was the number of images provided: simple images were half as many as those provided in the cluttered. Future studies should examine a scale of different visualizations from three images to six images to identify at what point the visualization starts to reduce performance.
Using a student sample, we find partial support for the effects of visualization on individuals with different thinking styles. Specifically, we find that analytical thinkers had greater decision accuracy and lower cognitive load than holistic thinkers as suggested by the results of Models 1 and 2 (Decision Accuracy) and Model 7 and 8 (Cognitive Load). This aligns with the CLT. When the task matched the visualization, in this case, a simple visualization and objective task, cognitive effort decreases, and there is no extra toll on the working memory on the decision-making process. When managers are making decisions using visualizations, cluttered visualizations make processing information harder and reduce their ability to accurately make decisions when completing an objective task. It is important to understand that the cluttered visualization caused cognitive load to the user which affected their performance and decision confidence. It would be interesting to investigate further at what point a visualization becomes cluttered and causes a mental overload in future research.
Additionally, decision making performance generally improves with experience. Individuals who have acquired subject expertise should easily discern between relevant and irrelevant data in their decision making. Furthermore, participants with a higher level of expertise as well as being analytic thinkers showed lower cognitive load using a simple visualization as suggested by the results of Model 8. Dane et al. 44 showed that the effectiveness of intuition increases with experience; however, we find that analytical thinkers with greater experience had lower cognitive load when presented with simple visualizations. Users who focused on tasks and reviewed each part of the visualization, instead of the entire visualization, experienced a lower cognitive load. Although, we expected that as experience increases, individuals should have greater decision accuracy, decision confidence, and memory recall, our hypotheses were not supported. Tomasi et al. 45 also found that users with less experience had better performance when using novel interfaces. When the tool is familiar, users with high experience tend to complete tasks in a familiar way while an inexperienced user may take a cautious approach to completing the task. Lallé and Conati 43 also found that low “vis literacy” outperformed users with high “vis literacy” in their experiments of interventions on visualizations.
Managerial implications, limitations and conclusions
Managerial implications
Our study has important practical implications for designers and visualization users, including managers and learners. With the emergence of Big Data, tools like Google Analytics and Tableau are essential in the field of data analytics and data sciences. Visual literacy has become increasingly important to promote better decision making and content consumption experience. While the vast majority are competent at using visualizations to obtain what they need to complete a task or make a decision, why do some people use visualization so much more effortlessly or effectively than others? Our study suggests that designers should recognize the various effects of visual design on users’ decision making based on users’ thinking styles. The results confirm that simple visualization leads to greater decision accuracy and requires lower cognitive load, which indicates that one’s thinking style moderates how content is consumed and used to make decisions.
Based on previous research, we find some users are analytical while others are holistic and rely on their intuition and imagination.37,46 We also find that analytical thinkers perform better than holistic thinkers in terms of greater decision accuracy. This finding further suggests that analytical thinking may lead to better performance among users in certain situations. Furthermore, we find that analytical thinkers utilized less cognitive load when presented with simple visualizations. We encourage designers to design less cluttered visualizations with easy-to-understand graphs and images.
Overall, our research led us to conclude the importance for managers and learners to understand one’s dominant thinking style to maximize performance while using visualization tools. While we understand that creating unique visualizations may not be possible for each decision maker, there may be options that take individual characteristics into consideration when using tools. We do believe that designers should find ways to design more inclusive visualizations that accommodate individual characteristics. In general, we recommend adopting well-designed and simple visualizations with less clutter for better managerial outcomes. Similarly, to help students succeed, academic institutions should have clear objectives in data visual design in which various thinking styles are considered as Big Data becomes the new norm.
Limitations
This research is subject to several limitations. First, student subjects are used in this experiment. Future research shall consider the use of managers in experiments to gain more realistic insights. Second, measures related to decision confidence and memory recall are not supported by our study’s findings. Future research is encouraged to refine instruments for both performance constructs. One lesson learned is that if questions are too many or too difficult to answer, participants may tend to resort to guessing without serious thinking in an experiment. Third, our visualization is created based on the financial information of 3M using Yahoo Finance. While we tried to make our visualization complex for the cluttered condition, the basis of our visualization was still a consumer-based product rather than an enterprise product. Fourth, domain expertise is measured based on participants’ self-assessment of their investment knowledge. Ideally, domain expertise should be treated as an exogenous variable and hence in future research domain expertise may be measured by some objective indicators, for example years of work experience in a field, position level, professional certificates, etc. Lastly, it may be interesting to examine how different thinking styles and levels of domain expertise interact together to affect the responses of participants to different visualizations. Therefore, a three-way interaction model may be considered in future research.
Conclusions
In conclusion, this study contributes to the extant literature in multiple fronts. First, we build a comprehensive theoretical framework on the impact of visualizations (simple vs cluttered) on decision performances which are measured by four different indicators – decision accuracy, decision confidence, memory recall and cognitive load. Second, based on situation specific thinking styles (analytical vs holistic), we build a moderator-effects model for thinking styles and investigate whether analytical thinkers may perform from holistic thinkers in reacting to simple and cluttered visualizations. Third, we also build a moderator-effects model for domain expertise and investigate whether decision makers with higher levels of domain expertise may perform differently from those with lower levels of domain expertise.
Our results provide the first step to understanding how clutter, experience, thinking style and cognitive load can interact and impact performance in the context of financial visualizations. Further studies should look into at what point a cluttered visualization starts to fail a decision-maker by creating a spectrum of visualizations with a gradual increase in clutter.
In summary, our findings are consistent with Cognitive Load Theory. Through an experiment where students of all ages, various domain expertise levels and different thinking styles are presented with either simple or cluttered visualizations. We find that simple visualization is associated with greater decision accuracy and lower cognitive load. We also find that analytics thinkers perform better using visualizations compared to holistic thinkers and that analytical thinkers use much less cognitive load when presented with simple visualizations.
