
Abstract

Reminiscence
Ed and I first met in 1959 at the University of Wisconsin, Department of Mechanical Engineering where we were beginning our first year of graduate school (Note: This article was prepared in cognizance of Ed Rice. Some of the key dates and data were obtained from him.). We were working together on a project to measure the size distribution of drops in a spray with application to fuel injection in an internal combustion or rocket engines. A novel photographic technique used a fluorescent dye in an ethyl alcohol spray which was selectively illuminated by a pulsed sheet of light to record fluorescing drops on high-speed film for later measurement. The experimental set-up was in a proof-of-concept stage, and our job was to refine it to make drop size measurements as rapid as possible.
Since a very intense pulse of light of short duration was required to stop the drop motion, a high-voltage spark discharge in a quartz tube was focused into the 100-µm thick sheet across the spray. Even though the fluorescing drops within a sample volume were recorded on high-speed film, an additional cyanide bath was required during the film development process to intensify the images, which added some drama to handling the very poisonous mixture.
The Internal Combustion Engine Laboratory at the University of Wisconsin was in a “temporary” building labeled T-25. It was a remnant from the time immediately following Second World War when the return of Veterans under the GI bill required more office space. We often ate at another temporary building near the Mechanical Engineering Building. The tables had white plastic tops that Ed found worked well to write on with a soft lead pencil the equations and diagrams we were discussing. As we left, he wiped the table clean with a damp cloth. In future years, he did his analysis on quad-ruled yellow pads that accumulated in deep stacks around his desktop.
In the process of working together in T-25, we became good friends, and that was the beginning of a life-long, deep friendship between us, and as it turned out, our families. Ed had lived with his older brother in Milwaukee, Wisconsin since he was 13 years old when his mother died and he moved from his boyhood home in Superior, Wisconsin to live with his brother. His brother had a heating and air conditioning business, and he needed a supply of sheet metal boxes called “boots” to join pipes to registers. Since Ed needed some extra money to supplement his graduate assistantship, on weekends he traveled to his brother’s shop to make boots where his brother agreed to pay him by the piece. It didn’t take long for Ed to devise a one-man assembly line to dramatically increase his output. His brother was astonished but agreed to honor the original agreement.
A former graduate from the UW Mechanical Engineering program and a recruiter for the NASA Lewis Laboratory in Cleveland, Ohio visited T-25. He explained that Air Force ROTC graduates with PhDs such as Ed and I aspired to become, could serve their active military commitments as researchers at NASA Lewis. We both eventually went to work at NASA; but only after course work and many hours laboring in T-25 acquiring drop data. Ed worked in size distributions and later I worked to acquire both size and velocity distributions.
At Lewis we both worked in a group whose goal was to learn how to avoid combustion instability in rocket chambers. The combustion process could couple with acoustic modes of the chamber producing very high pressure amplitudes and heat transfer rates which would melt the chamber walls destroying the entire vehicle. We learned about acoustic modes in cylindrical and annular geometries and methods to experimentally identify them.
In the latter 1960s when we both had fulfilled our military commitments, we joined Lewis as civilian employees. Research priorities changed and our group was reorganized and assigned the problem of how to quiet the new high by-pass ratio civil aircraft engines. Management reasoned that we already understood acoustic oscillations inside rockets and we should be able to make the transition to aircraft noise generation and propagation to communities.
Aircraft operations around airports were increasing in number, and often, residential communities were built very close to the runways. Community complaints were increasing and technology to quiet the fleets was needed. The Federal Aviation Administration was responsible for making airport noise rules and needed NASA’s help in developing the technology on which to base the levels and determine how low they could go. The NASA Quiet Engine Project was established and Lewis had both contractual and in-house responsibilities.
Ed assumed responsibility for methods to design sound absorbing treatment for nacelle walls and sound propagation to the far field. This entailed being able to define soft wall geometries to maximize sound attenuation. He developed equations to predict maximum attenuation for each mode in a soft walled duct; and he also developed equations to calculate the acoustic impedance of perforated plate resonators on walls subject to grazing flow.
The Quiet Engine Program had contracts with General Electric to build three different engines having fans with different pressure ratios and tip speeds. Lewis used large electric wind tunnel motors to drive the full scale, two-meter diameter fans. Ed was asked to design nacelle acoustic treatment for these fans.
The fan and stator had been designed with blade numbers to cut-off the fundamental blade passing frequency (the blade vane interaction tried to drive an acoustic mode that could not propagate.) However, the results from analyzing the measured acoustic data showed that the fundamental blade passing tone was still very prominent in the far field. By photographing the inlet during humid conditions, a vortex made visible by condensation formed at the ground and bent into the inlet. This disturbance interacting with the fan generated the strong fundamental tone observed in the measured far field data. Following this revelation, much effort was expended learning how to design inflow control devices, usually hemispherical honeycomb structures, to eliminate inlet disturbances for static fan or engine testing.
Following the Quiet Engine Program and other turbofan engine projects in the early 1980s, the emphasis turned to the Advanced Turboprop Project. High tip speed advanced propeller designs that could realize the improved propulsive efficiency of un-ducted rotors while still cruising at high subsonic speeds were investigated. By the mid-1980s, NASA Lewis aeronautics research was reorganized to separate basic research and focused projects. That meant Ed and I were no longer in the same division and building. Ed moved to the research areas of shear flow control and absorption of electromagnetic radiation.
While Ed made his greatest technical impact with his analysis, he has always been willing to design and build physical objects that were very neatly constructed and always robust. Later in his life, he built an 80-foot long dock on one of the New York Finger Lakes where he owned a summer home. It was complete with hand-operated lift to handle each of the 10 eight foot long, several hundred pound sections to install in the spring or remove in the fall.
In 1993, Ed retired from NASA and established his own aeroacoustics consulting business. He was then free to return to developing and refining his cut-off ratio correlation and design methods. Engine and nacelle manufacturers were sponsors of much of the work. Ed’s synopsis of liner design methods using cut-off ratio is summarized in the next section of this paper. His techniques have been adopted by several engine manufacturers.
Liner design methods
An objective of the aircraft nacelle noise suppression research was to provide a model for the propagation of sound in a cylindrical duct lined with a sound absorbing material and propagation of the surviving sound to the far-field, where observers are located and sound measurements are recorded. Capability to optimize a suppressor system was desired. The engine components considered included the aircraft inlet, fan exhaust duct, and turbine exhaust duct. A steady grazing flow across the liners needed to be included. The modeling of the lip or a bell mouth was included for an inlet. The exhaust modeled a nozzle and the slip flow encountered with the surrounding medium. The modeling of the acoustic impedance of the wall material was performed to provide the boundary condition for the sound propagation theory. A typical wall material was a perforated plate bonded to a honeycomb backing structure. Bulk materials such as Kevlar fibers could also be used. A very important observation from the modeling was that a single parameter, the mode cut-off ratio of the acoustic propagation modes, dominates all of the important phenomena of the system. These include the performance of the wall suppressors, the termination effects, and the sound propagation to the far-field. The following discussion provides the background for this system unifying principle.
A review of the of the acoustic liner optimization concept considered in the studies is shown first. The studies start with a single acoustic duct mode defined by the number of lobes in the circumferential direction, m, and the number of pressure nodes in the radial direction, µ. The attenuation or damping coefficient (given as ΔdB per L/D, where L is the length of the duct and D is the diameter of the duct) is held constant while varying the phase coefficient and plotting the resulting specific acoustic impedance points in the wall impedance plane. Sample results are shown by the solid curves in Figure 1 for the first radial mode of a seven lobed circumferential mode in a circular duct. Here, the specific acoustic resistance, θ, and the specific acoustic reactance, χ, are normalized by the parameter η = fD/c where f is the frequency and c is the speed of sound. The resulting curves were observed to be nearly circular with the radius diminishing with increased damping. As damping is increased, the nearly circular curves collapse to a point that is called the optimum impedance for that acoustic mode. The related attenuation is the maximum possible attenuation for that mode. The off optimum impedance is given by a system of nearly circular contours centered on the optimum impedance. After a thorough study, a system of simple equations was developed to describe the radii and center location of these circular contours. The approximate results for this mode are shown in Figure 1 as the dashed circles. The additional input values of frequency parameter η, the duct Mach number MD, and the boundary layer thickness normalized by the duct radius ɛ are also shown. This provides a preliminary evaluation of the off-optimum liner performance for any desired acoustic mode. A realistic noise source would generally contain many propagating acoustic modes and an evaluation of the suppression of all of these modes must be performed to obtain the suppressor performance. An early approximate liner design procedure based upon the acoustic mode (m, µ) and the physical input parameters were presented in Rice.
1
Optimum impedance demonstration and comparison of exact and approximate equal damping contours. Duct acoustic mode m = 7, µ = 1, η = 10, MD = −0.4, ɛ = 0.002.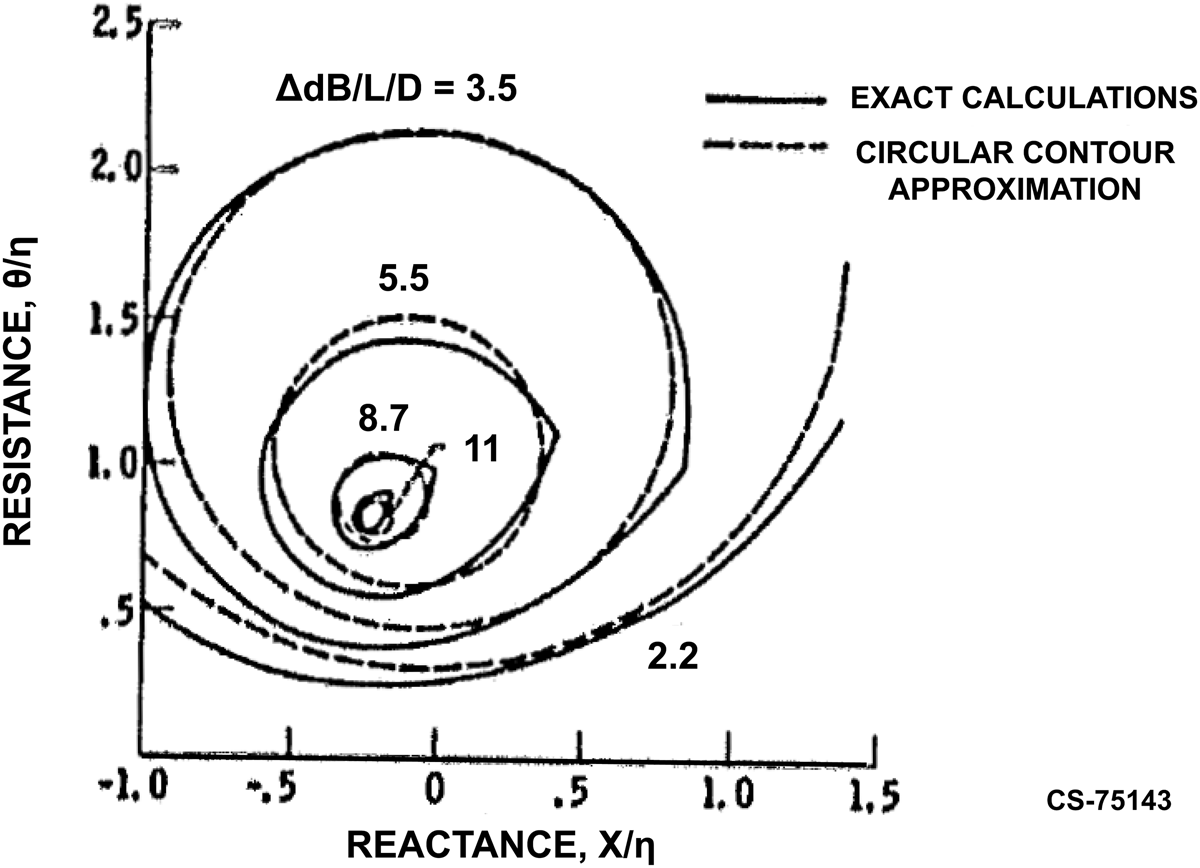
Evidence that the acoustic mode cut-off ratio is the important fundamental parameter for suppressor performance was observed during the analysis of the acoustic performance of an inlet suppressor tested with a General Electric TF-34 engine. The flow conditions for the engine inlet were used and the optimum impedance calculations for spinning modes up to forty lobes (m = 40) and radial modes up to cut-off were performed. The results are plotted in the acoustic impedance (resistance, reactance) plane in Figure 2. All of the results cluster very tightly along a common curve with mode cut-off ratio varying along this curve. The mode cut-off ratio is defined as ξ = πη/α, where α is the mode eigenvalue. Coincident points on this curve were investigated. The (3,7) mode and the (8,5) mode were nearly coincident. Their cut-off ratios were 1.20 and 1.18, respectively. This infers that the liner optimum acoustic resistance and reactance are uniquely dependent upon mode cut-off ratio. All of the modes in a small cut-off ratio range behave the same in the acoustic liner and each mode does not have to be singled out or uniquely determined. The mode cut-off ratio is a powerful unifying parameter which greatly simplifies the analysis and modeling of the entire noise suppressor system.
Example higher order spinning mode optimum impedance locus. Frequency, 2890 Hz; frequency parameter, 9.47; Mach number, −0.36; boundary layer, ɛ = 0.059.
A study of the maximum possible attenuation and optimum acoustic impedance was performed for all of the propagating modes. The input parameters, frequency, Mach number, and boundary layer thickness were in turn held constant. Sample results are shown in Figure 3 where frequency parameter and Mach number are held constant and the boundary layer was varied systematically. The mode cut-off ratio was seen to tightly correlate the optimum impedance results for all of the duct modes for a constant wall boundary layer thickness. The boundary layer was seen to have very little effect up to about ɛ = 1.5, but above this the refraction effects become significant. For low values of cut-off ratio, the acoustic propagation was mainly radial and circumferential and not effected by the boundary layer. For high cut-off ratios, the acoustic propagation is mainly axial directed into the boundary layer. Similar correlations were found for the optimum wall reactance and for the maximum possible acoustic attenuation. The results were correlated into an acoustic suppressor model and sample results are shown in Figure 3 by the dashed curves.
Comparison of correlating equation with exact calculations of optimum resistance for variations in boundary layer thickness.
The approximate acoustic liner design method based on mode cut-off ratio is documented in Rice. 2 This procedure handles the entire array of acoustic modes but it does it in a simple way through the cut-off ratio. A modal density function was required in this procedure and was developed in Rice. 3 This modal density function is used to determine what fraction of the modes exists between two values of cut-off ratio by integrating the function between these two values. The bins produced can be structured to have equal acoustic power in each bin as an example. Each bin is then analyzed using its representative cut-off ratio to determine the optimum impedance and maximum possible attenuation. The relevant variable values, flow Mach number, boundary layer thickness, duct geometry and liner resistance and reactance at the sound frequency are used to calculate the off optimum acoustic power attenuation for that bin. After all the bins with their cut-off ratios are analyzed, they could be combined to provide the total power attenuation at that frequency. The procedure can be repeated at all the frequencies of interest to produce an acoustic power reduction spectrum. Alternately, the bin information can be maintained and projected to the far field as will be discussed next.
The far field radiation model, summarized in Rice, 4 was developed and was also shown to be a function of mode cut-off ratio. The angular location of the principal lobe of radiation was determined by the mode cut-off only in this approximate model. The width of this lobe was determined by the frequency parameter with the lobe being narrower for higher frequency. Using the modal density function previously discussed, an equal energy per mode radiation pattern was developed. This radiation pattern was seen to be surprisingly simple being just proportional to the cosine of the angle measured from the inlet axis. The sound radiation peaks on the axis and falls off continuously toward the sideline. The model was compared to data and shown to fit very well. Thus, an equal energy per mode assumption for the broadband noise seemed appropriate.
A further improvement in the inlet radiation model was provided in Rice. 5 The inlet bellmouth normally used for static engine testing has a considerable effect on the inlet radiation. The bellmouth causes the radiation to be shifted toward the sideline and allows some acoustic modes to propagate which would be reflected with a flight inlet. These effects are due to the group velocity vector modification and the termination power transmission loss being altered by the bellmouth. The effects have been incorporated into the radiation model summarized in Rice. 5
The entire acoustic radiation model is summarized in Rice.
6
This includes the inlet radiation model development presented here and also the development of an aft radiation model which includes the jet slip layer, which refracts the sound through the shear layer. This model is valid for the primary jet or the bypass duct jet. The primary dependence on the mode cut-off ratio is preserved in these models to allow matching with the approximate noise suppressor models for the internal ducts. A sample comparison of the approximate radiation model to an exact calculation for the radiation of an aft duct mode passing though the jet shear layer into the far field is shown in Figure 4. Excellent agreement is seen for the most important principal lobe of radiation.
Comparison of approximate and exact aft radiation patterns for duct acoustic mode m = 8, µ = 4, MD = 0.6, Mf = 0, η = 7.11.
All through the research program discussed here, there was considerable effort extended to model the acoustic liner properties. The acoustic resistance and reactance determined from the suppressor optimization programs had to be realized in actual hardware. An acoustic modeling was conducted to characterize the possible liner structures. Perforated plate bonded to a honeycomb backing structure was a very usable candidate. It could be made structurally durable, was easy to clean and had a fairly low drag. The acoustic resistance was largely determined by the grazing flow velocity over the surface. This effect has been modeled analytically in Rice 7 and a flow visualization study was conducted in Baumeister and Rice 8 to qualitatively define the flow oscillating in the orifice. The combination of linear screen materials bonded to perforated plate has been modeled in Rice 9 to provide a face plate with a reduced grazing flow resistance effect. The very fine screen material had nearly laminar flow around the fibers or wires to provide a linear viscous pressure drop as compared to the nonlinear pressure drop of a perforated plate orifice. The acoustic impedance model used for design in this program is summarized in Heidelberg et al. 10 and Rice and Heidelberg. 11
A summary of the research outlined here can be shown as a large information loop with one main correlating parameter, the mode cut-off ratio. Assume that a distribution of acoustic power as a function of mode cut-off ratio is provided by a noise source generating model. The acoustic suppressor attenuation model using the selected wall acoustic impedance along with the input variables (Mach number, boundary layer thickness, frequency, liner diameter and length) determines the acoustic suppression at each cut-off ratio specified. The duct termination loss further reduces the acoustic power for each cut-off ratio. The radiation model then determines the far-field power directivity accounting for the bellmouth or inlet lip configuration, and aft duct shear layer. The calculations must be repeated for each frequency in the desired spectrum. If the noise suppression is adequate for the application, the procedure is done. If not, the acoustic liner properties (resistance and reactance) are altered with structural parameters. Large numbers of calculations may be required, but this is easily accomplished with modern computers especially since the complex calculations have already been incorporated into the model correlations.
Closing remark
From his early graduate school years, Ed had the ability to solve practical problems with the backing of sound theoretical considerations. This trait continued throughout the rest of his career. His contribution in the area of acoustic liner design is well recognized. He has also made contributions in other areas, such as turbulent shear flow and its control, as discussed in another article of this special issue. Personally, it has been a pleasure to be associated with him and for the many fruitful interactions throughout our careers. The 2014 AIAA Aeroacoustics Award was a well-deserved honor.
Footnotes
Declaration of conflicting interests
The author(s) declared no potential conflicts of interest with respect to the research, authorship, and/or publication of this article.
Funding
The author(s) received no financial support for the research, authorship, and/or publication of this article.