
Abstract
To validate and reduce the uncertainty associated with noise prediction models for wind turbines, there is a need for detailed noise measurements on wind turbines in controlled conditions. However, high-quality wind tunnel campaigns on horizontal axis wind turbine models are scarce due to the large wind tunnel size needed and consequently high associated costs. To serve this purpose, an experiment using the 4.5 -m diameter Mexico turbine was set up in the large low-speed facility of the DNW wind tunnel. An overview of the experiments is given including a selection of results. Both far field microphone as well as microphone array measurements have been performed together with unsteady force measurements on five instrumented blade sections. This allows a unique insight into the relation between acoustics and the underlying aerodynamics. Overall noise characteristics of the turbine have been determined for a variety of operational conditions by varying tip speed ratio and blade pitch angles. Scaling of the noise is studied by comparing similar combinations of tip speed ratio and pitch angle for different tip speeds. The effect of blade soiling on the noise is evaluated using roughness strips, as well as the influence of yawed or misaligned inflow on the rotor noise. A comparison of calculations using a BPM model is given indicating for which operational conditions this model suffices and for which parts the noise prediction can be improved. In summary, after years of preparation, ECN and partners have performed very successful aeroacoustic experiments in the largest wind tunnel in Europe. The comprehensive high-quality database that has been obtained will be used in the international Mexnext consortium to further improve wind turbine acoustic modeling.
Introduction
Uncertainty in aerodynamic noise (and load) prediction is an important parameter driving the price of wind energy.1,2 An accurate prediction of noise can aid the design of more quiet blades but also noise mitigation strategies. There have been many previous modeling efforts in the field of wind turbine noise, which for modern turbines mostly focus on aerodynamic noise from the blades. 3 Mechanical noise is often not considered an important source, as long as tonal components are not present. 4 Where rotational harmonics are dictating the low-frequency spectrum for downwind rotors, they seem to be insignificant above 20 Hz for upwind placed rotors.5,6 Both aerodynamic source modeling as well as its propagation have hence been subject of investigation, mostly for upwind placed rotors.
Source modeling ranges from simple empirical one-equation models to computational aeroacoustic simulations resolving both the flow field and acoustic perturbations around the wind turbine blades. 7 A compromise between accuracy and computational effort can be found in semi-empirical methods that divide the wind turbine blades into segments and treat these as two-dimensional airfoil sections producing incoherent sound sources.8,9 The most popular model for predicting these sectional sources is the Brooks, Pope and Marcolini (BPM) model. 10 It includes a prediction method for turbulent boundary layer trailing edge noise, which is believed to be the dominant source for wind turbine applications. 11 However, the TNO model, 12 which includes a more physics based approach, is gaining popularity as well. 13
Validation by experiments is the most plausible route to model improvement. Although many field measurements on wind turbines exist, 14 the uncertainty in inflow conditions (turbulence, shear, gusts) and turbine specifications complicates progress. To reduce this uncertainty, experiments in controlled conditions as featured in wind tunnels are a prerequisite. However, high-quality wind tunnel campaigns on horizontal axis wind turbine models are scarce due to the large wind tunnel size needed and consequently high associated costs.15,16 To serve this purpose, measurements on the Mexico wind turbine were carried out in the large-scale low-speed facility (LLF) of the German Dutch Wind Tunnels (DNW) in 2014 as a follow-up of its previous campaign in 2006. 17 One of the special features of this experiment is that in addition to the loads and flow velocities noise sources were also measured using a phased microphone array.
An illustration of this experiment, called New Mexico, is given in Figure 1. Readily published results featuring loads and flow field measurements plus their comparison against simulations can be found in literature.18–22 The present paper gives an overview of the acoustic part of the experiment, including selected results together with a comparison of noise predictions.
Test setup of the experiment.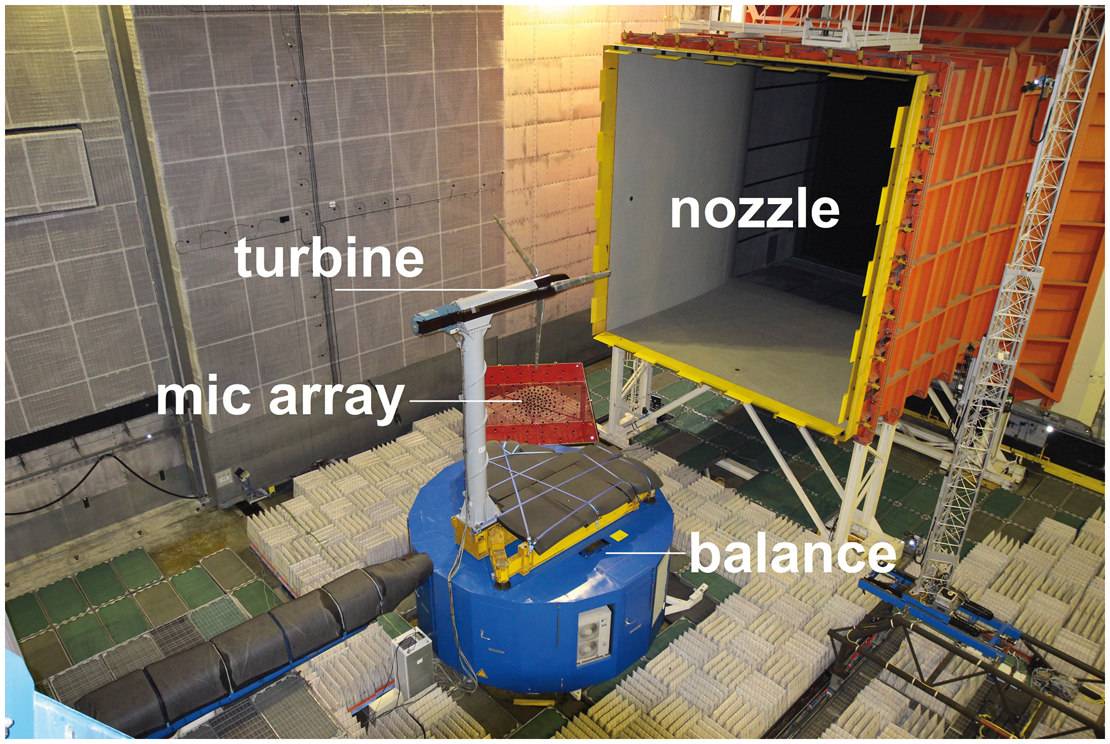
Test setup
The setup of the experiment was largely identical to the first Mexico campaign, featuring a 9.5 × 9.5 m2 open jet configuration. A picture of the setup is shown in Figure 1. The model features a three-bladed 4.5 m diameter upwind rotor, including a speed controller and pitch actuator. The model is instrumented with unsteady pressure sensors at five sections (25%R, 35%R, 60%R, 82%R, and 92%R), distributed over the three blades. Strain gauges were added to the root of the blades to measure flap- and edgewise bending moments. Several model-related sensors were installed in the nacelle (e.g. generator torque, 1p sensor, accelerometer and inclinometer) to track turbine performance. The model was suspended to a six-component balance at the tower foot to measure forces and moments. Phase-locked stereo PIV measurements were performed at a 9 o’clock plane of the rotor for a variety of configurations and locations. A difference with the previous campaign lies in the fact that acoustic measurements were performed. The next three sections give more information about the turbine design, acoustic instrumentation and its post processing.
Rotor design
The blade features the DU-91-W2-250 profile for the inboard sections, RISØ-A2-21 midboard and NACA-64418 for the outboard sections, as depicted in Figure 2(a). Chord and twist distribution were optimized to obtain a blade planform that operates close to an axial induction factor of 1/3 in design conditions (tip speed ratio Blade design details. (a) Blade shape and (b) polars of outboard profile.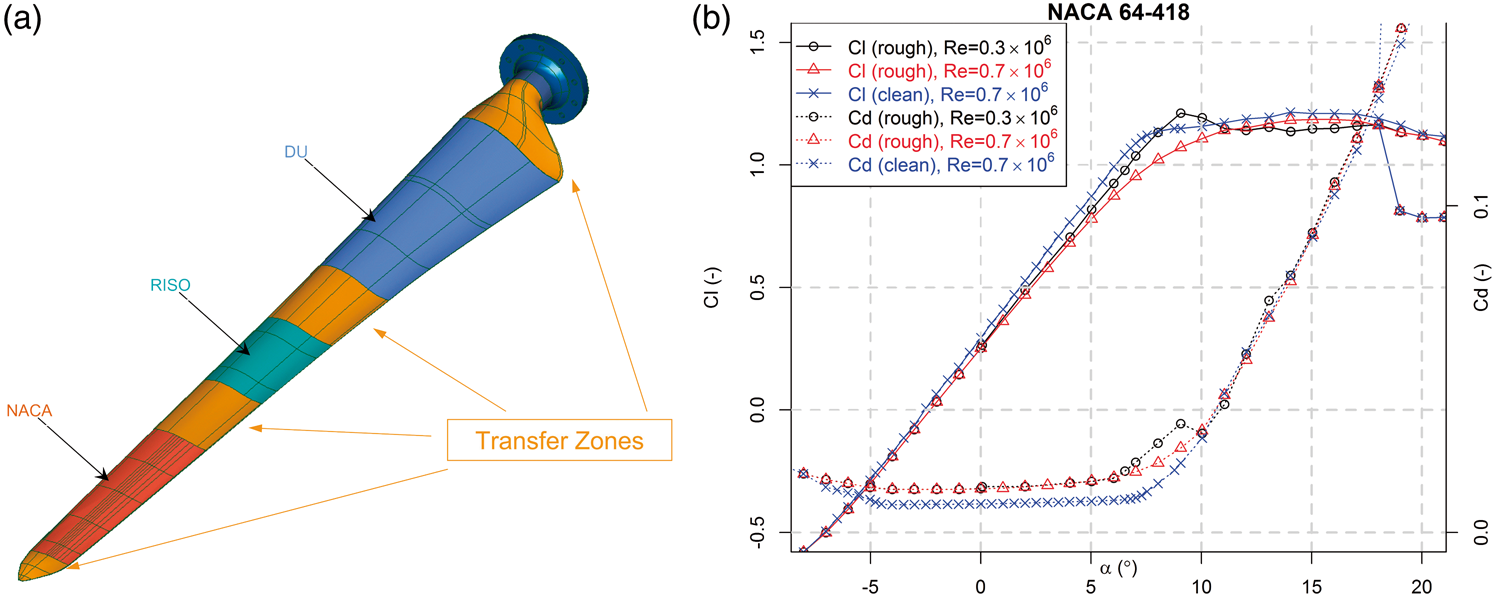
Acoustic instrumentation
An acoustic array was positioned between nozzle exit and the model, below the jet (depicted in red in Figure 1). As can be observed, the array could not be placed directly upstream of the model, but was positioned slightly sideways due to the restricted space available between the nozzle (depicted in orange) and external balance (depicted in blue). The 4 m × 4 m phased array consisted of 140 electret microphones (circular arrangement) sampled at a frequency of 51.2 kHz over a period of up to 60 s for each data point. In addition to that, 48 far field microphones, arranged in three horizontal rows on the side wall of the test chamber (covering directivity from about 40° to 140° with respect to the rotor center, where 90° denotes sideways propagation) were used, featuring the same data acquisition parameters as the array.
Although all microphones are positioned outside of the open jet, they are protected by so-called foam ‘wind balls’ against wind noise from secondary flows in the test hall. All microphones were calibrated using a certified pistonphone, providing a pure tone of 94 dB at 1 kHz. Acoustic lining was applied to the test chamber side walls, floor and ceiling wherever possible to prevent reverberations. Foam padding was applied to the top side of the balance (depicted in grey in Figure 1) to prevent noise disturbance from the impingement of the jet shear layer onto the sharp objects of the model support frame. More details about model, test setup and instrumentation can be found in Boorsma and Schepers.18,23,24
Post-processing and uncertainty
To reduce the enormous amount of acoustic data resulting from the raw time series of the far field microphones, DNW has applied a fast Fourier transform using a block size of 4096 yielding a narrow band frequency resolution of 12.5 Hz. Since the model was initially not designed for aeroacoustic testing, the motor/generator and gearbox appeared to be rather noisy. Unfortunately, this noise over shadowed the aerodynamic rotor noise, which is the subject of research, for all conditions. The background noise caused by the wind tunnel itself was shown to be lower than the model noise for all conditions. The first observation makes it rather difficult to separate rotor noise from the motor/generator/gearbox noise. As such, the results from the farfield noise measurements are not discussed in the current paper.
The array data are processed by DNW using beam forming with the same block size as the farfield microphones. The CLEAN-SC-enhanced beam-forming algorithm 25 has been used to separate the rotor noise from the motor/generator and gearbox noise by defining the scan grid as the outer part of the rotor plane (r/R > 0.7). This way the contamination from the motor noise, which is located in the nacelle about 2 m downwind of the rotor plane, is minimized. Integrating over the scan grid then yields the narrow band and 1/3-Octave band power spectra. The resulting spectra have been corrected for shear layer diffraction of the open jet. A distance correction was employed using the 1/r law. It was found that after transformation of all array results to 0.28 m relative to the scan grid location, the measured sound pressure level (SPL) would equal the sound power level (PWL). Therefore, this distance has been used throughout the processing. Weighting has not been applied. The resulting frequency range resolved by the array spans between 125 Hz and 10,000 Hz, although the spatial resolution in the lower end of the range is regarded insufficient to distinguish noise sources.
It has been shown by former tests at DNW that the absolute accuracy of the sound levels, calculated from the integrated scan areas by enhanced CLEAN-SC beam-forming processing, is about ±3 dB. However, for the relative (delta) accuracy of the sound levels, calculated from the integrated scan areas by enhanced CLEAN-SC beam-forming processing, this figure improves to about ±1.5 dB (or better). More details about the DNW applied post-processing can be found in Philipsen et al. 24
Sectional forces (normal and tangential to the local chord) at the five sections have been obtained by linearly integrating the measured pressure distribution along suction and pressure side. The rotor axial force was determined by decomposing these forces in the axial direction and integrating them linearly over the span from blade root to tip, assuming zero loading at the ends. The axial force coefficient Cdax was obtained by dividing this quantity by the freestream dynamic pressure and rotor disk area.
Test matrix and configurations
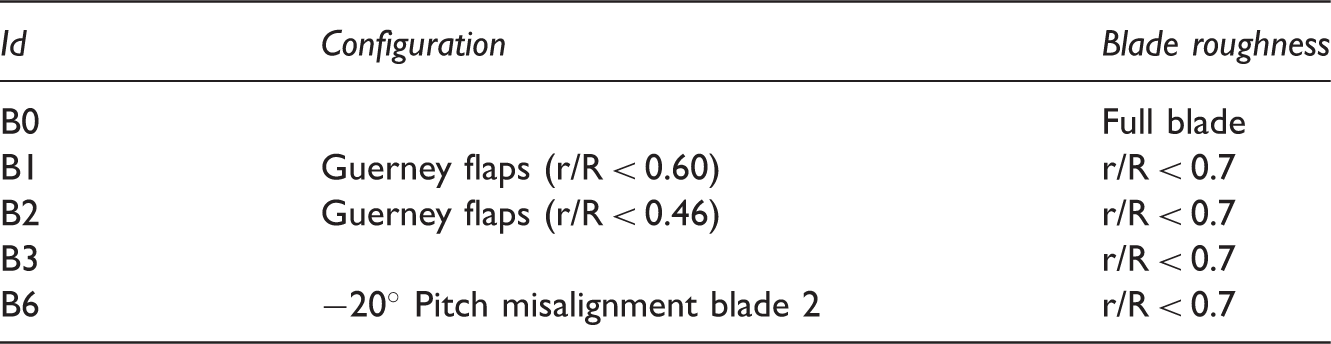
Blade configuration legend for New Mexico.
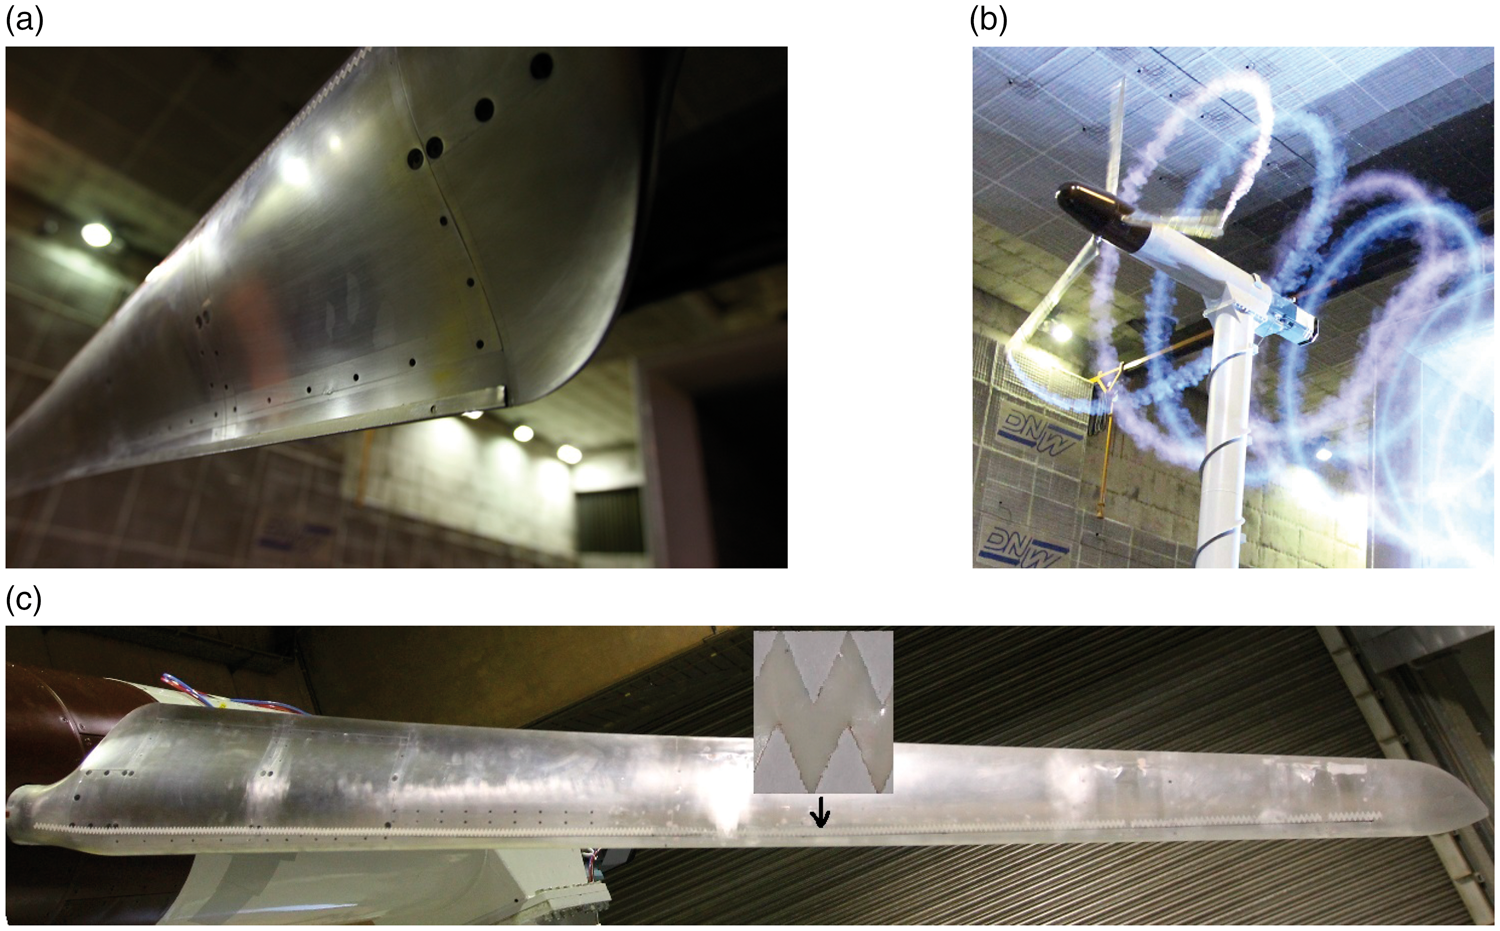
Different New Mexico configurations. (a) Guerney flap, (b) smoke visualization and (c) roughness (zigzag) strips along the full blade span (pressure side) plus inset showing detail.
Next, several blade add-ons were tested out on the turbine. All of them featured a full sweep through the rotating operational regime, just as was performed for the partly clean configuration. Firstly, Guerney flaps were applied to the blades up to 60%R (Figure 3(a)), later they were cut off to extend to 46%R. The Guerney flap consisted of a 0.5 mm thick L-shape strip from thin sheet metal. The shorter side was non-uniform, tailored to the local chord length (2%c or roughly 5 to 3 mm). The longer side was kept to 20 mm and mounted to the pressure side of the blades (aligned with the trailing edge) using adhesive tape.
Inspired by IEC pitch fault load cases, a pitch misalignment run was performed. The pitch angle of blade 2 was reduced by 20° in comparison of the other blades. The rotational speed was limited to 325 r/min to keep the instability due to the aerodynamic imbalance low (the nose cone could be observed to ‘wiggle’ around a bit). A full sweep through the operational regime was performed, featuring the standard pitch angles for blades 1 and 3. In addition to that, lambda sweeps at 15° and 20° (referring to the blades 1 and 3 pitch angle) were performed.
Experimental results
An example of resulting beam-forming plots is given in Figure 4 for the rough and clean blade configuration. The results clearly show the dominance of turbulent boundary layer trailing edge noise at the outboard part of the blade which features the highest incoming flow speeds. Acknowledging the clockwise rotation of the blade, the most noisy part of the revolution is the downgoing motion of the blade in agreement with previous research on this topic.14,26 However, it is noted that the peak is observed slightly before the 3 o’clock position, which is attributed to the off-axis location of the array. As described in the post-processing section above, the scangrid used only considers the last 30% span of the rotor, which results in a sharp transition at this radial position. The fact that the maximum noise levels appear well within this region justifies the approach taken.
Selected beam-forming plots for rough (B0) and partially clean blade configuration (B3), λ = 6.7, 425 r/min, pitch = −2.3°. (a) B0, f = 500 Hz (b) B0, f = 1250 Hz (c) B0, f = 2500 Hz (d) B0, f = 4000 Hz (e) B3, f = 2500 Hz and (f) B3, f = 10,000 Hz.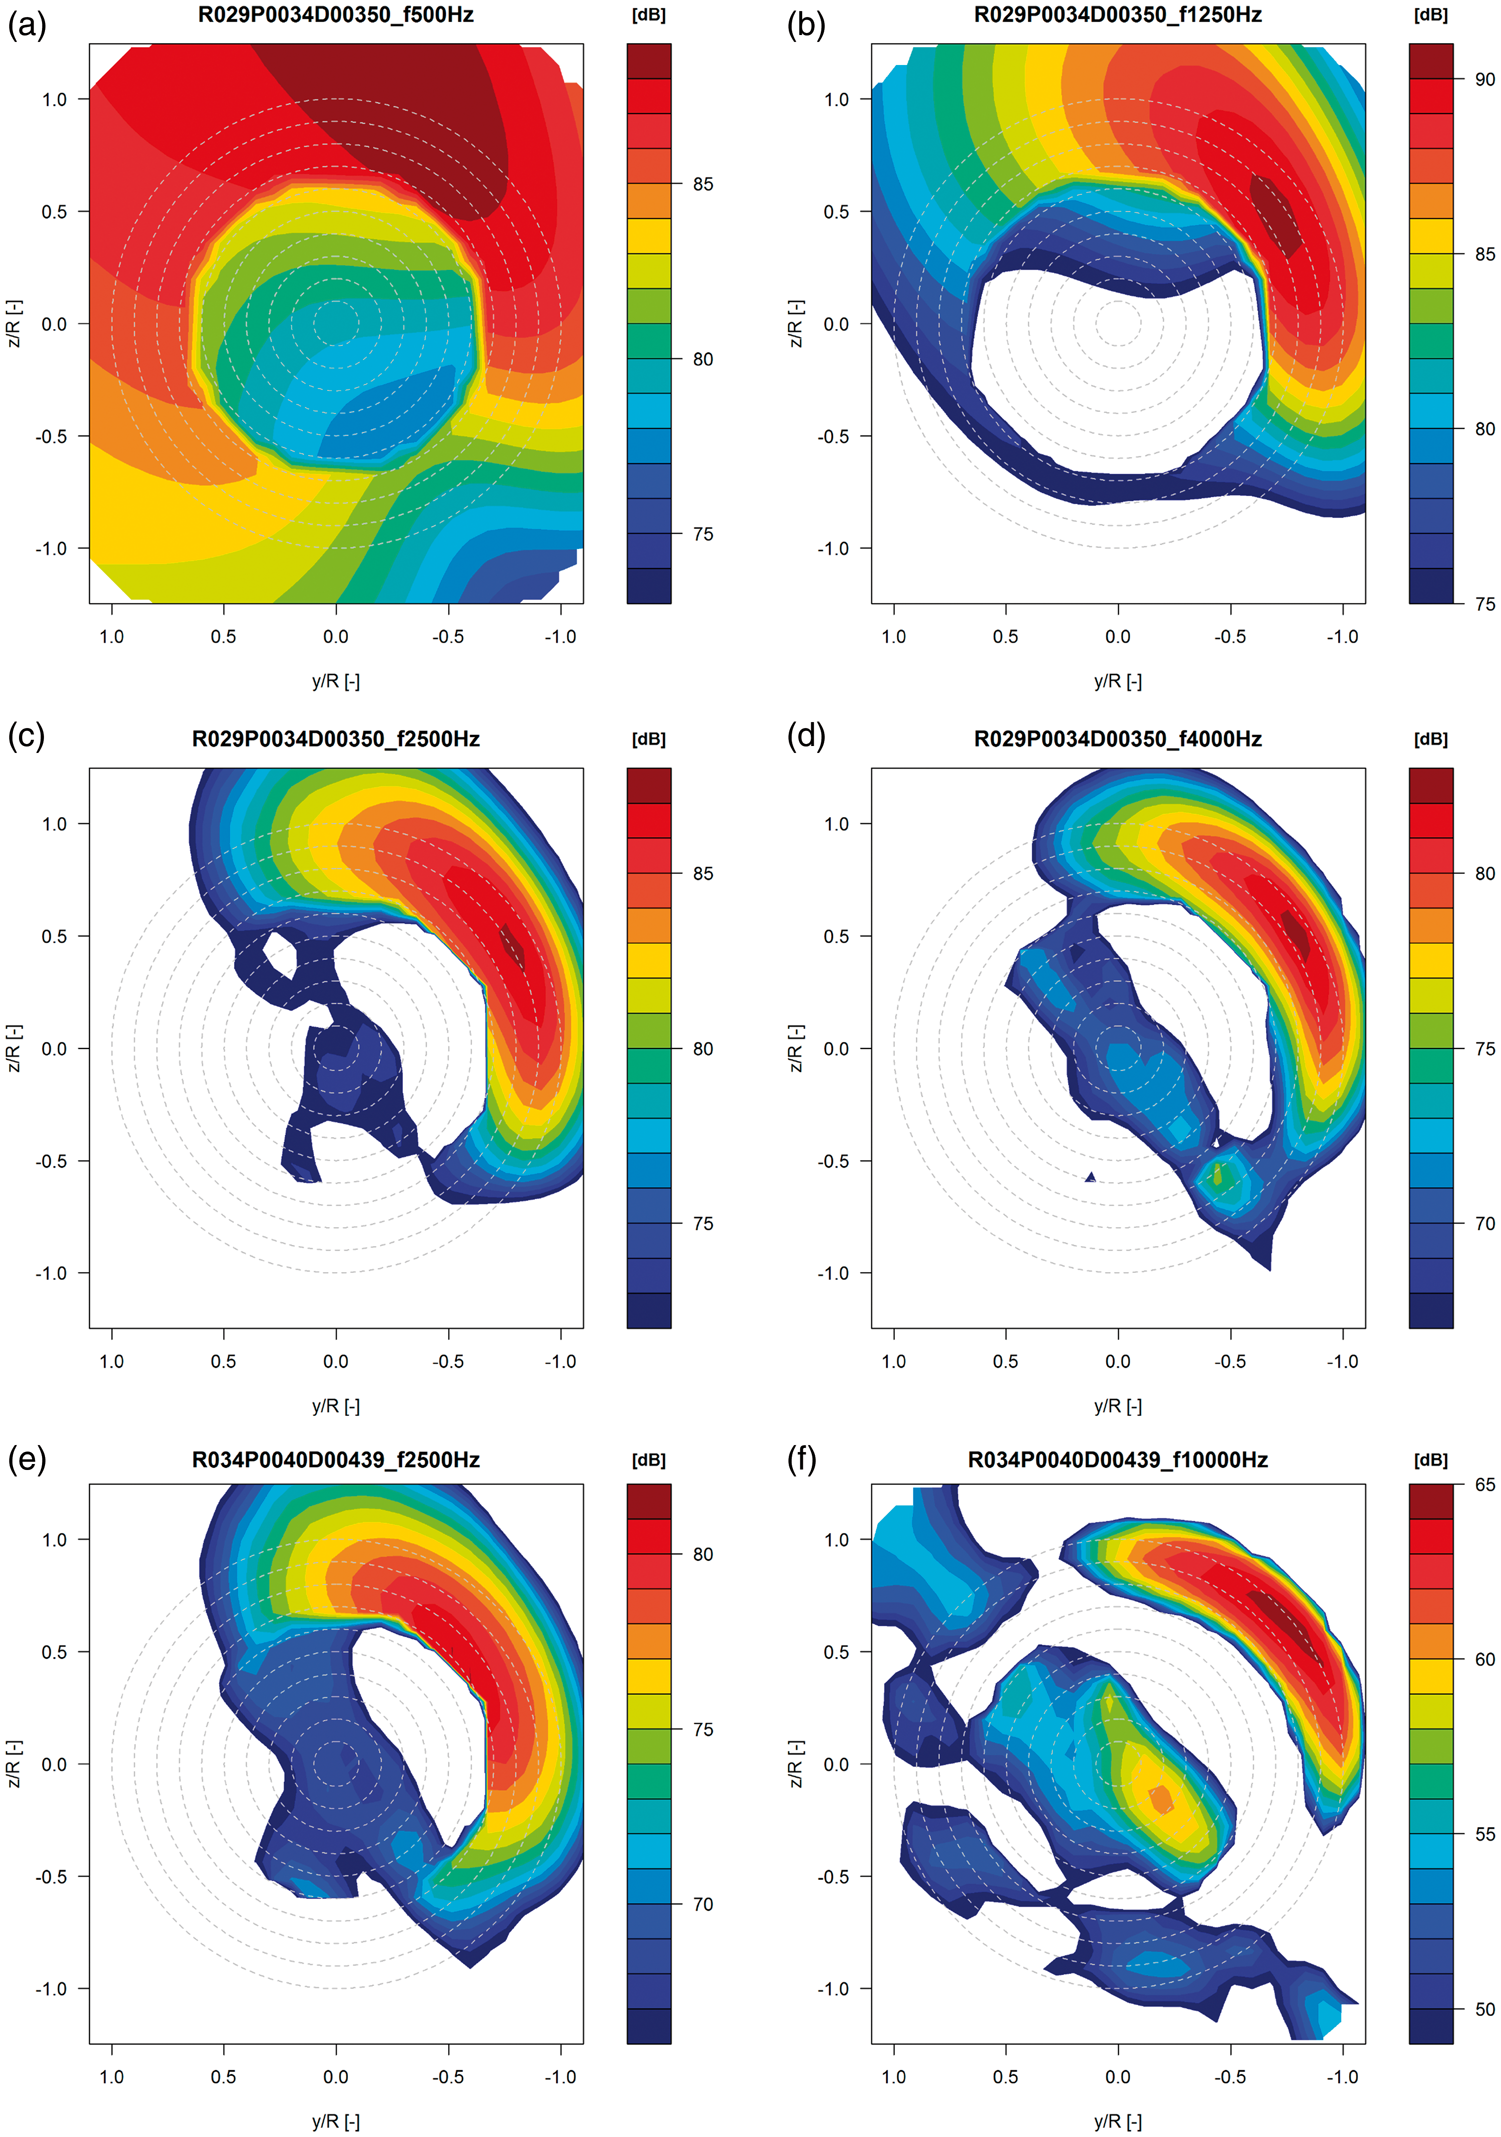
Resulting 1/3-Octave band spectra are depicted in Figure 5(a) for several operational conditions. A haystack-shaped spectrum is observed which is common for this noise source type. A lower tip speed ratio λ will result in a higher angle of attack increasing the noise level but also lower the frequency for which the peak occurs. From these spectra, overall noise levels in terms of overall power watt level (OAPWL) are obtained which can be plotted and compared for a variety of conditions as shown in Figure 5(b). This plot also shows an estimate of the local angle of attack variation with tip speed ratio at the 82%R section. The same variation with tip speed ratio (or local angle of attack) can be observed as was noted from the spectra. The first increase from λ = 9 to 7 could originate from turbulent transition moving forward causing more turbulent conditions at the trailing edge. For lower tip speed ratios, trailing edge separation occurs, rapidly increasing the noise levels even further. See also Figure 2(b) with the corresponding lift and drag polars for the NACA airfoil used in the outboard sections. Some of the operational conditions at −2.3° pitch angle were repeated many times (>5 as illustrated by the clustering of symbols at Noise plots for partially clean configuration B3, 425 r/min. (a) 1/3 Octave band PWL spectra for pitch = −1.3° and (b) OAPWL levels versus tip speed ratio. Local angle of attack (AOA) estimate on secondary horizontal axis for pitch = −2.3°.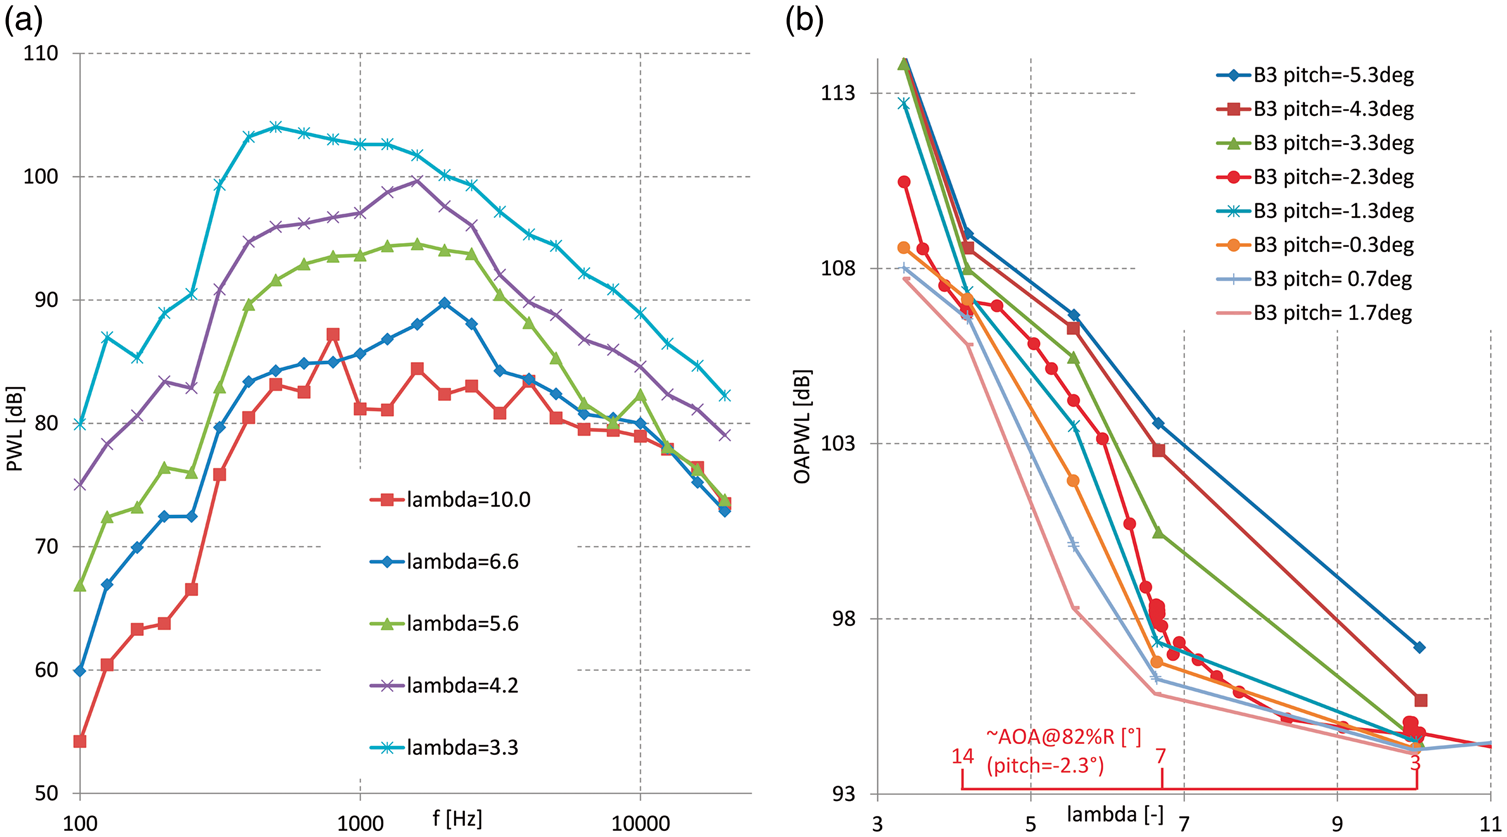
Effect of roughness
The effect of removing the strips from the outboard region is illustrated in Figure 4(e) and 4(f) for two frequencies at design conditions. Comparing to the rough configuration around the spectrum peak frequency (f = 2500 Hz) from Figure 4(c), it is clearly seen that the highest noise levels move further inboard which still has the roughness strips applied. Also, it can be observed that at f = 10,000 Hz, the dominant noise source moves further outboard to the tip again indicating the dominance of tip noise at these high frequencies.
The effect on the noise levels can be observed in Figure 10. For the 425 r/min case, a rather large noise increase due to roughness of about 5 dB is observed above λ = 6.7 in attached flow conditions. The larger than expected increase could be related to the thickness effect of the roughness strip which adds extra to the boundary layer thickness. Because the boundary layer has now already been triggered to a turbulent state and hence transition does not creep up, there is no steep increase in noise levels below λ = 7 as for the partially clean case. For separated flow conditions at very low tip speed ratios, the noise levels converge because at these high angles of attack natural transition occurs prior to the trigger position. Similar differences between partially clean and rough conditions are observed for the other pitch angles.
It was also observed that for partially clean blades, the repeatability of the noise levels for identical operating conditions was not always perfect. For attached flow conditions, differences larger than 1 dB were observed between identical runs which were performed on different days. Although great care was taken to clean the blades each morning, dust particles or similar could have triggered early transition in some cases influencing the noise level. It indicates how sensitive emitted noise levels are to soiling.
Special configurations and conditions
The influence of yawing the turbine on the overall noise levels is shown in Figure 6(a). Small yaw angles up to 15° hardly influence the noise levels. Exceeding this misalignment, which is not very common for regular wind turbine operation, can offset the noise levels to about 4 dB at 45°. Due to the skewed wake and advancing and retreating effect, local angle of attack and apparent velocity at the blade sections vary with azimuth angle, causing fluctuations during a rotor revolution. Combining these effects with the directivity effect changes the azimuth position for which the maximum noise levels are perceived, together with a decrease of the time averaged noise level. This is illustrated by the source plot in Figure 6(b) in comparison of the corresponding plot in axial flow conditions in Figure 4(e). This effect also explains why positive and negative yaw misalignment ±30° result in different perceived noise levels. So although source levels principally are the same between positive and negative yaw, the perceived noise levels on the ground differ due to this effect.
Influence of yawing the turbine for partially clean configuration B3, pitch = −2.3°, 425 r/min. (a) 1/3 Octave band PWL spectra. Local angle of attack estimate on secondary horizontal axis and (b) source plot at f = 2500 Hz for 45° yaw, λ = 6.7.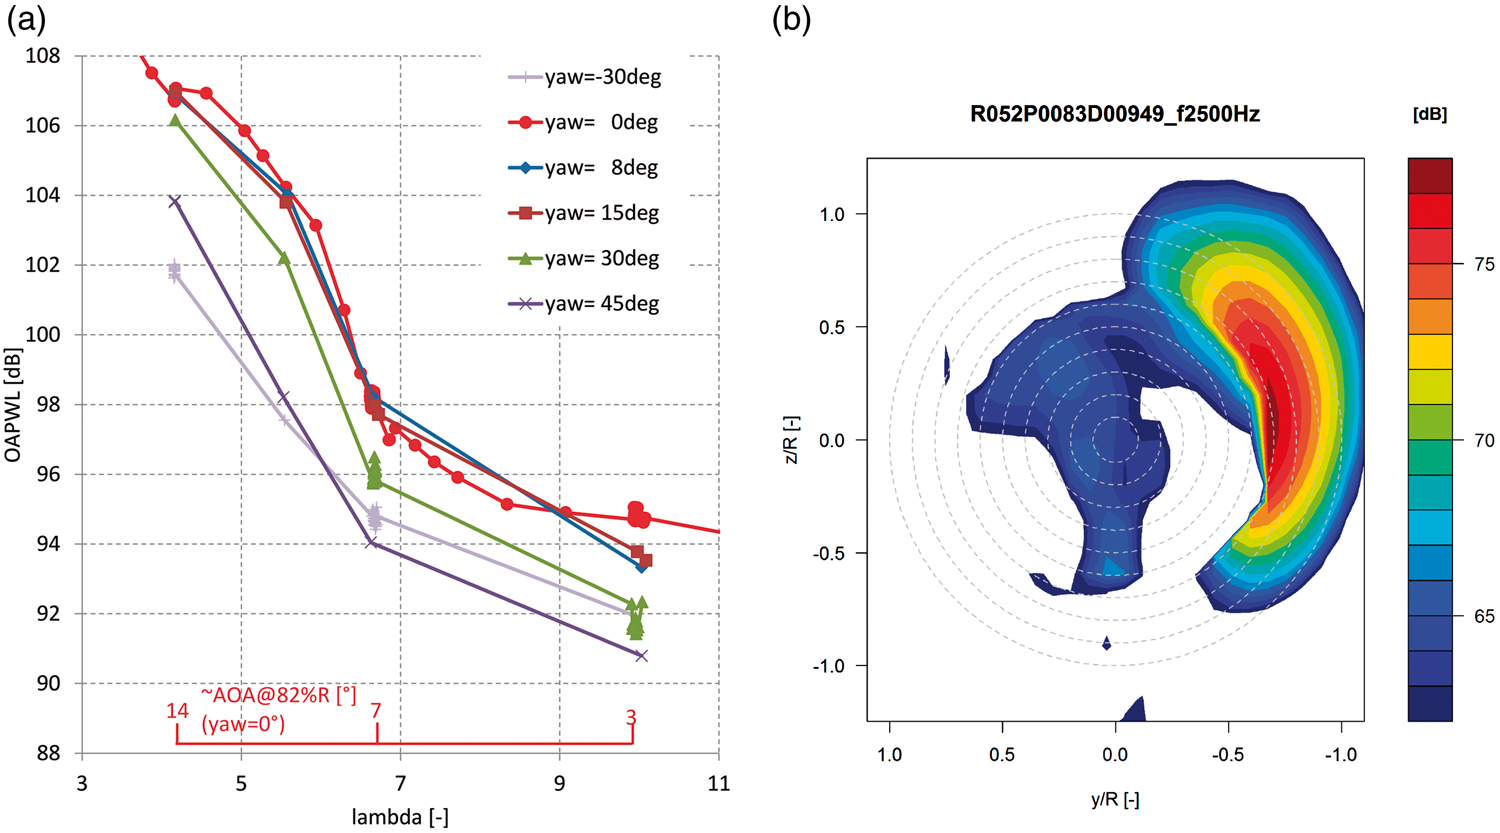
The Guerney flaps were not installed to have an impact on the noise signature, but it is worthwhile to investigate whether a noise penalty exists. As indicated in Table 1, the spanwise extension of the flaps was varied with a short (up to r/R = 0.46) and long configuration (up to r/R = 0.6). As reported previously, a clear benefit in terms of power production was measured for the short configuration together with a change in spanwise load distribution for both configuration.
19
However, the scangrid used for the array processing does not include these radial positions. To this means, a scangrid for evaluating motor noise that does include inboard positions (r/R < 0.7) was analysed. No differences were found between the configurations, most probably due to the dominance of the motor noise. Acknowledging the above, the presented results have to be interpreted with care. Figure 7(a) indicates that extending the flaps to 60%R results in a significant noise increase for tip speed ratios exceeding design conditions ( Influence of the two different Guerney flaps configurations (B1, B2) compared to the reference (B3), pitch = −2.3°, 425 r/min. (a) OAPWL levels versus tip speed ratio and (b) 1/3 Octave band PWL spectra at λ = 10.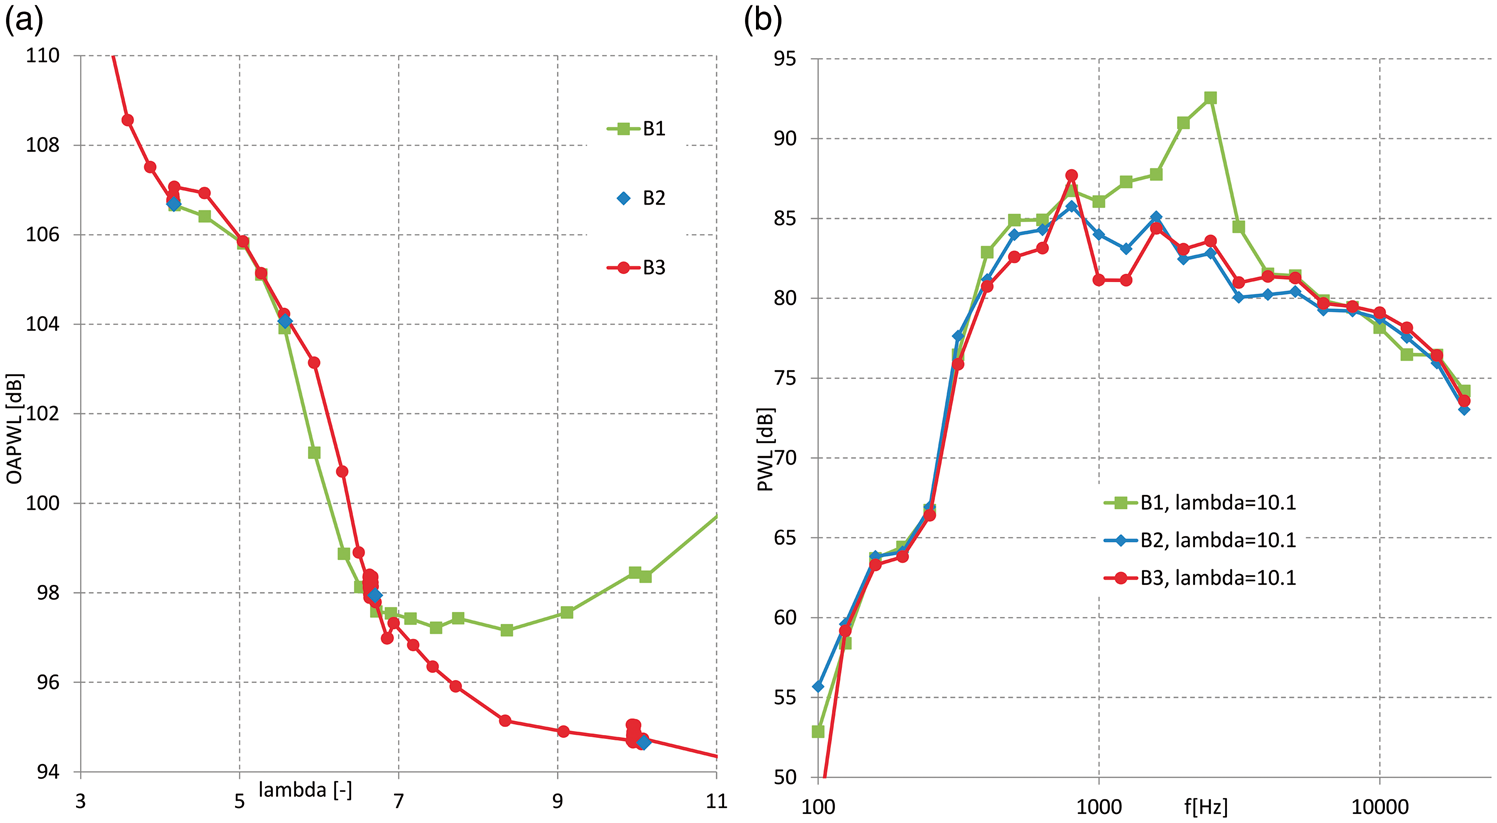
Introducing a pitch misalignment of −20° for blade 2 to mimic a pitch fault condition will result in high angles of attack for this blade. Previous research on the loads in this condition showed, for high tip speed ratios, the blade 2 stalled wake impinging on the following blade 3.22 Figure 8(a) shows that this off-pitching results in a noise increase between 5 to 10 dB, due to the extra separation-stall noise on blade 2. It is noted that the indicated pitch angle in the legend corresponds to the pitch angle on blades 1 and 3. The noise trend with tip speed ratio is different when comparing to the reference due to the fact for the featured tip speed ratios, the angle of attack range covered remains in the separated flow region. Also featured in the plots is a configuration with a large pitch angle of blades 1 and 3 (20°), which results in more conventional angles of attack for blade 2. However, the rather negative angles of attack for blades 1 and 3 at moderate to high tip speed ratios induce stall for these blades together with a noise increase. For low tip speed ratios, angles of attack will increase to operation in the attached flow region for this configuration, which explains the lower noise levels below λ = 7. The corresponding frequency spectra at λ = 6.7 in Figure 8(b) show the peak level to slowly shift to lower frequencies below 1 kHz in case of stalled flow.
Influence of off-setting blade 2 pitch angle with −20° (B6, dashed line) compared to the reference (B3, solid line), 325 r/min. (a) OAPWL levels versus tip speed ratio. Local angle of attack estimate on secondary horizontal axis and (b) 1/3 Octave band PWL spectra at λ = 6.7.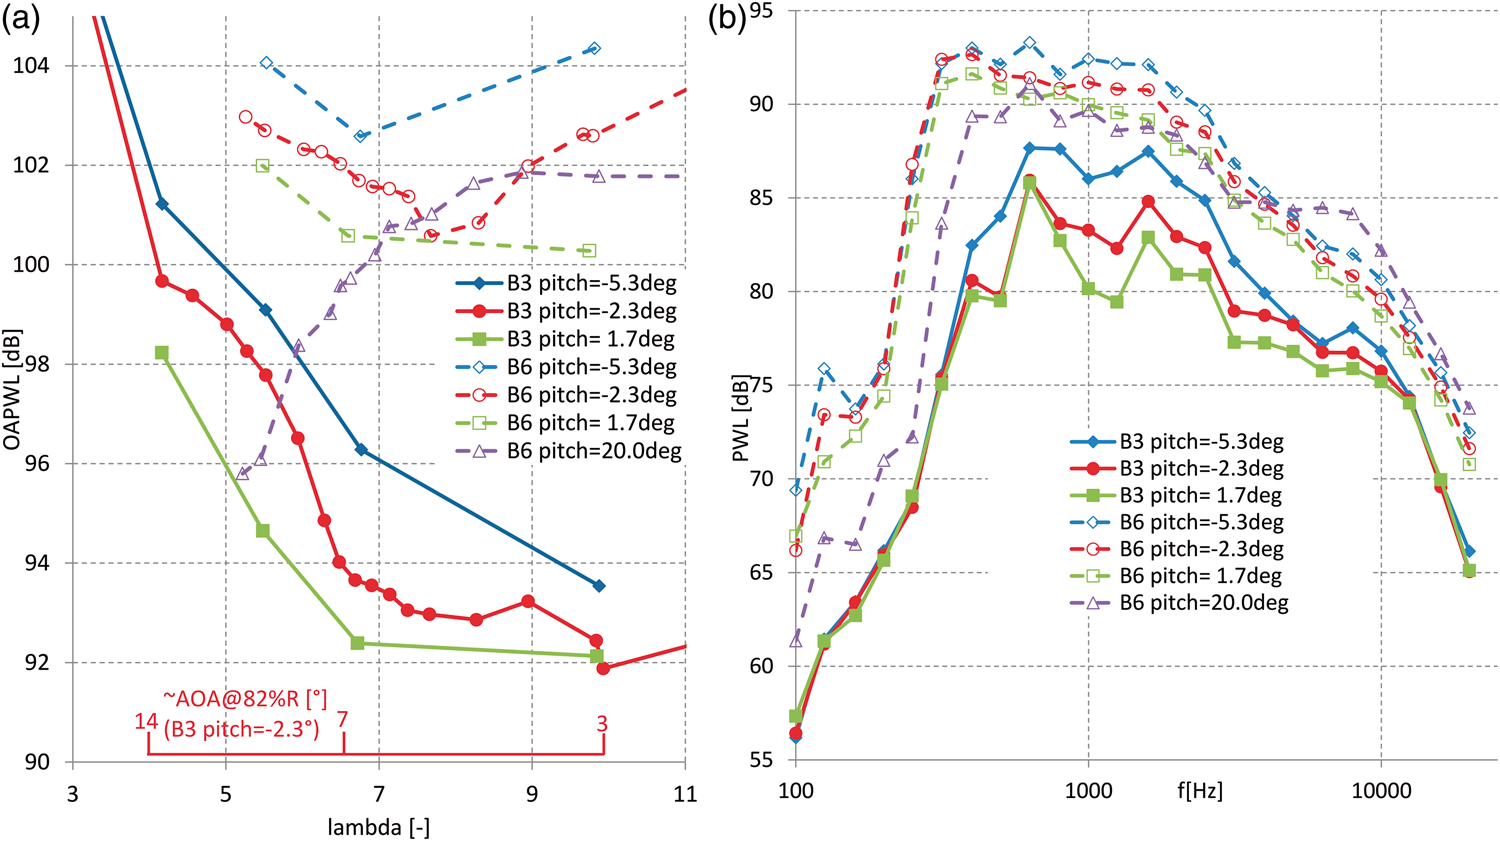
The above results are only a small portion of the available data, as there still is a large amount of data which is untouched. It is recommended to analyse the data using blade tracking as well to analyse sectional noise levels better as a function of azimuth angle. Since the acoustic and aerodynamic measurements were synchronized in the time domain, it is possible to perform cross-correlations between microphone and unsteady pressure sensors.
Comparison of predictions
A comparison has been made to predictions from an engineering model widely used throughout the wind industry. First, the model implementation named Silant is described together with the applied settings. Acknowledging that the noise is driven by the underlying aerodynamics, a comparison of measured and prediction forces is given first, after which the noise levels are studied.
Silant model
Silant originated in 1996 from a Dutch consortium consisting of Stork Product Engineering BV, the Netherlands Organisation for Applied Scientific Research (TNO) and the Dutch Aerospace Laboratory (NLR). The model was designed to calculate noise emission of wind turbines, based on the sources that are considered most important: trailing edge noise (including separation-stall noise) and inflow noise. After ECN became the manager of the tool, several improvements have been made, partly in cooperation with NLR.
Silant divides the rotor blades into a number of segments, usually in the order of 10 to 20 per blade. For each element, the trailing edge and inflow noise source are calculated. For the tip element, the contribution of tip noise is added. To determine the total emission, the element contributions are acoustically summed, assuming the sources to be incoherent.
The BPM turbulent boundary layer trailing edge noise model 10 is implemented to model the first noise source. This model necessitates the input of boundary layer parameters at the trailing edge for both pressure and suction side of the airfoil. In this case, these are obtained from an a priori created database generated by RFOIL, 28 which is based on XFOIL, 29 and essentially is a 2D panel code featuring a viscous inviscid interaction scheme. Airfoil coordinates of the profiles used in the blade serve as input to this code. The roughness strips were mimicked by prescribing the laminar to turbulent transition location. The critical amplification factor needed for transition as used in the underlying en model was set at 9, corresponding to smooth, low turbulence inflow conditions. In addition to the boundary layer variables, this model needs several rotor aerodynamic variables (sectional angle of attack and apparent velocity), which are estimated by a BEM-based code 30 after feeding the operational conditions. Here, the relevant airfoil polars originate from dedicated airfoil wind tunnel tests, with the exception of the midboard RISØ profile. The tip noise model for rounded tips from Brooks et al. 10 is also implemented, where level and spectral content of the tip noise are determined using the spanwise extent of separation at the trailing edge due to the tip vortex. Here, the spanwise extent is estimated using a representative angle of attack in the tip region, obtained from the BEM code.
Although inflow noise due to the interaction of the airfoil with turbulence in the oncoming flow is predicted by Silant, this noise source is discarded from the current comparison due to the low turbulence levels in the tunnel (∼0.2%) and the expected dominance of turbulent boundary layer trailing edge noise. For more details about Silant please consult the relevant publication. 8
Load verification
To assess the validity of the BEM simulations of which the results are used as input to the Silant code, a comparison is made in terms of axial force coefficient Cdax obtained from the pressure sensors for pitch = −2.3° and 425 r/min in Figure 9(a). To prevent differences due to the limited number of sensors, the experimental resolution in spanwise direction is used to obtain the axial force from the simulations. Although the experimental axial force is deduced from the pressures and hence does not include the contribution of friction, this was previously demonstrated to affect axial force less than 1%.
2
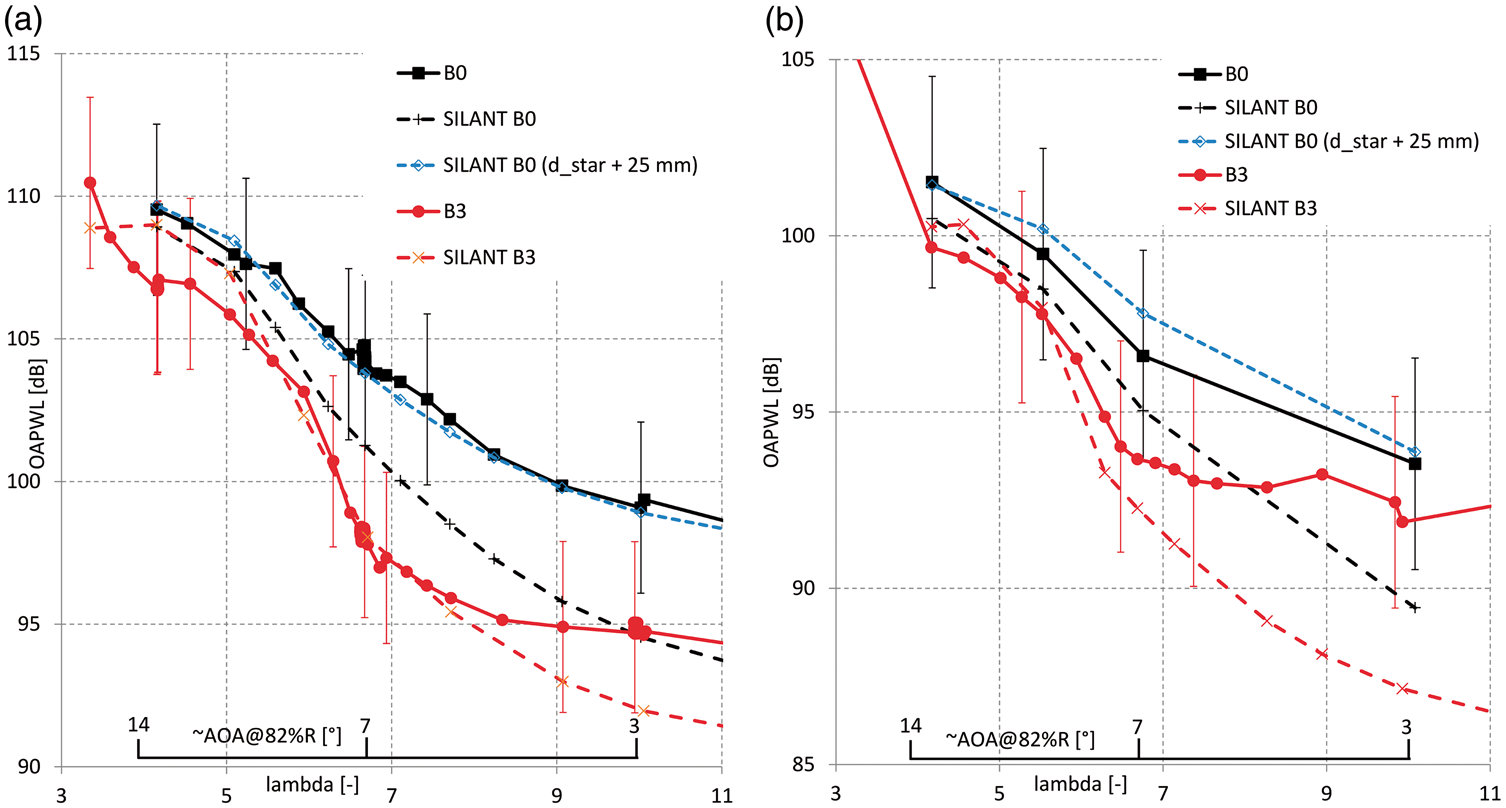
The agreement is quite good for a variety of operational conditions, although results seem to slightly diverge for high tip speed ratios towards the turbulent wake state. It is noted here that these conditions feature relatively low tunnel speeds and consequently low dynamic pressures utilizing only a small fraction of the measurement range (plus the fact that absolute differences are non-dimensionalized with a lower velocity enlarging differences in Cdax). Because a good agreement in axial force can also be a result of compensating errors along the blade span and since the outboard part of the blade is mostly responsible for the noise, a comparison of chord normal force at 82%R is given in Figure 6. Except for the kink due to stall just below λ = 6, the trend is well captured. The smooth stall characteristics from the measured two-dimensional polars that were used as input to the predictions (Figure 2(b)) are apparently different from the more abrupt stall encountered in the rotating experiment. Because the loading in the inboard stations is underpredicted in stalled conditions ( Comparison of predicted loads (dashed) at pitch = −2.3° and 425 r/min for partially clean (B3) and rough configuration (B0). (a) Axial force coefficient and (b) normal force at 82%R. Local angle of attack estimate on secondary horizontal axis. Comparison of predicted OAPWL (dashed) at two different rotational speeds for partially clean (B3) and rough configuration (B0), pitch = −2.3°. A local angle of attack estimate is given on a secondary horizontal axis. Error bars give an indication of the absolute uncertainty of the measurements. (a) 425 r/min and (b) 325 r/min.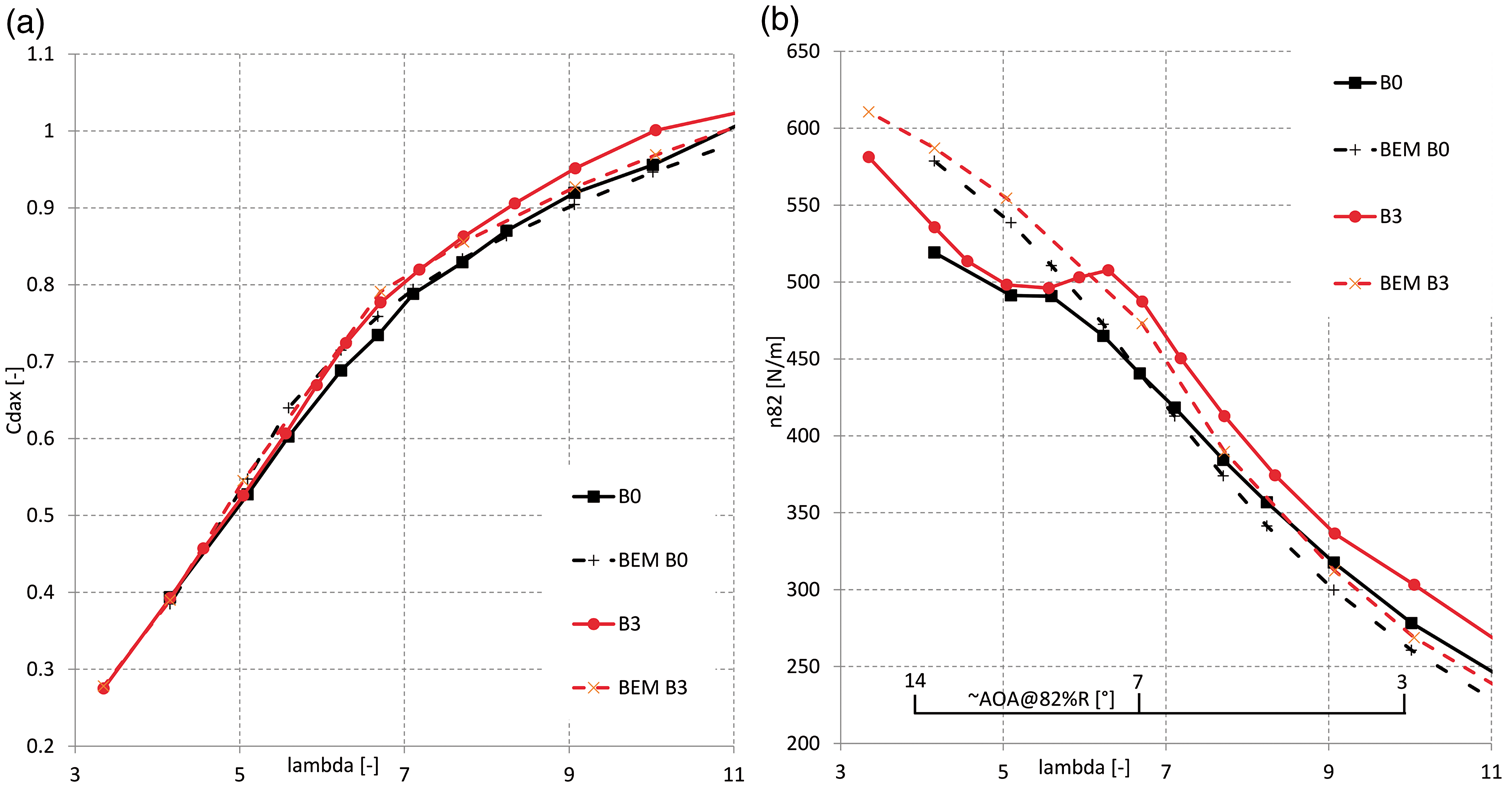
Noise validation
The comparison of predicted noise levels to the measurements is shown in Figure 10 for the two different rotational speeds, while a selection of underlying spectra at 425 r/min is given in Figure 11. For the clean configuration, the agreement is within 1 dB below λ = 7. The implemented switch to separation-stall noise seems to yields a good agreement for low tip speed ratios. However, the measured sharp noise increase trend towards λ = 3 in massively separated flow is not captured by the calculations. For higher tip speed ratios, the results seem to diverge slightly, similar to what was shown for the loads. Hence, the question that can be asked is whether this discrepancy arises from a shortcoming of the BPM model or the aerodynamic input to this model. The scaling of the noise between the two different rotational (or tip) speeds is well predicted by the code, confirming the validity of the underlying model for this purpose. The underlying spectra in Figure 11 show a surprisingly good agreement. The maximum levels and their corresponding frequency are well approximated, and the shape agreement is also fair. Generally speaking the measured peaks are slightly more broad than the predictions.
Comparison of predicted spectra (dashed) for partially clean (B0) and rough conditions (B3), pitch = −2.3°, 425 r/min (a) rough configuration B0 (b) partly clean configuration B3.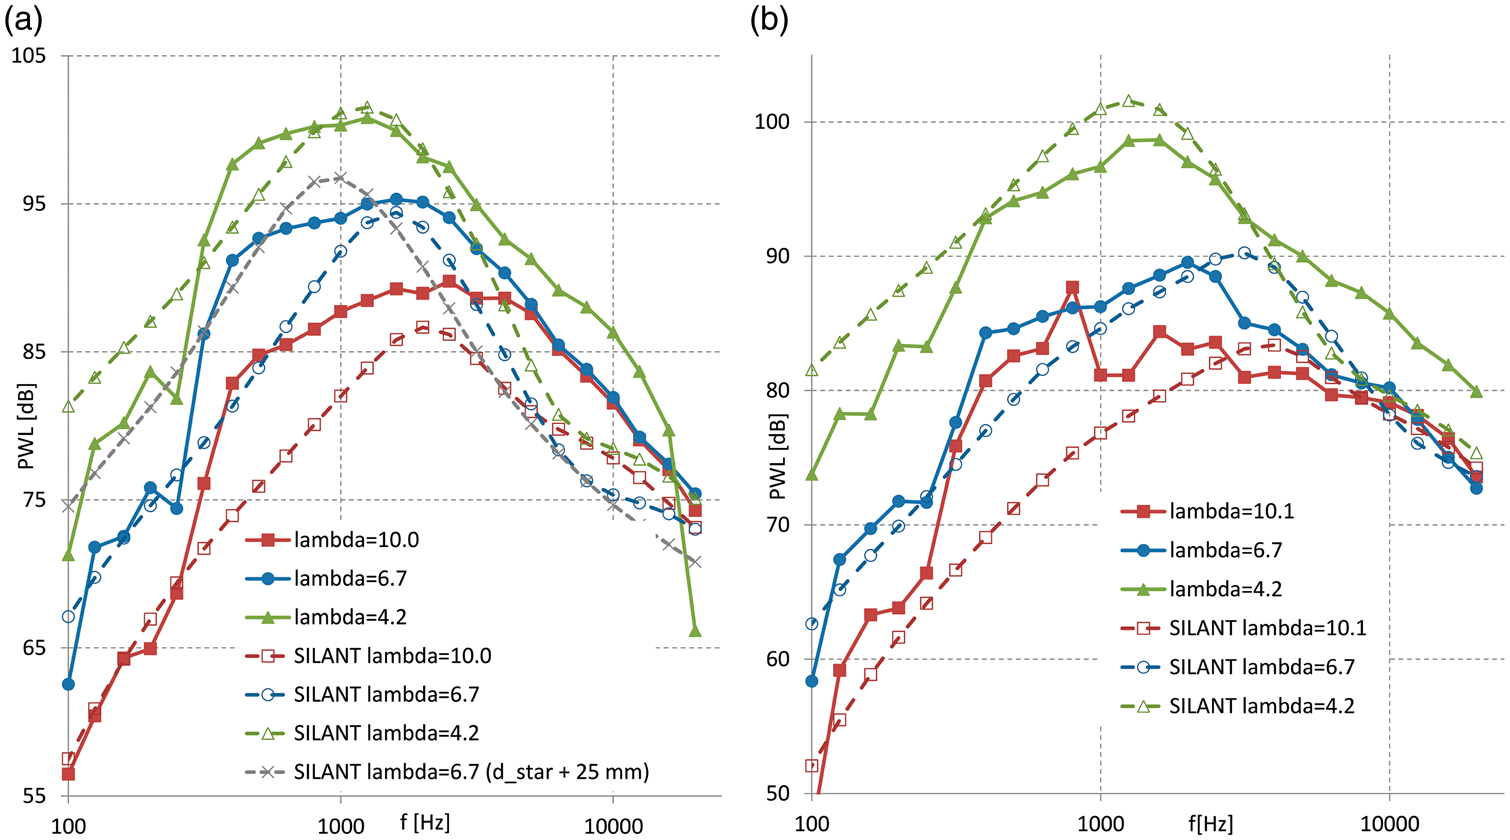
The effect of the roughness strip on the noise appears to be underestimated by the predictions. In addition to enforcing laminar to turbulent transition, turbulators have a finite thickness which is known to induce an increase in boundary layer thickness. This thickness effect is not modeled in the RFOIL code which was used to create the airfoil database. Possibly this effect is responsible for the larger discrepancy between measured and predicted noise levels for the rough configuration. To attempt to mimic this effect, the boundary layer thickness database of the NACA profile was manipulated with a constant offset for both the pressure and suction side. Figure 10 shows that for an increase in trailing edge boundary layer displacement thickness of 25 mm, the predicted noise levels come closer to the measurements, especially for the 425 r/min case. However, the corresponding spectrum at λ = 6.7 in Figure 11(a) shows the underlying physics are far from modeled correctly, illustrated by the discrepancy in peak frequency and spectral shape. More investigation is necessary to verify to what extent this is a shortcoming of the underlying acoustic model or the incorrect input given to it.
Conclusions
Wind turbine noise measurements have successfully been performed in the wind tunnel for a variety of operational conditions and model configurations. The rule of thumb stating that per degree of pitch angle increase the noise roughly reduces with 1 dB was assessed. Addition of roughness by means of zigzag strips increased the overall noise levels up to 5 dB for the experiment under investigation. Yawing the turbine is found to significantly decrease the perceived noise levels at the array position above 15° misalignment. The influence of various configurations on the noise signature has been assessed.
For the standard blade configuration (clean blade in the outboard region), the predictions of the BPM model were found to agree well within the specified uncertainty band of the experiment. Generally speaking trends are well captured. An excellent agreement in overall noise levels was obtained for design conditions. For off-design conditions such as cases in the turbulent wake state and cases with large portions of separated flow (high and low tip speed ratio), larger discrepancies can be observed. Here, it must be stated that the BPM model is dependent on the accuracy of the inputted airfoil data and rotor aerodynamic state.
Footnotes
Acknowledgements
Hermann Holthusen (DNW) is acknowledged for data reduction of the raw time series into beam-forming plots and resulting spectra plus the corresponding explanations. The IEA Wind Executive Committee is acknowledged for enabling the valuable cooperation within IEA Wind Task 29 Mexnext. The support of the steering committee (Delft University of Technology, Technion Israel Institute of Technology and DTU Technical University of Denmark), which advised during the preparation of the tunnel test, was greatly appreciated.
Declaration of conflicting interests
The author(s) declared no potential conflicts of interest with respect to the research, authorship, and/or publication of this article.
Funding
The author(s) disclosed receipt of the following financial support for the research, authorship, and/or publication of this article: Financial support for this experiment was given in part by the EU INNWIND project. In addition to that the European ESWIRP project has been responsible for sponsoring the tunnel time in the DNW.