



Abstract
This paper presents a numerical study of the acoustic shielding of aeroengine noise by the aircraft structure. More specifically, the engines considered are contra-rotating open rotors in pusher mode which are installed at the rear of the aircraft. Several empennage designs and engine positions are evaluated. An original method for the calculation of engine noise installation effects is presented and its application to contra-rotating open rotor propulsion is demonstrated. It is based on the weak coupling between computational fluid dynamics, an integral method based on Lighthill’s analogy for the calculation of acoustic radiation, and on a boundary element method for the calculation of the acoustic diffraction by the aircraft fuselage and empennage. The prediction of a pylon-installed (isolated) contra-rotating open rotor noise directivity is presented and compared to equivalent wind-tunnel measurements. In both cases, the simulation and experiment are performed at 1:7 scale. In addition, the installation effect of the wind-tunnel, being non-anechoic, is also assessed with the numerical approach presented. Finally, for each aircraft configuration of interest, equipped with two rear contra-rotating open rotors, the predicted noise impact on the ground is evaluated. Of these, the contra-rotating open rotor mounted above an L-tail empennage is found to be the most beneficial configuration in terms of acoustic shielding.
Introduction
The contra-rotating open rotor (CROR) technology offers fuel burn reduction and is seen as a good alternative to turbofan engines for the propulsion of future low to medium range aircrafts. Nonetheless, the noise impact of this technology needs to be acceptable if it is to be adopted commercially. Several approaches can be taken to reduce their noise output. Most studies focus on CROR noise sources. For instance, among numerous works, some experimental,1–3 numerical4,5 and modelling6,7 works on isolated CROR aim to improve the understanding of the noise generation mechanisms and the accuracy of their noise prediction. Some studies also include the mitigation of CROR noise by modifying the flow generating the aeroacoustic sources. For instance, pylon blowing has been widely studied.8–10 However, very few studies have considered the shielding of the acoustic radiation of CRORs. Recent wind-tunnel tests by Guo and Thomas, 11 measured the acoustic benefit of locating a CROR above a wing body. Several works also focus on the acoustic prediction of CROR noise scattering by the aircraft fuselage. McAlpine and Kingan 12 developed a theoretical model to predict noise levels of an installed open rotor where the noise sources and adjacent fuselage are represented by a distribution of rotating sources and a rigid cylinder, respectively. They showed how the location of the rotor with respect to the fuselage strongly impacted the diffracted far-field noise. Lummer et al. 13 developed an analytical model for the loading noise of CRORs and applied it in boundary element method/fast multipole method (BEM/FMM) shielding calculations to demonstrate the capability of this approach in computing the acoustic effect of CROR installation on aircraft. In the current work, a similar approach is developed since the calculation of acoustic shielding relies on BEM. The incident field from the CROR noise source is obtained from a Ffowcs-Williams and Hawkings (FW-H) integral method (IM) calculation based on unsteady computational fluid dynamics (CFD) data.
The potential benefit of being able to evaluate CROR installation effects on far-field acoustic noise levels is being able to design aircraft architectures that can reduce environmental noise. This topic has been addressed by the Wind tunnel tests for the Evaluation of the installation effects of Noise EMission of an Open Rotor advanced regional aircraft (WENEMOR) project. 14 Many CROR installation configurations on a 1/7th scale model aircraft were tested in the Pininfarina wind tunnel (Turin, Italy). Included in the parametric analysis were the evaluation of both pusher and tractor modes, several empennage geometries as well as the pylon length and their azimuthal orientation.
The present work focuses on a numerical approach for the acoustic calculation of CROR integration on regional aircraft. The selected configurations are extracted from the WENEMOR project: specifically CROR pusher mode in take-off conditions and all calculations are restricted to tonal noise. The objective of the paper is twofold: (i) to demonstrate the capability of the presented numerical approach to compute the acoustic installation effect of CRORs integrated on aircraft and (ii) to highlight the acoustic benefit offered by some of the configurations studied.
The paper is organized as follows. Initially, the scale aircraft architectures and CROR model addressed by the current work is presented. Then, the numerical approach for the calculation of the installation effects is described and a focus on the CFD simulation of the CROR is made. The CROR noise is firstly analysed in terms of directivity and secondly compared to the WENEMOR measurements. Given that the latter comparison shows a qualitative agreement but underestimation of the measured levels, the comparison is improved by taking into account the installation effect of the wind-tunnel test section. The final section is dedicated to the computed installation effects of the various configurations, in particular with different empennage shapes. The most beneficial configuration in terms of acoustic shielding is detailed.
Aircraft architectures and CROR model
The WENEMOR project aimed at testing many potential configurations of CROR integration on a regional aircraft. More details about this project can be found in Bennett et al.
14
The numerical work presented here details some WENEMOR configurations of CRORs in pusher mode; among them, several parameters in the architecture of the aircraft rear are modified from one configuration to another, as described in Figure 1. The main parameter is the location of the control surfaces of the tail which define the empennage design. Several designs are tested, namely the T-tail, L-tail and U-tail configurations. In addition, changes to both the pylon length and the pylon’s azimuthal angle are examined. The test matrix is presented in Table 1. The PS-A engine configuration is tested with the T-tail, as is the PS-C1 engine configuration whose pylon is longer by 0.6 D. D is the propeller diameter. The PS-E engine configuration is tested on each of the tails, which in addition to also having a pylon which is 0.6 D longer than that of PS-A, has a 27° (upward) pylon rotation compared to PS-A. The positions of the horizontal and vertical control surfaces are slightly shifted between the three configurations as can be seen in Figure 2.
Some of the contra-rotating open rotor pusher mode configurations tested in Wind tunnel tests for the Evaluation of the installation effects of Noise EMission of an Open Rotor advanced regional aircraft. Numerical test matrix. Top view of three different empennage configurations. (a) PS-A_T-Tail: T-tail shape with contra-rotating open rotor (CROR) in PS-A position. (b) PS-E_L-Tail: L-tail shape with CROR in PS-E position. (c) PS-E_U-Tail: U-tail shape with CROR in PS-E position.


Contra-rotating open rotor model characteristics and selected operating conditions.

Figure 3 shows the upstream view of the 1:7th scale model of CROR installed on a pylon in pusher configuration. The origin of the wind tunnel coordinate system is referenced from the centre width of the open jet nozzle exit plane. Eret et al.
15
have analysed the noise measurements of this CROR model for several configurations including various angles of incidence and flow velocities. In the current study, no flow incidence is considered. The acoustic calculations of the isolated CROR presented below, with and without inclusion of the wind-tunnel installation effect, will subsequently be compared to the wind-tunnel measurements. The calculation of the CROR installed configurations presented at the end of the paper is also conducted at the reduced model scale and zero angle of attack. The assessment of the noise impact due to scale reducing is not addressed in the present work.
Isolated contra-rotating open rotor model in Pininfarina wind tunnel.
Installation effect calculation
A complete knowledge of an engine’s integration onto an aircraft requires an evaluation of the acoustic installation effect regardless of the engine type. The BEM can take into account complex geometries such as an aircraft empennage. Its computational cost is proportional to the third power of the frequency of the acoustic source. As long as the dominant frequencies of the engine noise are not too high, the BEM method has an affordable cost. For instance, in the case of the present CROR, the ratio between a typical acoustic wavelength – corresponding to the highest selected frequency – and geometric length, is about 0.02 which is acceptable for computation cost.
In the general approach for the acoustic calculation of engine integration onto aircraft, the engine acoustic source is assumed to be isolated from the scattering aircraft surface and its acoustic emission to be known. The BEM computes the pressure scattered by the aircraft surface from the incident field. This method is applied to CRORs as described by Figure 4. The incident acoustic field is computed with a FW-H surface IM
16
applied to the blade pressure fluctuations computed by CFD. The incident and scattered field are summed in phase in the final step.
Principles of the acoustic scattering calculation with a contra-rotating open rotor.
The delimitation between the acoustic source surface and the scattering surface is difficult to define for the case of an engine installed close to the fuselage with a short pylon. The blades mainly contribute to the noise emission but, to some extent, the hub also contributes, increasing the total noise. Thus, it can be included in the source surface along which the FW-H integration is achieved. The pylon theoretically scatters the noise from the propellers in addition to the fuselage, but it also induces a significant distortion in the flow seen by the blades in particular that of the front row, therefore it modifies the acoustic sources. The choice is made to consider the pylon and nacelle only as an aerodynamic installation effect whose effects on the acoustics are taken into account by the hub and blades which are delimited as the only acoustic sources. In addition, the aerodynamic effect of the fuselage and wings, for instance the flow deviation by the wing, is neglected and the CROR flow simulation is based on a pylon of infinite length. Thus, the skin of the aircraft – excluding the pylon and nacelle – is only considered as a scattering surface. The resulting delimitation in the computation between the components of the aircraft structure is highlighted in Figure 2. One can distinguish (i) the hub and blades with pressure contours, that is the acoustic sources, (ii) the pylon and nacelle in bright colour and (iii) the empennage in dark colour, that is part of the scattering surface with the rest of the aircraft.
Computational fluid dynamics
The objective of the CFD is to compute the aeroacoustic sources of the propellers. The unsteady Reynolds-averaged Navier–Stokes simulation (URANS) is suitable for the calculation of the unsteady flow of propellers. In the present work, it is achieved with CIRA’s multi-block structured solver U-ZEN,17,18 using the k-ω TNT turbulence model.
19
Front and rear propeller meshes rotate in opposite directions and the resulting non-conformal interface (sliding mesh) is updated at each time step. Figure 5 exhibits the coarse mesh (about 900,000 cells in the computation domain) initially used for the computation of the CROR with pylon. A finer mesh (about 7 million cells) was subsequently used for the CFD of the CROR and the outputs were used as input to the acoustic computations described in the following paragraph. These computations are part of a larger CFD study investigating the influence of rotational speed and incidence. In this latter study, an additional refinement generated a 66 million cells mesh for validation purpose. This very fine mesh has been computed on a slightly different case (2949 r/min, M = 0.1, incidence of 6°) and the aerodynamic results have been compared to the results produced by the two coarser meshes. It has been concluded that the 7 million cells mesh is convenient for this case and it has been inferred that the 7 million cells mesh is convenient too for the present case. In the present CFD simulation, 64 time steps per blade passing period are computed which corresponds to an angular time step of 0.46875°. The highest frequency studied in the current work is the fourth blade passing frequency, the resolution of higher frequencies being found to be too low, that is less than 16 time steps per period.
Surface coarse mesh for the unsteady Reynolds-averaged Navier–Stokes simulation computation of the contra-rotating open rotor.
Figure 6 shows the blade thrust coefficient of each propeller and its Fourier transform. The effect of the pylon wake on the thrust is obvious on the front blade with the sudden increase of thrust whereas it is minimal on the rear blade which is much more affected by the front propeller wake as the double maxima pattern, duplicated 2*B times, illustrates. These two maxima are related to the specificity of the blade geometry. In contrast, the potential effect of the rear propeller on the front propeller is very weak. These two observations are confirmed by the harmonic analysis. For the 2*B harmonic, the thrust coefficient levels are significantly increased on the rear blade whereas they hardly increase on the front blade. The high levels of the multiples of the 2*B harmonic suggest that the interaction tones noise could be significant as we will see in the paragraph dedicated to the CROR noise analysis.
Thrust coefficient of propeller blades during a round period (left) and its Fourier transform (right).
FW-H surface IM
In the present study, we consider the CROR in take-off conditions. The axial flow Mach number (see Table 2) and rotational tip Mach number are largely subsonic. Thus, it is assumed that the loading noise dominates the CROR noise whereas the quadrupole sources in the wake are not significant since they are generally associated with transonic phenomena. 20 The noise sources are mostly characterized by dipoles on the blades. Therefore, the FW-H IM using the blade pressure fluctuations is adapted to compute the CROR noise emission. The noise computations are performed by solving the FW-H equation in the time domain with ONERA’s code KIM21,22 and a Fast Fourier Transform (FFT) is applied to the acoustic signatures to provide the emitted pressure in the frequency domain.
Boundary element method
The last computational step is to solve a scattering problem where the aircraft is the obstacle and the CROR is the source. In the present case, the low flow speed (28 m/s) and the viscous effect of the fluid are neglected so that the scattering problem assumes an infinite space of an inviscid fluid at rest in which an acoustic source and a scattering surface lie. Rapid numerical methods (BEM) for solving the Helmholtz equation in the presence of arbitrary geometries (the scattering effect) are based on mathematical approximations of an interaction matrix, representative of a perturbed linear system applied to these surfaces. ONERA’s in-house BEMUSE code 23 solves this system using either a Brakhage–Werner 24 or Burton–Miller 25 integral formulation. The Sommerfeld radiation condition applies at infinity and the scattering surface defines the boundary conditions which can be, for instance, Neumann, Dirichlet or Robin. These elements are coupled with an algebraic approach of the kernel approximation (inverse matrix) based on the adaptive cross approximation (ACA) method. The method implemented follows the work of Grasedyck 26 on asymptotically smooth kernel operators, initially introduced by Bebendorf. 27 It computes a low-rank approximation of appropriate matrix blocks, independent of the kernel operator. The size of the final matrix to be solved, within the above considerations, is largely diminished from an N2 to an N*log(N) order.
CROR noise analysis
Dominating harmonics of the contra-rotating propellers
The semi-analytical model of counter-rotating propellers noise proposed by Hanson,
28
offers an insight into the parameters controlling the efficiency of the noise emitted in the general case of two contra-rotating propellers with B1 and B2 blade numbers and Ω1 and Ω2 rotational speeds. It can be applied to the distortion case of a pylon in front of a single propeller, that is B1 = 1 and Ω1 = 0, but we prefer stressing the particular case of the current propellers defined by an equal blade number, B, and rotational speed, Ω, and highlighting the resulting dominating harmonics. Generally speaking, the harmonic noise from a propeller – either the front one or the rear one in the following – is theoretically composed of an infinity of sound harmonics m, to which an infinity of load harmonics k contribute. But only a small number of pairs (m, k) are associated with an efficient contribution to the noise emission. From the noise formula proposed by Hanson,
28
one can relate the acoustic pressure p emitted by a rotor at distance r from the centre of the CROR to be

Ar takes into account the relative mach number, offset and sweep of the blade section
Ak takes into account the kth drag and lift harmonic coefficients, for example the loading sources
MT and Mx are the blade tip rotational Mach number and axial Mach number, respectively
ϕ and θ are observer angles
The Bessel function term significantly controls the efficiency of the contribution of the harmonic (m, k). Bessel functions Jn(x) decay rapidly for |x| < |n|. As suggested by Hanson,
28
we can define a low-efficiency criterion for the sound radiated at θ = 90° from the blade tip, that is z0 = 1, which states

This low-efficiency criterion underlines the corollary stating that the efficiency is high if m = 2 k. This corresponds to the Bessel function of order zero. Generally, the zero-order Bessel functions dominate the other orders whatever the directivity θ and radius z0 are therefore one can expect that even harmonics dominate the CROR noise emission. In addition, J0(x) is maximum for x = 0, for example θ = 0 or θ = π. In other words, acoustic output tends to be greatest along the axis of the CROR.
Computed noise directivity of the isolated CROR with pylon
We now move on to the FW-H acoustic calculation based on the blade pressure fluctuations extracted from the CFD of the isolated CROR with pylon. Figure 7 shows the computed directivity of the CROR noise. In the pylon plane, the 2*BPF and 4*BPF dominate with maxima located along the CROR axis. Correlating the previous analysis based on Hanson’s model, one can identify the first and second even sound harmonics corresponding to the interaction tones BPF1 + BPF2 and 2*BPF1 + 2*BPF2, respectively. In the following, we keep the frequency denomination n*BPF for the interaction tones. Along the mid-propeller plane, the 2*BPF dominates at almost all angles. The high levels of the BPF in both planes are related to the impact of the pylon wake on the front propeller. Globally, the noise directivity of the CROR is more complex and only two specific trends are noticeable for this case where B1 = B2: (i) noise is maximum towards the flow axis and (ii) the 2*BPF tone dominates.
Acoustic directivity of the isolated contra-rotating open rotor with pylon. (a) Mid-propeller plane. (b) Pylon plane. SPL: sound pressure level; BPF: blade passing frequency.
CROR noise assessment
Comparison with WENEMOR windtunnel measurements
Several microphones arrays were used during the WENEMOR test campaign (see Bennett et al.
14
for more details). Two of them, depicted in Figure 8, have been selected for the comparison with the computations. Closer to the CROR is the moveable near-field array located at 1.5 D off the model centre. The near-field array consisted of five microphones in a near-vertical alignment that were moved through seven measurement planes from upstream to downstream of the blade planes. The seven measurement planes of the five microphone array are indicated in Figure 8 by squares. The central microphone of this five microphone array has been selected so that the near-field comparison is achieved with the measurements, acquired one after the other, along a linear side line corresponding to seven microphone positions. The second microphone array is linear, located in the far-field and equipped with 13 microphones covering angles from 30° to 145° with respect to the flow axis (spheres on Figure 8).
Microphone array locations.
Figure 9 compares the FW-H computation using CFD blade pressure fluctuations with the measurements in the near-field of the CROR. The predicted Sound Pressure Levels (SPLs) of the odd sound harmonics are the closest to the measured SPLs. The computed 4*BPF underestimates the measurement but shows a qualitative agreement with it. As for the 2*BPF, the measurement shows a sudden decrease in the front propeller plane which is not found in the computations. There is no trace of this decrease in far-field so that it is assumed to be specific to the near-field. From the author’s point of view, this is related to a destructive interference and the close position of the floor in the wind tunnel might be a key element in this interference. Figure 10 compares the numerical results with the measurements in far-field. Computations and measurements show a qualitative agreement for the four tones with similar relative SPL variation according to the microphone positions. A significant delta at all frequencies is found all along the array. The computations unevenly underestimate the noise levels and the order of the underestimation is up to 10 dB on many microphones. This underestimation is attributed to the free-field conditions of the computations compared to the closed section of the windtunnel, whose walls have unequal acoustic absorptivity. The sawtooth pattern of the experimental BPF SPLs between 60° and 120° along the linear array, similar to a standing wave pattern, suggests the assumption of interference due to reflections. More generally, it is assumed that multiple reflections occur during the measurements and increase the measured SPL of all harmonics. In the next section, we attempt to quantify the effect of these reflections.
Near-field noise comparison on selected microphones. BPF: blade passing frequency; SPL: sound pressure level. Far-field noise comparison on the linear array. BPF: blade passing frequency; SPL: sound pressure level.

Wind-tunnel installation effect
The calculation of the installation effect of the wind-tunnel facility on the acoustic measurements is achieved according to the methodology previously presented. Instead of considering an aircraft architecture, we consider the wind-tunnel geometry for the BEM calculation. The Burton–Miller formulation of BEM problem is used and includes boundary conditions of Robin type so that complex impedances at the wall can be provided. This formulation requires a closed volume for the diffraction object so that the section of the wind-tunnel is artificially closed outside, as illustrated in Figure 11. One can see by transparency the interior section of the wind-tunnel. The half-circular inlet and outlet have been extended to isolate the acoustic interaction inside the section from the exterior domain. Several lengths were tested before convergence of the results was achieved (not presented here). The characteristics of the two meshes used for the BEM calculation at BPF and 2*BPF, respectively are summarized in Table 3. From the BPF mesh to the 2*BPF mesh the ratio between the wavelength λ and the cell size d has been reduced in order to save memory resources. The drawback is a longer convergence time in the latter calculation.
View of the wind-tunnel boundary element method geometry (transparency), virtual microphones (vertical plane without transparency) and experimental microphones positions (spheres). Mesh characteristics of the BEM calculations according to the selected frequency. BPF: blade passing frequency; BEM: boundary element method.

Wall models
The purpose of the BEM calculation is to assess the presumed acoustic interactions occurring in the wind-tunnel due to the walls. These interactions depend on the walls relative geometry and characteristics. Several coverings are found in the wind-tunnel but two of them dominate the whole area of the section. The first one is an assembly of resonant absorber boxes separated by absorbing foam. The resonant absorber boxes consist of perforated panels mounted above an air gap and sound absorbing material. These boxes are distributed over the walls and ceilings and are separated by sound absorbing foam. The second main covering is a removable sound absorbing floor carpet. For the sake of simplicity, the whole interior of the section is limited to these two coverings. Some details are neglected such as the covering of the inlet nozzle and outlet collector of the open jet wind-tunnel. The characteristics of these coverings are taken into account through a corresponding wall impedance. However, an additional simplification is introduced. Since the walls and ceiling are made of an assembly of resonant absorber boxes separated by absorbing foam and these boxes are rather more absorbing than the foam, we will assume in the following that walls and ceiling are fully covered by either perforated panels or absorbing foam. In that simplified manner compatible with our numerical approach, we expect evaluating the lower and upper absorbing power that the walls and ceiling can accommodate.
Robin’s boundary conditions in BEM problems enable the introduction of complex impedances representative of the absorbing power of the walls. The complex impedances for the BEM calculation have been deduced from (i) a model for the resonant absorber boxes and (ii) measurements for the foam and floor covering, achieved on samples in an impedance tube. The resonant absorber boxes were modelled in accordance with the procedures outlined by Allard and Atalla. 29 The complex impedances of the box components, under normal incidence, are individually modelled and then combined. The porous material within the box was modelled as an equivalent fluid using a Delaney-Bazley-Miki model. The results of this model are then combined with calculations of the influence of the perforated front plate and air gap to calculate the complex impedance of the entire panel.
Figure 12 gives an overview of the absorptivity of the covering materials at the relevant frequencies of our problem. The resonant absorber boxes are very efficient, the wall foam also except at the first BPF. In contrast, the thin floor covering, whilst serving to reduce reverberation, has a low coefficient of absorption.
Absorption coefficient of the main materials in the wind-tunnel section at each contra-rotating open rotor tones. BPF: blade passing frequency.
BEM results
In addition to the complex impedance approach, calculations with a rigid wall assumption are performed as a reference. Finally, three BEM calculations are achieved at each frequency and correspond to the following assumptions: (i) carpet on floor and perforated panels on walls and ceiling, (ii) carpet on floor and foam on walls and ceiling and (iii) rigid walls everywhere. The vertical plane shown in Figure 11 is firstly considered for the comparison of the BEM calculation at BPF. In Figure 13, top and middle, the results associated to assumptions (i) and (ii) are presented. As expected, the top figure shows the most absorbing results whereas the middle one shows a less absorbing power. This is in agreement with the absorption coefficients presented in Figure 12. Nonetheless one can notice that around the low centre of the plane, that is around X/λ = −0.75 and Y/λ = −3, the results using the wall foam impedance shows lower levels. This is evidence of the complexity of such a configuration where the numerous walls imply complex interactions. This complexity is also found in the low number of organized interference patterns whose size varies around the wavelength. Similar patterns are also found when the walls of the wind-tunnel are assumed to be rigid but the SPLs are higher because less acoustic energy is absorbed.
Modification of the acoustic free field at blade passing frequency due to the presence of the wind-tunnel (Δ = 0 means no modification). Different assumptions are made on the wind-tunnel walls: (a) carpet on the floor and perforated panels elsewhere; (b) carpet on the floor and wall foam elsewhere; and (c) rigid walls everywhere.
We now focus on the linear array of the wind-tunnel shown by spheres in Figure 11. This array is located at Y/λ = −2.29. In Figure 14, the results of Figure 10 are repeated for the purpose of the comparison and the additional results come from the BEM calculation and follow the assumptions presented in Figure 13. It appears that the calculation with the carpet on the floor and the perforated panels elsewhere induce very few modifications of the free-field CROR radiation. It is in agreement with the high absorption of the perforated panels and suggests that the floor has a minor influence on the linear array. Changing the perforated panels with the wall foam has no significant effect on the 2*BPF, in agreement with their similar absorption at this frequency, but it lowers the BPF levels around X/λ = 0. This unexpected result can be related to the previous remark about the area of very low levels on the corresponding plane of Figure 13. In contrast, as expected, the assumption of rigid walls on the wind-tunnel significantly increases the SPLs. It is remarkable that the sawtooth pattern found in measurement is replicated by this computation with a slight shift in the X direction. This calculation is in better agreement with the measurement and confirms the complex interaction of acoustic waves at BPF in the wind-tunnel. As for the 2*BPF, the rigid wall computation better reproduces some of the highest measured levels but fails to show a global agreement along the linear array. Surprisingly, the rigid wall computation shows more agreement with the experimental observation than the computation using wall impedances from materials of the wind-tunnel. This can be attributed to the choices of the wall modelling for the BEM calculations which lead to an overestimation of the absorbing power of the walls, the numerical impedance being homogeneous on the walls whereas the effective impedance on the tunnel walls is rather inhomegeneous since the side walls and ceiling are made of an assembly of the absorbing panels and the arrays supports, inlet and outlet are made of unknown impedance materials. Finally, the rigid wall results confirm the assumption of significant reflections occurring during the wind-measurement which are associated to the under-estimation of the measurements by the SPLs computed in free-field conditions. The SPLs found at BPF and 2*BPF with the rigid walls assumption being of the order of those measured, it gives confidence into (i) the computed CROR noise with CFD/CAA methods, that is in free-field conditions and (ii) the BEM approach with rigid wall assumption for the calculation of installation effects.
Comparison of computed noise levels with measurements at blade passing frequency (BPF) (left) and 2*BPF (right). Measurement in square symbols; free-field radiation of the contra-rotating open rotor in dashed line; boundary element method results with several assumptions: diamonds correspond to carpet and perforated walls, gradients to carpet and wall foam, circles to rigid walls. Major ticks are separated by 10 dB.
Aircraft installation effect
Ground map definition
The approach for the assessment of the noise shielding effectiveness is inspired by the flight test certification procedure for noise certification levels.
30
The noisiest phase of flight for CROR is the take-off operation which is the one addressed by the present work. For this phase of flight, the procedure for the noise level certification focuses on the lateral points during the engine full power phase and the flyover centre line points during the engine power cutback. Although the present work deals with only one flight condition, the purpose of the created ground map is to be globally representative of the key areas measured during certification even if this static calculation does not take into account the Doppler Effect occurring during a flight test. Figure 15 describes the ground map used in the computations. This ground map is separated between the flyover centre area and the two sideline bands, centred on the lateral points around ± 10% of the classic 56° sideline angle. The map is a structured grid of squares whose size is defined so that the directivity shift between two ground microphones is less than 1.5°. The angle aperture at the aircraft centre between upstream and downstream is 143° so that a long enough virtual flyover is considered. As a result, the map is made of 90,751 microphones.
Definition of the ground map.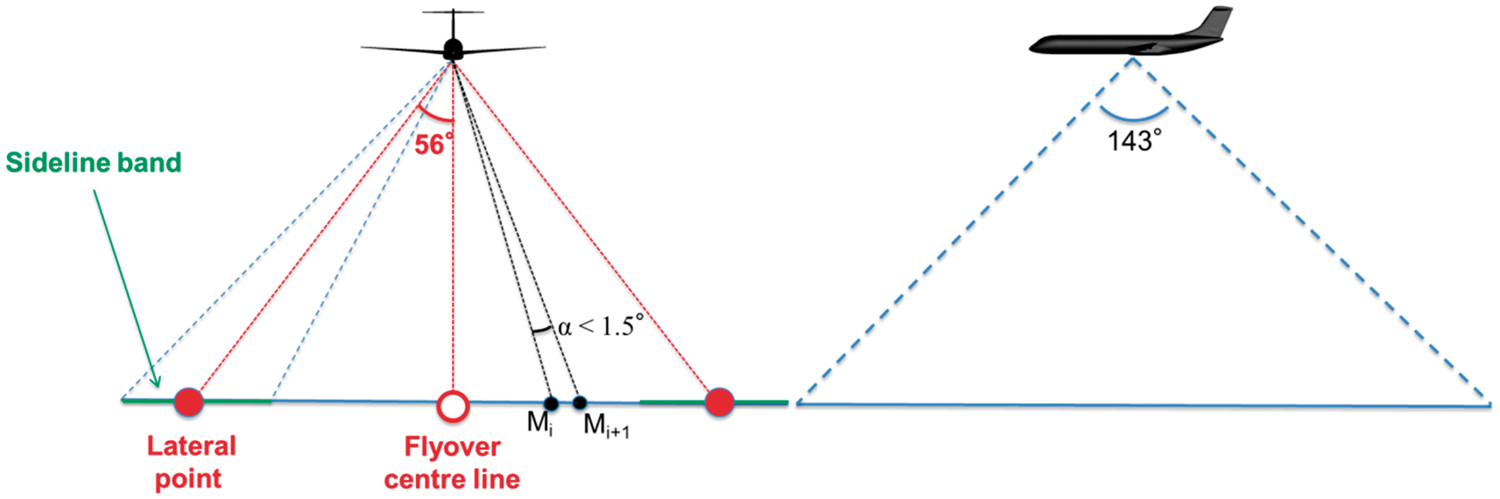
Hereafter, the analysis of the ground map relies on (i) the maximum of the flyover band and sideline band, respectively, and (ii) the sound power level (PWL). This latter is based on the integration of the acoustic intensity on the map surface and it is defined as

This sound power level is not the one generally defined for an acoustic source which requires a close surface but it is an integrated value representative of the acoustic radiation through the whole ground map. It has the advantage of providing a global level indicating the shielding benefit towards the ground or not. The consideration of the SPLs maxima is another way to assess the drawback of some configurations.
Contribution of two uninstalled CRORs
The tonal noise contribution of the aircraft model comes from its two CROR models. Since the current CROR noise directivity does not show any symmetry and depends on the pylon orientation (see Figure 7), the right and left open rotors have different contributions towards the ground. In the following, it is assumed that there is no coherence between their respective emitted acoustic pressure signal otherwise it would imply a perfect synchronisation of the open rotors between themselves and an exactly identical rotation speed for each open rotors, that is to say two unrealistic assumptions. As a first step, we will focus on the summed noise contribution from the two open rotors located and oriented according to their integration, that is pylon orientation, but without the scattering effect of the aircraft skin.
Figure 16(a) shows the ground map for the selected CROR tones for the PS-A open rotor locations (see Figure 1). The highest noise levels are concentrated under the sources and the even sound harmonics shows high levels around the flyover centre line in agreement with the directivity presented in Figure 7(b) dominated by the CROR axis direction.
Tonal noise ground maps from the two uninstalled open rotors. Sound pressure level (SPL) contours increase with brightness and the overall range is 30 dB. Upstream is located to the left side of the map. (a) PS-A CROR positions. (b) PS-E CROR positions. BPF: blade passing frequency.
Comparison of SPL maxima and sound power level discrepancies on the ground map between PS-A and PS-E open rotors locations.

BPF: blade passing frequency; PWL: power level; SPL: sound pressure level.
The details of the contributions from left and right open rotors are not shown here but it is noteworthy that the highest discrepancy between the contribution of each open rotor comes from the flyover centre band at 3*BPF where the right open rotor, in comparison with the left one, induces a maximum of 4.9 dB higher for the PS-A configuration and 6.7 dB higher for the PS-E configuration. This result suggests that either one open rotor or the other may be the major cause of the unpleasantness of an harmonic sound.
Acoustic shielding
The calculation of the open rotors installation effect with BEM applied to an aircraft geometry – characterized by its empennage shape – is run separately for each rotor – left and right – then the respective results are incoherently summed for the same reasons previously raised. The final results of all selected configurations lead to a significant amount of data to be analysed. Two parameters are carefully observed: (i) the modification of the open rotor location while keeping the T-tail empennage and (ii) the modification of the empennage geometry while keeping the PS-E open rotor location. The name of the configurations is referred to as OpenRotorLocation_EmpennageGeometry, that is PS-A_T-Tail for instance. In addition to the tail shapes presented in Figure 2, a configuration without empennage, that is without any vertical and horizontal control surfaces, namely PS-E_W-Tail, is computed. This test point examines the scattering from the fuselage only.
Discrepancy in terms of sound power levels between the selected configurations and their uninstalled open rotor configurations.

BPF: blade passing frequency.
More generally, in terms of open rotor location, focusing on the T-tail configurations, the benefit of the PS-E location is confirmed and the effect of the PS-C location is not relevant. The most interesting result is surely the comparison of the empennage geometries with the same PS-E location. For that purpose, the PS-E_W-Tail configuration is a relevant reference since it gives the shielding effect of the whole aircraft geometry without the empennage. It is noticeable that this configuration has a shielding benefit of 0.3–0.5 dB (PWL) except for BPF (+0.2 dB on PWL). The absolute value of 0.5 dB can therefore be set as the threshold for a significant shielding effect of the empennage. The L-tail and U-tail are the only configurations with a globally significant shielding benefit even if it is particularly weak for the 4*BPF. This weak shielding is thought to be related to the significant contribution of the 4*BPF to the whole flyover centre line whereas one can guess that L-tail and U-tail imply shielding concentrated towards the area under the aircraft. This is confirmed by Figure 17 which compares the worse and best configurations in terms of acoustic shielding. It is quite obvious that the benefit at all frequencies is located at the centre of the plane, that is under the aircraft.
Sound pressure level (SPL) comparison between PS-A_T-tail and PS-E_L-tail configurations. Scale and orientation are similar to those of Figure 16. (a) PS-A_T-tail configuration. (b) PS-E_L-tail configuration. BPF: blade passing frequency.
Maximum sound pressure level on the ground map for each configuration and relative discrepancy with uninstalled/isolated open rotors.

BPF: blade passing frequency.
Conclusions
A numerical approach for the calculation of installation effects of CROR aeroengines has been presented. It is based on the weak coupling between CFD, an IM based on Lighthill’s analogy for the calculation of acoustic radiation, and a BEM for the calculation of the acoustic diffraction by the aircraft fuselage.The current study considers a CROR engine and an aircraft model at 1:7th scale. The CROR noise has been computed for the first four harmonics dominating the tonal noise output. It has been analysed in terms of directivity and compared with measurements in wind-tunnel experiments. It appears that computations in free-field conditions show a qualitative agreement with the measurements but tend to underestimate them probably because of acoustic reflections occurring in the wind-tunnel which is not perfectly anechoic. Dedicated computations taking into account the wind-tunnel geometry support this assumption, and therefore supporting the accuracy of the numerical method presented here. Finally, several empennage shapes and CROR positions have been evaluated within the BEM calculations which show that (i) L- and U-tails enable significant acoustic shielding benefits towards the ground and (ii) the azimuthal orientation of the CROR pylon towards the top of the fuselage is better than the position of the pylon close to the horizontal. Nonetheless, none of the configurations showed a significant shielding benefit for all harmonics in both flyover and sideline directions. This observation illustrates the difficulty in designing aircraft architectures for the acoustic shielding of CROR because of their generally complex noise directivity. New concepts of aircraft architectures such as wing bodies might provide new solutions for such issues as demonstrated by the recent experimental study of Guo and Thomas. 11
Footnotes
Acknowledgements
The authors wish to thank and acknowledge the work of the WENEMOR consortium partners for the design, manufacture and testing of the wind tunnel model.
Declaration of conflicting interests
The author(s) declared no potential conflicts of interest with respect to the research, authorship, and/or publication of this article.
Funding
The author(s) disclosed receipt of the following financial support for the research, authorship, and/or publication of this article: The research leading to these results has received funding from the European Union’s Seventh Framework Programme (FP7/2007-2013) for the Clean Sky Joint Technology initiative under grant agreements no. CSJU-GAM-GRA-2008-001 and no. 278419: WENEMOR.