



Abstract
The effect of tip clearance in an axial fan on its aerodynamic and aeroacoustic performance is investigated experimentally as well as via a Lattice–Boltzmann flow simulation method. An increase in tip clearance degrades fan pressure rise and efficiency, but also increases significantly the overall sound power emitted by the fan. A large tip clearance causes a clear structure of well distinguishable unsteady vortices which interact with neighboring blades and hence produce an increase in broadband sound. Moreover, if, compared to the design flow rate, there is a moderate flow rate reduction, the local tip vortex systems of all individual blade tips form a circumferentially coherent flow structure, resulting in distinct humps of sound pressure in the acoustic far field. By means of a rigid ring-type protrusion fixed to the inner casing wall, the generation of the tip clearance vortices and slowly rotating coherent flow structures could be suppressed. As a consequence, the sound emitted by the fan is substantially reduced.
Introduction
Industrial fans frequently represent one of the major noise sources in air delivering systems. For decades, fan industry research and development efforts have therefore focused on the analysis and mitigation of flow-induced fan noise. The common axial fan type consists of an impeller installed in cylindrical duct type casing (Figure 1). Depending on the targeted value of pressure rise stationary guide vanes may be added and thus form a complete axial fan stage. Numerous sources of flow-induced noise are known. Self-noise is the sound generated from fluctuating blade forces arising from the flow over the blades themselves. Interaction noise is the sound generated from fluctuating blade forces due to encounters of blades with spatially and temporally inhomogeneous inflow. The working hypothesis which stipulates that interaction noise dominates over self-noise is gradually being accepted by the industrial fan community. Since the 1970s this led to design features like skewed blades (which are designed to smear out temporally and spatially inhomogeneous inflow structures), carefully matched impeller and stator blade geometries, and improved design of the system upstream of the fan inlet to reduce inflow inhomogeneities. If we restrict ourselves to impeller-only fans, the interaction of the impeller with the annular boundary layer of the casing and the tip vortices remains of interest. It has been known for many years that the effect of tip clearance is significant since the larger clearance does not only degrade the pressure rise and efficiency, but also increases the sound power level dramatically.
Axial fan stage in a cylindrical (duct-type) housing.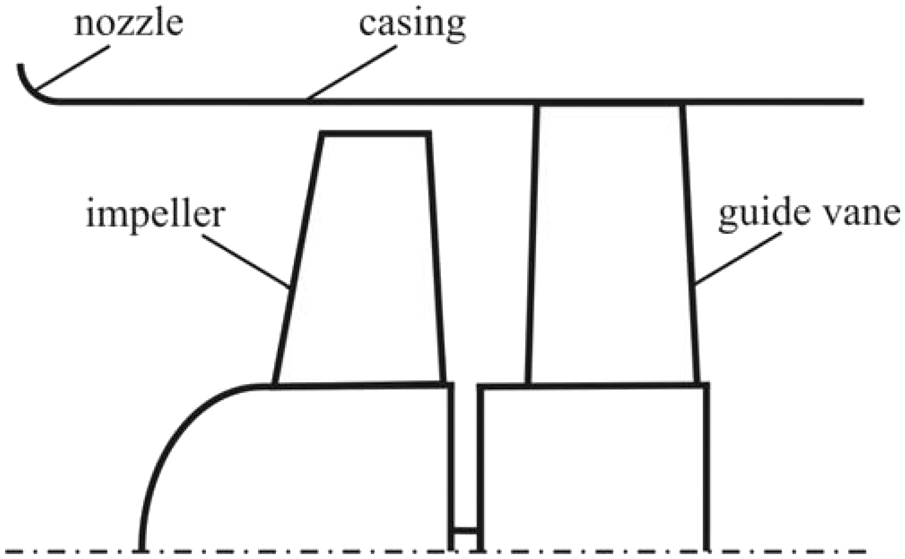
The overall objective of a comprehensive research project at the University of Siegen (cp. Zhu 1 ) is the detailed investigation of the tip clearance flow and, subsequently, of the sound-generating mechanism. The aim is to achieve a better understanding of the mechanism responsible for the tip clearance noise. Objectives of this present paper are the experimental and numerical quantification of the effect of tip clearance size and the analysis of a novel mitigation measure on the overall aerodynamic and aeroacoustic fan performance. Since experimental methods are limited with respect to spatial or temporal resolution, the high resolution numerical Lattice–Boltzmann method (LBM), so far rarely used in the realm of turbomachinery, is of special interest. LBM promises the synchronous prediction of the aerodynamic near field and the acoustic far field without additional modeling at affordable computational cost.
Literature review
Numerous investigations have addressed tip clearance secondary flow phenomena in axial flow machines. Studies from the early 1950s focused predominantly on aerodynamic effects. However, it was soon recognized that sound emission of axial fans, and compressors is crucially affected by tip clearance flows. Marcinowski 2 was among the first pioneers to address aeroacoustic effects of tip clearance in axial fans. In this early study, the effects of tip clearance and inflow condition were still mixed, and detailed noise generation mechanisms were not discussed. Longhouse 3 investigated the tip clearance noise in more detail. The results suggested that tip clearance noise is caused by an unsteady interaction of the blade tip vortex with the blade trailing edge and with the leading edge of the following blade. Khorrami et al. 4 presented a computational work on the application of passive porous treatment to the tip region for mitigating both rotor self- and interaction-noise in turbofan engines. An industrial-type axial fan with two sizes of tip clearance was studied by Fukano and Jang. 5 These authors hypothesized a spiral-type vortical structure which interacts with blades and hence causes the tonal sound. Following their experiments, numerical simulations were conducted.5,6 The tip clearance vortex was visualized, and the high velocity fluctuation was correlated with the known phenomenon of vortex breakdown. At the time of these studies, mostly steady-state Reynolds-averaged Navier–Stokes methods were feasible, which are naturally limited in describing a highly unsteady flow phenomenon. Kameier and Neise 7 observed humps below blade passing frequency (BPF) in the sound spectrum. This observation was made in particular when the fan was operated at part load. Pressure fluctuations measured on the casing inner wall and on two adjacent rotating blades led to the conclusion that a rotating flow pattern develops, which rotates relative to the stationary frame at approximately half of the impeller speed—the so-called rotating instability (RI). Baumgartner et al. 8 also observed RI in a high pressure compressor. Pardowitz et al.9,10 combined high-speed particle image velocimetry (PIV) and near-field unsteady pressure measurements. This study proposed a new hypothesis that the shear layer instabilities constitute the basic mechanism of the RI.
Due to the inherent limitations of experimental techniques, the complex three-dimensional flow and related acoustics are still poorly understood. Therefore, detailed analyses are increasingly based on numerical simulation methods. März et al.
11
performed a three-dimensional unsteady Reynolds-averaged Navier–Stokes simulation for the full annulus of the impeller of a low-speed axial flow compressor to detect the RI. It was concluded that the unsteady behavior of the so-called RI vortex is the main mechanism of the RI. However, the study cannot explain how the observed flow structures eventually generate the tip clearance noise. You et al.12,13 conducted a large eddy simulation (LES) of the flow in a linear cascade with a moving end wall to investigate the tip clearance effects. The study identified a tip leakage vortex (TLV), a tip separation vortex (TSV), and vortices due to interaction of TLV with incoming flow-induced vortices (IV) (Figure 2). Cahuzac et al.
14
performed a full LES of the flow in one blade passage of a low speed axial fan with tip clearance. More recently, Boudet et al.
15
performed a zonal LES approach for the same axial fan, which could significantly reduce the computational cost. Again, a wandering motion of the TLV was identified in the rotational frame of reference. It resulted in a peak in the energy spectrum of the velocity fluctuation in the TLV, the frequency of which corresponded to the peak in the far-field sound pressure spectrum. Eventually, Boudet et al.
15
proposed that noise is generated when the wandering TLV hits the tip of the adjacent blade. In contrast to You et al.,
16
they came up with a different mechanism of this wandering motion, which is possibly a response of the TLV to the upstream turbulence from the casing boundary layer. The study also claimed that the observation of this vortex wandering was not in contradiction with the observation of the RI by Kameier and Neise.
7
In fact, vortex wandering possibly coexists or is a precursor of the RI. Pérot et al.
17
were the first to apply the LBM to a direct prediction of the aeroacoustic performance of a low-speed axial fan. An automotive cooling fan with a rotating shroud ring was simulated including the complete test rig. Both the predicted aerodynamic and the aeroacoustic performance showed good agreement with experimental data. Very recent studies, e.g. by Mann et al.,
18
Magne et al.,
19
Piellard et al.,
20
Zhu et al.,
21
and Zhu and Carolus,
22
further confirmed the feasibility of utilizing LBM for this class of problem.
The system of tip clearance vortices visualized by using iso-surfaces of λ2 criterion of a LES predicted time-averaged flow field in one blade passage, from You et al.;
12
note that the tip clearance is on the bottom of the cascade.
Numerous studies and patent specifications deal with tip noise mitigation measures. For example, Longhouse 3 proposed a rotating band or shroud fixed to the blades tips, through which a noise reduction of up to 12 dB(A) was achieved without reducing the size of the large tip clearance. This design became very popular in the automotive industry. An alternative is casing treatment. Kameier and Neise 23 proposed an annular brush-type turbulence generator that is fixed to the inner casing wall in the tip region. It was claimed that the narrowband humps in the acoustic spectrum, associated with a RI phenomenon, were reduced. Khorrami et al. 4 suggested a porous treatment to the tip region as a viable noise mitigation concept in turbofan engines. Karstadt et al. 24 integrated an assembly of a perforated casing ring with absorber layers and a sound-reflecting termination in the casing adjacent to the blade tips and claimed a reduction of peaks at BPF and its harmonics as well as broadband noise.
In summary, most studies report an increase in broadband noise as the tip clearance is enlarged. They also report the emergence of narrowband humps that are not related to BPF. These features of the noise signature are mainly explained by the interaction of a system of vortices with the bladed cascade of the impeller. It seems, however, that the detailed interaction mechanism between the complex vortical flow structure and the impeller blades is still not entirely understood. Experimental researchers face a dilemma: Either they analyze the unsteady flow field in the blade tip region at numerous locations by means of, e.g. hot wire probes, which provide an excellent temporal resolution, or they utilize comparably slow optical planar methods such as PIV. Numerical simulation methods increasingly become a supplement or even an alternative to experiments, since—in principle—they allow a comparably high spatial as well temporal resolution. By nature, tip clearance phenomena are inherently three-dimensional, unsteady, and turbulent. Hence, only advanced unsteady simulation methods are suitable for a detailed analysis.
Methods
Generic test fan
All of our own experimental and numerical investigations in this study are based on a generic, low-pressure, impeller-only test fan called USI7. This fan served as a generic fan in numerous studies in the past and is described in detail in Carolus et al.
25
Figures 3 and 4 show the complete fan assembly. Two tip clearance variants are investigated in this study: one variant with an extremely small clearance of s/d2 = 0.1% and one variant with a large tip clearance ratio s/d2 = 1.0%. Two sets of three thin cylindrical struts, equally spaced on the circumference, hold the complete impeller unit in the tube. The first set is placed one impeller diameter and the second set is placed 2.23 impeller diameters downstream of the impeller, respectively. This positioning of the struts is assumed to prevent rotor/stator interaction and hence tonal noise.
Impeller of generic test fan USI7. Left: Design via blade element momentum theory with 15 spanwise blade elements, right: manufactured from aluminum by 3D CNC milling. USI7 fan assembly: a—Impeller with hemispherical spinner; b—bellmouth inlet nozzle; c—hub with bearing and electric drive; and d—two sets of three cylindrical struts, equally spaced on circumference.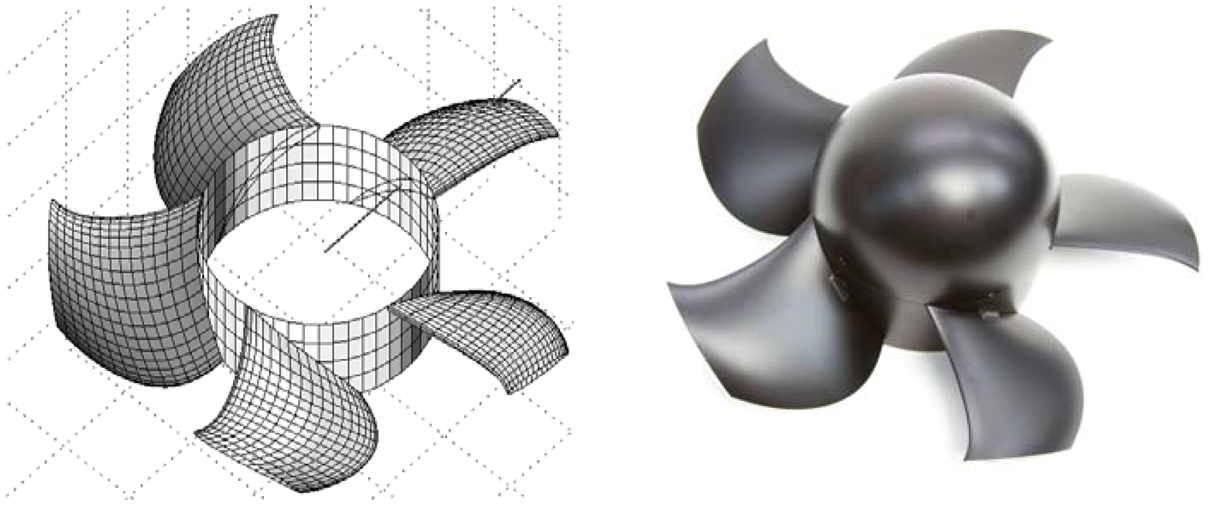
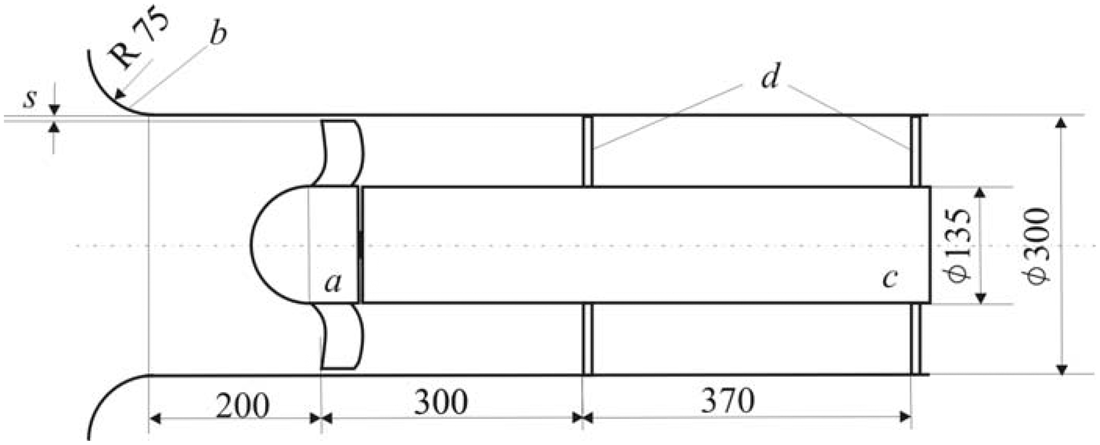
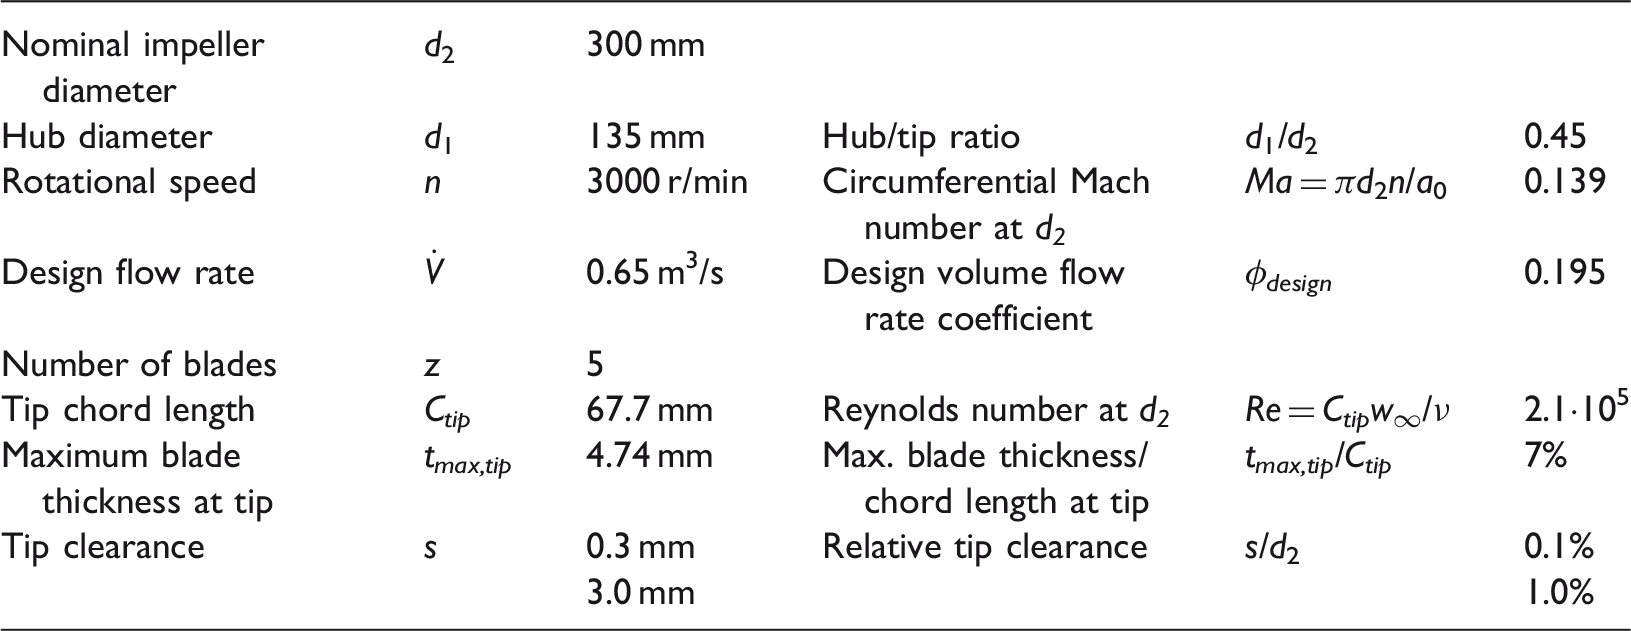
Table 1 summarizes the relevant design parameters, partly in terms of the nondimensional coefficients:
flow rate coefficient
pressure rise coefficient
Design parameters of the generic test fan USI7.



Test rigs
The aerodynamic performance of the fan is determined on a chamber test rig according to the German standard DIN 24163-2
26
(Figure 5). An external electric motor with its integrated torque and rotational speed measuring shaft is used as a drive. Acoustic measurements are carried out on a duct test rig connected to a semianechoic chamber as depicted in Figure 6. This test rig is designed to conduct standardized aeroacoustic measurements of axial fans and corresponds to type B (free inlet, ducted outlet) installation according to the standard ISO 13347-3.
2
7
The impeller takes air from a large plenum, designed as a semianechoic chamber (i.e. absorbing walls and reflecting ground), and exhausts air into a duct with an anechoic termination. The flow inlet is located in the reflecting ground. The operating point is controlled by a throttle downstream of the termination. The volume flow rate is measured by a calibrated hot film probe in the duct and the rotational speed of the fan is captured by an optic sensor at the shaft. A low noise electric motor in the hub is used to drive the fan in this configuration.
Chamber test rig: a—fan assembly, b—electric motor with integrated torque meter, c—settling chamber with internal screens, d—adjustable throttle, e—auxiliary fan, f—flow straightener, and g—volume flow rate metering nozzle. Duct test rig with semianechoic chamber (top view). a—fan assembly with turbulence control screen (center line 1350 mm above reflecting ground), b—star flow straightener, c—duct, d—induct microphone with slit tube and nose cone, e—hot film mass flow meter, f—anechoic termination, g—adjustable throttle, h—free field microphones, i—semianechoic chamber, and j—air inlet in reflecting ground.

The sound power, which is radiated into the free field on the suction side of the fan, is derived from the averaged sound pressure measured at the three microphone positions Lp5,i (as shown in Figure 6), i.e.

In a prestudy, 16 microphones were placed on a parallelepiped enclosing the bellmouth fan inlet nozzle and the reflecting ground according to ISO 13347-3. 2 7 This cost-intensive method was eventually replaced by three microphones, and the measurement surface area was taken as the surface of a hemisphere, Aenvl = 2πR2. It was proven that both the overall and the spectral sound power levels obtained from the 16 microphones, and also from the three microphones, agreed well within the given uncertainty. 2 8
Lattice–Boltzmann simulation
General method
In contrast to the continuum assumption of the classical CFD methods, in the LBM the interaction between discrete fluid particles through convection and collision is calculated. The macroscopic physics of the fluid flow is observed by using simplified kinetic models on a mesoscopic level and averaging the results to obtain the macroscopic properties. Since the number of particles in a fluid is too high to be tracked individually, the particles are represented by distribution functions 

The concept of this model is that the particle distribution 
The weight function Velocity discretization model (D3Q19) and corresponding weights.
31
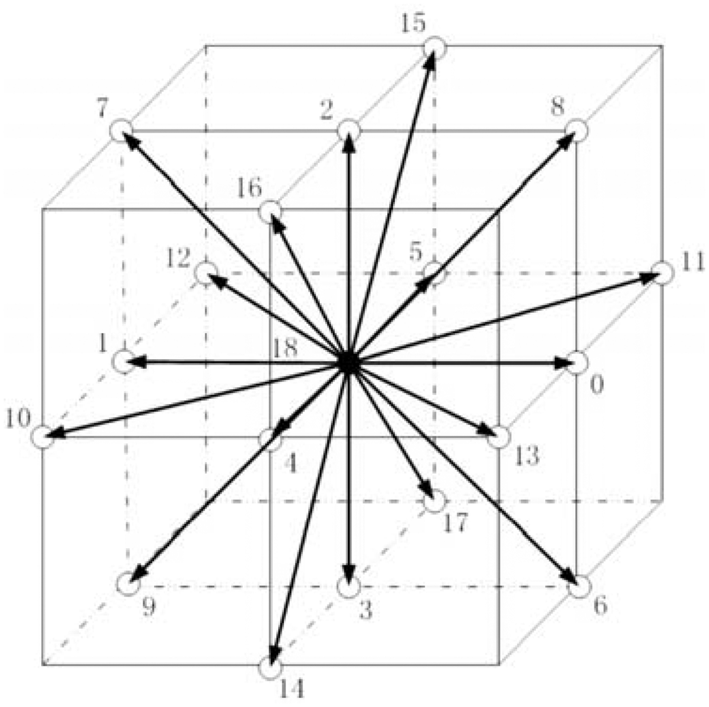
The macroscopic flow variables, e.g. density or velocity, are determined by calculating the moments of the particle distribution functions


The particle densities can only take discretized values for direction and speed, while the macroscopic fluid velocity may yield in any direction and speed. 30 The static pressure at solid boundaries results from the momentum exchange of the collisions between the particles and the walls. Within the flow field, the static pressure can be derived from the equation of state, i.e. the ideal gas law. The acoustic pressure in the far field is calculated directly without the application of a subsequent acoustic model.
The solver employed uses a so-called very large eddy simulation approach. The resolvable scales are computed directly while unresolved scales are modeled via an underlying RNG k−ɛ turbulence model.
32
This is realized by artificially extending the relaxation time τ in the collision operator 
Throughout this paper the commercial software PowerFLOW™ 5.0c, in which the presented approach has been encoded, is applied.
Setup for the generic test fan
The computational domain includes the complete acoustic test rig in full scale (Figure 8). For simplicity, all inner walls of the semianechoic room (i.e. even the floor) are defined as porous. Both air inlet and outlet regions are modeled as damping zones to avoid acoustic reflections. All other surfaces (nozzle, duct, fan impeller, and fan hub) are specified as rigid walls. The mass flow according to the required fan operating point is specified at the inlet. Free exhaust at ambient atmospheric pressure is assumed at the outlet.
Simulation domain including the anechoic room and test rig duct (top), grid detail in the fan section with LRF domain (bottom). LRF: local reference frame; VR: variable resolution.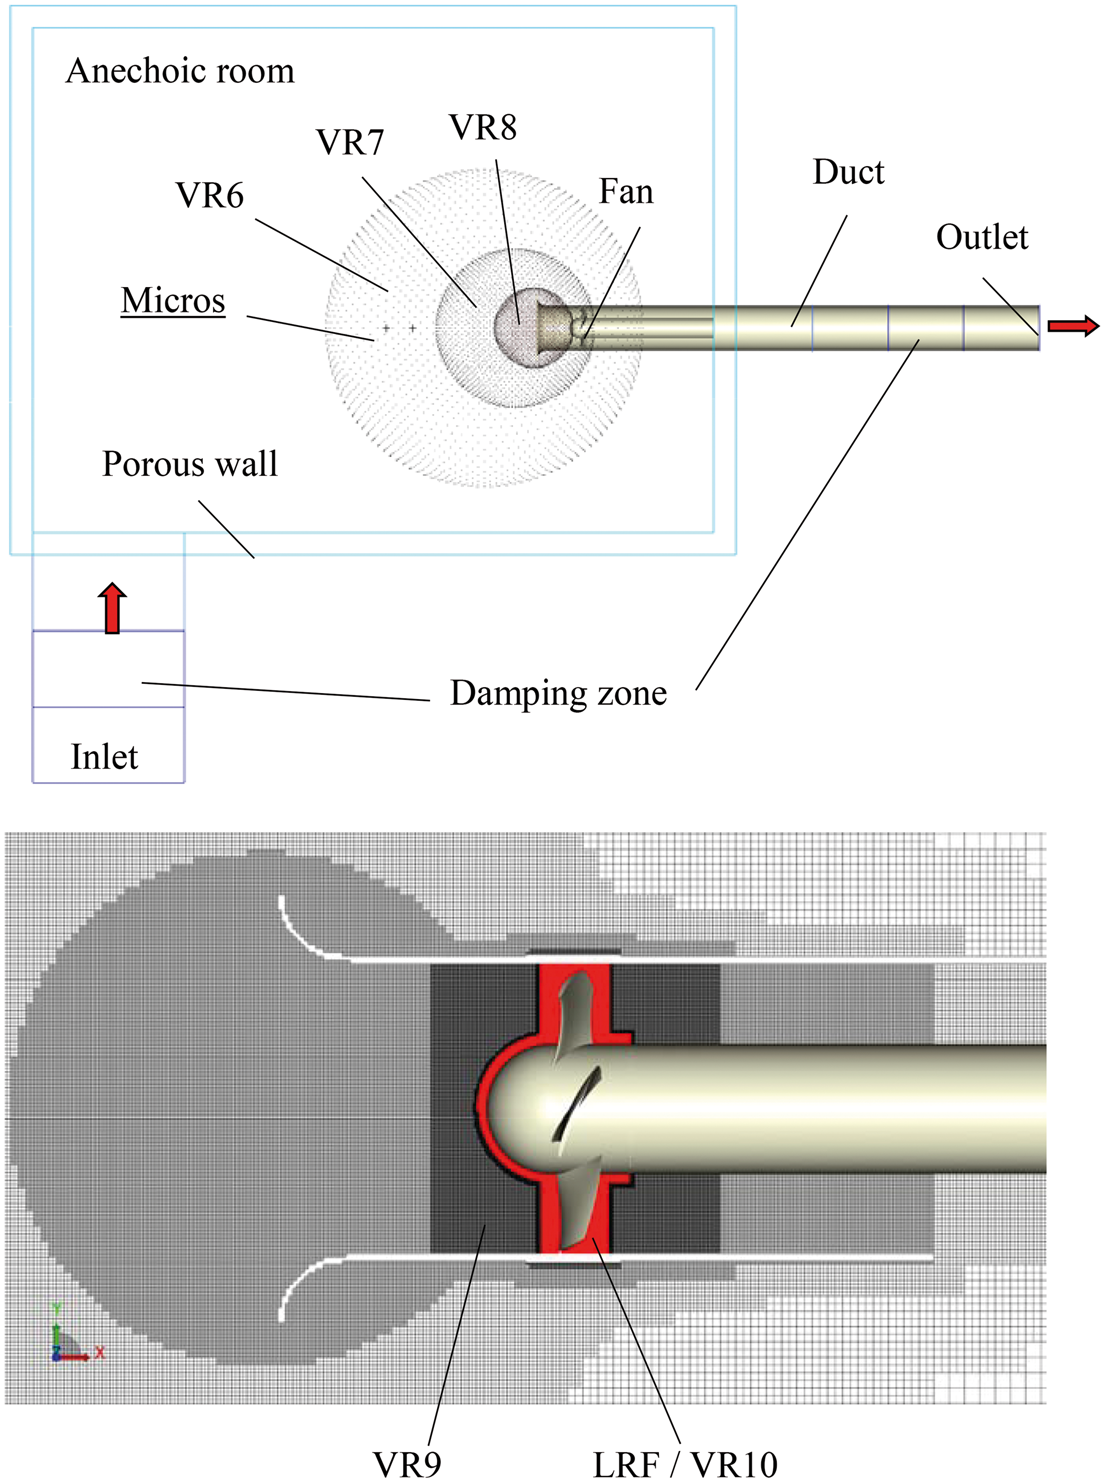
The LBM scheme in the software PowerFLOW™ is solved on a grid composed of cubic volumetric elements, so-called voxels, using a variable resolution (VR) strategy in which the grid size changes by a factor of 2 for adjacent resolution regions. A rotating reference frame employing the sliding mesh method around the rotating fan impeller is discretized using the finest grid resolution of Δx = 0.5 mm (VR10), which corresponds to 600 voxels across the duct diameter. The effect of spatial resolution on the quality of the prediction and the justification for the choice of this particular grid size are discussed in Appendix 1. The large tip clearance is resolved with six voxels, whereas the small tip clearance is replaced by s/D
a
= 0.0%, i.e. the tip clearance is completely neglected to save computational effort. The VR zones are denoted in Figure 8. The regions around the “microphone probes” are resolved spatially with Δx
mic
= 8.0 mm (VR6). Brès et al.
34
estimate the required number of grid points per wavelength for an accurate capture of acoustic waves as N
ppw
= 16. With our grid this would yield a maximum frequency that can be resolved as

The simulation time step is Δt = 8.2·10−7 s in VR10. The data at the monitoring points in the acoustic far field, i.e. at the microphone probe positions, are captured with a sampling frequency f s-Probe = 75.822 kHz. The hydrostatic pressure fluctuations on the blade surface and in an adjacent annular volume are captured with a sampling frequency fs-SurVol. = 9.478 kHz. The overall pressure rise of the fan is evaluated in planes approximately one duct diameter up- and downstream from the fan impeller, area averaged in each plane and time averaged during 10 revolutions. The prestudy showed that this is a valid approach to archive the converged aerodynamic performances. 35 The simulations are performed at the fan design operating point (φ design = 0.195) and at a part-load operating point under low flow rate (φ opt = 0.165). The acoustic prediction in far field from LBM results is evaluated using the data captured over time interval of at least t sim ≈1 s. This corresponds to approximately 50 impeller revolutions when a statistically stable fan operating point is reached.
Results
Effect of tip clearance on overall aerodynamic and acoustic fan performance
Figure 9 shows the measured overall aerodynamic and acoustic performance characteristics of the fan for two different sizes of tip clearance. The effect of the large tip clearance is remarkable: Not only pressure rise ψ
ts
and efficiency η
ts
are degraded, but the overall sound power level Lw5 is significantly increased. With decreasing flow rate (i.e. toward part load) Lw5 varies characteristically: With the small tip clearance Lw5 stays at a low 75 dB almost constant down to the onset of stall at φ = 0.125. The onset of stall is clearly marked by the dramatic jump of more than 20 dB. In contrast, with the large tip clearance, Lw5 increases monotonically to approximately 95 dB at φ = 0.16 and then stays at this high level for φ < 0.16.
Measured and LBM-predicted overall performance of the test fan assembly USI7 as a function of tip clearance; the dashed lines indicate the two flow rate coefficients φ
design
= 0.195 and φ
opt
= 0.165; note that (i) the small tip clearance s/D
a
= 0.1% of the experiments was replaced in the LBM simulations by s/D
a
= 0.0%, (ii) this graphical representation of the characteristics is not fully consistent in the sense that all variables are truly nondimensional: LW5 is not normalized with geometrical or operational parameters of the fan. The reason why this was not done throughout this study is that acoustic scaling laws are problematic; if not stated otherwise, LW5 evaluated from experimental data are for n = 3000 r/min and ρ = 1.16 kg/m3. LBM: Lattice–Boltzmann method.
The low frequency part up to 3000 Hz of the sound power spectra for φ
design
= 0.195 and φ
opt
= 0.165 are presented in Figure 10. Evidently, the levels at most frequencies are affected by the size of tip clearance. The non-BPF-related humps become very pronounced for φ
opt
= 0.165, particularly with the large tip clearance. Exceptions are the tones at BPF and its higher harmonics. As shown by Sturm and Carolus
36
those tones are not caused by the tip flow, but by a slow large-scale room airflow, induced in the inlet plenum of the test rig, i.e. the anechoic room. Eventually this airflow translates into a spatially and temporally inhomogeneous inflow ingested by the fan causing fluctuating BPF-related blade forces.
Sound power spectra as a function of tip clearance; top: φ
design
= 0.195; bottom: φ
opt
= 0.165; arrows indicate non-BPF-related humps; bandwidth Δf = 5 Hz. BPF: blade passing frequency.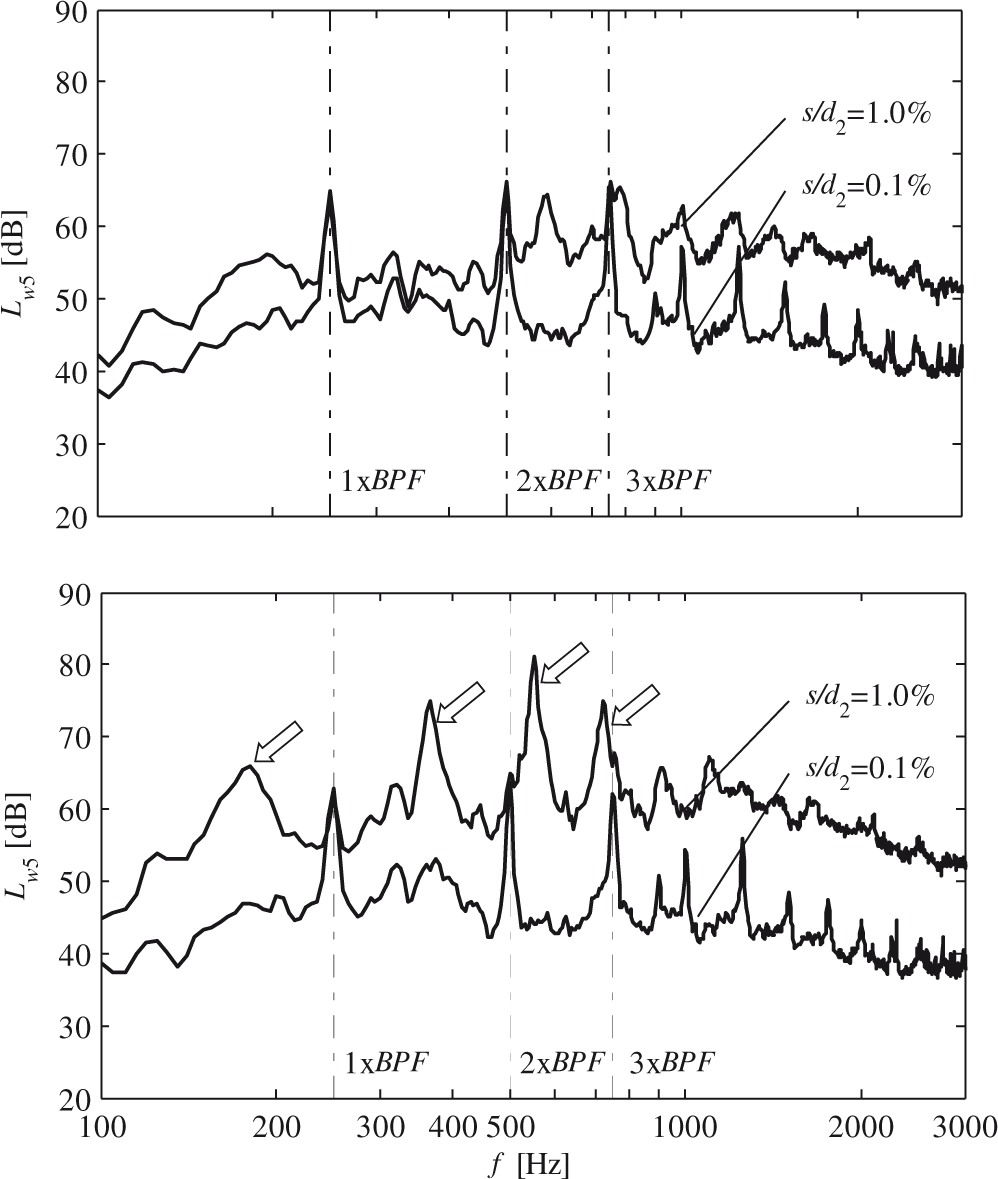
As summarized in Appendix 1, the LBM simulations require considerable computational resources. Therefore, only two operating points are considered, φ
design
= 0.195 and φ
opt
= 0.165 (dashed lines in Figure 9). Moreover, for saving computational cost, the small tip clearance s/d2 = 0.1% is modeled as 0%. The agreement of the LBM results with the measurements, Figure 9, is satisfactory. This observation is confirmed by a closer look at the spectra in Figure 11. Both the broadband floor and the dominant narrowband humps observed for φ
opt
= 0.165 with the large tip clearance are predicted well. Although the complete anechoic room and acoustic test rig are included in the computational domain, the tonal noise at BPFs is not expected from the LBM prediction. Sturm
37
proved that in the simulation the large-scale room airflow, mentioned in the previous paragraph, can only develop after a long simulation time (here over 100 s physical time); the results shown in this study are all captured from simulations after achieving a statistically stable operating point, which, however, is not a sufficient criterion for the development of the large-scale room airflow.
Comparison of the LBM predicted far-field sound power spectra with experimental data; φ
opt
= 0.165; bandwidth Δf = 5 Hz. BPF: blade passing frequency; LBM: Lattice–Boltzmann method.
Tip clearance vortex structure
Figure 12 presents instantaneous LBM results of the tip clearance flow. The instantaneous vortex structures are visualized by iso-surfaces in terms of the λ2 criterion and colored by vorticity magnitude. In agreement with Figure 2, the tip clearance flow features the typical vortex structures
TLV: the dominant vortex generated near the leading edge; TSV: small-scale vortices that separate from the tip gap near the trailing edge. Instantaneous vortex structure from LBM visualized with iso-surfaces of the λ2 criterion with a value of −600 1/s2, colored by vorticity magnitude (red denotes high values and blue denotes low values). TLV: tip leakage vortex; TSV: tip separation vortex.
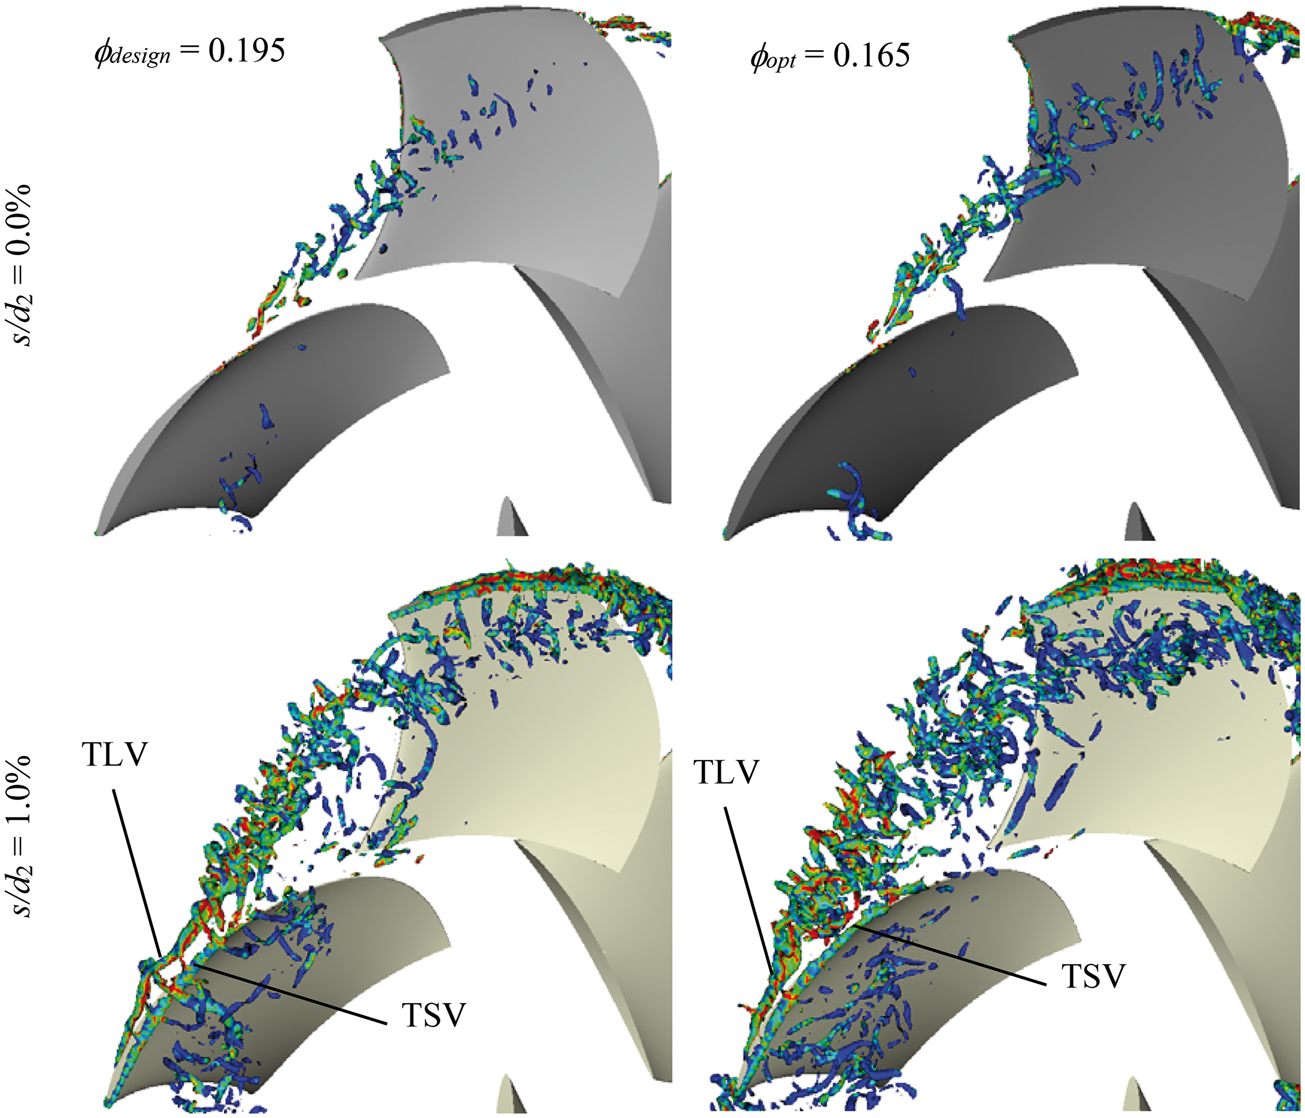
Figure 12 depicts the flow field in an annular region around the blade tips containing the upper half of the blade cascade only. Even for the case without tip clearance s/d2 = 0.0%, small-scale vortices are visible. They barely interact with the neighboring blade. In the case of the large tip clearance s/d2 = 1.0%, the vortex system becomes much more complex. The TLV with its high vorticity magnitude (red colored) is clearly detectable, which eventually disintegrates into smaller vortices with lower vorticity strength while travelling through the blade. The interaction of the remaining TLV with the following blade surface in its tip region could be the cause for the broadband sound observed in the spectra of Figure 11.
When the flow rate is decreased, apart from the effect of shifting the whole tip vortex structures toward the leading edge, the TLV is pushed toward the upstream direction and disintegrates in even more smaller vortices (Figure 12, lower right). Those vortices tend to hit a larger portion of the tip region of the neighboring blade. This phenomenon is similar to observations described by März et al. 11 and generates the so-called RI vortex. Possibly it is one of the triggers that initialize the highly unsteady but still deterministic tip clearance vortex structure at lower flow rates.
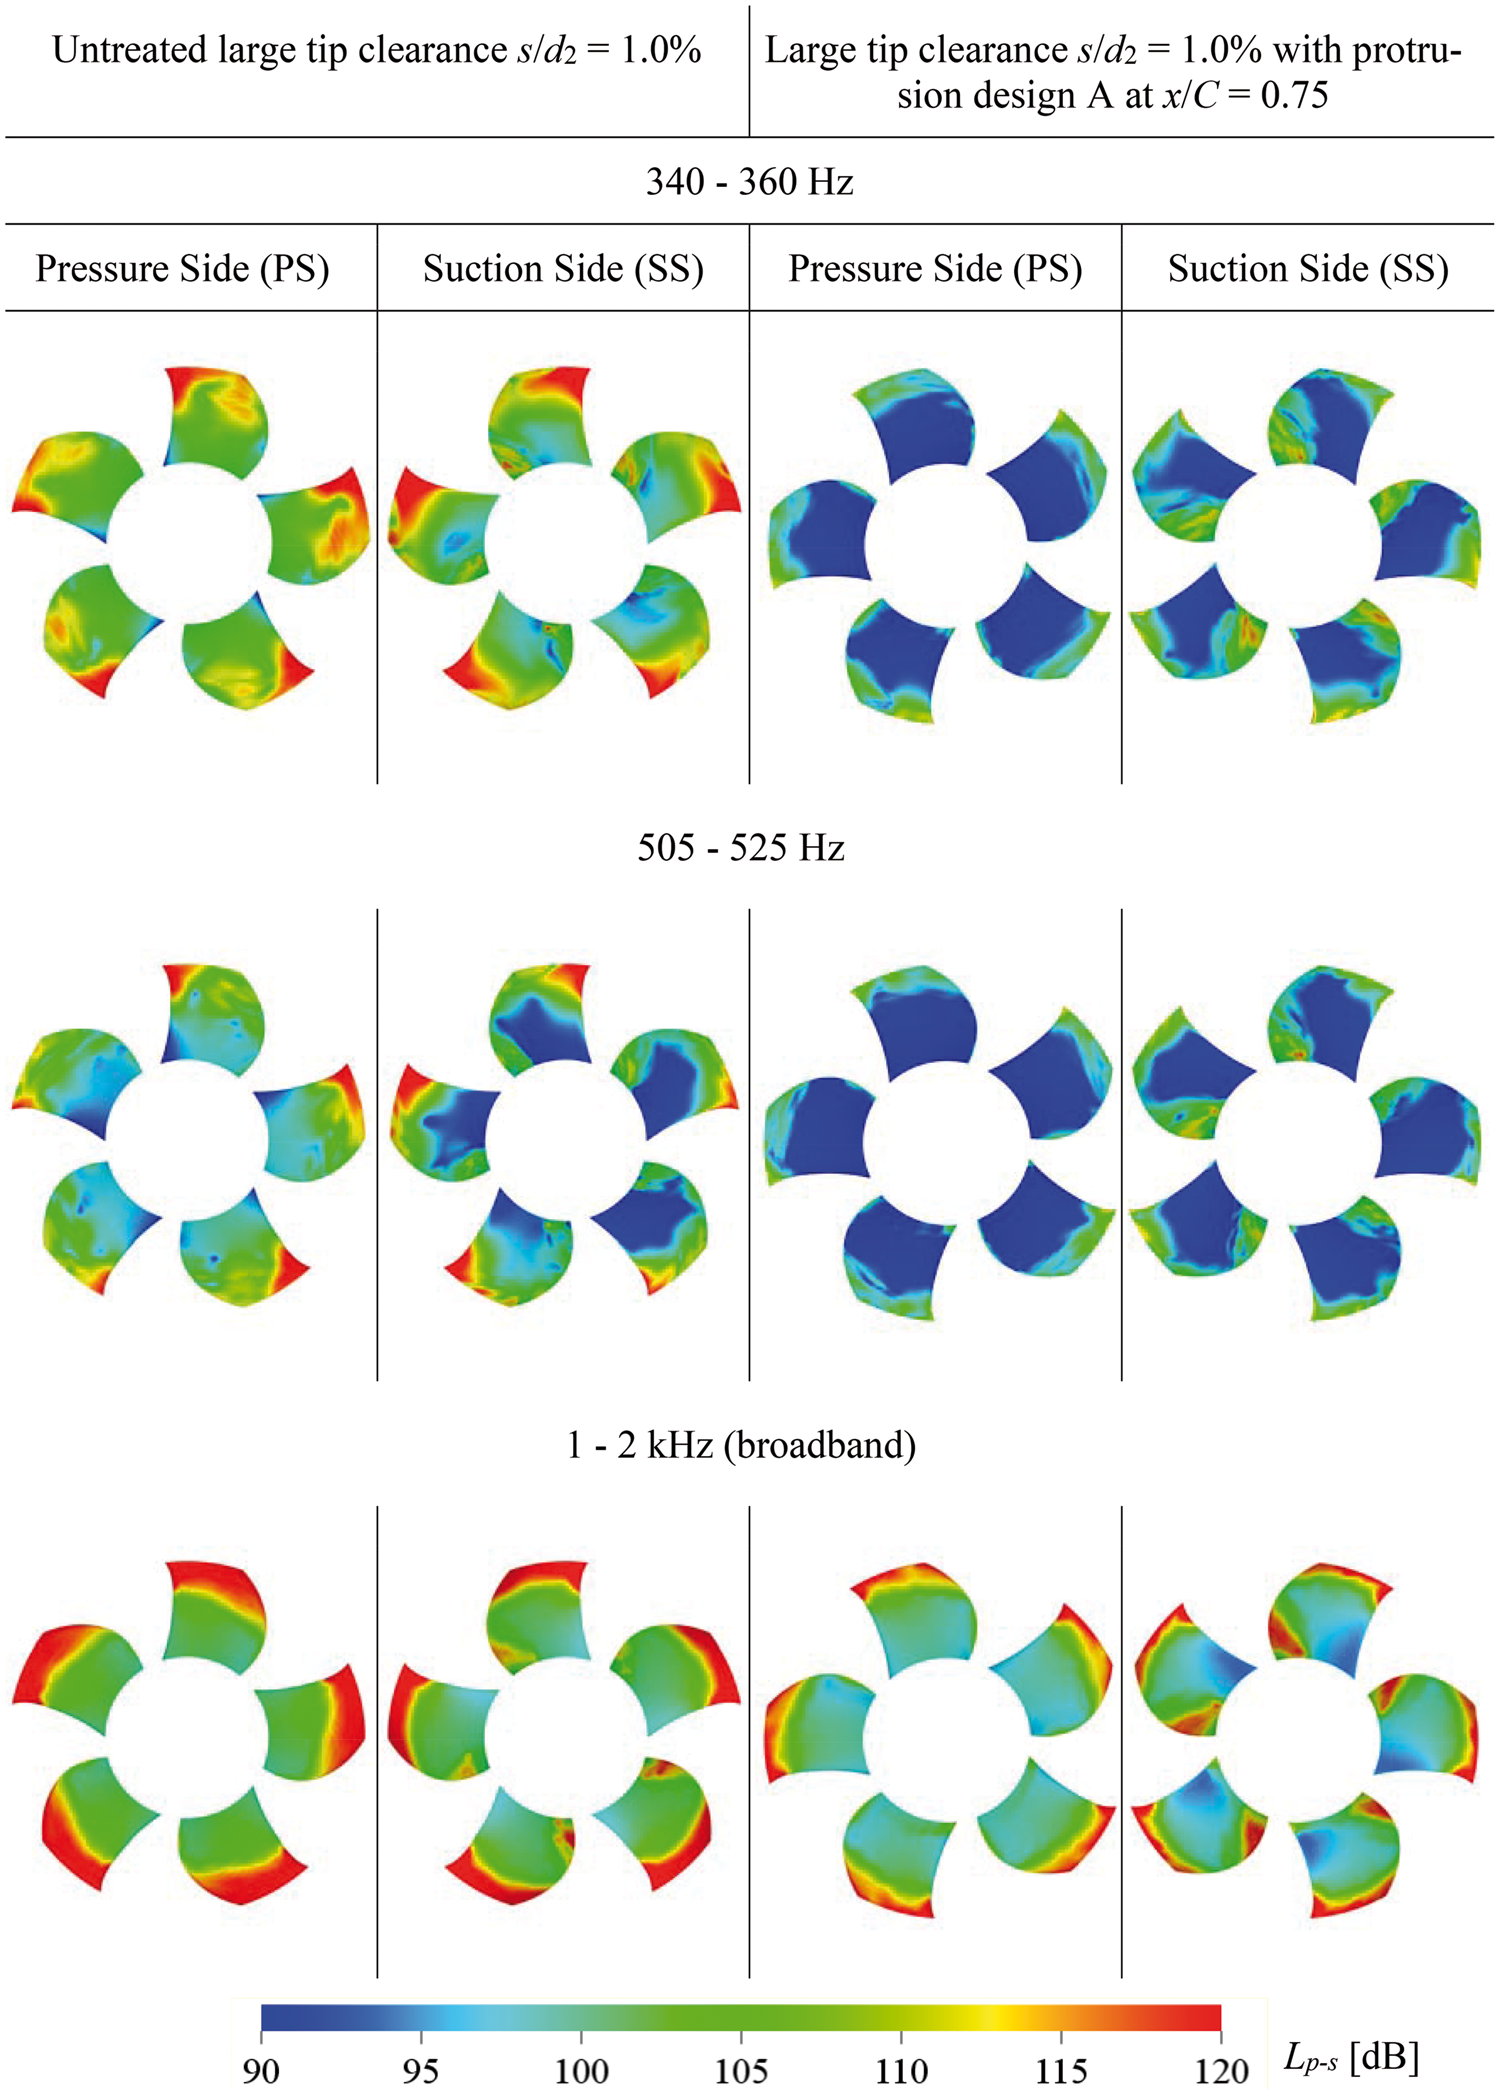
Figure 13 depicts the distribution of the wall pressure fluctuations, i.e. the relevant aeroacoustic sources, on the complete blade surface. All data are band-pass filtered from 1 to 2 kHz. The top row shows an instantaneous distribution; the middle row shows the power spectral density level (PSDL) evaluated over 10 impeller revolutions. The small area of contamination in the hub region close to the trailing edge is unaffected by the tip gap. This observation confirms that sound in the frequency band 1–2 kHz is indeed linked to vortex-induced surface pressure fluctuations in the blade tip region. Clearly, the tip vortex system affects the pressure side far more than the suction side. The resulting field of instantaneous acoustic pressure far upstream of the impeller is depicted in the bottom row of Figure 13. It has to be noted that only the pressure in the stationary frame of reference, and not in the rotational frame including the impeller, is visualized. The three monitoring points are at exactly the same positions as the microphones in the experiments. Without tip clearance, the monitoring points at microphone 1–3 only detect weak waves, whereas with the large tip clearance much stronger acoustic pressure fluctuations exist at these monitoring points.
LBM-predicted pressure fluctuation on blade surfaces; top: instantaneous; middle: in terms of PSDL evaluated over 10 impeller revolutions; bottom: instantaneous acoustic pressure radiated into the far field; all pressure fluctuations are band-pass filtered from 1 to 2 kHz at φ
opt
= 0.165.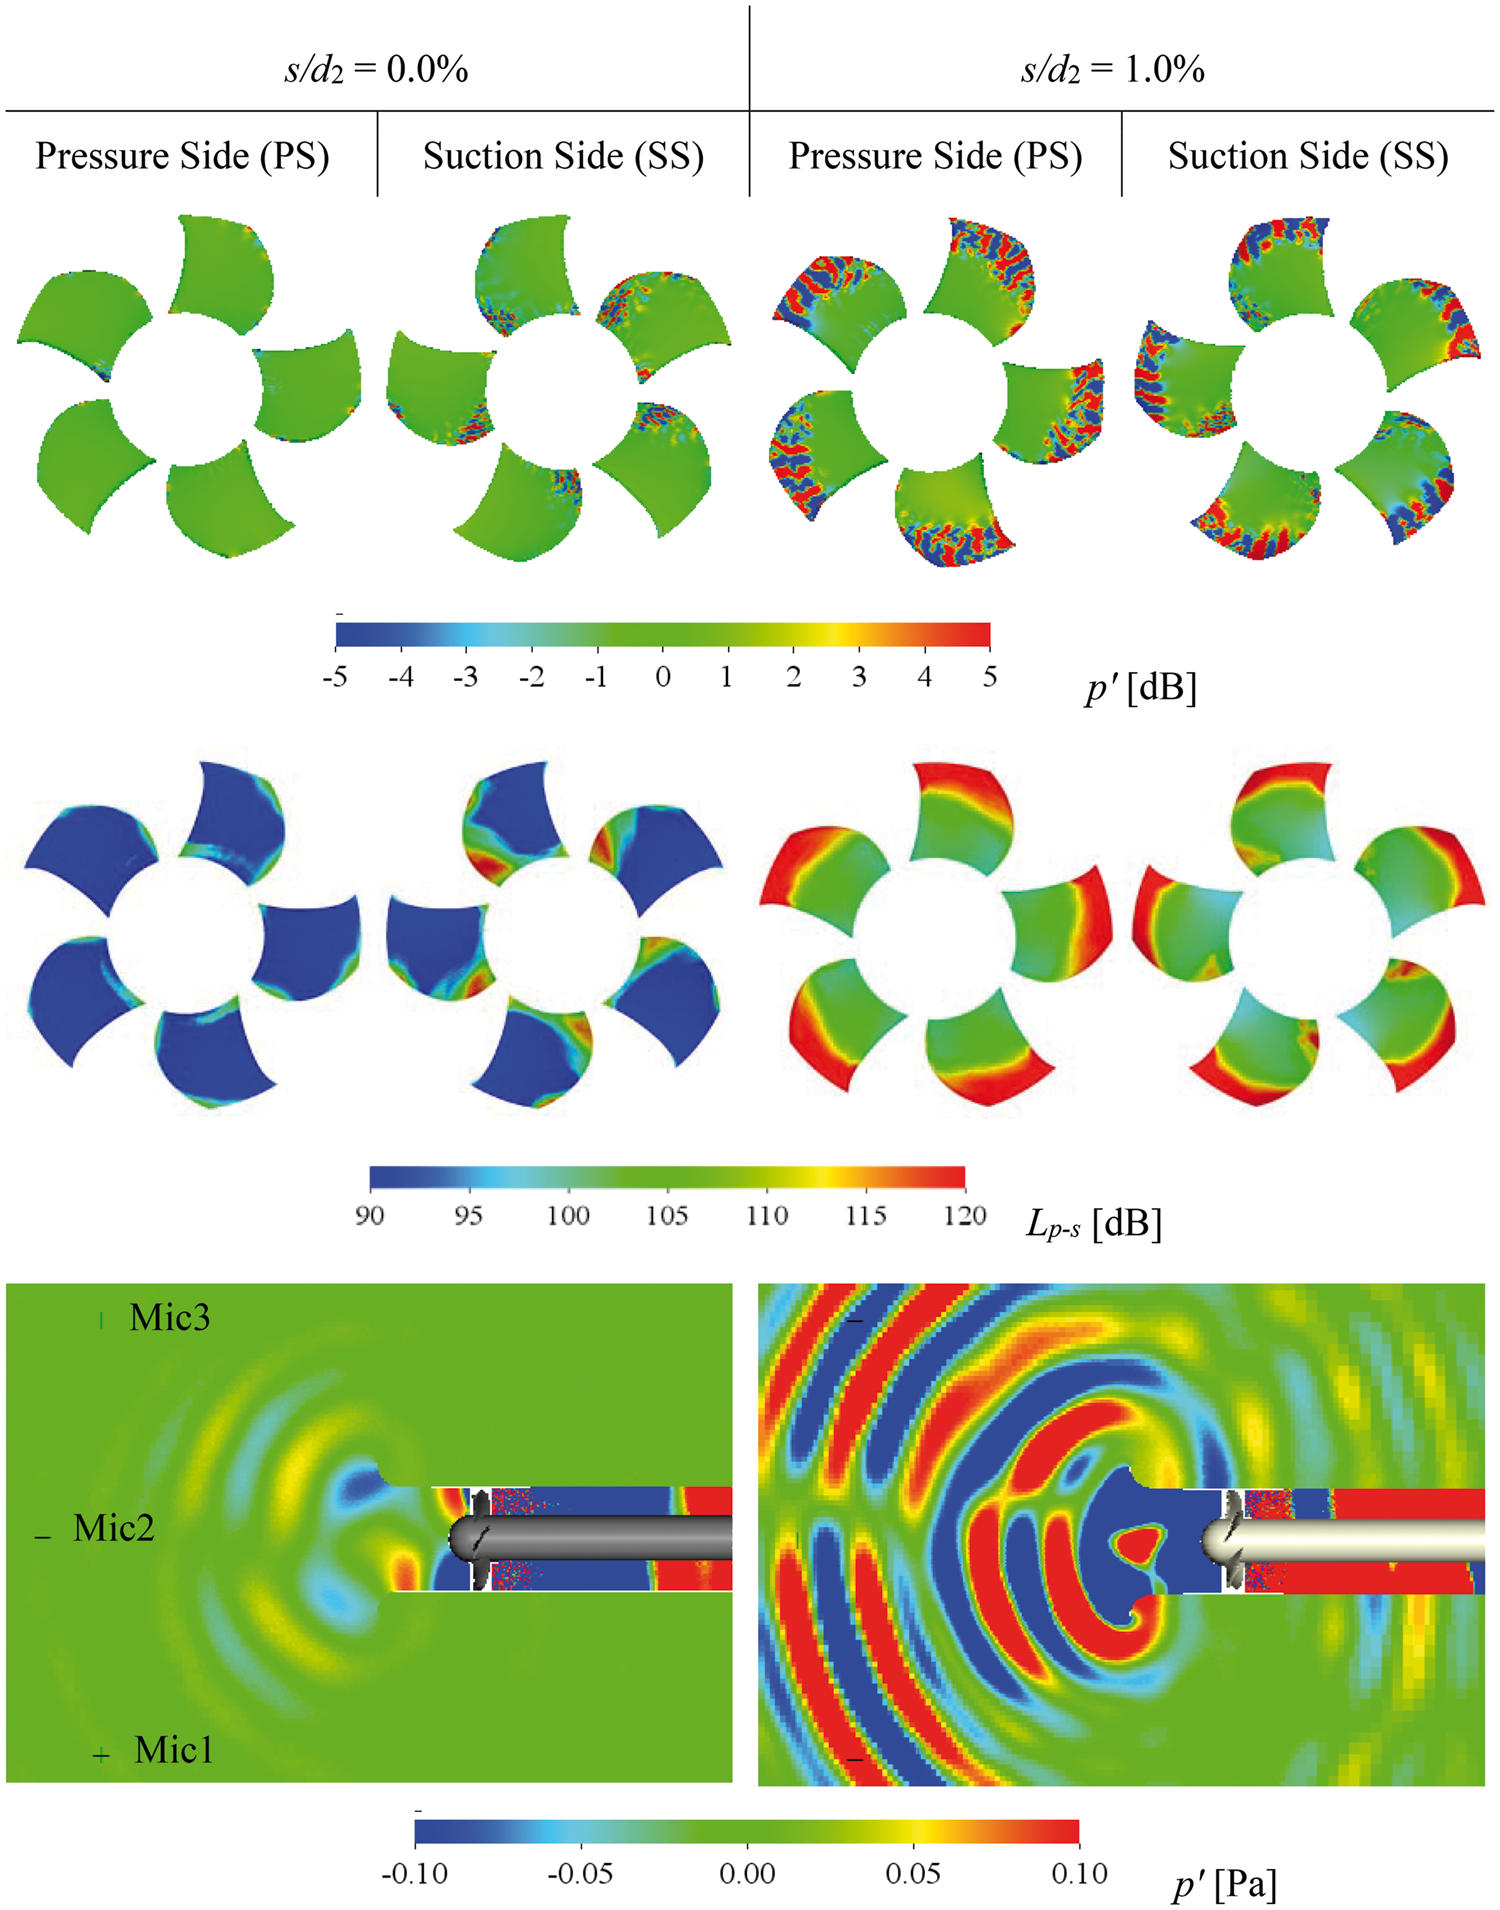
Novel casing treatment for tip clearance noise mitigation
The noise-generating mechanisms identified in the previous section suggest that an acoustically efficient geometrical modification of the tip clearance region must destroy the vortical flow structure of the tip clearance flow and prevent its interaction with a neighboring blade. For that purpose, rigid ring-type protrusions fixed to the inner casing wall in the tip gap were investigated (Figure 14).
Small protrusion in the tip gap and complementary gap in the blade tip region.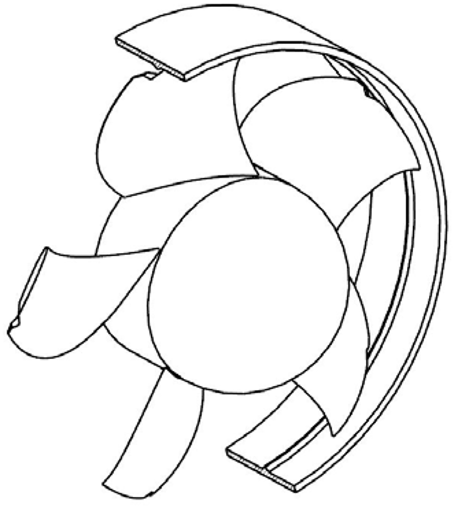
Figure 15 illustrates three variants investigated: The protrusion has either a rectangular (design A) or a triangular cross-section (design B). The latter was designed to further reduce the area of a possible contact with the blade tip. The clearance between casing and blade tip was large (s/d2 = 1.0%) but small between protrusion and blade tip (s′/d2 = 0.1%). Subsequently, this critical narrow gap was eliminated by a complementary notch in the blades (s″/d2 = 1.0%, design C). A LBM simulation with the protrusion design A at x/C
tip
= 0.75 for a fan operating point φ
opt
= 0.165 was conducted. The small tip clearance s′ is set to zero, which is in line with the previous numerical treatment of very small gaps. The LBM setup and the evaluation methods are exactly the same as for the fan without casing treatment in the previous section.
Casing treatment with a ring-type small protrusion in the tip gap (schematically); upper row left: protrusion with rectangular cross-section (design A), middle: with triangular cross-section (design B), right: with complementary notch in the blade tips (design C); lower: top view of blade tip and position of protrusion.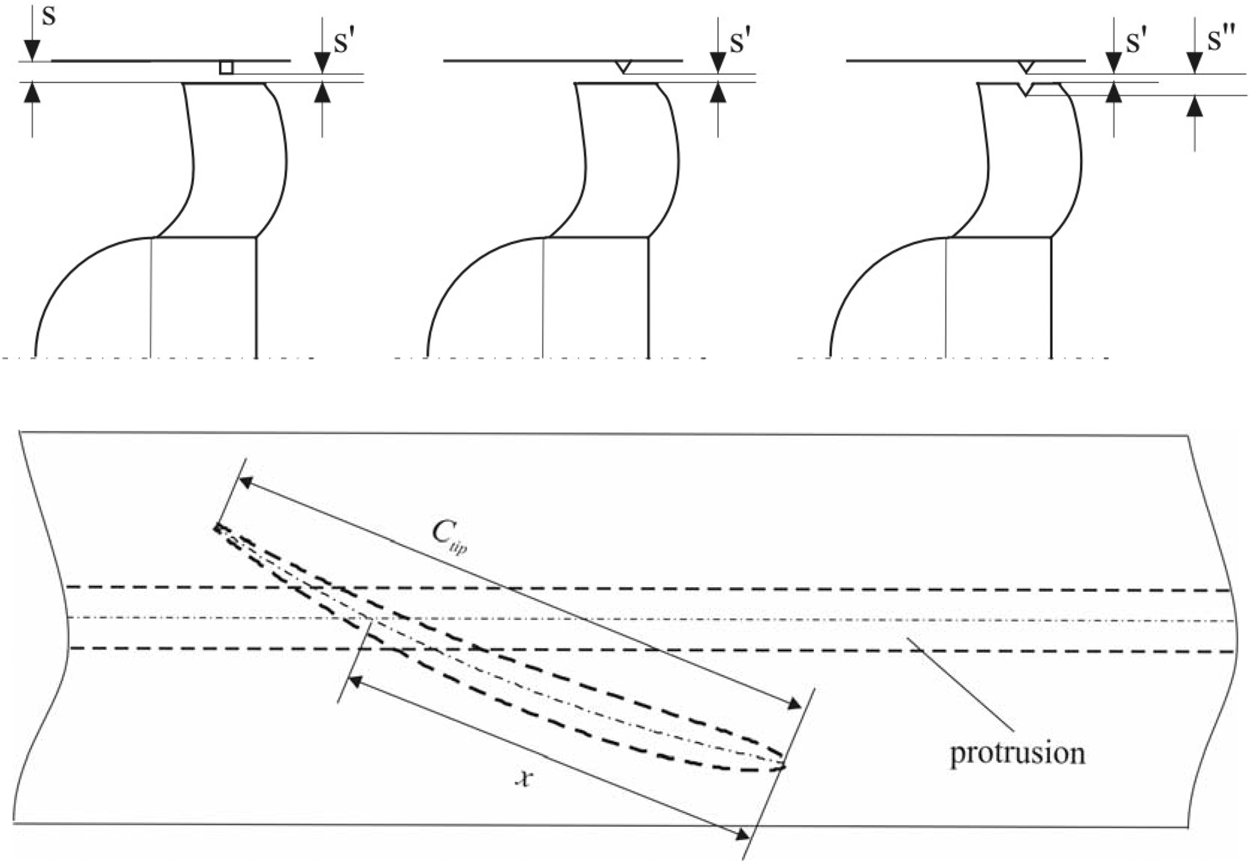
The LBM-predicted sound power spectra in Figure 16 indicate a beneficial effect of the protrusion. Obviously this protrusion substantially suppresses the generation of the tip clearance vortices as well as the global coherent flow structures interacting with neighboring blades. As compared to the untreated large tip clearance this results in considerably reduced wall pressure fluctuations on all blade surfaces, Figure 17, and hence a substantial reduction of far field sound emitted.
LBM-predicted sound power spectra; comparison between the untreated fan (Ref.) and with protrusion design A at x/C = 0.75 (φ
opt
= 0.165, bandwidth Δf = 5 Hz). BPF: blade passing frequency. Comparison of LBM-predicted wall pressure fluctuations on the blade surfaces without and with protrusion design A, φ
opt
= 0.165.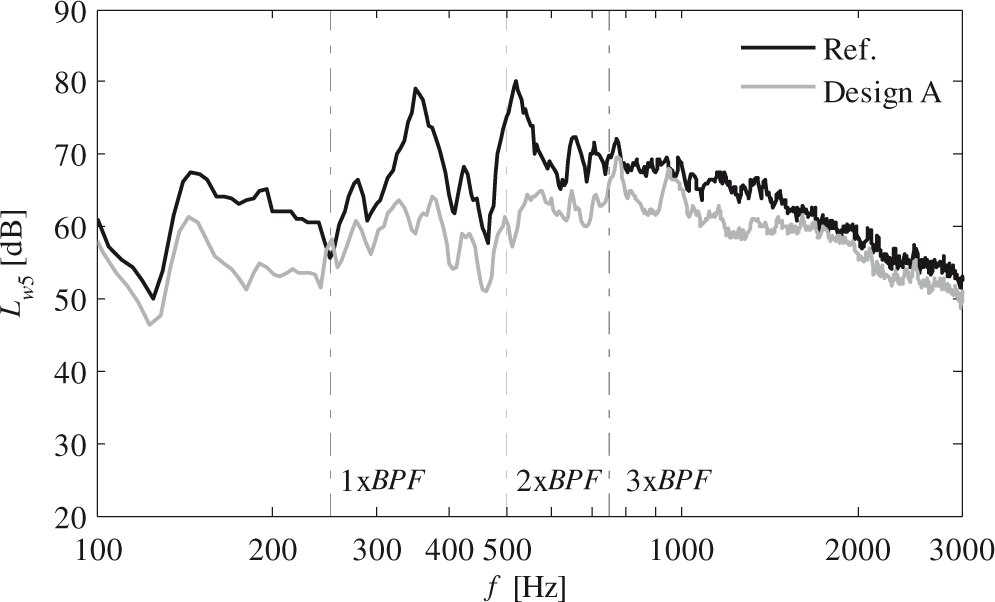
For design A, measurements of the overall performance curves, Figure 18, clearly support the results from the LBM simulation. The rectangular protrusion (design A) is superior and yields similar aerodynamic and acoustic performance as a small tip clearance s/d2 = 0.1% along the complete blade tip. The triangular protrusion (design B) has still a significant beneficial effect, irrespective of the additional notch in the blade tips (design C). Various positions of the protrusion in design A, with respect to the chord length C
tip
at the blade tip, were checked experimentally. The protrusion fixed at x/C
tip
= 0.75 worked at best.
Experimentally determined overall aerodynamic and acoustic performance characteristics; comparison between the untreated fan and the protrusion design A, B, and C at x/C
tip
= 0.75.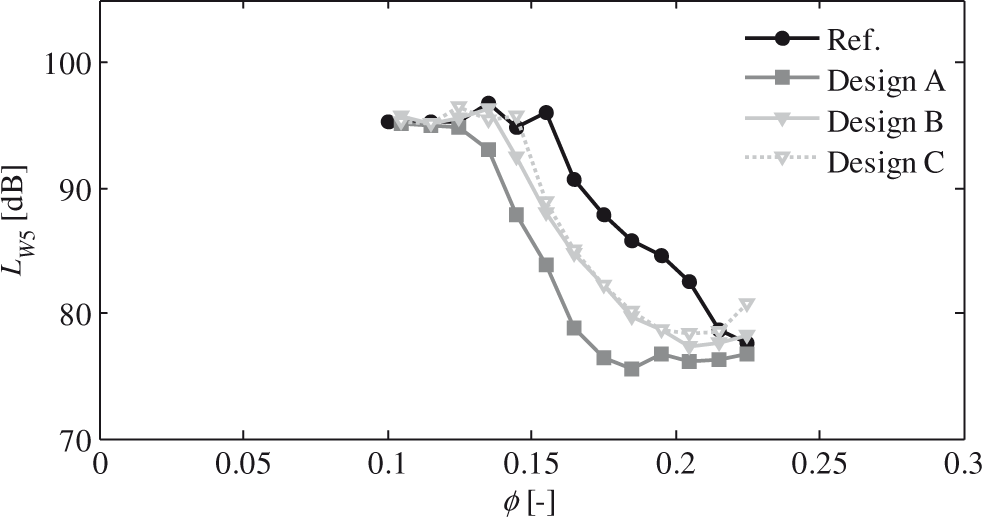
A comparison of the measured and predicted far field sound spectra, Figures 16 and 19, respectively, reveals that the trend is captured correctly by the LBM simulation. The quantitative agreement is good up to 1 kHz. A reason for the discrepancy above 1 kHz could be the chosen spatial resolution of the numerical grid in the tip and an overprediction of the upper limit of the resolvable frequency according to equation (11).
Measured sound power spectra; comparison between the untreated fan (Ref.) and the protrusion designs A, B, and C at x/C = 0.75 (φ
opt
= 0.165, Δf = 5 Hz). BPF: blade passing frequency.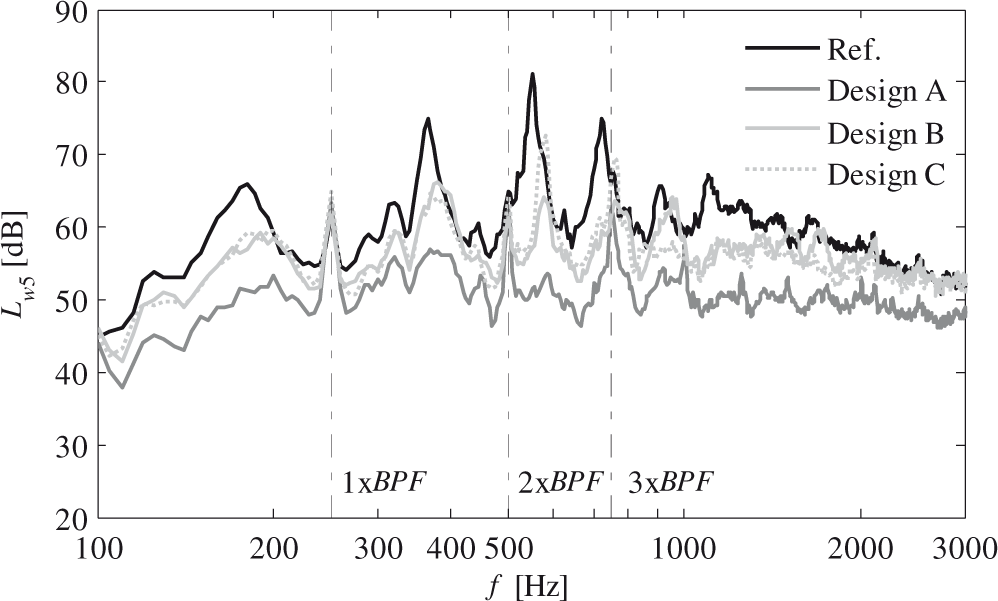
Conclusion
Objectives of the paper were the experimental and numerical quantification of the effect of tip clearance size and the analysis of a novel noise mitigation measure on the overall aerodynamic and aeroacoustic performance of an axial fan.
Experiments and numerical predictions confirmed the well-known fact that an increase in tip clearance not only degrades pressure rise and efficiency of the fan, but also increases the flow induced sound emitted by the fan significantly. The effect of a large tip clearance on the tip region flow field and the sound pressure spectrum is twofold:
The flow in the vicinity of the blade tip gap shows a clear structure of well distinguishable vortices. The vortices may extend through the complete blade passage up to the neighboring blade. The trajectory of the vortices is unsteady, and vortices may experience the well-known breakdown into small, “turbulent” structures before they hit the neighboring blade. A footprint of this unsteady flow is seen as fluctuating wall pressures on the inner casing wall and on the blade surfaces in the tip region. The larger the tip clearance is, the more pronounced are the wall pressure fluctuations and accordingly, the emission of broadband sound becomes more pronounced. If the tip clearance is large and if the flow rate through the fan is moderately reduced, compared to the targeted design flow rate, the local tip vortex systems of all individual blade tips form a global, circumferentially coherent flow structure. Shown in detail in Zhu
1
(but not in this paper) this structure can be understood as a superposition of circumferential modes of different mode orders that interact with the assembly of fan blades resulting in the distinct humps of sound pressure in the acoustic far field.
These findings suggested that for a fan with low tip clearance noise, the vortical flow structure of the tip clearance flow needs to be destroyed or at least reduced. Moreover, interaction of vortices of one blade with a neighboring blade has to be prevented. In applications where the blade cascade solidity is more or less fixed because of aerodynamic design requirements and a large tip clearance is unavoidable, geometrical modifications of the casing in the vicinity of the blade tips are potential strategies. By means of a simple rigid ring-type protrusion fixed to the inner casing wall, the generation of the tip clearance vortices as well as the global, slowly rotating coherent flow structures could be substantially suppressed. As a consequence, the acoustic signature of the fan became very similar to the one with the very small tip clearance. An additional complementary notch in the blade tips, by which the clearance even in the immediate vicinity of the protrusion could be kept large, degraded the positive effect of this measure only marginally.
All results were achieved by a combination of experimental and numerical flow simulation methods. Adequate simulation required a time-resolving method which could be applied to a computational domain that contains the complete rotor and not only one or two blade passages. The LBM proved to be a suitable tool. With a chosen spatial resolution believed to be appropriate for the goal of this investigation, the computational effort could be handled well by a medium-sized high performance computer cluster. There is, however, hardly any doubt that the accuracy of the prediction, especially at higher frequencies, could benefit from a finer spatial resolution—at the expense of computational effort.
Footnotes
Acknowledgements
This paper is dedicated to Dennis McLaughlin. He was an excellent host when the second author of this paper spent two sabbatical semesters (1998 and 2009) at Penn State University. The research done at Penn State turned out to be very influential on the subsequent work of this author and his students.