



Abstract
In this paper, the DBEM/Hybrid LES(Directly Boundary Element Method/Hybrid Large Eddy Simulation)technique is applied to predict the aerodynamic noise generated by tandem circular cylinders immersed in a three-dimensional turbulent flow. Utilizing the Lighthill's Acoustic Analogy, the flow pressure fluctuation near the surface of the cylinder is converted into acoustic dipole sources. Taking the dipole sound sources as the actual sound sources, the aeroacoustic field is simulated and analyzed by DBEM. The research shows that: The strong dipole sources are distributed in the collision zone of the downstream cylindrical surface, where the upstream cylinder's shedding vortex colliding to downstream cylinder surface. Both of the amplitude-frequency response and the phase-frequency response of dipole acoustic source are obtained, which is helpful for further research on aerodynamics noise interference and suppression. Good comparisons are obtained between numerical results and BART (Basic Aerodynamic Research Tunnel) experimental data published by NASA.
Keywords
Introduction
Aerodynamics noise has become an urgent problem that should be solved. In 1949, Lighthill 1 deduced the basic equations of aeroacoustics. Using Lighthill equation, Curle 2 derived the Curle equation considering the influence of static solid boundary in 1955. Then, Fwowcs Williams and Hawkings 3 extended Curle's study to the moving solid boundary by using generalized function method, and got the FW-H equation.
Numerical methods have become an important technology to solve the problem of aerodynamics noise. There are two ways to predict the aerodynamics noise: the CAA (Computational Aero Acoustic) and the LAAM (Lighthill's Acoustic Analogy Method) . Although CAA is the most accurate theoretical method for calculating acoustics, the huge resource consumption makes it impractical to directly predict the mid and far field noise without any turbulence model. The LAAM essentially decouples the propagation of sound from its generation, which reduces the requirement of computing resources. The LAAM can also be divided into two subcategories: the Lighthill acoustic analogy integral method and the hybrid method (CFD/FEM and CFD/BEM) . The Lighthill acoustic analogy integral method simulates the flow field first, then utilizes Curle’s integral equation or FW-H integral equation to calculate the sound radiation. Although the Lighthill acoustic analogy integral method is suitable for predicting the propagation of sound toward free space, it cannot be used for predicting the noise propagation inside ducts or wall-enclosed space. While the hybrid method transforms the transient results of the flow field into equivalent sound sources (monopole, dipole, quadrupole) first, then takes the dipole sound sources as the actual sound sources, and utilizes BEM or FEM (Finite Element Method) to predict the distribution characteristics of the sound field. Therefore it can more realistically simulate the actual aerodynamics noise problem in engineering. Taking Helmholtz boundary integral equation as the control equation, the hybrid CFD/BEM converts the problem into algebraic equation by discretizing the boundary element. This method is computationally efficient by reducing the order of the computational dimensions by one. As the differential operator used in BEM can automatically satisfy the condition of infinite distance, it is particularly more advantageous for dealing with unbounded domains with high accuracy than the hybrid CFD/FEM method. Furthermore, the hybrid CFD/BEM allows a separation of sound generated from different flow regions, and is suitable to predict the radiation, scattering and acoustic transfer, as well as the acoustic response.
The hybrid CFD/BEM method gets more and more attention from experts and scholars. As the numerical solution of Lighthill equation must ensure that the characteristics of sound source are correctly expressed in the discrete equation (4), Khalighi, Mani and Ham et al. developed a computational aeroacoustics method based on BEM to solve the Lighthill equation (5). Croaker, Mimani and Doolan et al. A hybrid simulation technique to identify aeroacoustic sources is presented by combining CFD/BEM with aeroacoustic Time-Reversal.4–6 Using the hybrid LES/BEM, Eltaweel and Wang investigated the generation of broadband as well as tonal noise in a rod-airfoil flow field. 7 On the other hand, the acoustic boundary conditions are determined by the features of near-field turbulent flow. As the sounds have much lower energy than fluid flows, it is difficulty to catch the very flow phenomena in the near field that are responsible for generating sounds. Therefore, the numerical simulation of flow field is still concerned. The interaction of a bluff body with a vortex wake is studied by Leclercq and Doolan. 8 Itoh and Himeno employed the finite difference method combined with the overlapped grid technique to catch the flow interference between the two tandem cylinders in three-dimensional fluid flow. 9 AlQadi, Al-Bahi and Wolfgang et al. utilized the LES to analyze and describe complex 3 D flow around two circular cylinders in tandem placed in an open channel. 10 Weinmann, Sandberg and Doolan investigated the performance of a novel hybrid RANS/LES methodology for accurate flow and noise predictions of the NASA’s tandem cylinder experiment. 11 Numerical investigations using Scale Adaptive Simulation (SAS) turbulence model were carried out to study the flow around a circular cylinder near to a plane boundary by Grioni, Elaskar and Mirasso. 12
A series of aeroacoustics experimental (and numerical) programs about the flow field of tandem circular cylinders at high Reynolds number have been conducted by NASA(National Aeronautics and Space Administration): The BART and QFF (Quiet Flow Facility) at NASA Langley Research Center. 13
For the tandem cylinders flow field, the separation distance between the cylinders and consequently the gap flow affects the mean and unsteady wake structure as well. The separation distances can be divided into three categories: short, medium and large separation. For short separations (L/D < 2.4), the two cylinders behave as a single bluff body with vortex shedding only occurring at the rear cylinder. For large separation distances (L/D > 3.8), vortex shedding occurs on both cylinders with the same characteristics as a single cylinder. At the intermediate (critical) separation distances (2.5 < L/D < 3.8), the flow between cylinders is bistable and switches between intermittent shedding and constant shedding.14,15 On the other hand, the effects of Reynolds number variation (ranging from subcritical to supercritical regimes) on the flow field indicated that the critical spacing L/D was found to be somewhat fixed between 3.5 and 3.8. 16 The rms pressure distribution on the rear cylinder shows a more prominent dual peak structure at higher Reynolds number in this critical space, which determines the sound source distribution on the surface of the cylinder. For the case where the cylinders were placed 3.7 diameters apart (center-to-center), both cylinders just exhibit prominent vortex shedding in their wakes.13,17
In order to study the effect of the upstream cylinder’s shedding vortex on the distribution of dipoles near the downstream cylinder surface and obtain the dipole distribution at the critical Reynolds number, a turbulent flow field of tandem cylinders with separation distances (L/D = 3.7) is presented in this paper. The DBEM/Hybrid LES technique is applied to predict the aerodynamics noise in this turbulent flow field. The numerical aeroacoustic analysis results are compared with BART experimental data previously published by NASA.
Theories and methodology
The hybrid RANS/LES model formulation
A vast majority of industrial flows are turbulent. However, due to the excessively high-resolution requirements for wall boundary layers in the turbulent flow, the LES had very limited impact on industrial simulations. 18 The hybrid LES model achieves in the simulation of high Reynolds number flows by modeling the attached and mildly separated boundary layers in RANS mode and then switching to LES mode for separated (detached) shear layers. One of the more famous models is the DES (Detached Eddy Simulation) with the SST k-ω Model. The SST (Shear Stress Transport) got a major improvement in terms of flow separation predictions by introducing transport effects into the formulation of the eddy-viscosity, and its superior performance has been demonstrated in a large number of validation studies. 19 The DES allows vortices to generate smaller eddies down to the available grid limit relying on a strong enough flow instability. In this way, it is beneficial not only in predicting the correct mixing behind the bluff body but also in extracting spectral information for acoustic simulations.
In fact, once the turbulence model is introduced, both the RANS and LES momentum equations are formally identical. The only difference is the size of the eddy-viscosity provided by the underlying turbulence model. Therefore, if the eddy viscosity in LES zone is reduced properly, the turbulence model can be switched from RANS model to LES model without any formal change to the momentum equations in the DES model. In other word, the DES model can be derived from a RANS model by modifying the length scale appropriately. That means that the only term which needs to be modified is the dissipation term of the k-transport equation (The ω-equation remains unmodified) for the DES turbulence models:
20

Where,
If
Boundary element method (BEM)
The BEM is powerful for exterior problems in the free field, such as sound radiation and scattering problems.
21
Its basic equation is Helmholtz equation:

Where,
The above equation can be transformed according to the Green’s theorem as follow:

Where
Introducing observation point p and source point q, the boundary integral equation is given as:

Where,
The above formula indicates that sound pressure at an arbitrary point is determined by sound pressure and its normal derivative on all boundaries. In order to solve the boundary integral equation numerically, a discretized equation is given by collocating the observation point p at each node on the boundary. Then equation (4) is discretized as follows:
21

Where
It can be seen that DBEM represents the boundary value problem of a given domain by the integral equation of boundary interface surrounding the domain, thus reducing the spatial dimension of the problem. The field variables at any point in the domain can be obtained by linear superposition of the action of generalized field sources. In addition, as it is only discrete on the boundary and the discretization error is only come from the boundary, the BEM has a higher computational accuracy.
Acoustic source boundary conditions in BEM
When rigid surfaces are present in the flow, the solution to the Lighthill equation (FW-H equation) can be written as:

In this equation, □
2
is the wave operator in three dimensional spaces; the surface is described by
The first term on the right of the equation is regarded as dipole source term, and the second term is the quadrupole volume source term. As the acoustic radiation from low Mach number turbulent flows is normally of very low level, the quadrupole volume sources is neglected in this paper.
Computational details
Geometry and grid topology
The numerical flow domain model was established to simulate NASA's BART experiment. The flow domain is cube in shape, with a height of

Flow domain figuration.
The aerodynamics noise generated by tandem circular cylinder immersed in a turbulent flow is studied here. The free stream velocity was set to 144 ft/s (44 m/s,
Summary of average results from three computational grids and comparison with experiment.

The whole calculation basin is divided by hexahedral grid, including 31 blocks and 4.436 million mixed cells in Grid 2. There are 120 nodes along the circumference of each cylinder. In order to capture the complex unsteady flow wave, the nearly isotropic element spacing is distributed in the wake gap area between the cylinders, and 85 nodes are used in the spanwise direction for a span of 2.7 D in this domain. At the inlet the velocity boundary conditions are used, and the pressure boundary conditions are used for the outlet. The lateral boundaries ware treated as a frictionless rigid wall, i.e. symmetry conditions were applied, and the cylinder walls and the upper and lower surfaces set as the no-slip condition. As the Ma
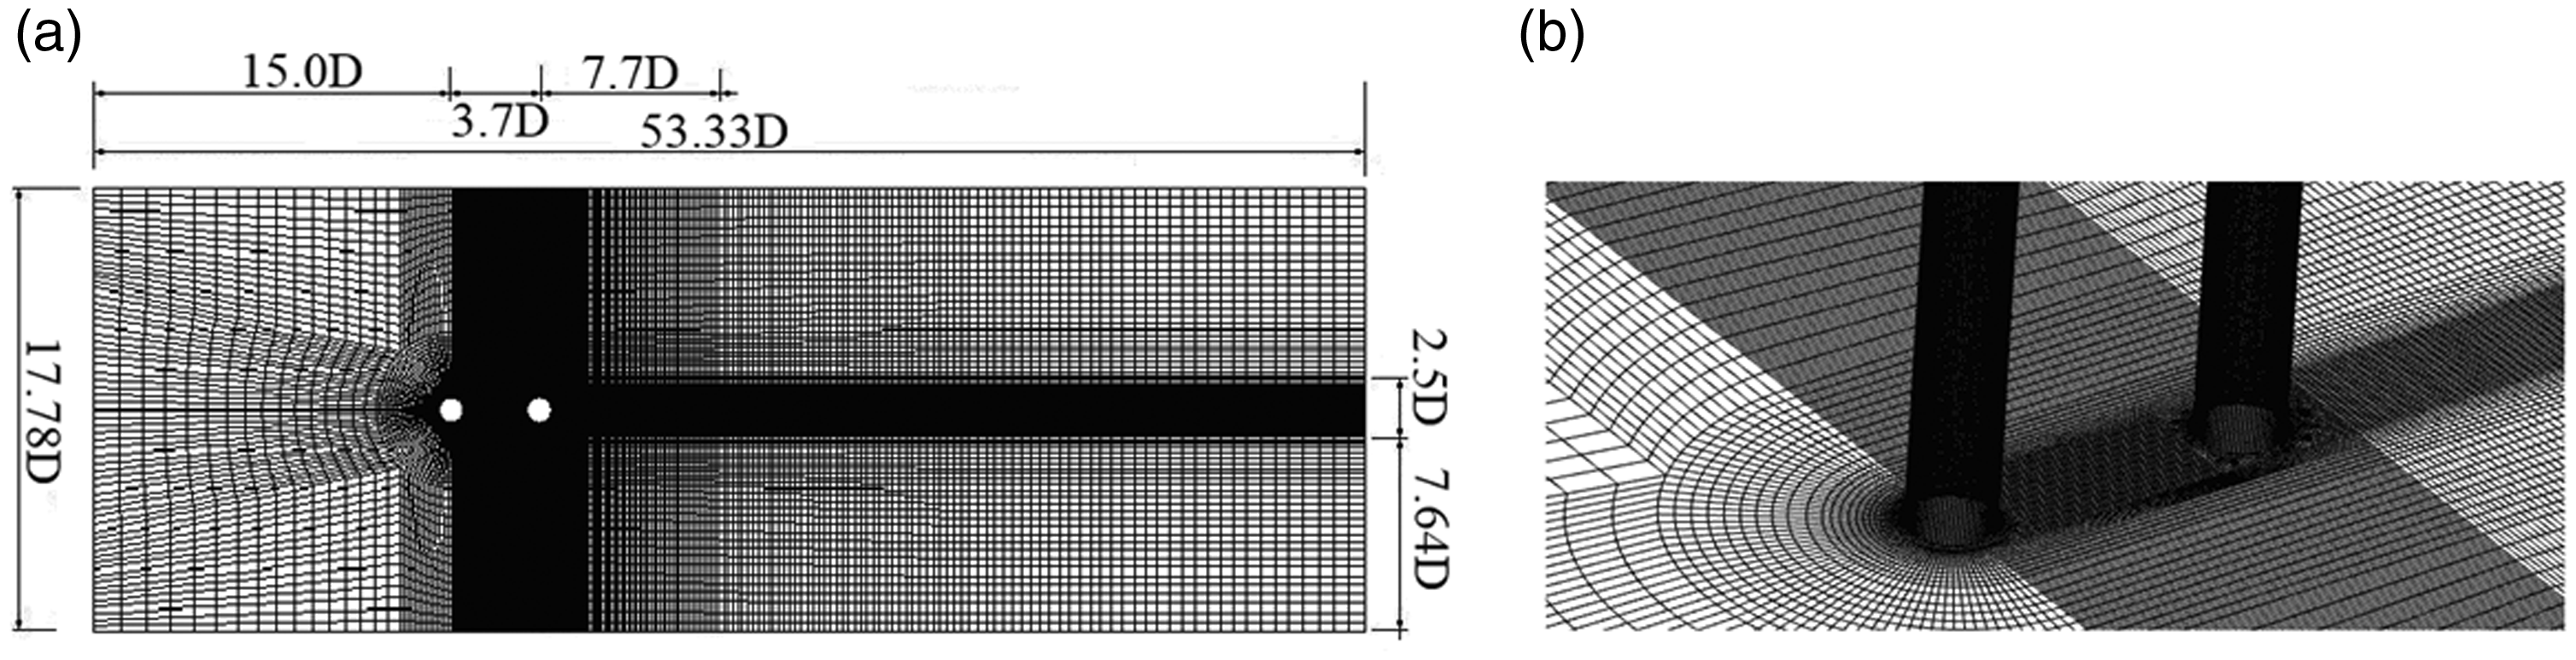
Computational Grids.
Three-dimensional numerical turbulent flow field
In this paper, the three-dimensional incompressible N-S equation is used as the governing equation in FLUENT. The DES with SST k–ω RANS model is utilized as viscous model, and the PISO scheme is used for pressure-velocity coupling. The second order central difference scheme is applied to the spatial discretization of pressure equation, and the bounded second order implicit is used for the transient formulation. In order to improve the calculation efficiency, the steady flow field is simulated by using the k-ε viscous model first. After 2000 steps of iteration calculation, both the drag coefficient Cd and lift coefficient Cl tend to a constant value, indicating that the flow field is close to a steady state. Then utilizing the results of steady state as the initial conditions, the DES with SST k–ω Model is utilized to simulate the turbulent flow field. Considering the complexity of the circumferential flow field of two tandem circular cylinders, a small time step should be chosen to capture details of the flow as much as possible. Meanwhile, as the frequency of interest is less than 5000 Hz in this paper, the time step is set as 0.0001 s according to the Nyquist Sampling Law.
The time average (mean) and rms value of the fluctuating values sampled are investigated by using the method of data sampling for time statistics. The mean static pressure and mean streamwise velocity on

Mean static pressure and Streamwise velocities on plane (y/h = 0.5).
The time average varies for pressure coefficient on the upstream and downstream cylinders is shown in Figure 4. The dimensionless pressure coefficient is adopted for the surface pressure:


Mean pressure coefficient on cylinder’s surface.
Where,
The rms value of the surface pressures for the upstream and downstream cylinders is shown in Figure 5(a) and (b) respectively. The simulation reproduces overall trends which is in good agreement with the QFF test results, but under predicts the peak amplitudes on the downstream cylinder. The comparison is much better for the upstream cylinder and the peak fluctuation amplitude matches well with the BART data. As mentioned before, the rms pressure distribution on the rear cylinder will show a more prominent dual peak structure at higher Reynolds number in this critical space (the D/L is set to 3.7 in this paper). Figure 5(b) shows the prominent dual peak structure, which corresponds to the collision zone (

Root-mean-squares (rms) of the fluctuating pressure coefficient on cylinder’s surface.
The mean velocity along the centreline
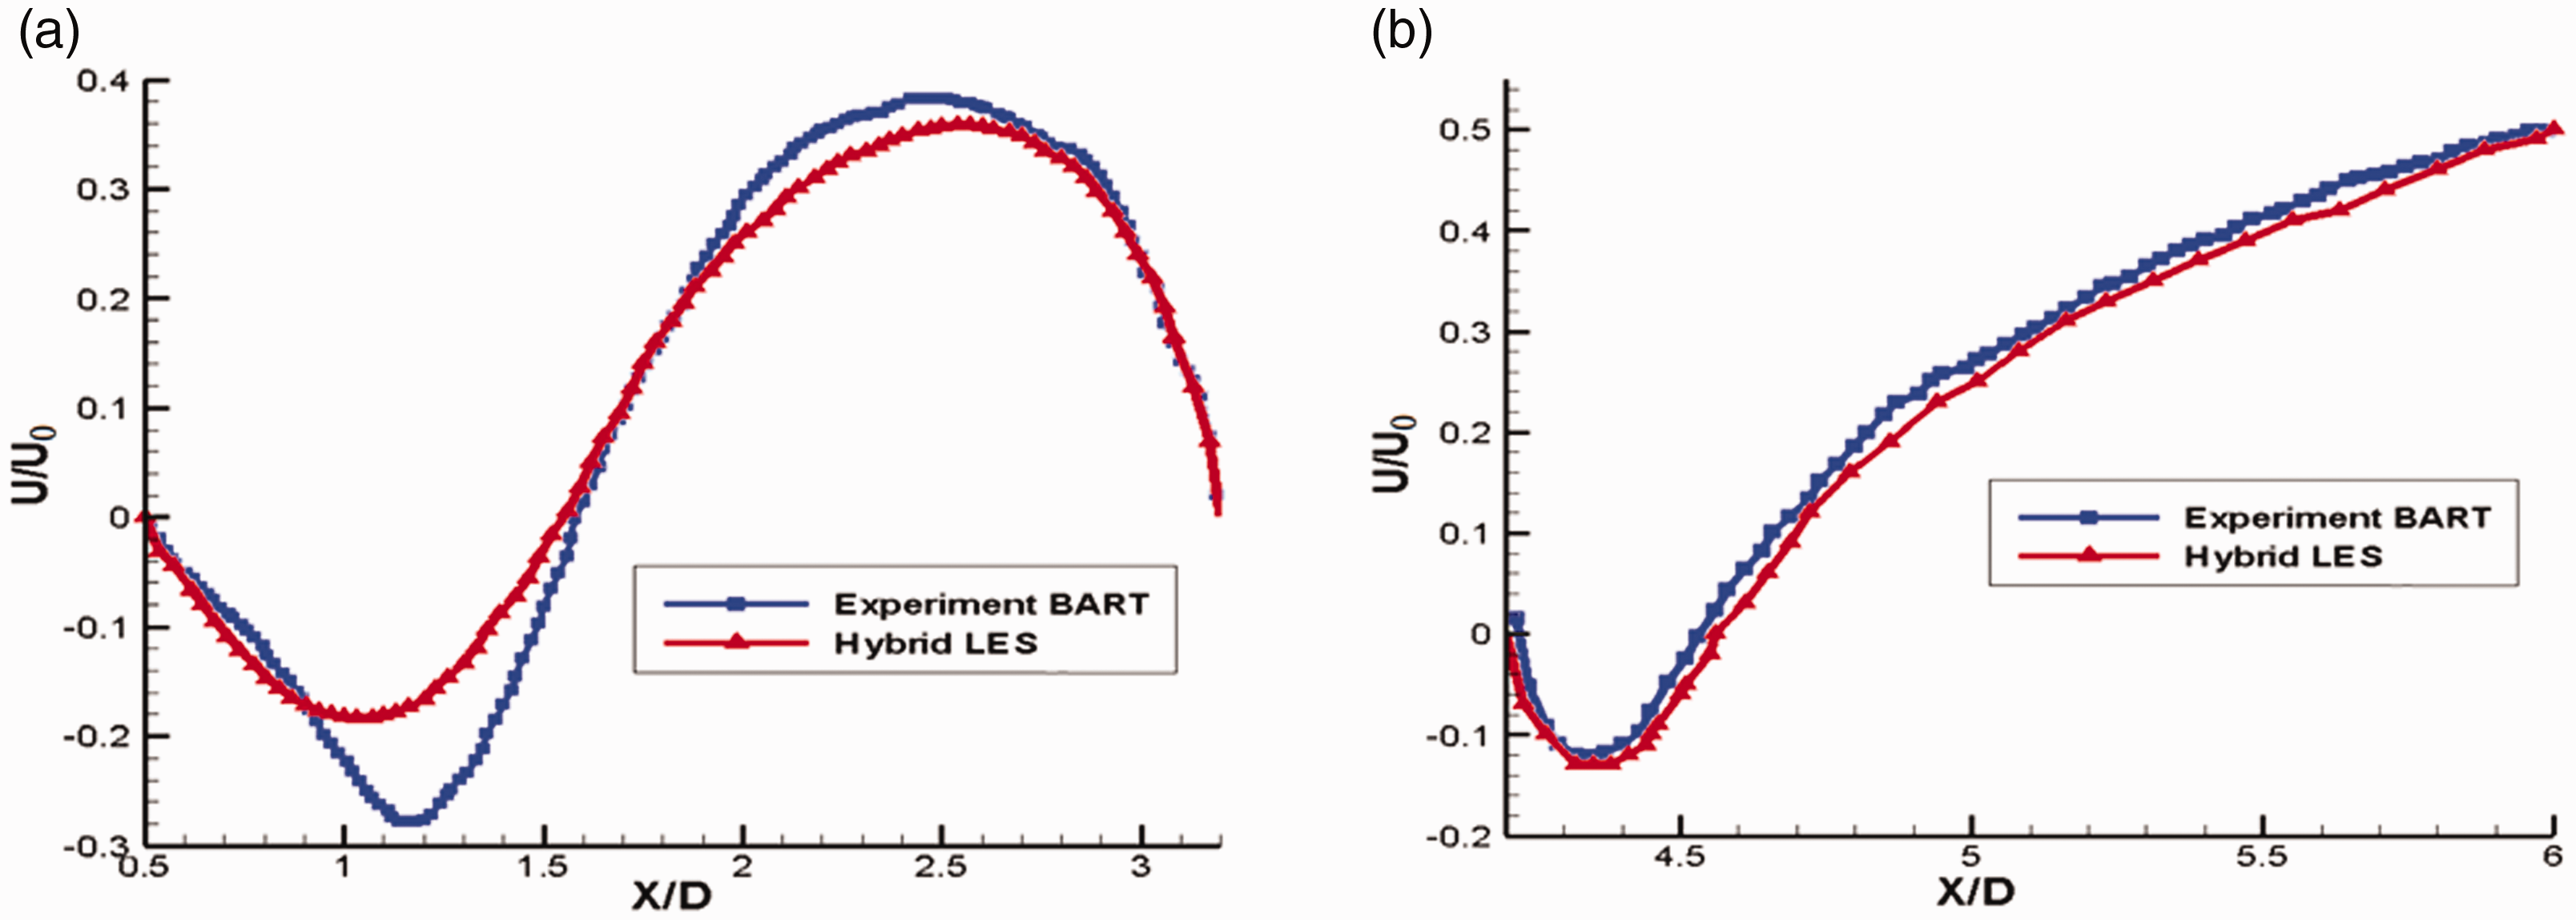
The mean velocity along the centreline (
Another 2000 time steps are carried out to collect flow statistics, and the sampling time interval is 0.0001 s with totaling 2000 samples. The receivers are set to be three points (A, B and C), which located with respect to the center of the upstream cylinder. These microphones are equidistant from the point E (9.11 D, −2.4 D), just as shown in Figure 12. The location of the receivers is listed as Table 2.
Location of the receivers (with respect to the centre of upstream cylinder).

Distribution of dipole acoustic source boundary
The acoustic source grids are used to set up boundary conditions for aeroacoustics sources in the DBEM. The scale of the sound source grid is determined by the upper limit of the analyzed frequency to meet the accuracy requirement of the highest calculated frequency. Only could the scale of grids be limited to less than 1/6 of the corresponding acoustic wavelength of the upper limit frequency, can the reliability of calculation results be guaranteed. 22 In this paper, the upper frequency limit is set to 5000 Hz, so as long as the scale in the sound source grid is less than 68 mm, it can be considered reasonable, and the size of the sound source grid on the cylinder and adjacent walls is set to 9 mm. According to theories of Lighthill and Williams-Hawkins, the fluctuation pressure of flow near the wall is converted into sound source boundary condition in the BEM by equation (8). After converting the time-domain pulsation signal into frequency-domain signal by FFT, the frequency can be obtained by equation (9).
the fluctuation pressure of flow near the wall is converted into sound source boundary condition by equation (8)


Figure 7 presents the distribution of dipole sound source on the wall surfaces at 170 Hz. It can be found that the dipoles are mainly distributed on the surface of the tandem cylinders. The SPL (Sound Pressure Lever) of dipole sound source is relatively high in the middle of the cylinder surface. The maximum SPL of dipole source on the surface of cylinders is 144.2 dB, shown as in Figure 8.
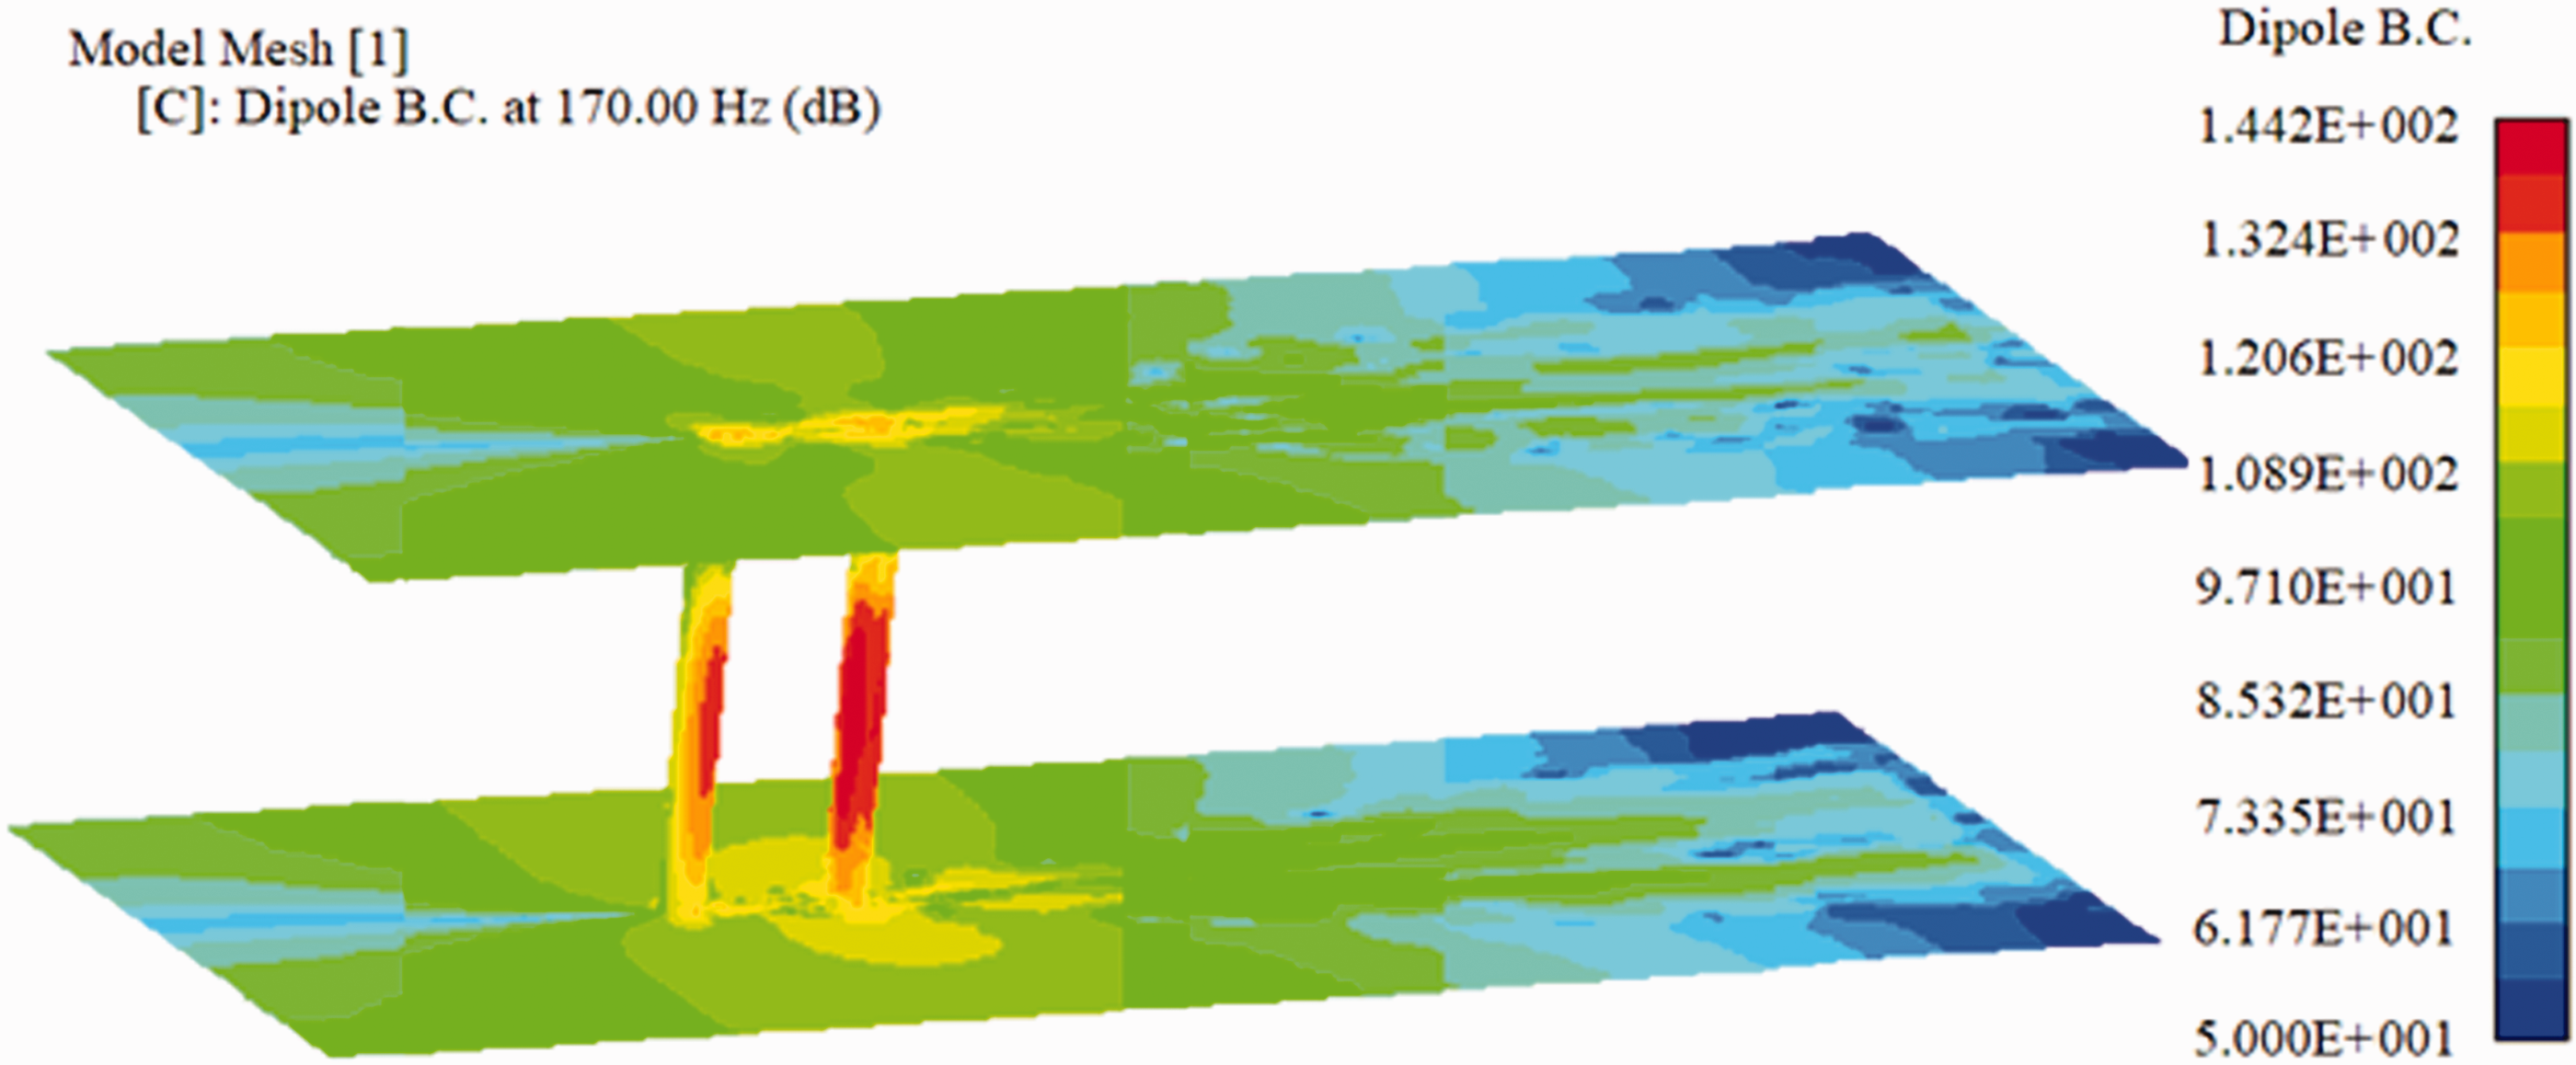
Dipole source distribution on the wall surfaces at 170 Hz.

SPL of dipole source on cylinders at 170 Hz.
The distribution of amplitude and phase for dipole source on the surface of upstream and downstream cylinders (170 Hz) is shown as Figure 9, and the mean SPL of dipole sound source at 170 Hz is presented as Figure 10. The unsteady flow in the gap zone has a strong impact on the turbulent shear layer of downstream cylinder. The shedding vortexes appear alternately on the upper and lower surface of the upstream cylinder. Then the shedding vortex flows downstream and reattaches on the downstream cylinder, which causes the shedding vortexes to appear alternately on the surface of the downstream cylinder, and transport downstream to diffuse and dissipate. The vortex shedding from the shear layer of the upstream and downstream cylinder is opposite, which indicates that when the vortex sheds from the shear layer on the upper surface of the upstream cylinder, the vortex of the downstream cylinder sheds from the lower surface. Therefore, the pressure fluctuation of the downstream cylinder surface is much stronger than that of the upstream cylinder, and the SPL value of dipole source is between about 129 Hz and 144 decibels on the downstream cylinder surface. The SPL peak zone of dipole source on the upstream cylinder corresponds to the vortex shedding zone (
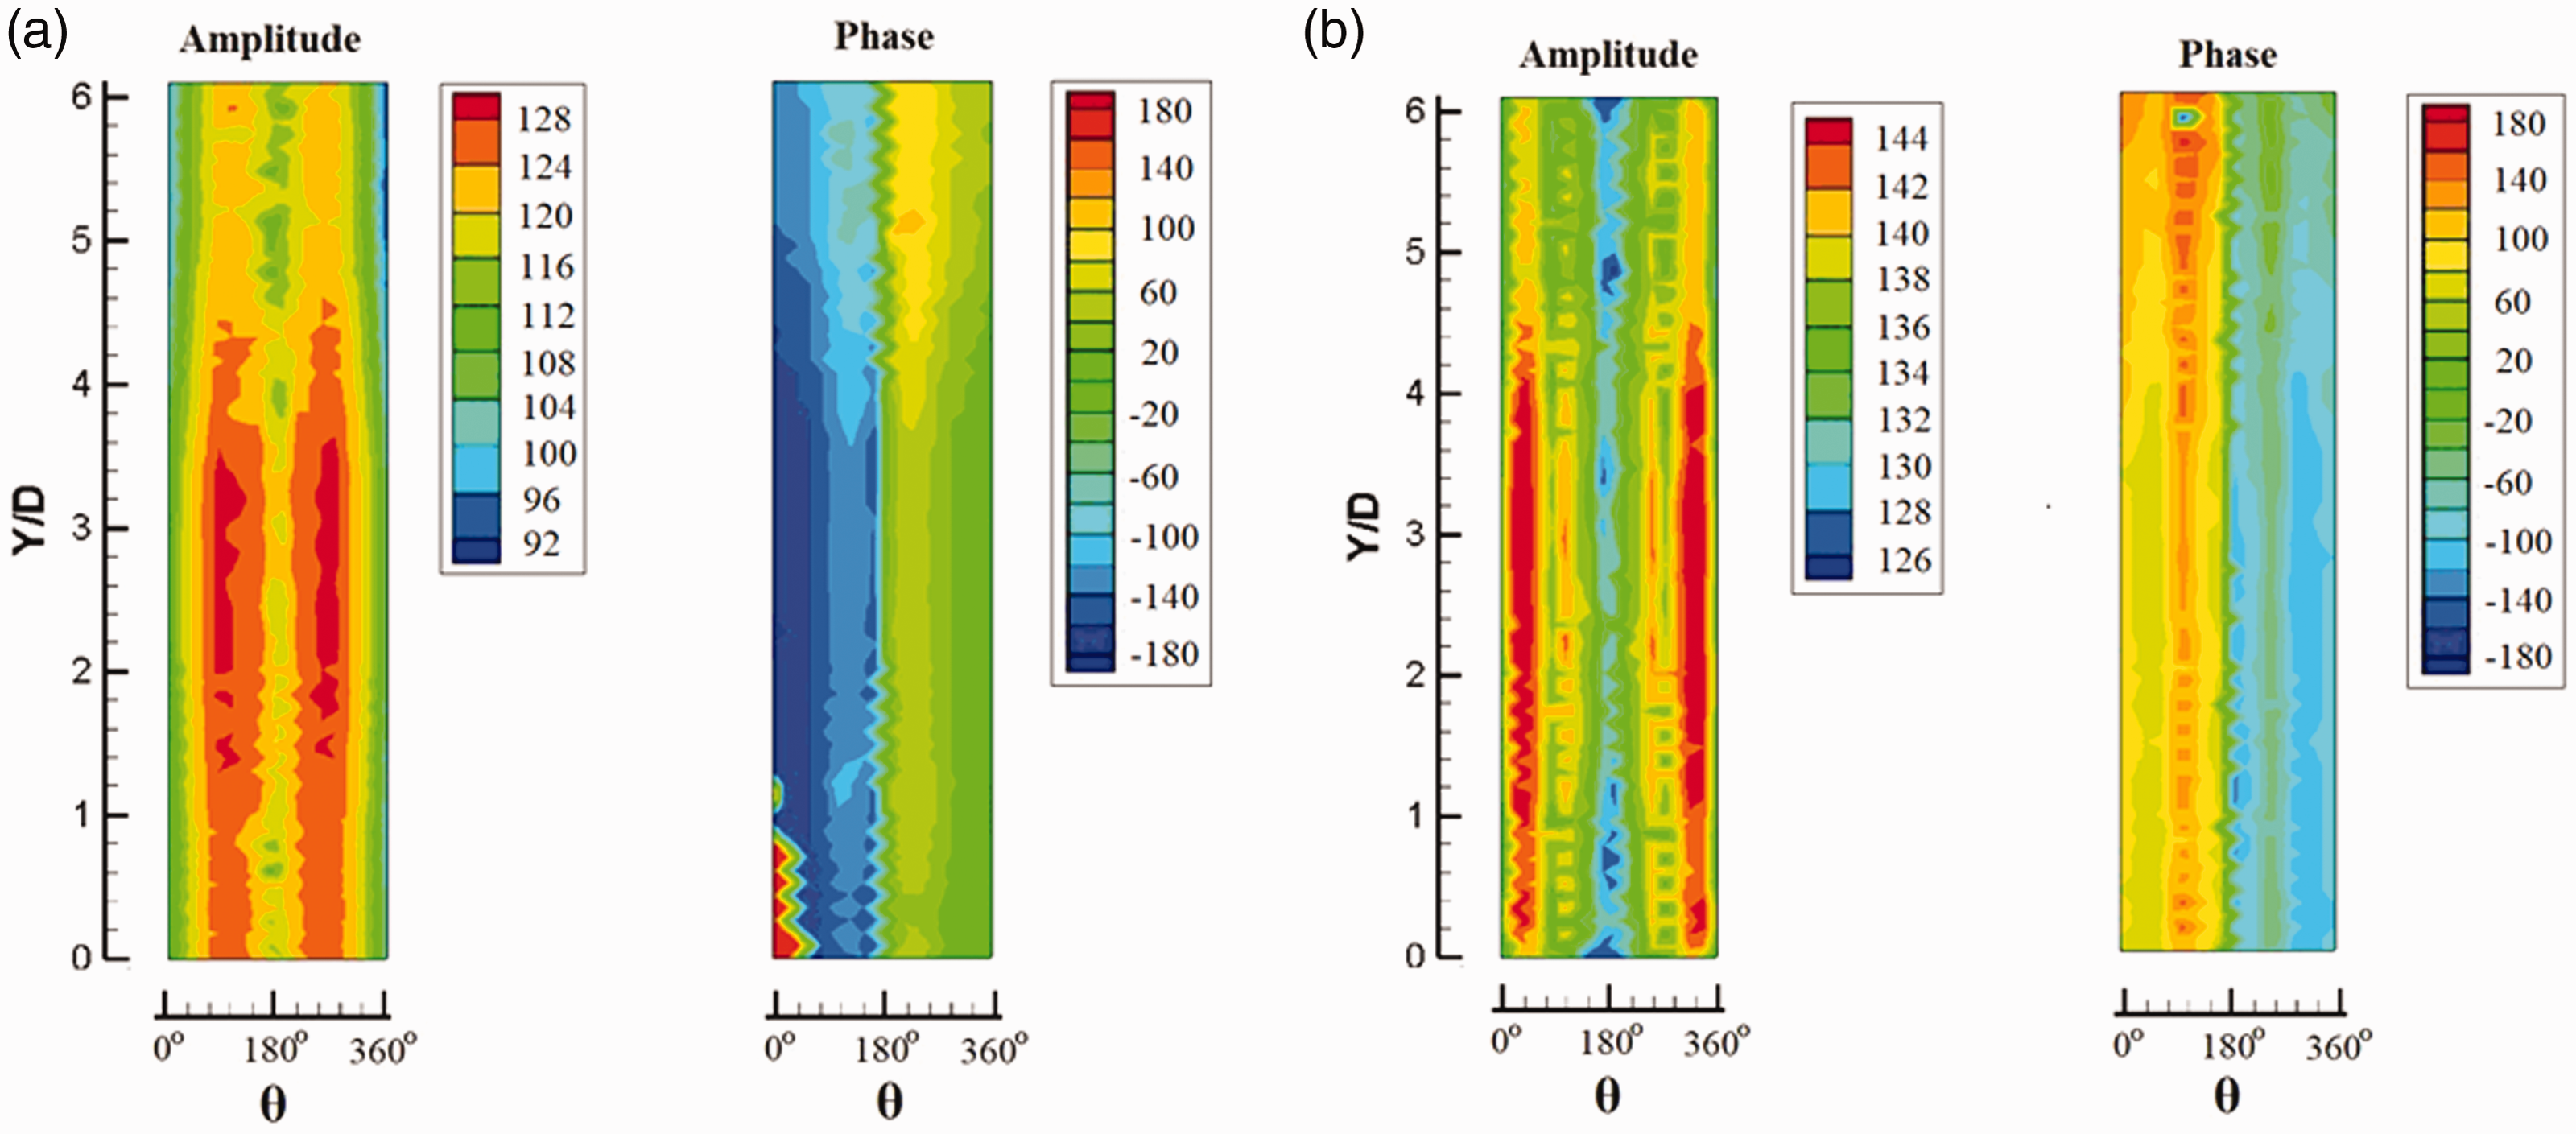
Amplitude and phase of dipole source on the surface of cylinders at 170 Hz.
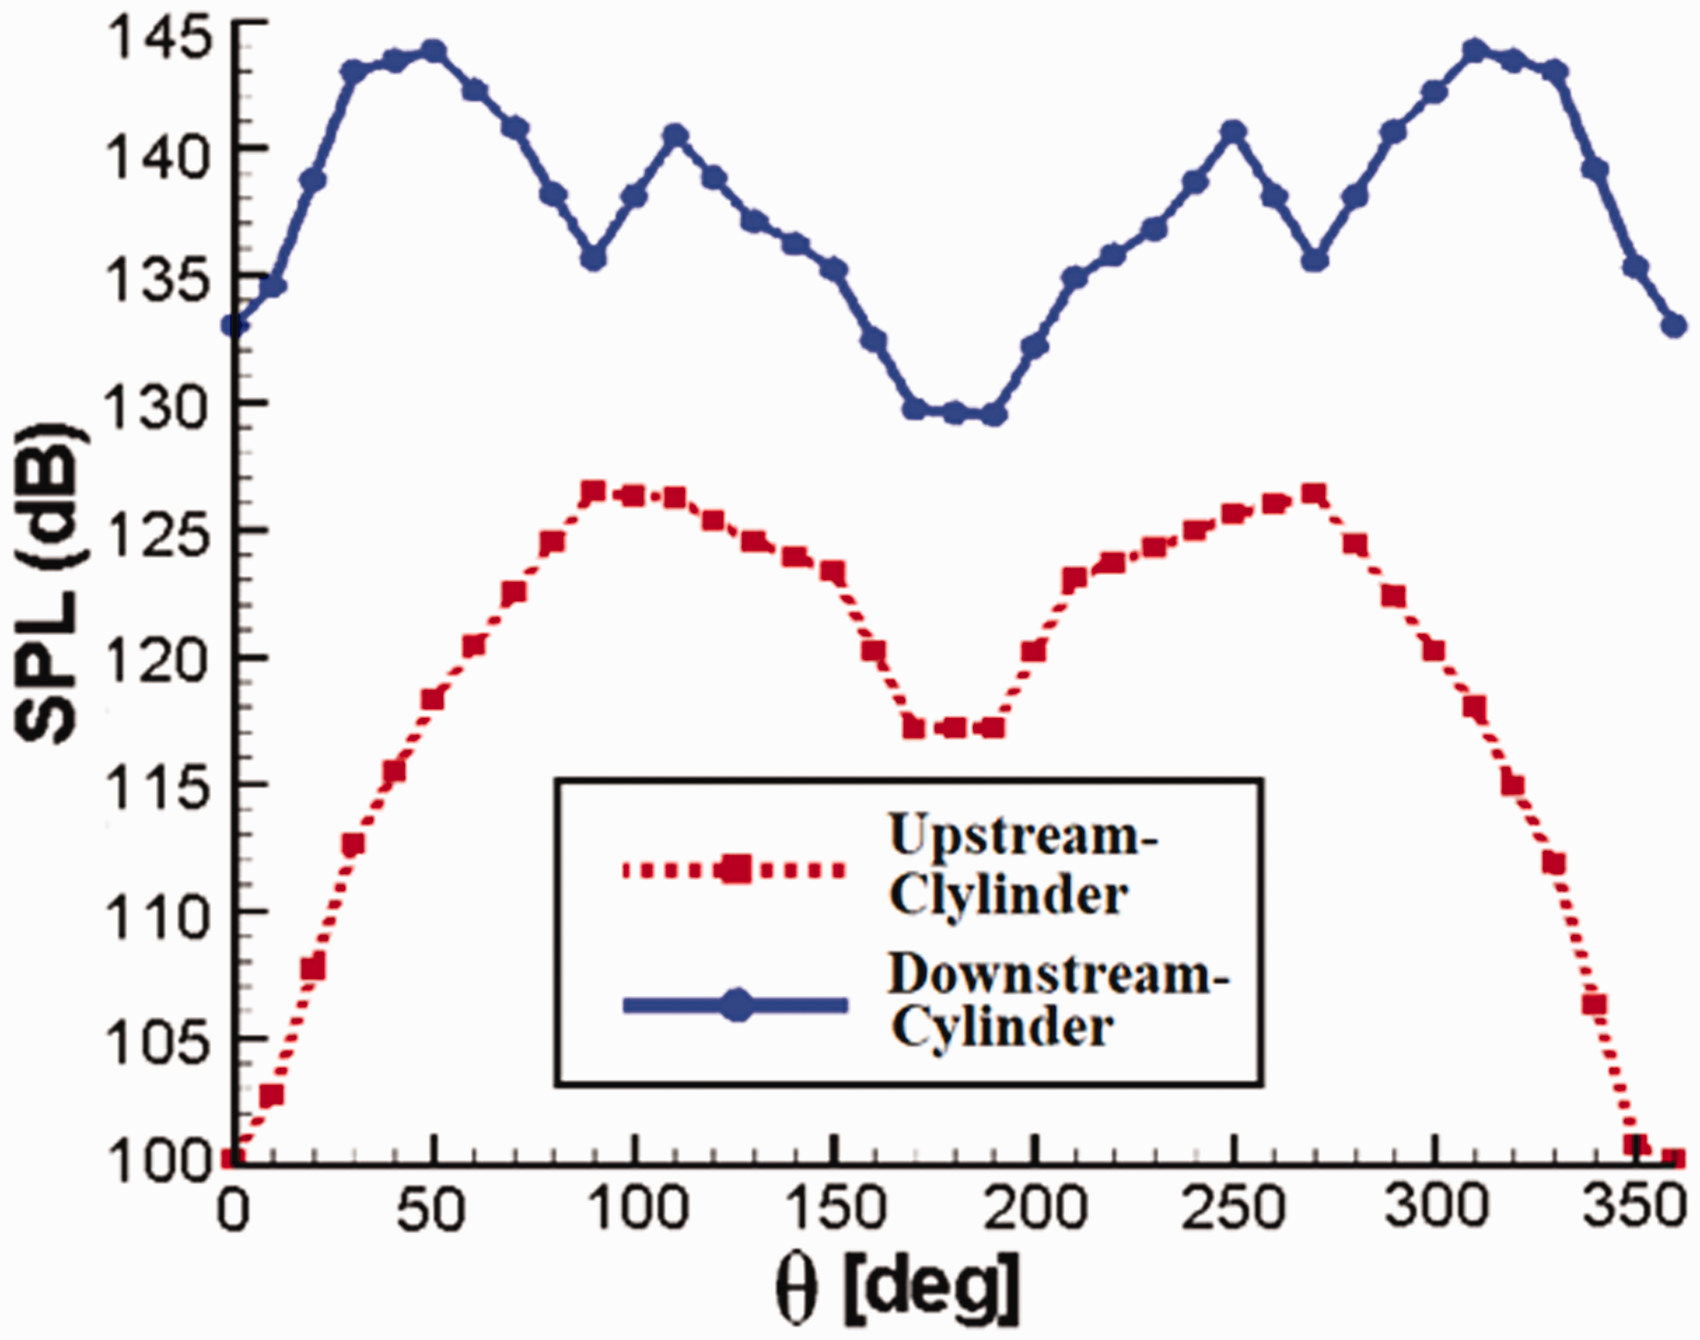
Mean SPL of dipole source around the surface of cylinders at 170 Hz.
Aerodynamics noise radiation field
As the NASA’s BART experiment is a low Mach number experiment with rigid surface of cylinders, both the quadrupole sound source term and the monopole sound source term can be ignored, which means that the dipole is the only aerodynamic sound source in this paper. Taking the dipole sources on the surface of cylinders as the actual sound source, the BEM is employed here to simulate the aerodynamic acoustics radiation field. The amplitude and phase of sound pressure in acoustic radiation field (
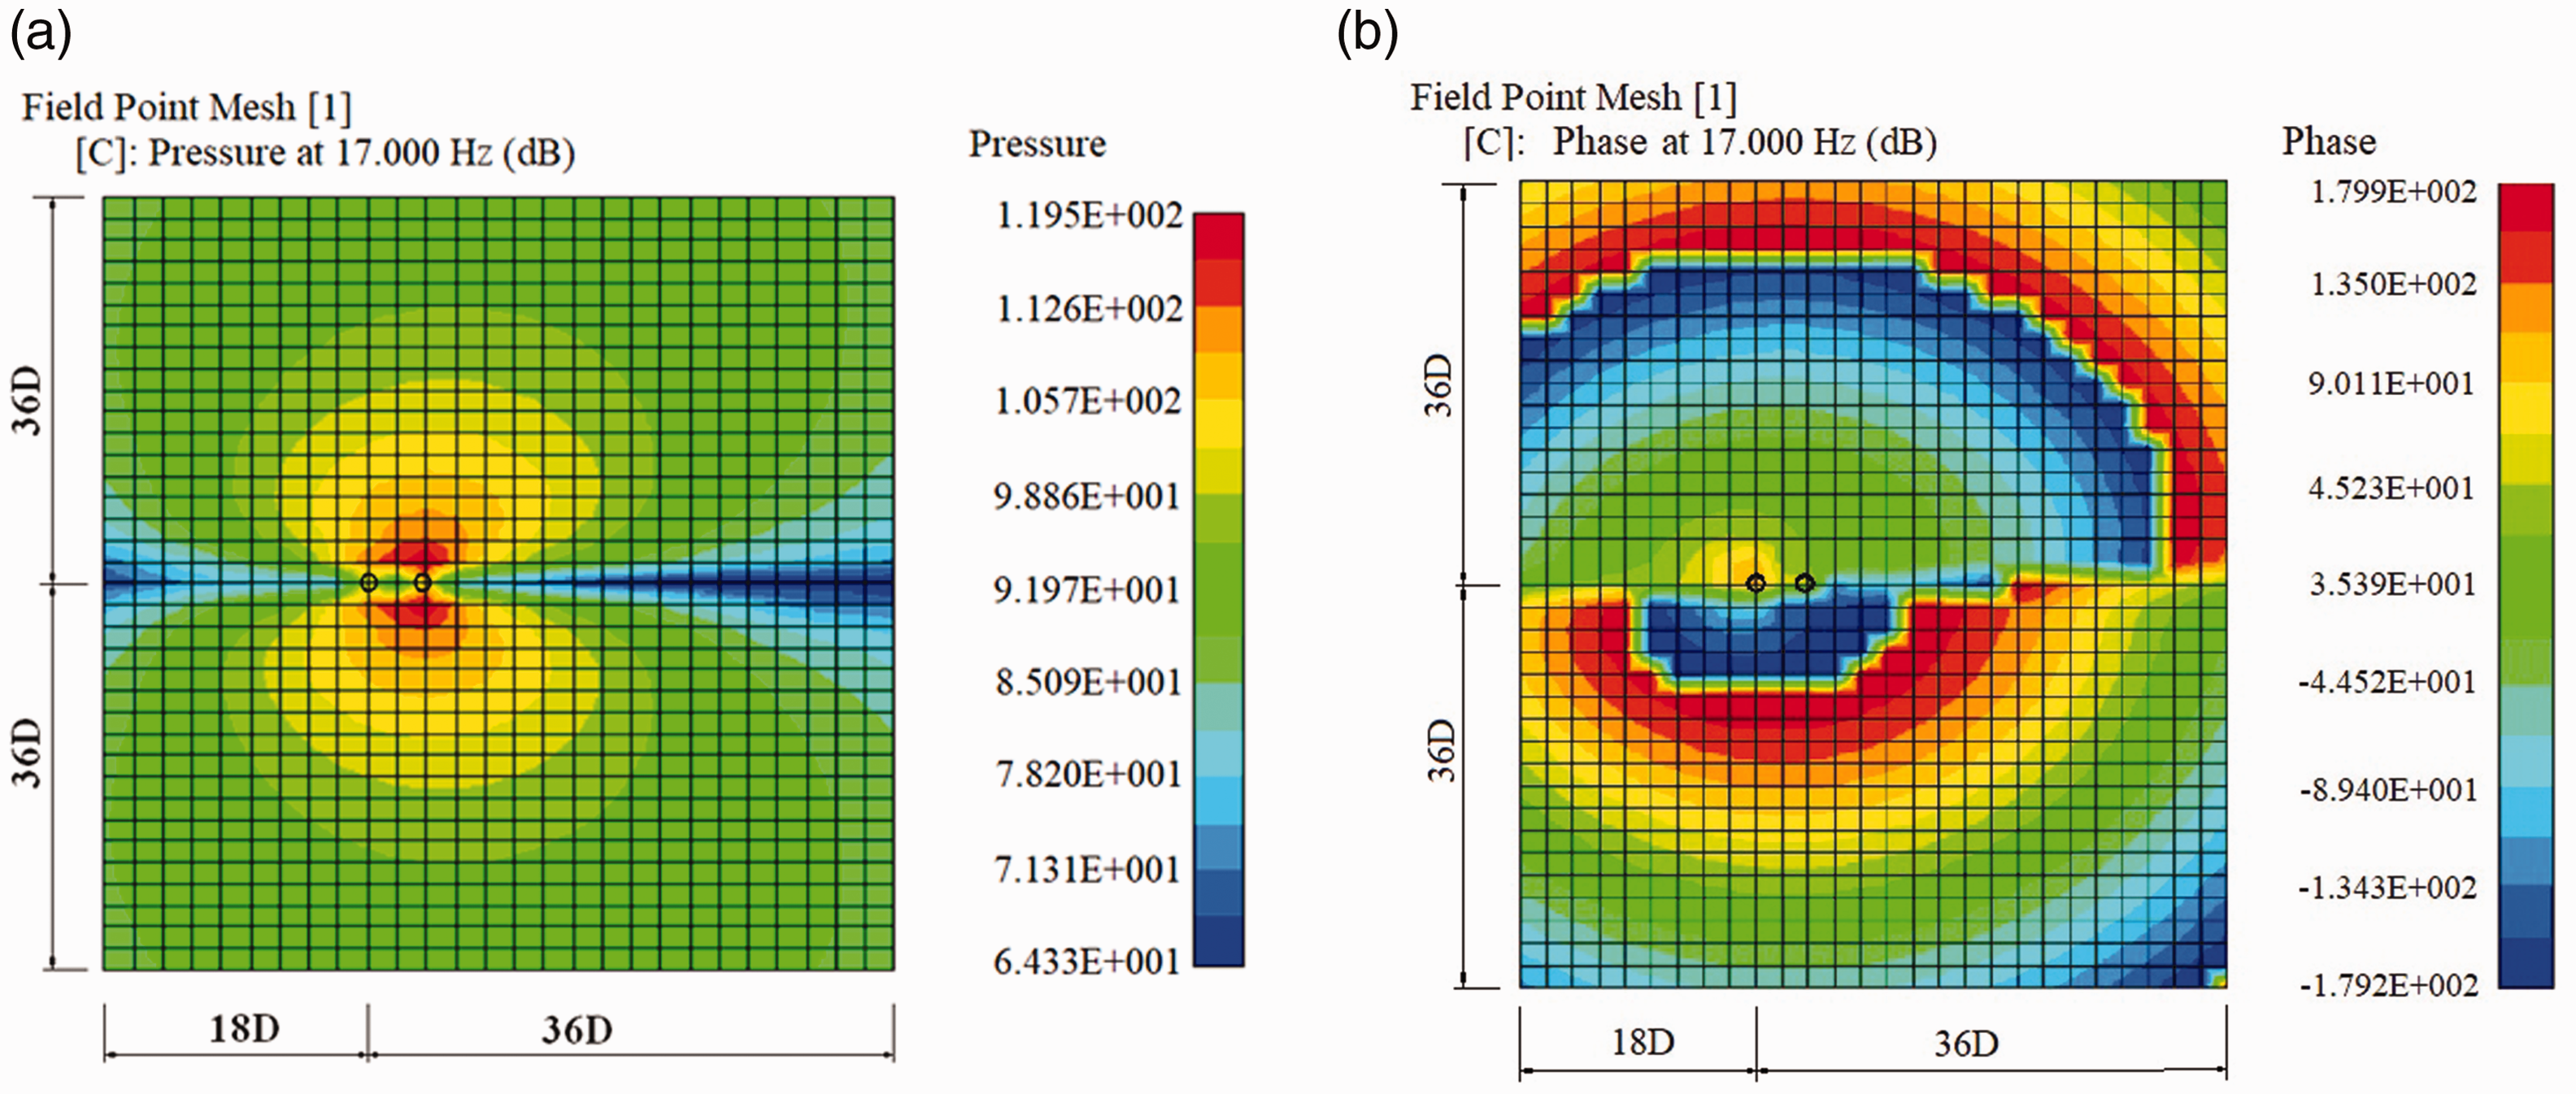
Acoustic field Pressure on y = 0 plane at 170 Hz.
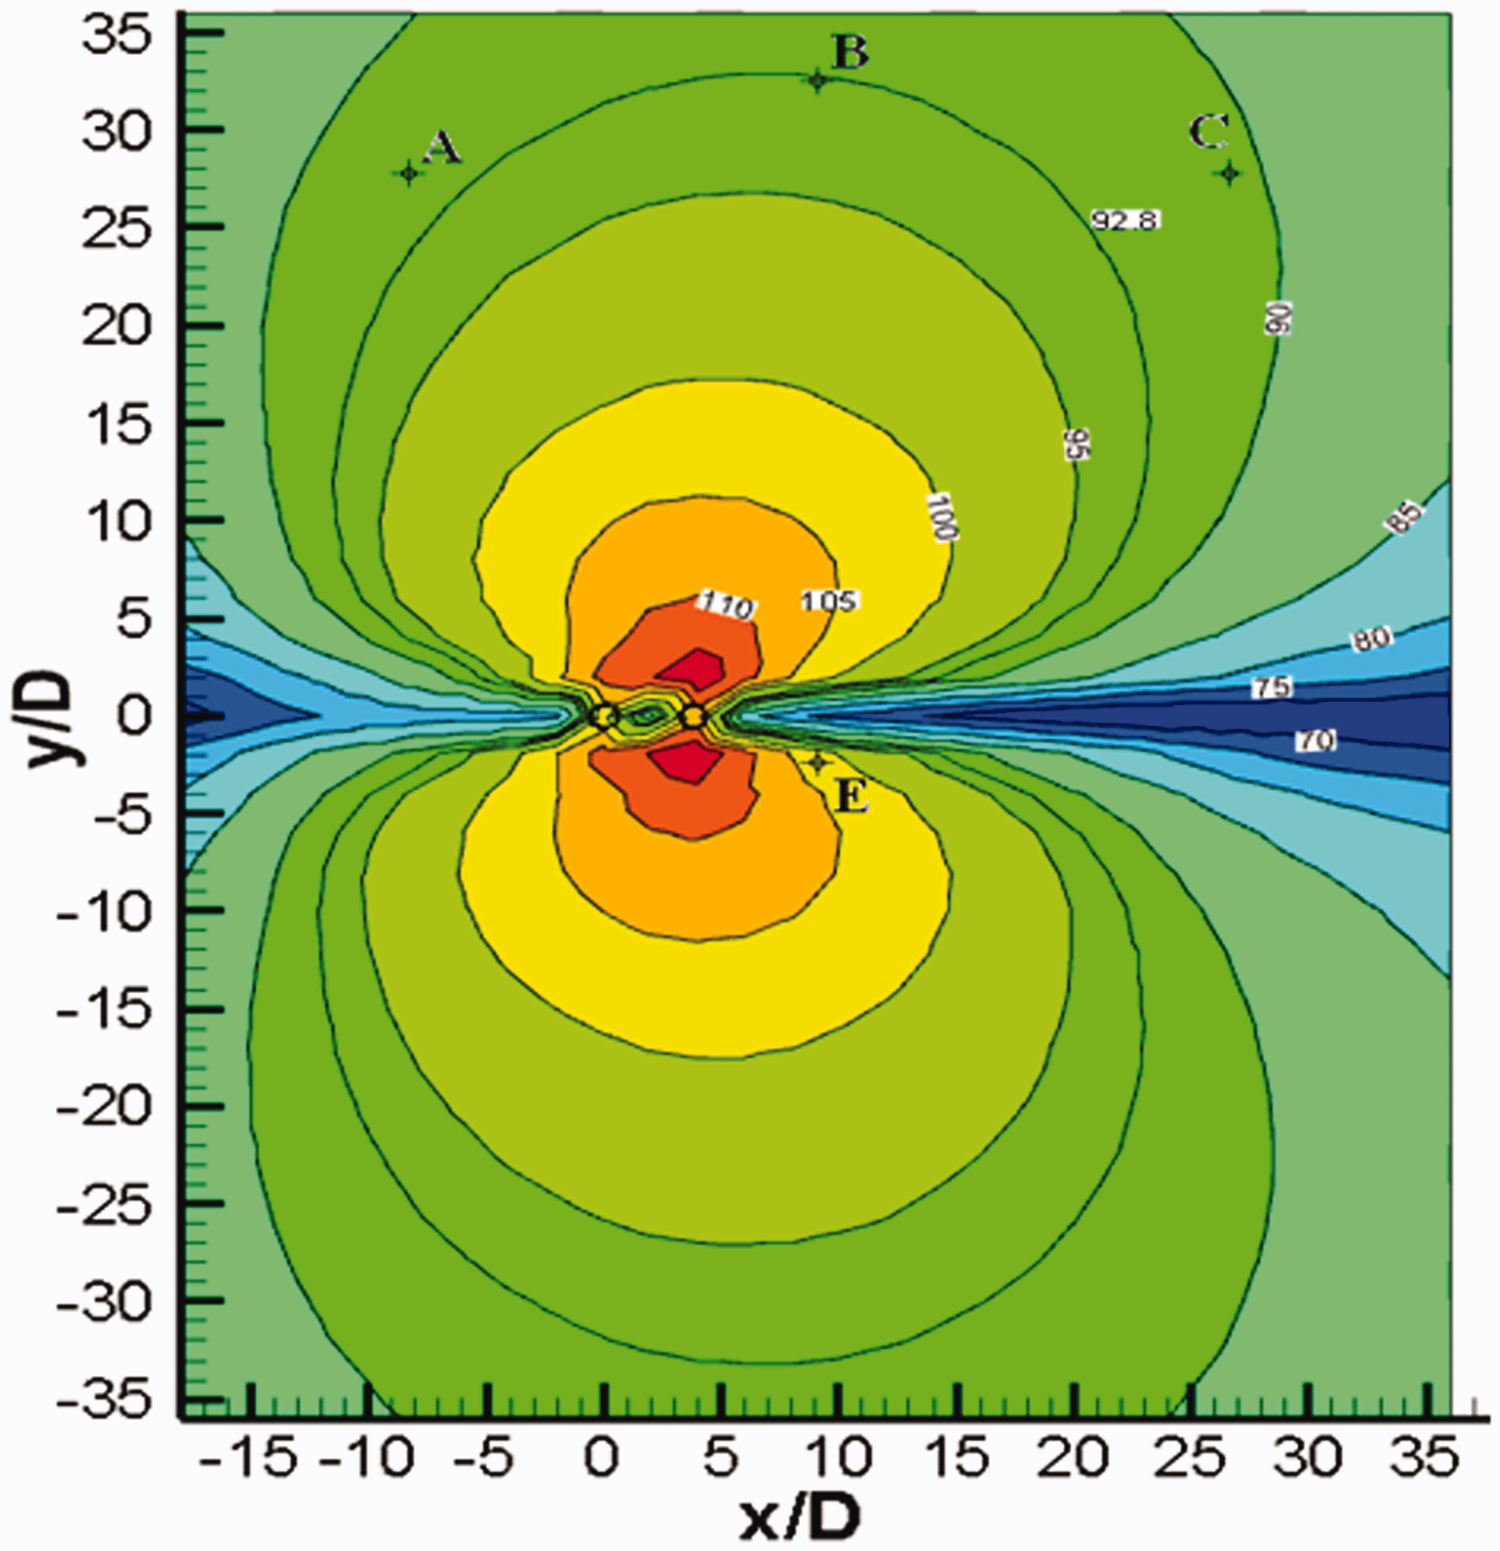
Receivers in the acoustic radiation field at 170 Hz.
Amplitude and phase of sound pressure at receivers.

Good comparisons between numerical and experimental noise spectra at the receivers (A, B, C) were obtained, shown as in Figure 13. The cylinder’s primary shedding frequency is about 170 Hz, which is slightly lower than the experimental value of BART (178 Hz) about 7∼8 Hz. This little variation in results reflects the fact that the result in simulation is away from the experimental value as the grid is refined.
13
For frequencies
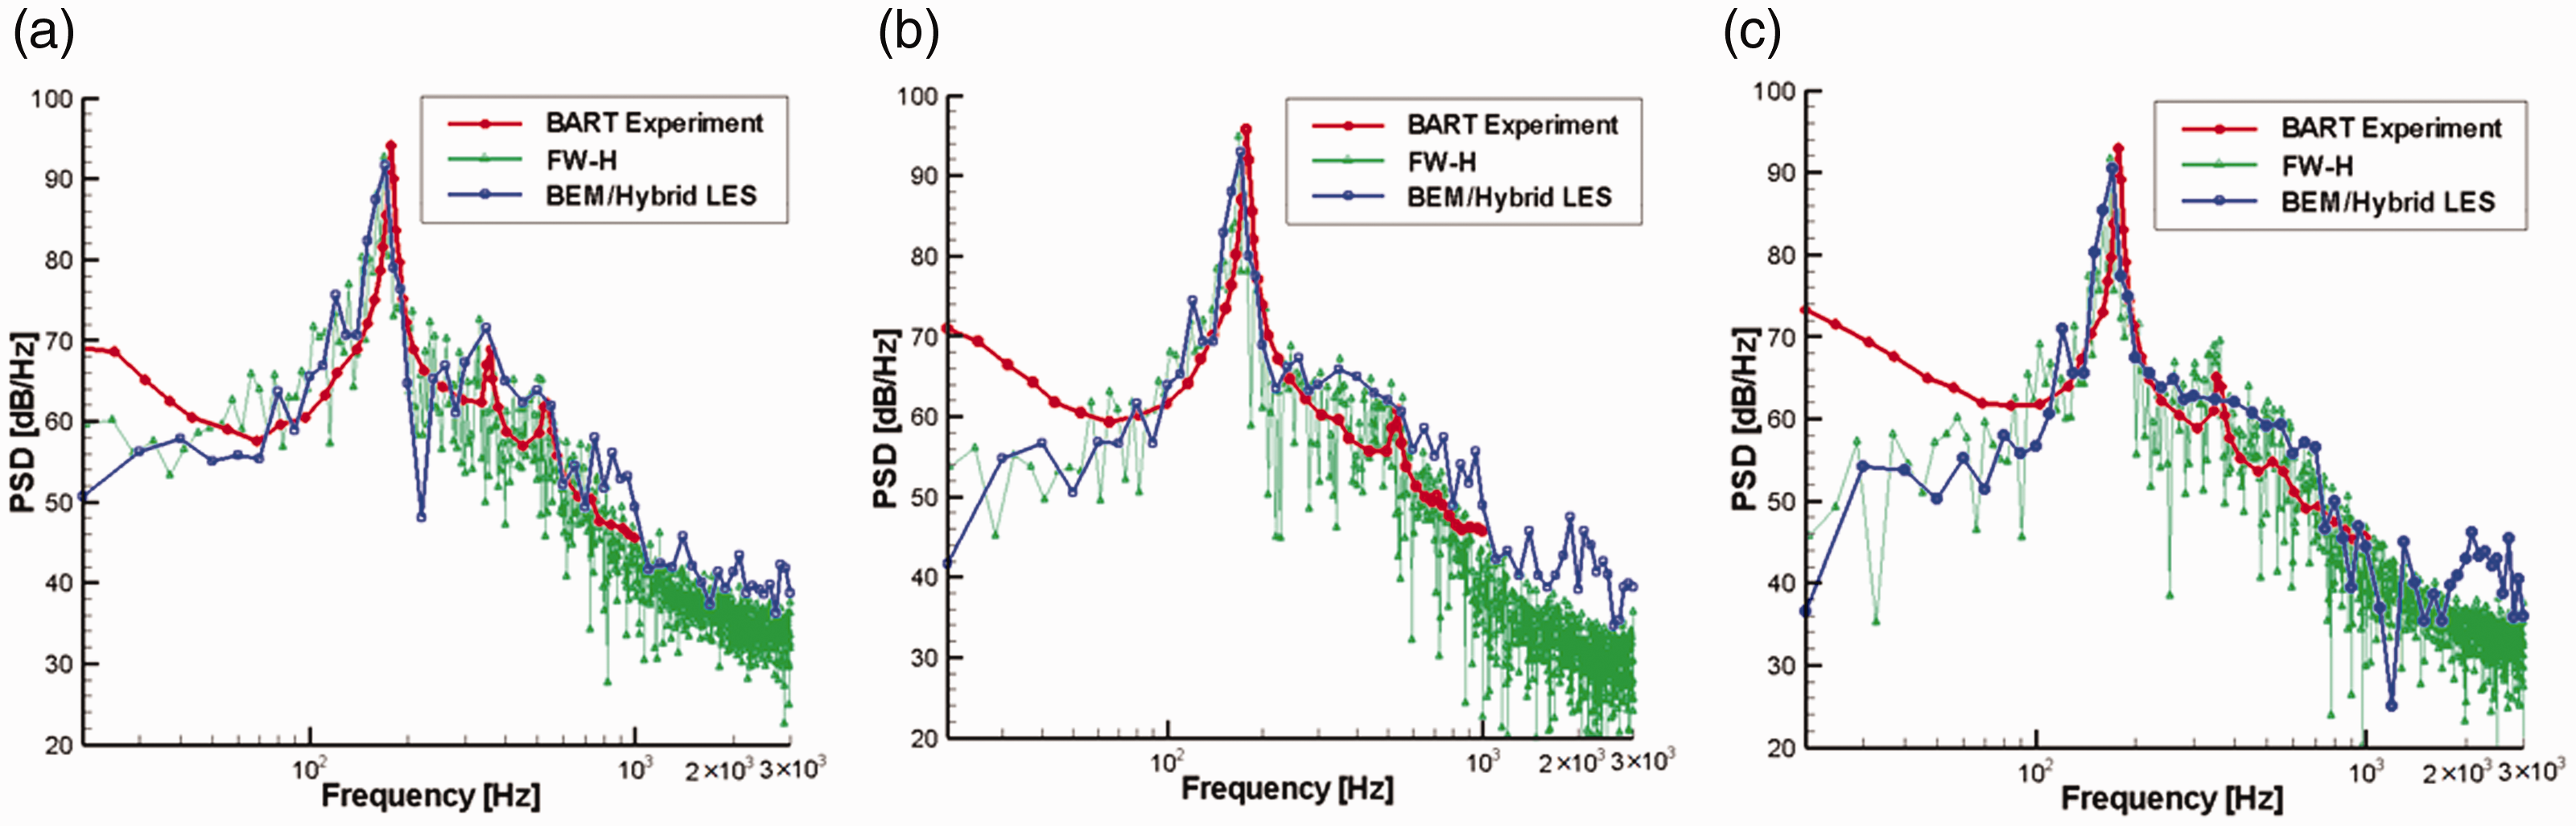
Power spectral density of sound pressure at receivers.
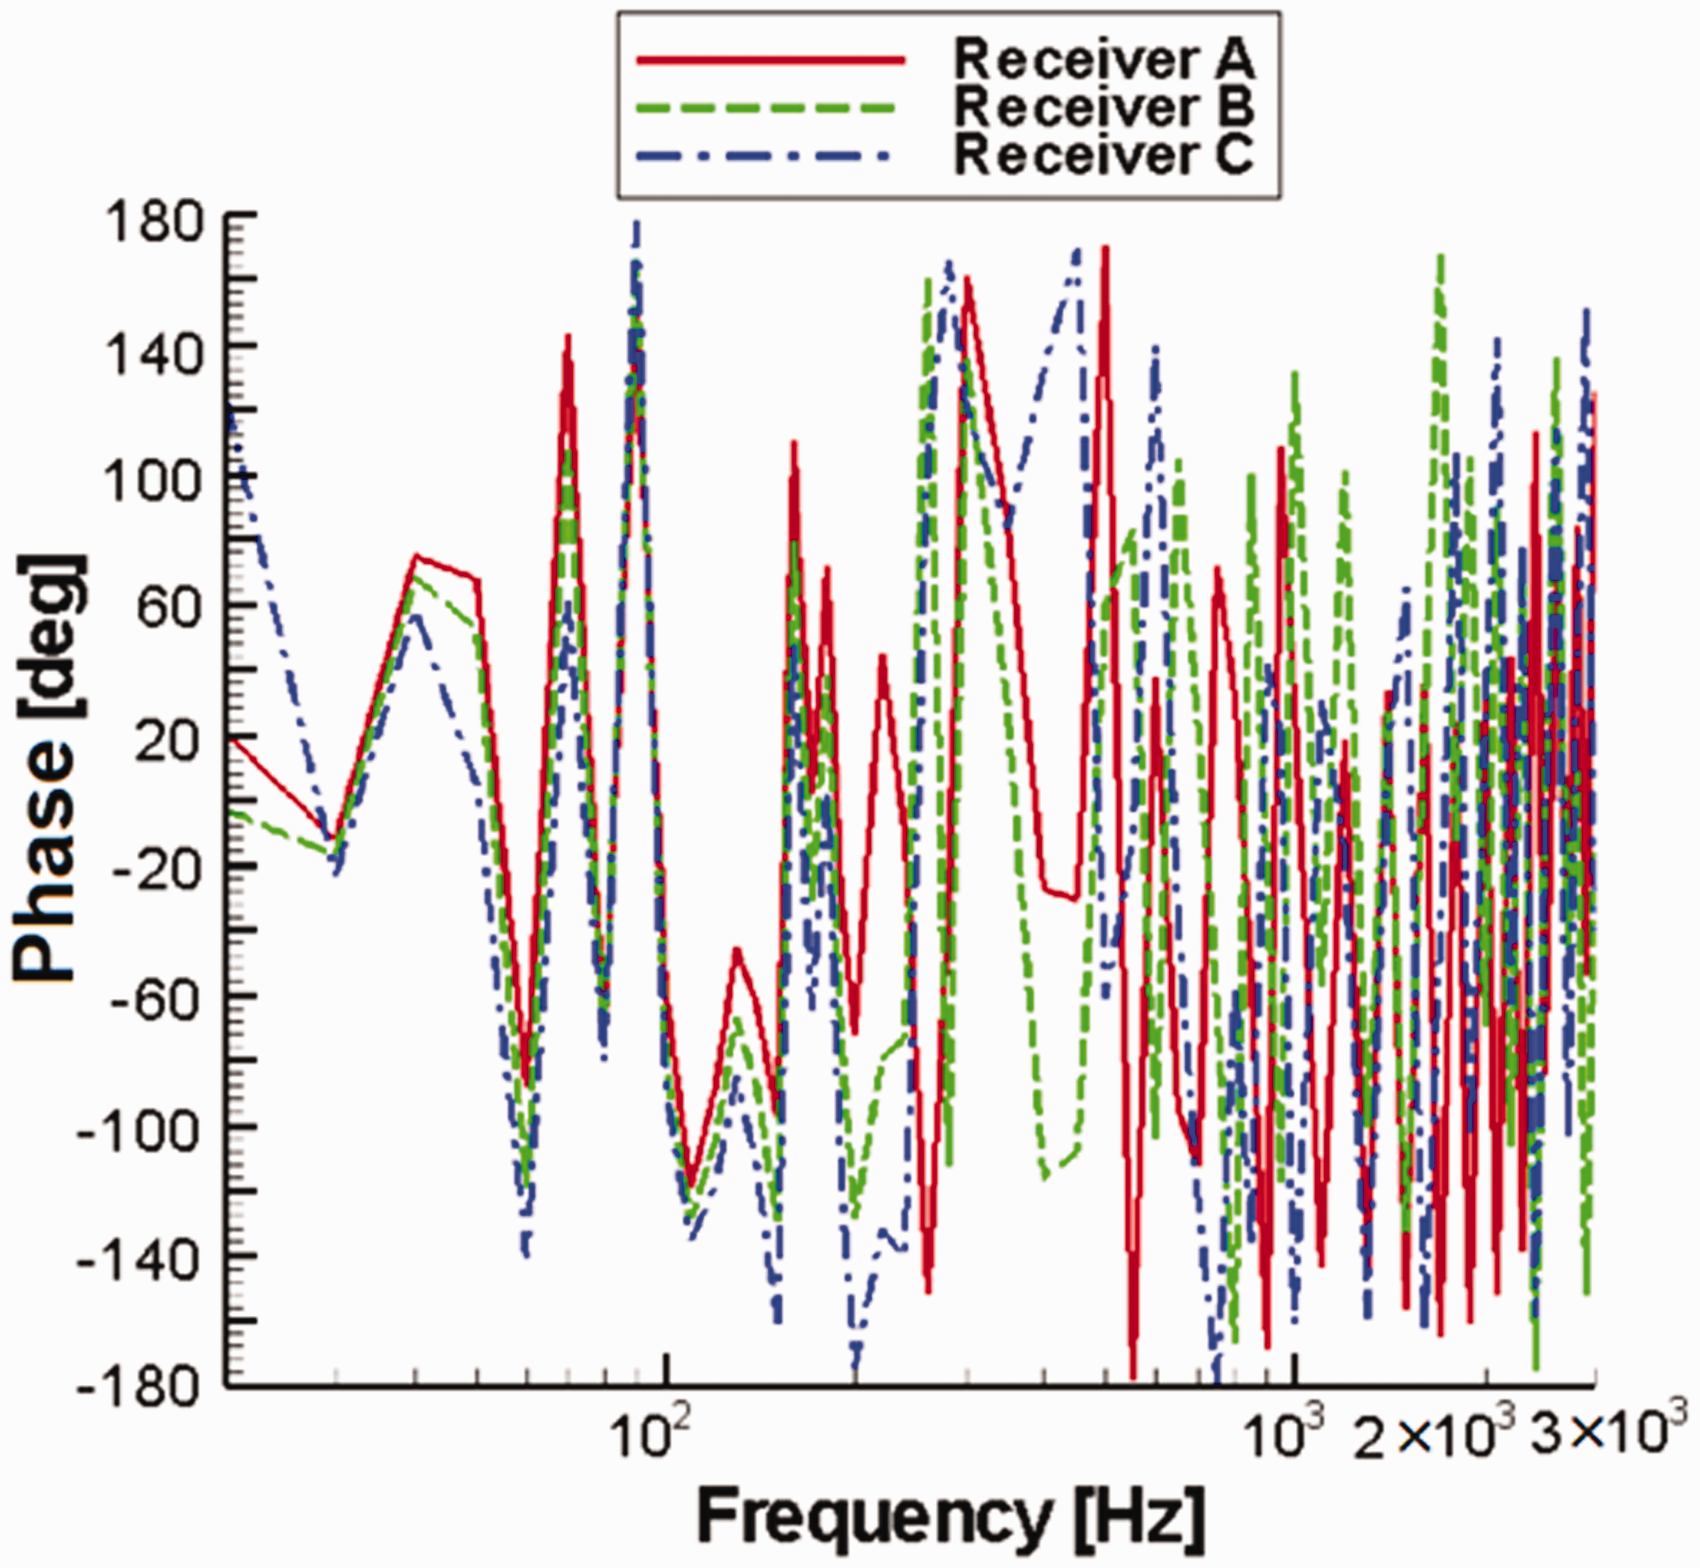
Phase of sound pressure at receivers.
When discussing the acoustic frequency response of a point in a sound field, one should first understand that the frequency response function is a complex function. The amplitude-frequency response and phase-frequency response together constitute a complete acoustic frequency response. Figure14 shows the phase-frequency response of aerodynamics noise at the receivers (A, B and C) under the condition of the inflow velocity (44 m/s) . It is not difficult to find that when the frequency exceeds about 210 Hz, the three receivers show significant phase differences in sound pressure. The analysis of phase frequency characteristics will be helpful to the further study of noise interference and suppression in aeroacoustics sound field.
The effect of different freestream velocities on the dipole distribution of the upstream and downstream cylinder’s surface is also studied here. Figure 15 shows the dipole distribution on the surfaces of different cylinders at different freestream velocities. It can be seen from the figure that the distribution of strong dipole sources on both of the two cylinders are almost unchanged at different freestream velocities. However, with the increase of the flow velocity, the SPL value of dipole sources on the surface of upstream cylinder increases more rapidly than that of the downstream column surface. As the vortex in the wake zone between the cylinders (with separation distances 3.7 D) has been fully developed at a speed of freestream velocity 44 m/s, further small increase in velocity has less effect on the downstream cylinder than on the upstream cylinder. Figure 16 shows the maximum of the SPL at the three receivers with different inlet flow velocities. It can also be seen that when the inlet flow velocity is greater than 44 m/s, the increase of noise energy tends to slow down. In addition, the frequency of the SPL maximum point (i.e. the frequency of vortex shedding) also increases with the inlet flow velocity.
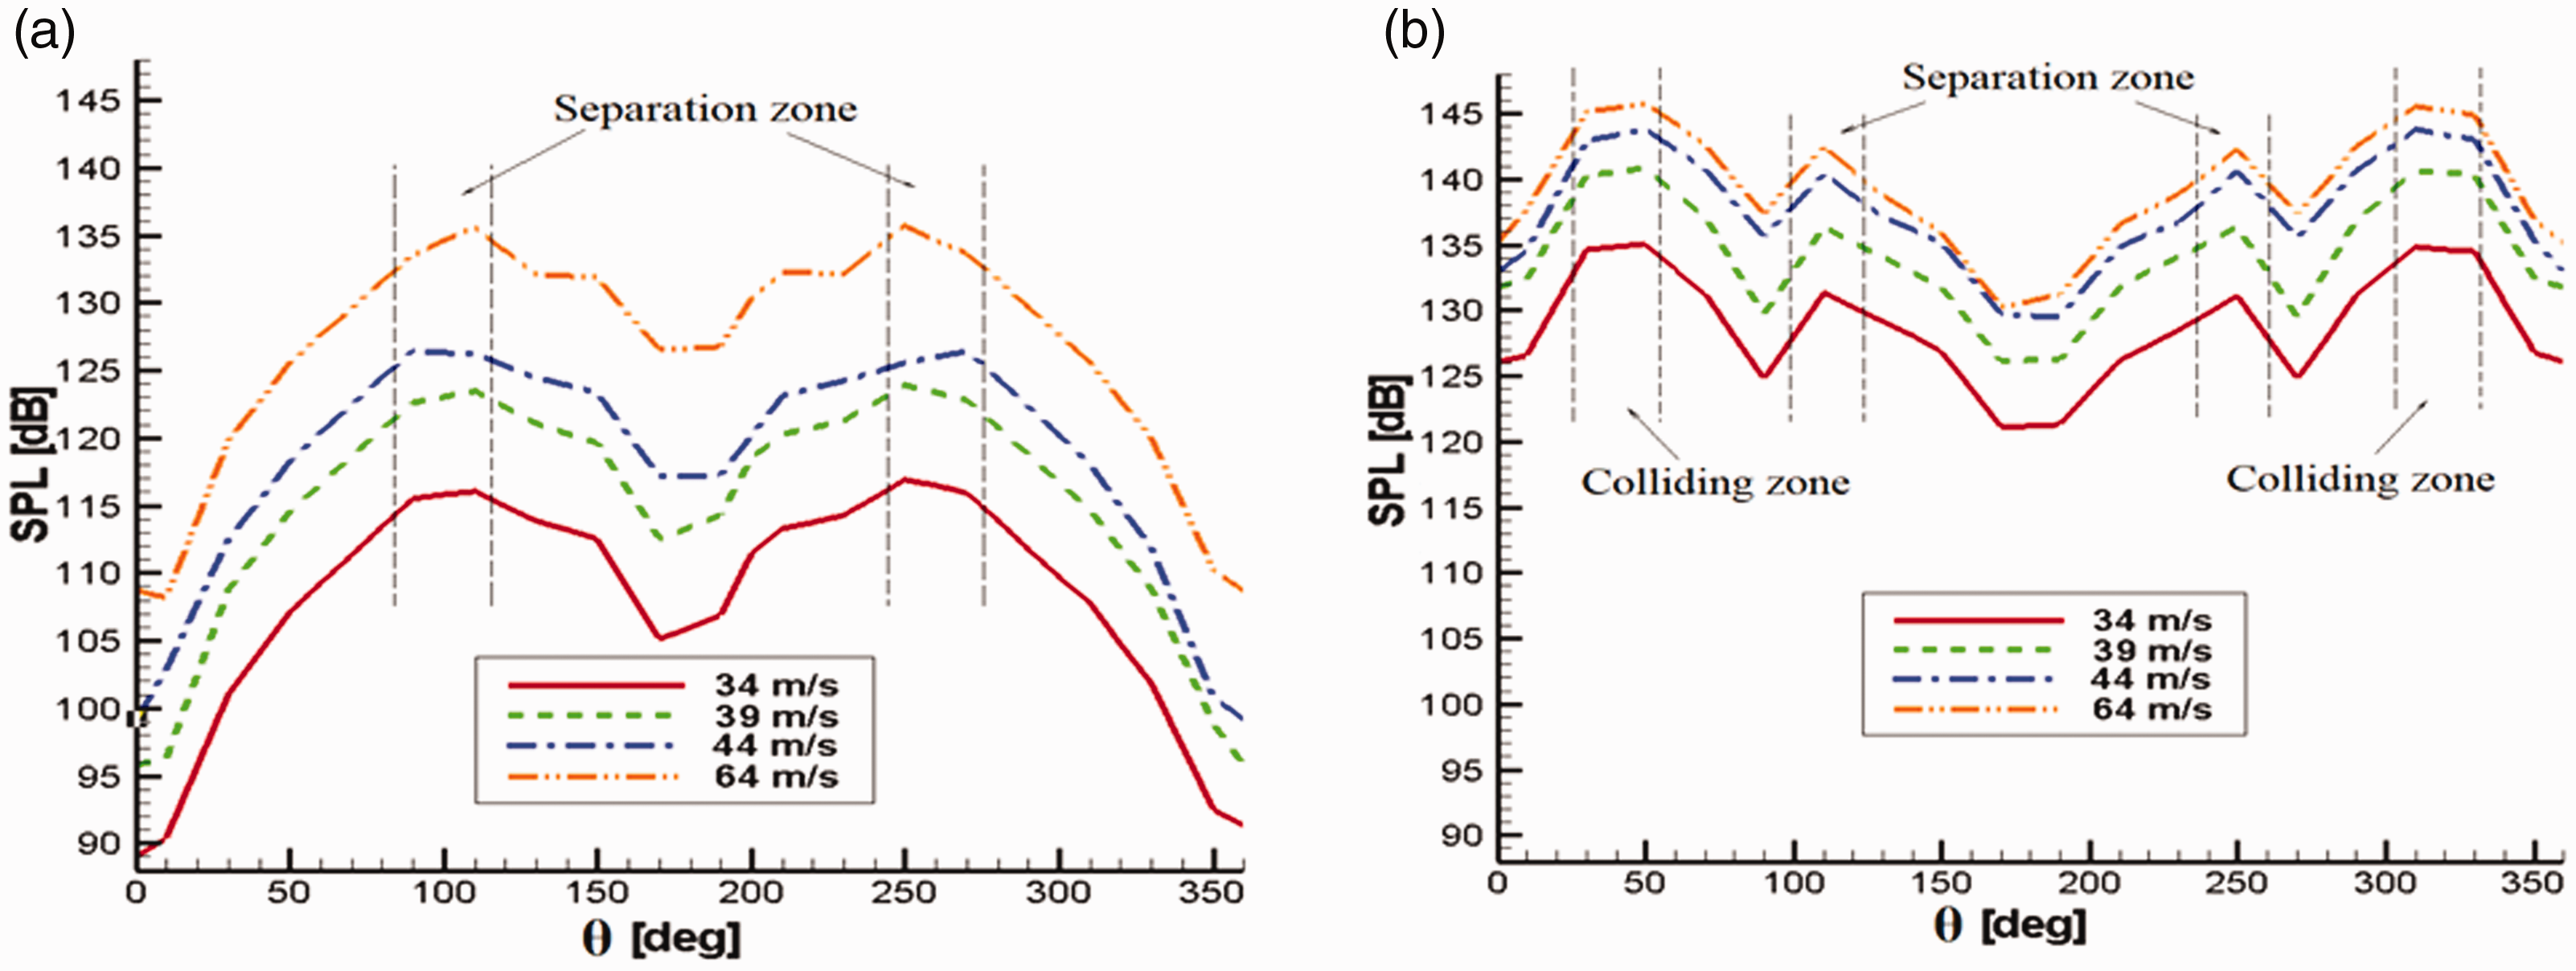
SPL of the dipole source on cylinders’ surface at different freestream velocities.
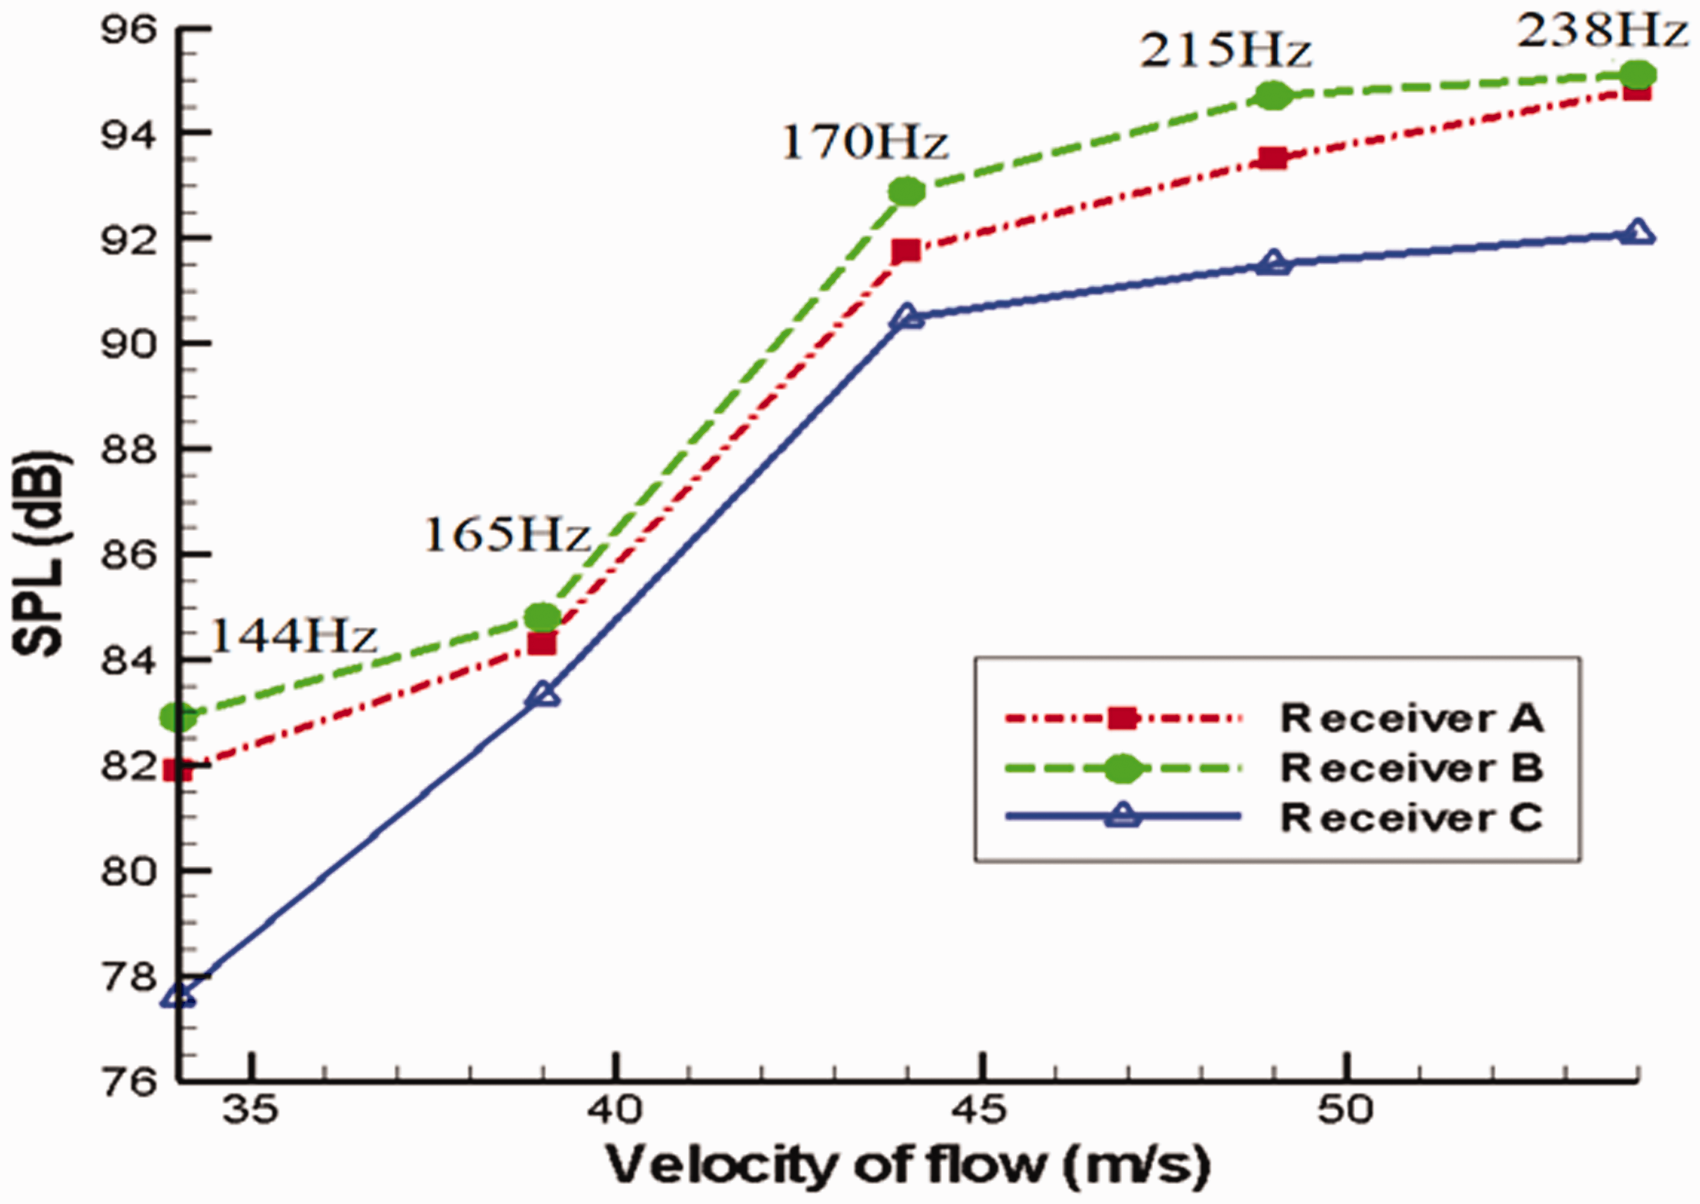
the maximum SPL of three receivers with different freestream velocities.
Concluding remarks
A hybrid LES method combined with the BEM is presented here to predict the aerodynamics noise generated by tandem circular cylinders immersed in a three-dimensional turbulent flow. The hybrid LES method, which seamlessly operates between RANS and LES mode, provides valuable details of flow around non-aerodynamic obstacles and saves more orders of magnitude of computing power than the pure LES. The flow pressure fluctuation near the surface of the cylinder is converted into acoustic dipole sources by the Lighthill's Acoustic Analogy. Taking the dipole sound source as actual radiation sound source, the DBEM is utilized to predict the aeroacoustics radiation field. The results show that:
There is an internal relationship between the distribution of Taking the dipole sound source as actual radiation sound source, the dipole source distribution and its acoustic radiation field at the critical Reynolds number are obtained. The results show that the surface of the downstream cylinder is the main noise source. The strong dipole sound sources are mainly distributed in the separation zones on the surface of the upstream column, the collision zone and wake vortex separation zone on the surface of the downstream column. With the increase of freestream velocity, the intensity of dipole noise on both of the two cylinders increases, and the frequency at the SPL extreme point (i.e. the frequency of vortex shedding) also increases. Both the amplitude-frequency response and the phase-frequency response are obtained, indicating that the complete frequency response of the dipole acoustic acoustics sources could be analyzed.
The research on the distribution of surface dipole sources and their complete frequency response (including amplitude-frequency response and phase-frequency response) in radiation sound field is helpful for the further research on the interference and suppression of aerodynamics noise in turbulent flow field.
Footnotes
Acknowledgments
The author expresses the appreciation to Professor Con Doolan and his Flow Noise Group in the School of Mechanical and Manufacturing Engineering at UNSW University in Australia for their help and support.
Declaration of conflicting interests
The author(s) declared no potential conflicts of interest with respect to the research, authorship, and/or publication of this article.
Funding
The author(s) disclosed receipt of the following financial support for the research, authorship, and/or publication of this article: The author acknowledges that this study is supported by the China Scholarship Council (CSC) (Zheng ZhengYu; File No.201808505126).
