
Abstract
This work explores the use of bi-modal excitation to reduce the noise in a supersonic rectangular jet. The excitation is guided by previously published reduced-order modelling, suggesting that harmonic interactions can reduce the dominant noise sources in the jet. An unexcited jet is considered first as the baseline case, which showed Strouhal number 0.15 as the most dominant near field coherent structure, which also appeared as a prominent peak in the far field noise at low emission angles and as a secondary peak at the peak emissivity angle, thus it was taken as the fundamental frequency to target with excitation. The jet is then excited with the single-mode harmonic, St 0.30. Other cases are considered with bi-modal excitation at St’s 0.15 and 0.30 with various phase lags. Both single-mode and bi-modal excitation show a considerable reduction of the near field coherent structures at St 0.15 and amplification at 0.30. Reduction of the fundamental in the bi-modal cases shows a dependence on the initial phase lag whereby reduction is maximized when harmonic amplification is maximized. All excited cases are also shown to reduce the eddy convection velocity. Reduction in far field sound pressure levels at St 0.15 is obtained for all excitation cases up to 13 dB. For all metrics, it is shown that bi-modal excitation is more effective than single-mode excitation given an optimized phase lag. All results ultimately support the use of fundamental-harmonic interactions as a noise reduction mechanism.
Keywords
Introduction
Jet noise is a major concern in both civilian and military aviation. It is a nuisance to those living near airstrips and can cause adverse health effects on personnel working near aircraft. The focus of this work is active noise reduction in supersonic rectangular jets, which is of particular interest for military applications. This is partially because rectangular jets are easier to manufacture and integrate into an airframe. A specific use case for this work is to reduce noise of jets taking off from aircraft carriers. Carrier decks regularly see personnel working near aircraft during takeoff where noise levels can reach above 150 dB, which is beyond the level that personal protective equipment can protect against. The U.S. Department of Veteran Affairs spends approximately $1 billion per year on hearing loss cases with around 28% coming from the Department of the Navy. 1
Jet noise is a complex problem. In general, the three primary sources of noise are broadband shock noise, turbulent mixing noise, and screech. Additionally, at higher convective Mach numbers, the movement of large-scale structures can produce Mach wave radiation directed downstream. Screech is the result of a complex feedback process linking the acoustic wave produced by shock-vortex interaction to a receptivity process at the nozzle lip. 2 The dominant noise is generated by the large-scale coherent structures, 3 which can be characterized as wave packets of various frequencies and azimuthal mode that can interact with each other as well as the mean flow and fine-scale turbulence. 4 In supersonic jets, noise is distinguished between mixing noise and shock associated noise. Mixing noise is generated from convecting quadrupole sources as originally proposed by Lighthill. 5 Shock associated noise is generated by the interaction between large-scale structures in the shear layer and the shock cells in the jet core.6,7 For the same Mach 1.5 heated rectangular jet considered in this work, Gojon et al. 8 show where these different types of noise originate in the near field and propagate to the far field. They show the mixing noise generated further downstream and appearing at low directivity angles. The shock associated noise appears further upstream and is dominant at higher polar angles and contains higher frequency components.
Rectangular nozzles offer an attractive feature for the design of aircraft, especially for airframe integration. Interest in studying rectangular jets has grown in recent years, highlighting their distinct flow characteristics. Experimental and numerical studies 9 show that rectangular jets exhibit more complex structures due to the interaction of expansion waves from adjacent straight edges at the corners. The screeching frequency staging behavior is less prominent in rectangular jets compared to circular ones. 10 Edgington-Mitchell et al., 11 attributed the absence of staging behavior in large aspect ratio rectangular jets to the rapid decay of shock structures. A notable characteristic of rectangular supersonic jets is the oscillating mode. In the study by Powell 12 the antisymmetric mode corresponding to screech was visualized, and the symmetric mode related to the harmonic frequency of screech was also reported. Viswanath et al. 13 investigated the flow structure and noise of ideally expanded supersonic rectangular and circular jets and observed that while plume spread near the nozzle differs slightly between rectangular and circular jets, both eventually converge to a similar rate. Significant differences exist in shock cell structures and jet core lengths. Double-diamond shock cells appear in the minor axis plane of the rectangular nozzle and the circular jet, but not in the major axis plane. Additionally, the effect of heated jets is investigated, and it is reported that when the operating temperature is increased, overall noise levels rise due to increased mixing noise, while shock-associated noise contributes less since shock cell structures near the nozzle exit are less temperature-dependent. At upstream and sideline locations, the sound pressure levels (SPL) of circular and rectangular jets are similar, particularly in broadband peaks. Downstream, the SPL profiles overlap until the circular jet SPL deviates further downstream. Both experimental and numerical results in this study suggest absence of screech tones for heated rectangular jets.
Noise mitigation techniques generally fall under two categories: passive and active control. Passive flow control methods involve introducing geometric changes that remain unchanged over time. An example of this type of flow control in jets are chevrons penetrating the jet plume14,15 and using an airframe for shielding.16–18 Of more relevance to this work is active noise control, which can be turned on and off to avoid any performance penalties when noise reduction is not needed. This has been ongoing in round jet experiments19,20 and later by computation. 21 In recent years, the use of some kind of fluid injection as an active noise cancellation device has attracted researchers, as a noise reduction approach to avoid any nozzle redesigns. Fluidic injectors disrupt shock cells, breaking them into smaller and weaker structures. They also influence the boundary layer near the nozzle, affecting instability wave growth and reducing large-scale mixing noise. Morris et al. 22 designed fluidic insert achieving a 4 dB reduction in turbulent mixing noise and a 2 dB reduction in shock-associated noise. McLaughlin et al. 23 conducted experiments on both small-scale and larger-scale engines and observed the effectiveness of fluidic injectors in noise mitigation. Several numerical investigations24–27 are conducted to elucidate the mechanisms of noise reduction using fluidic injections. More recent experiments at The Ohio State University have used plasma actuators to excite high speed jets with thermal perturbations and have found success in reducing the peak noise.28–30 This same group has also found success with this excitation method for a single 31 and twin rectangular jets.32,33 Plasma actuators were implemented in computations with actuation strips by Gaitonde and Samimy. 34 Prasad and Unnikrishnan 35 excited a rectangular jet exiting a constant area duct using a similar computational methodology and found that the noise could be reduced depending on the forcing frequency. This work was followed up with a more realistic nozzle geometry and the excitation was able to reduce the noise by up to 5 dB when neglecting the actuation tone, but only 2 dB when the actuation tone was included. 36 Other experiments by Sinha et al. 37 found steady blowing to be effective for noise reduction, but unsteady blowing resulted in strong actuation tones. Employment of loudspeakers is considered as an alternative approach to fluidic injected by researchers in the past. Early experiments of Arbey and Ffowcs Williams 19 on a circular jet subjected to simultaneous excitation by two distinct acoustic tones. In their work, acoustic excitation signals were supplied via loudspeakers. By adjusting the phase between two harmonically related frequencies, it is possible to control the harmonic generation process, sometimes nearly eliminating it. This effect is observed for both harmonic and subharmonic generation, although controlling subharmonic generation proves to be more challenging. Lepicovsky et al. 38 in detailed experimental data on the effects of upstream acoustic excitation on the mixing of heated jets with the surrounding air. It was reported in their findings that the sensitivity of heated jets to acoustic excitation varies significantly with jet operating conditions and that higher jet temperatures require higher excitation levels. Additionally, the preferred Strouhal number for excitation remains consistent across different operating conditions.
Past theoretical work has given insight to the mechanisms by which waves of different modes in a jet interact with one another, the mean flow, and background turbulence. A Reduced-Order Model (ROM) developed by Mankbadi 39 used an integral technique. The Navier-Stokes Equations were reduced to a set of Ordinary Differential Equations (ODEs) that describe the evolution of the mean flow and two harmonically related modes. The ODEs only require a mean flow, which can be obtained by analytic expressions or Reynolds Averaged Navier Stokes, and disturbance shape functions, which can be obtained using affordable computational tools such as Linear Stability Theory (LST) or the Linearized Euler Equations (LEE). It was shown that adding subharmonics could amplify or reduce the fundamental depending on the initial phase angle. This theory was later used by Raman and Rice 20 to guide jet excitation in experiments. They found that two-frequency excitation can be more effective than single-frequency and that the initial phase lag has a significant impact on whether subharmonics are amplified or suppressed. A similar ROM is shown by Lee and Liu, 40 which considers five interacting modes. This theory has also been used to describe the development of a single mode in a round jet using LST 41 and LEE. 42 This ROM was rederived in cartesian coordinates and applied to a 2D compressible shear layer operating at the same conditions as the jet considered in this work, 43 which used LST. Malczewski and Mankbadi 44 extended this for the 3D rectangular jet. Both recent works found a most amplified frequency that was consistent with the peak noise in the jet column mode in Samimy et al. 33 They both also concluded that adding the harmonic frequency can be an effective mechanism for reducing the most amplified frequency, which could theoretically reduce the peak noise. This finding is consistent with the general trend that higher excitation frequencies are more effective in noise reduction.31,35
The objective of this work is to perform a high-fidelity computational study to apply the theory from Malczewski and Mankbadi 44 to see if harmonic interactions are effective in reducing the peak noise in the jet. Evidence for this theory is significant because the ROM offers an affordable method for performing quick parametric studies to predict effective excitation parameters. The ROM relies on low-fidelity linear methods (i.e., LST and LEE) that are then brought to the nonlinear regime using the resultant ODEs. The ROM is not meant to be a replacement to high-fidelity studies, but rather to be a precursor method to guide their setup. The ROM has been shown to reproduce certain trends from experiments and high-fidelity computations, but there are no studies for a 1:1 comparison. This work is also significant in that it is one of only a handful of computational studies of excited high speed rectangular jets. Computational setup and methodology of this work covers the computational methods used for both Large-Eddy Simulations (LES) and Ffowcs Williams-Hawkings solver. Baseline case and determination of the fundamental frequency presents the results for the unexcited baseline case and concludes the fundamental frequency that needs to be reduced. Excited LES results presents the results for the excited cases, first for the case of single-mode excitation, and then for bi-modal excitation. Conclusions are presented in Conclusions.
Computational setup and methodology
To apply the theory developed by Malczewski and Mankbadi,
44
Large-Eddy Simulations (LES) are used. This work considers the same jet used in the aforementioned work, which is also depicted in Figure 1. The same jet is used in other studies at the University of Cincinnati8,13,16,45 and at The Ohio State University,31,33 establishing a strong basis for comparison. The nozzle geometry is a converging-diverging nozzle with an aspect ratio of 2:1 ( Schematic showing computational grid (left) and nozzle schematic (right); the computational grid shows the minor plane (red) and the major plane (blue). A. LES Methodology.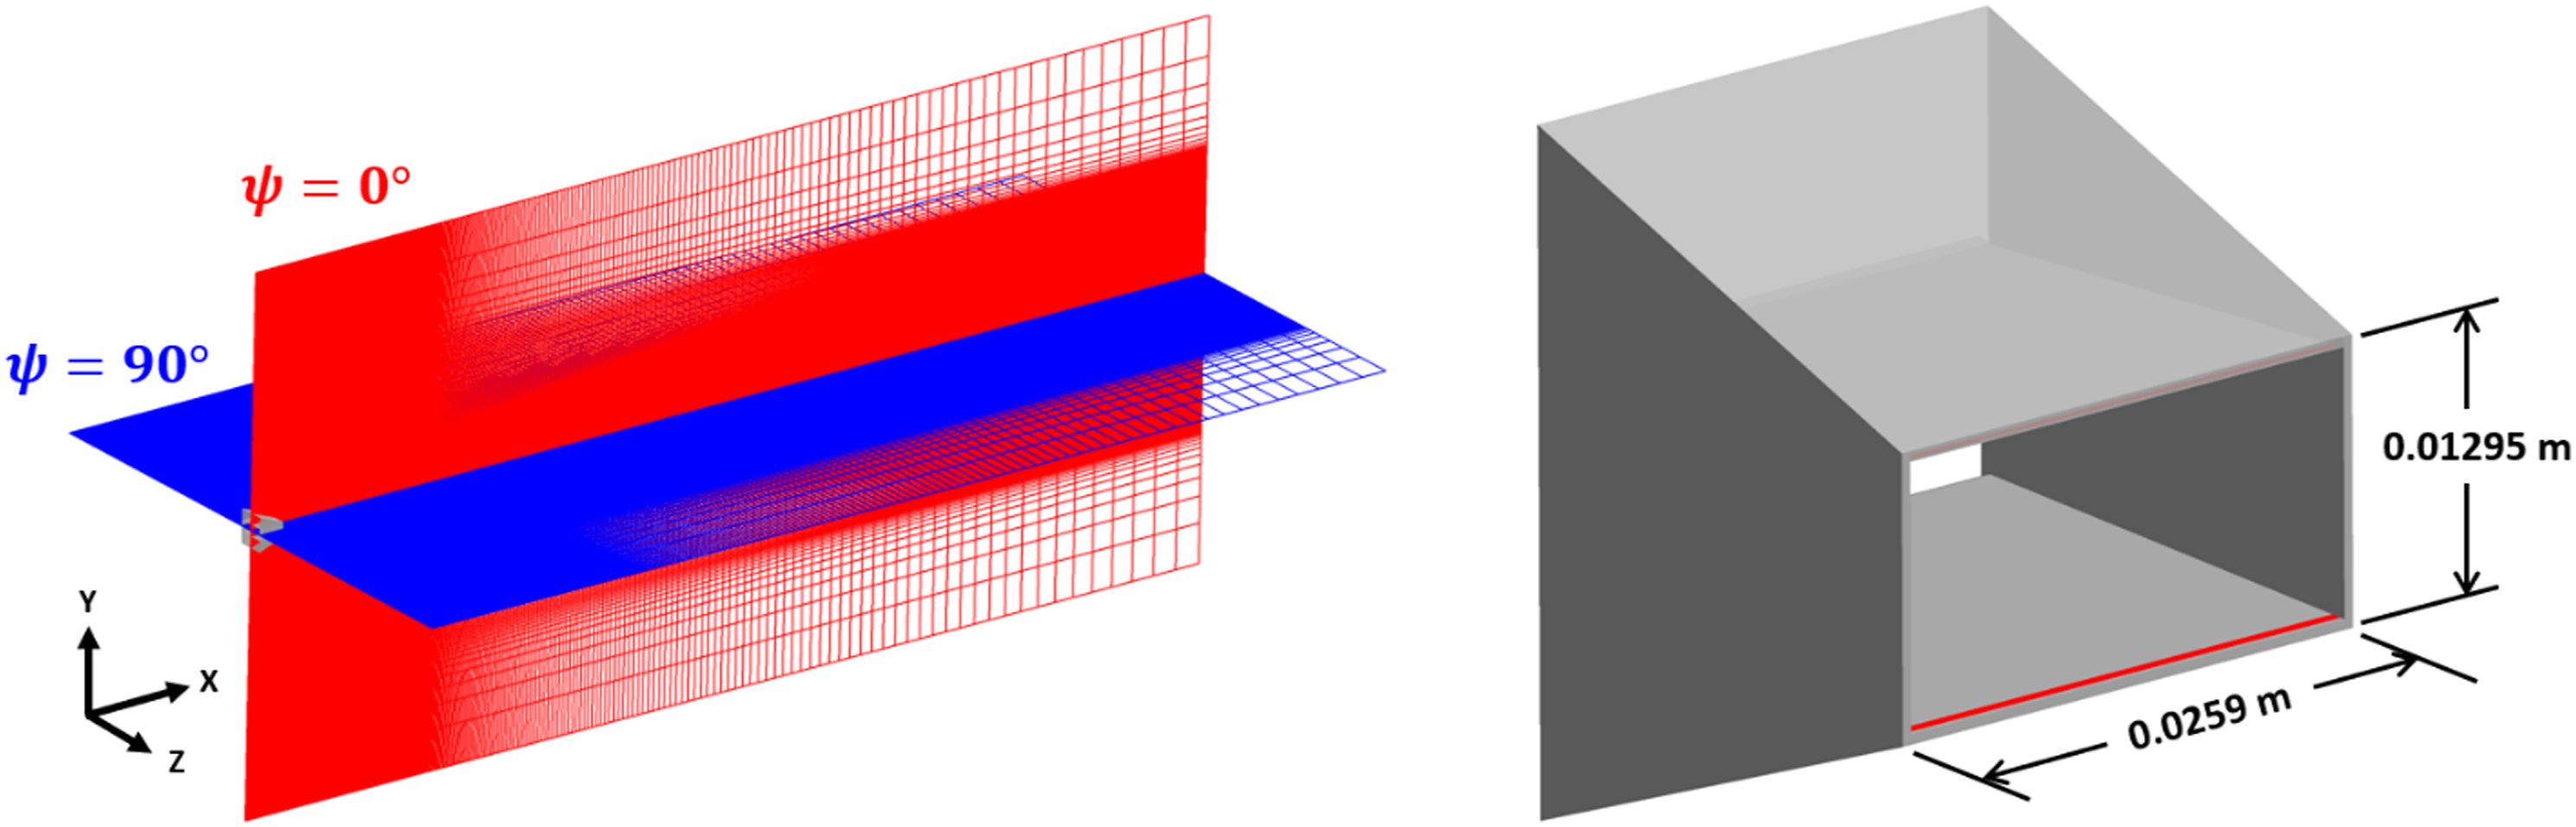
LES Methodology
The LES code used in this work is Scalable Agile Fluid Framework (SAFF), which is a derivative of the code originally developed by Visbal and Gaitonde.
46
This code solves the compressible Navier-Stokes equations in strong conservative form with a curvilinear coordinate system.

The SAFF code has been successfully used in several prior efforts with jet flows.47,49–51 As described by Chakrabarti et al., 47 the code uses third-order upwind-biased reconstruction in conjunction with a Roe flux-difference split scheme 52 and a harmonic limiter. 53 Viscous terms are discretized using second-order finite differencing. No explicit turbulence model is used, thus classifying this as implicit-LES (ILES). Temporal integration is performed using a second-order approximately factored Beam-Warming scheme with two sub-iterations. 54
In the code, velocities are normalized by the ambient speed of sound,
The computational domain here uses the same structured grid as in Chakrabarti et al.,
47
who previously confirmed dominant flow features to be grid independent. The grid is a single block composed of
Excitation is imposed using actuation strips along the upper and lower nozzle lips near the exit, which are shown in Figure 1. The actuation strips span the entire width of the nozzle. This is different from other works with excitation, which have smaller actuators placed along the width, giving a z-periodicity in the major plane.35,49 This work is putting into practice the ROM developed by Malczewski and Mankbadi, 44 which did not include z-periodicity in the disturbance shape functions, thus the actuators span the entire nozzle width for consistency.
The actuators function by imposing a small periodic pressure fluctuation. Two types of excitations are considered: single-mode excitation, and bi-modal excitation, which take the form of equations (3) and (4) respectively and are depicted graphically in Figure 2. For all cases, the upper and lower actuators work in-phase with each other. For the single-mode case, the jet is excited with twice the frequency of the most amplified mode in the nearfield. As is later shown in Baseline case and determination of the fundamental frequency, Actuation for all excited cases.


The ILES solver was run with a time step of
Ffowcs Williams-Hawkings methodology
To compute the far field noise, a Ffowcs Williams-Hawkings (FWH) solver was developed and employed. Formulations I and II of the FWH equations given in Brentner and Farassat
56
are first considered. Lyrintzis
57
shows the conversion of these formulations to the frequency domain with a Fourier transform. Mendez et al.
58
manipulated this into a new frequency domain formulation, which is ultimately used in this work. The far field pressure signal can be decomposed as follows:
Above, Ffowcs Williams-Hawkings surfaces plotted with time-averaged vorticity in (a) minor plane, (b) major plane, (c) isometric view showing end caps.
The time history of the primitive variables is collected on each of the surfaces. For a given observer, source terms are computed as functions of time and space using the formulation from Mendez et al.
58


The FWH solver is validated using the unexcited baseline case and comparing directly with Mora et al.
16
and Viswanath et al.,
13
which consider the same jet in both experiment and computation, respectively. They also use the same observer locations, which are also adopted in this work. For all cases, observers are placed in an arc at a radial location of FWH observer coordinate system.
Baseline case and determination of the fundamental frequency
The results begin with the unexcited, baseline case, which provides a basis for comparison of the excited case and to identify a dominant coherent structure to target for the excitation cases. The near field pressure spectra at the lower nozzle lip jet exit on the minor plane is shown in Figure 5. The spectrum shows a distinct peak at Near nozzle spectra of baseline case. Pressure magnitudes at various St’s for baseline case.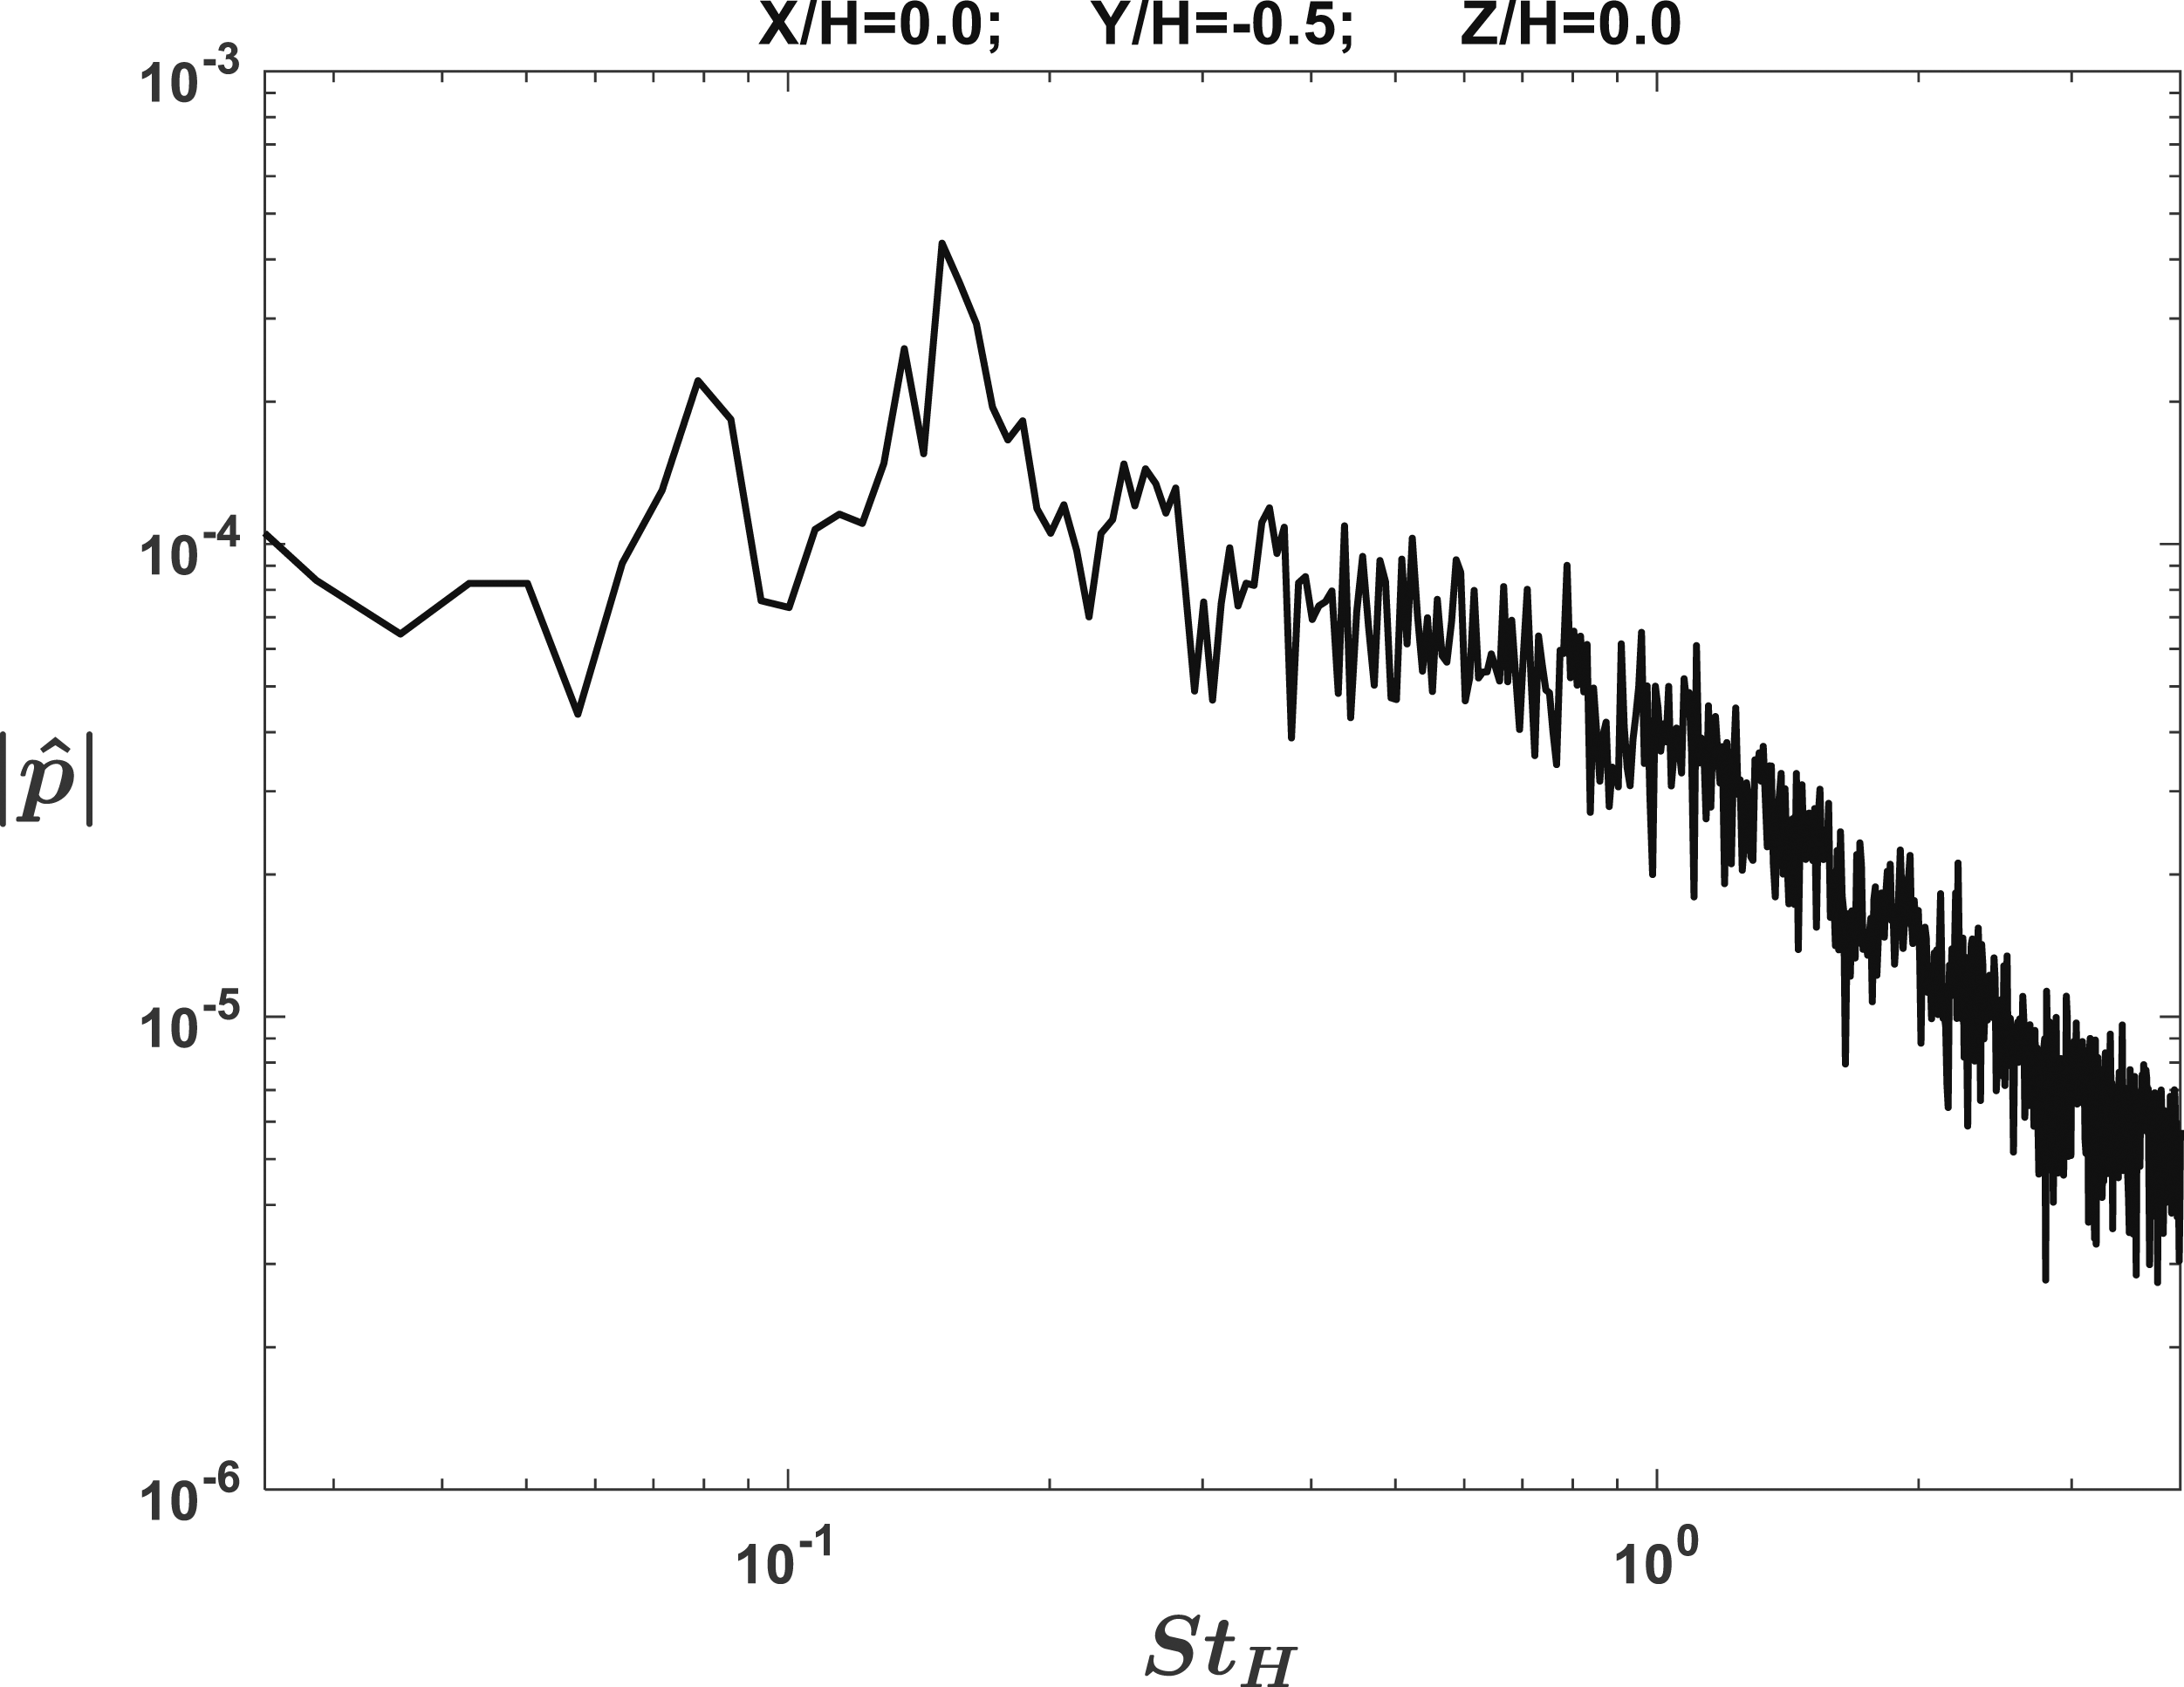
Far field overall sound pressure levels for the baseline case given in Figure 7 show excellent agreement with the previously published results.13,16 Peak values in the directivity differ by less than 1 dB in both planes of interest. The spectra shown in Figure 8 exhibits decent agreement with experiment.
16
The spectra in the major plane compared with Viswanath et al.
13
are shown in Figure 9 and have better agreement than with Mora et al.
16
Here, the St’s above 0.07 have good agreement around the peak directivity angle. There are notable differences in the low frequency range and at high directivity angles. This is expected as the end cap spacing was chosen to reduce error between St 0.15-0.30. This work is more focused around the peak directivity range between, so this is allowable. The peak noise in the present study occurs at a polar angle of approximately Directivity comparison for baseline case in the minor (left) and major (right) planes. Spectra comparison in minor plane for baseline case. Major plane spectra comparison with Viswanath et al. (2017) for baseline case.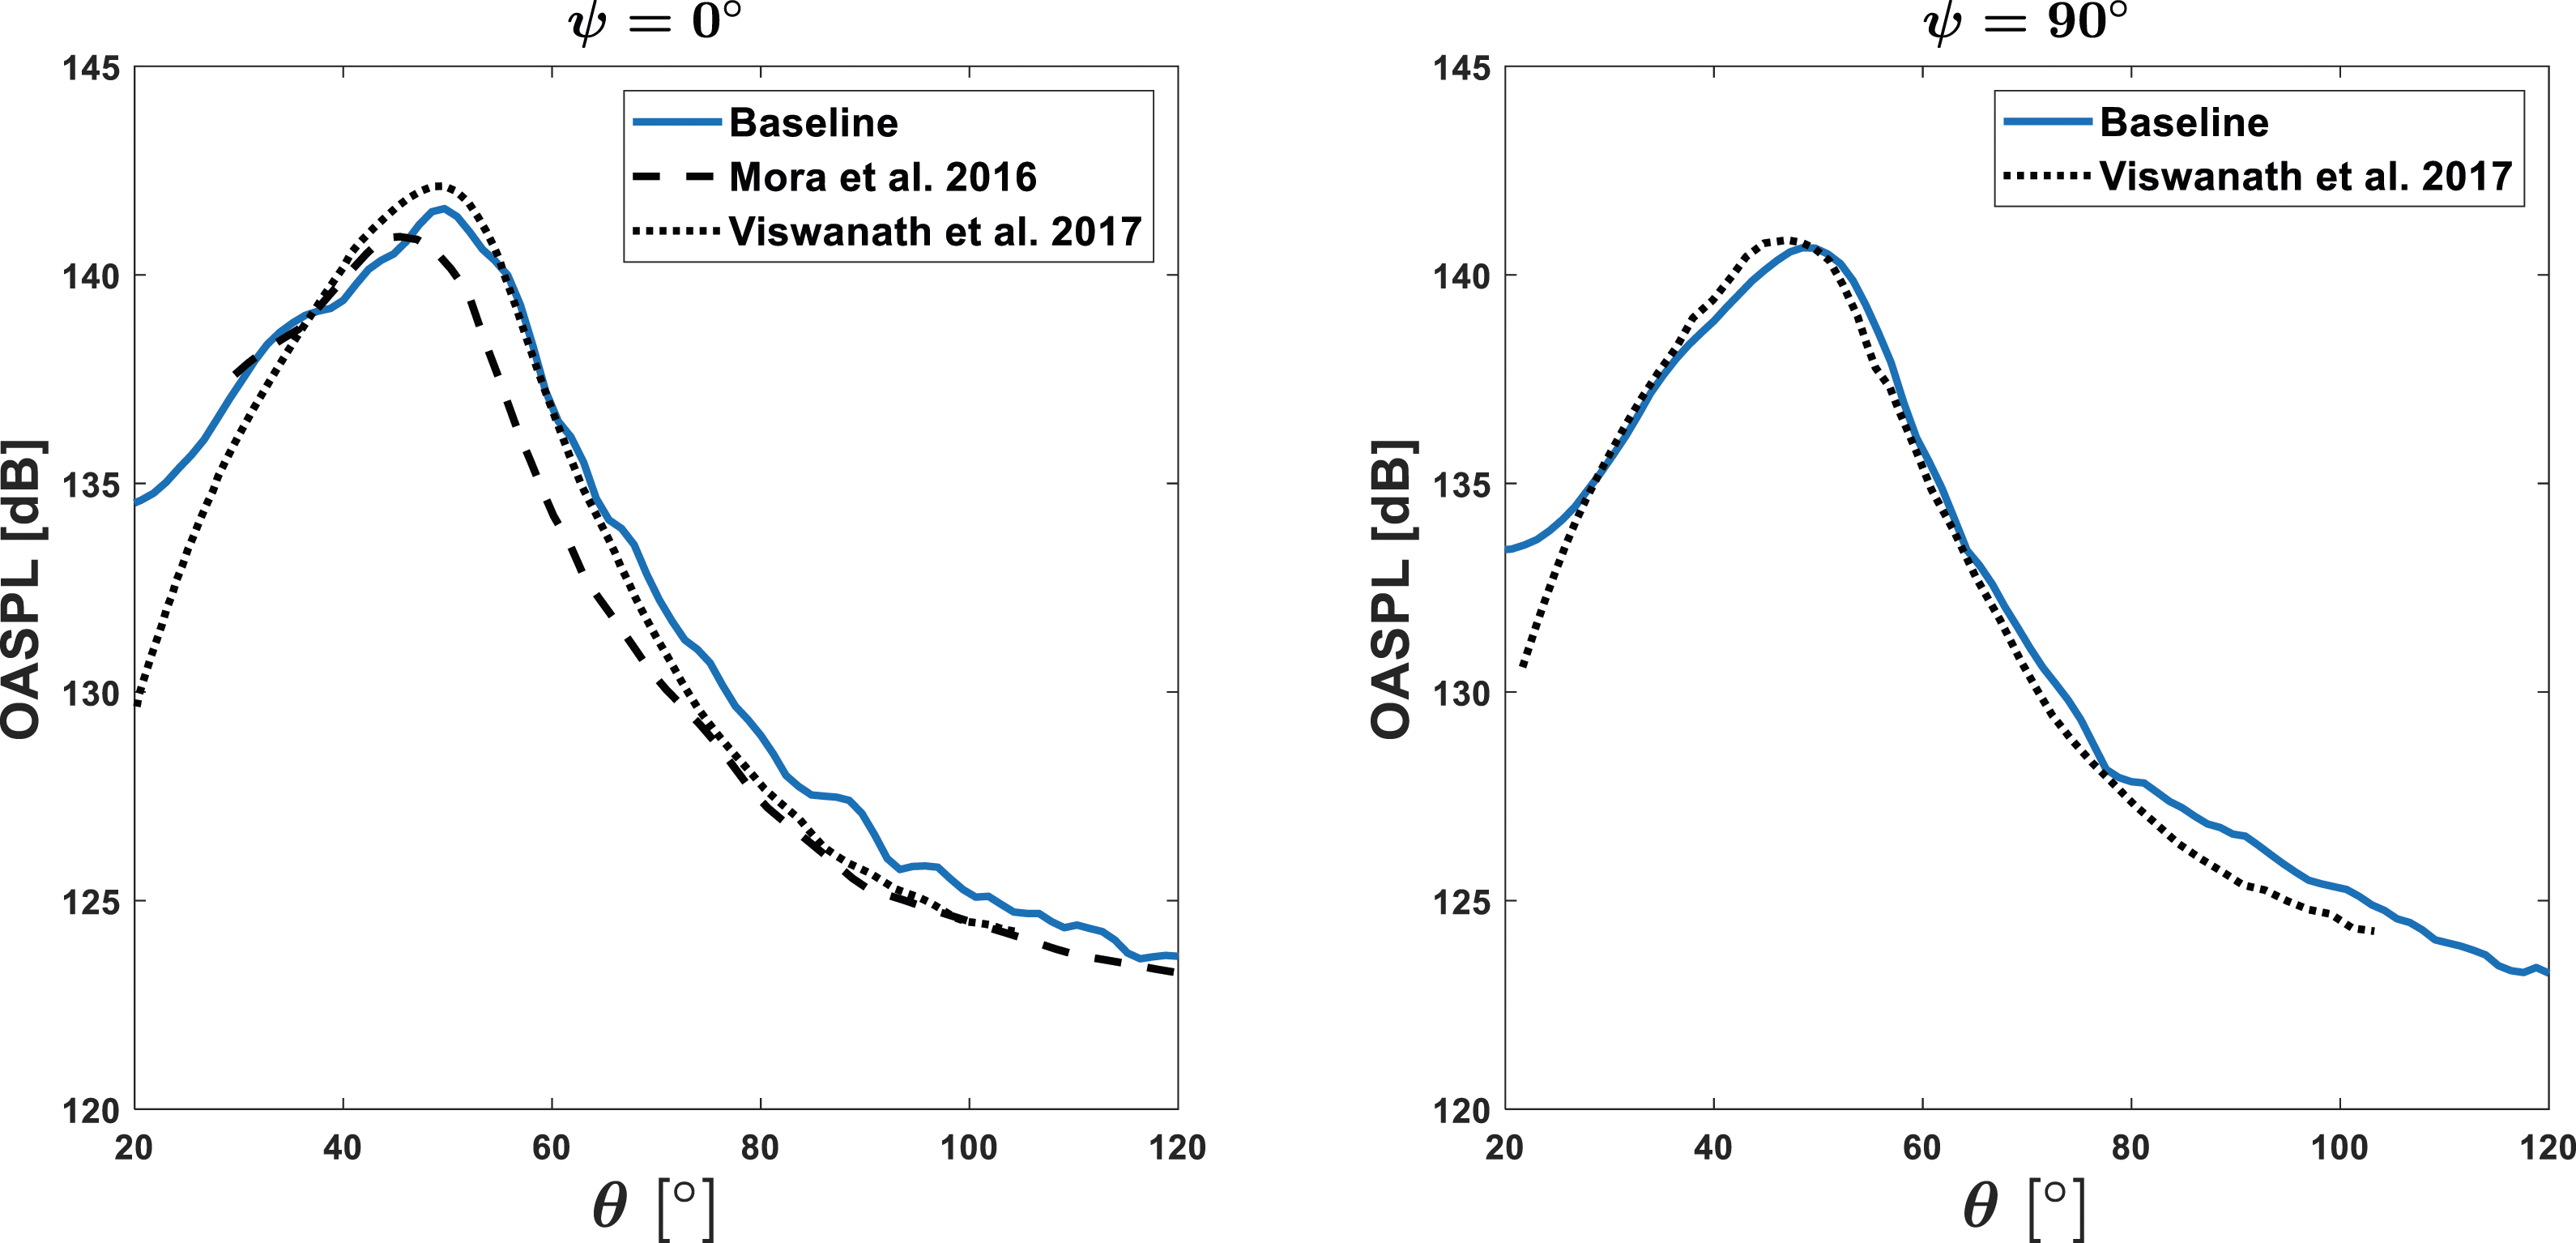


A contour of SPL versus directivity angle and St is shown in Figure 10. For both planes, there is a distinct peak for Contour of SPL versus directivity angle and Strouhal number; shown are the minor plane (left) and major plane (right).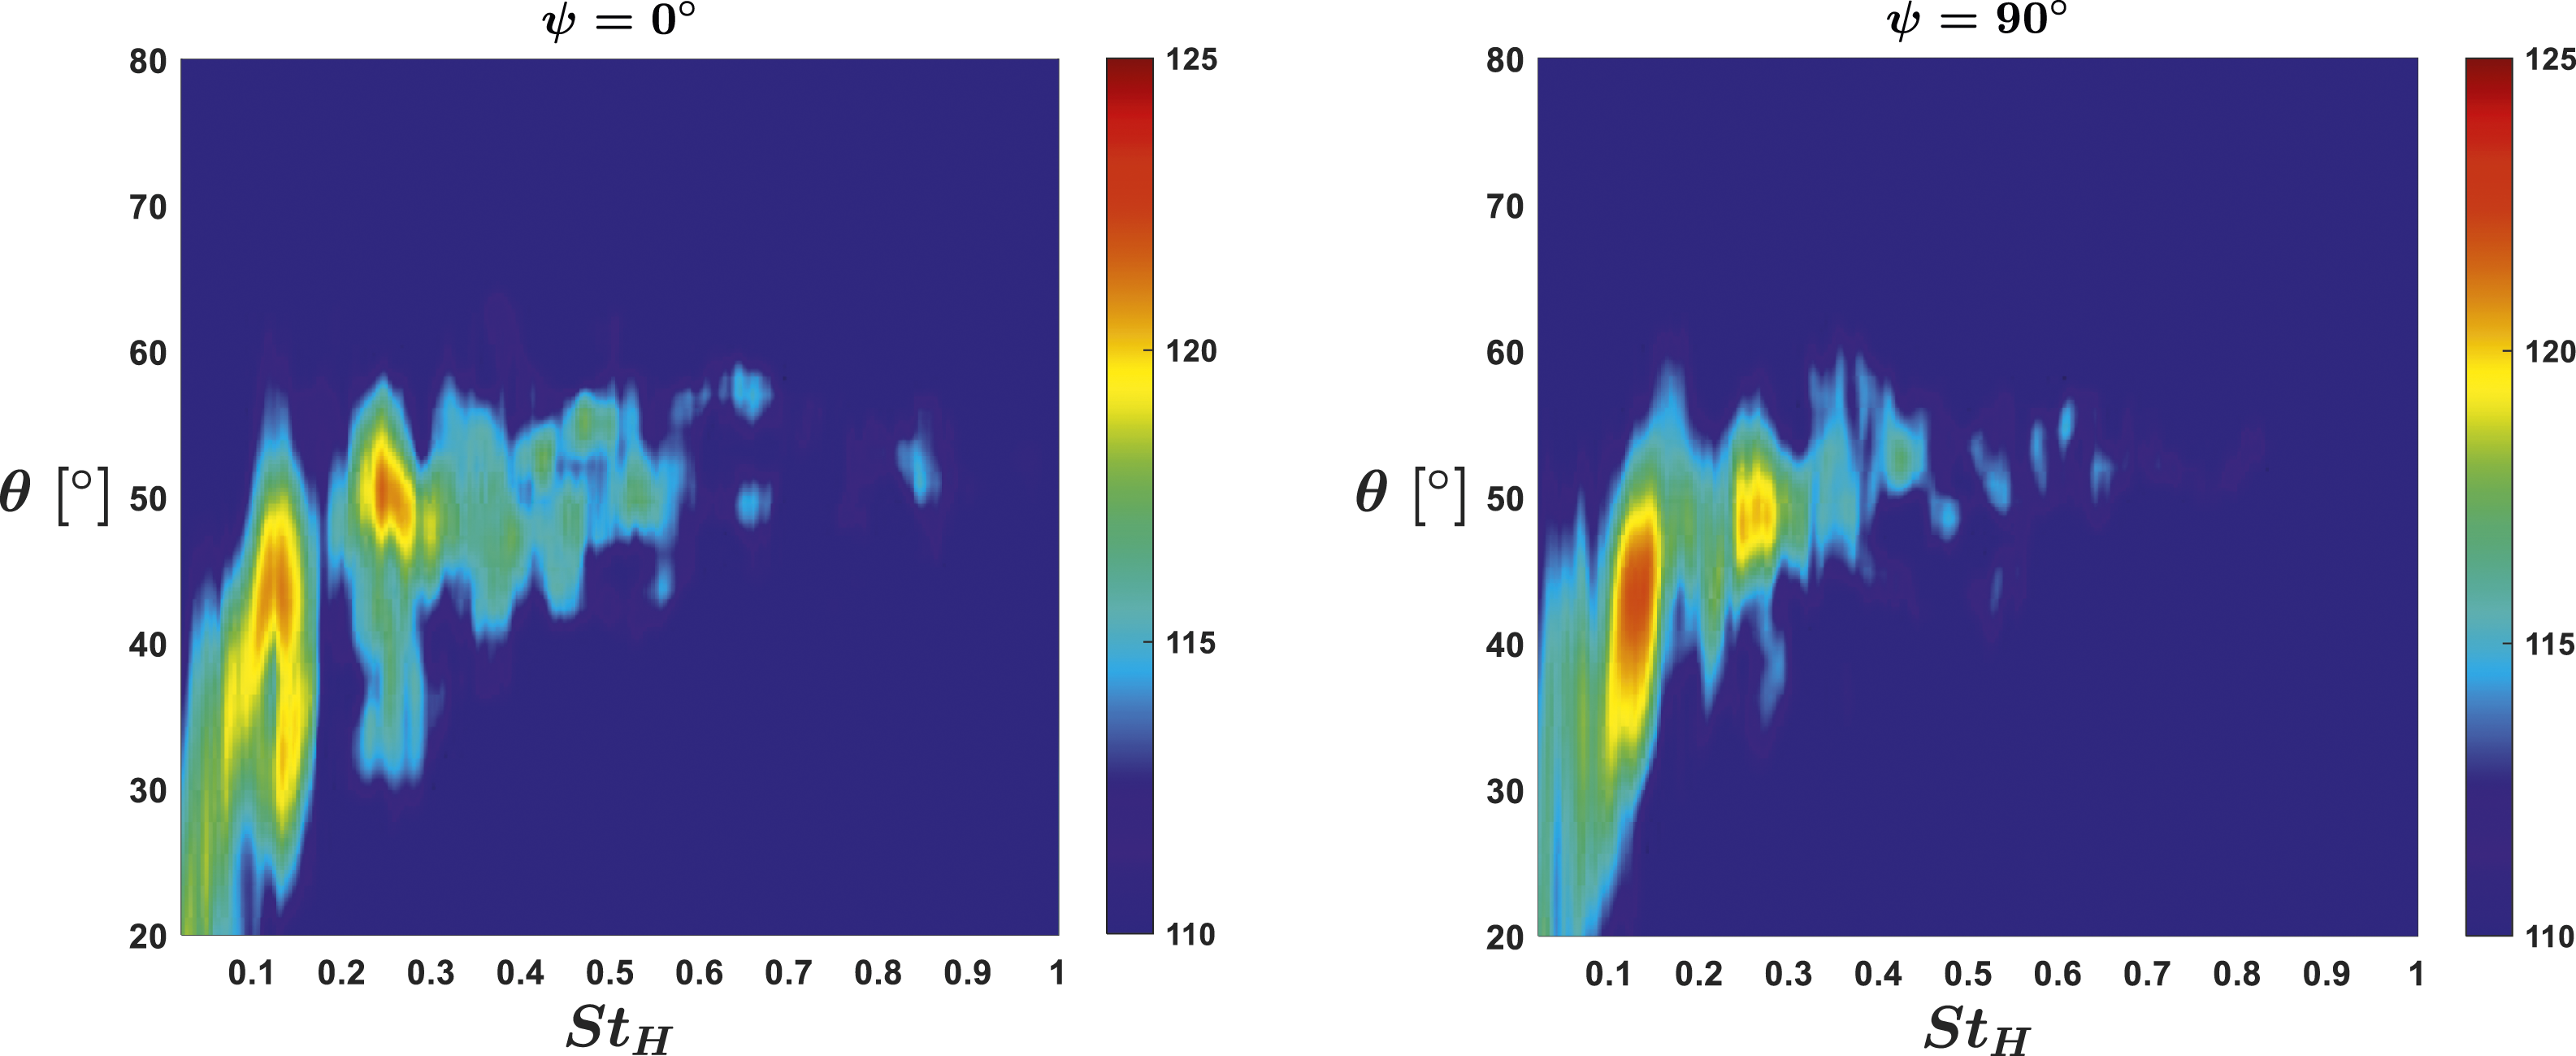
There are several other works that have covered the same jet used here and there are some variations in the peak directivity and dominant frequencies. Most of these studies report St based on the equivalent nozzle diameter,
Figure 6 shows St 0.15 to be the most amplified coherent structure in the near field, which shows up as a secondary spectrum peak at the peak emission angle and as the peak frequency for emission angles slightly less than the peak one. The theory proposed by Malczewski and Mankbadi
44
also demonstrated the role of natural amplification to initiate fundamental-harmonic interactions, and it is evident that St 0.15 is more amplified. Even though 0.25 is the peak St at the peak emissivity angle, St 0.15 still plays a major role and is more suitable to target with excitation. Thus, St 0.15 is taken as the fundamental that should be reduced by interactions with the harmonic, St 0.30, which will be added via excitation. Based on the results shown in Fig. and 10, reduction of St 0.15, should generate noise reduction for polar angles between
Excited LES results
Single-mode excitation case
The first case considered is that of a single forcing mode at
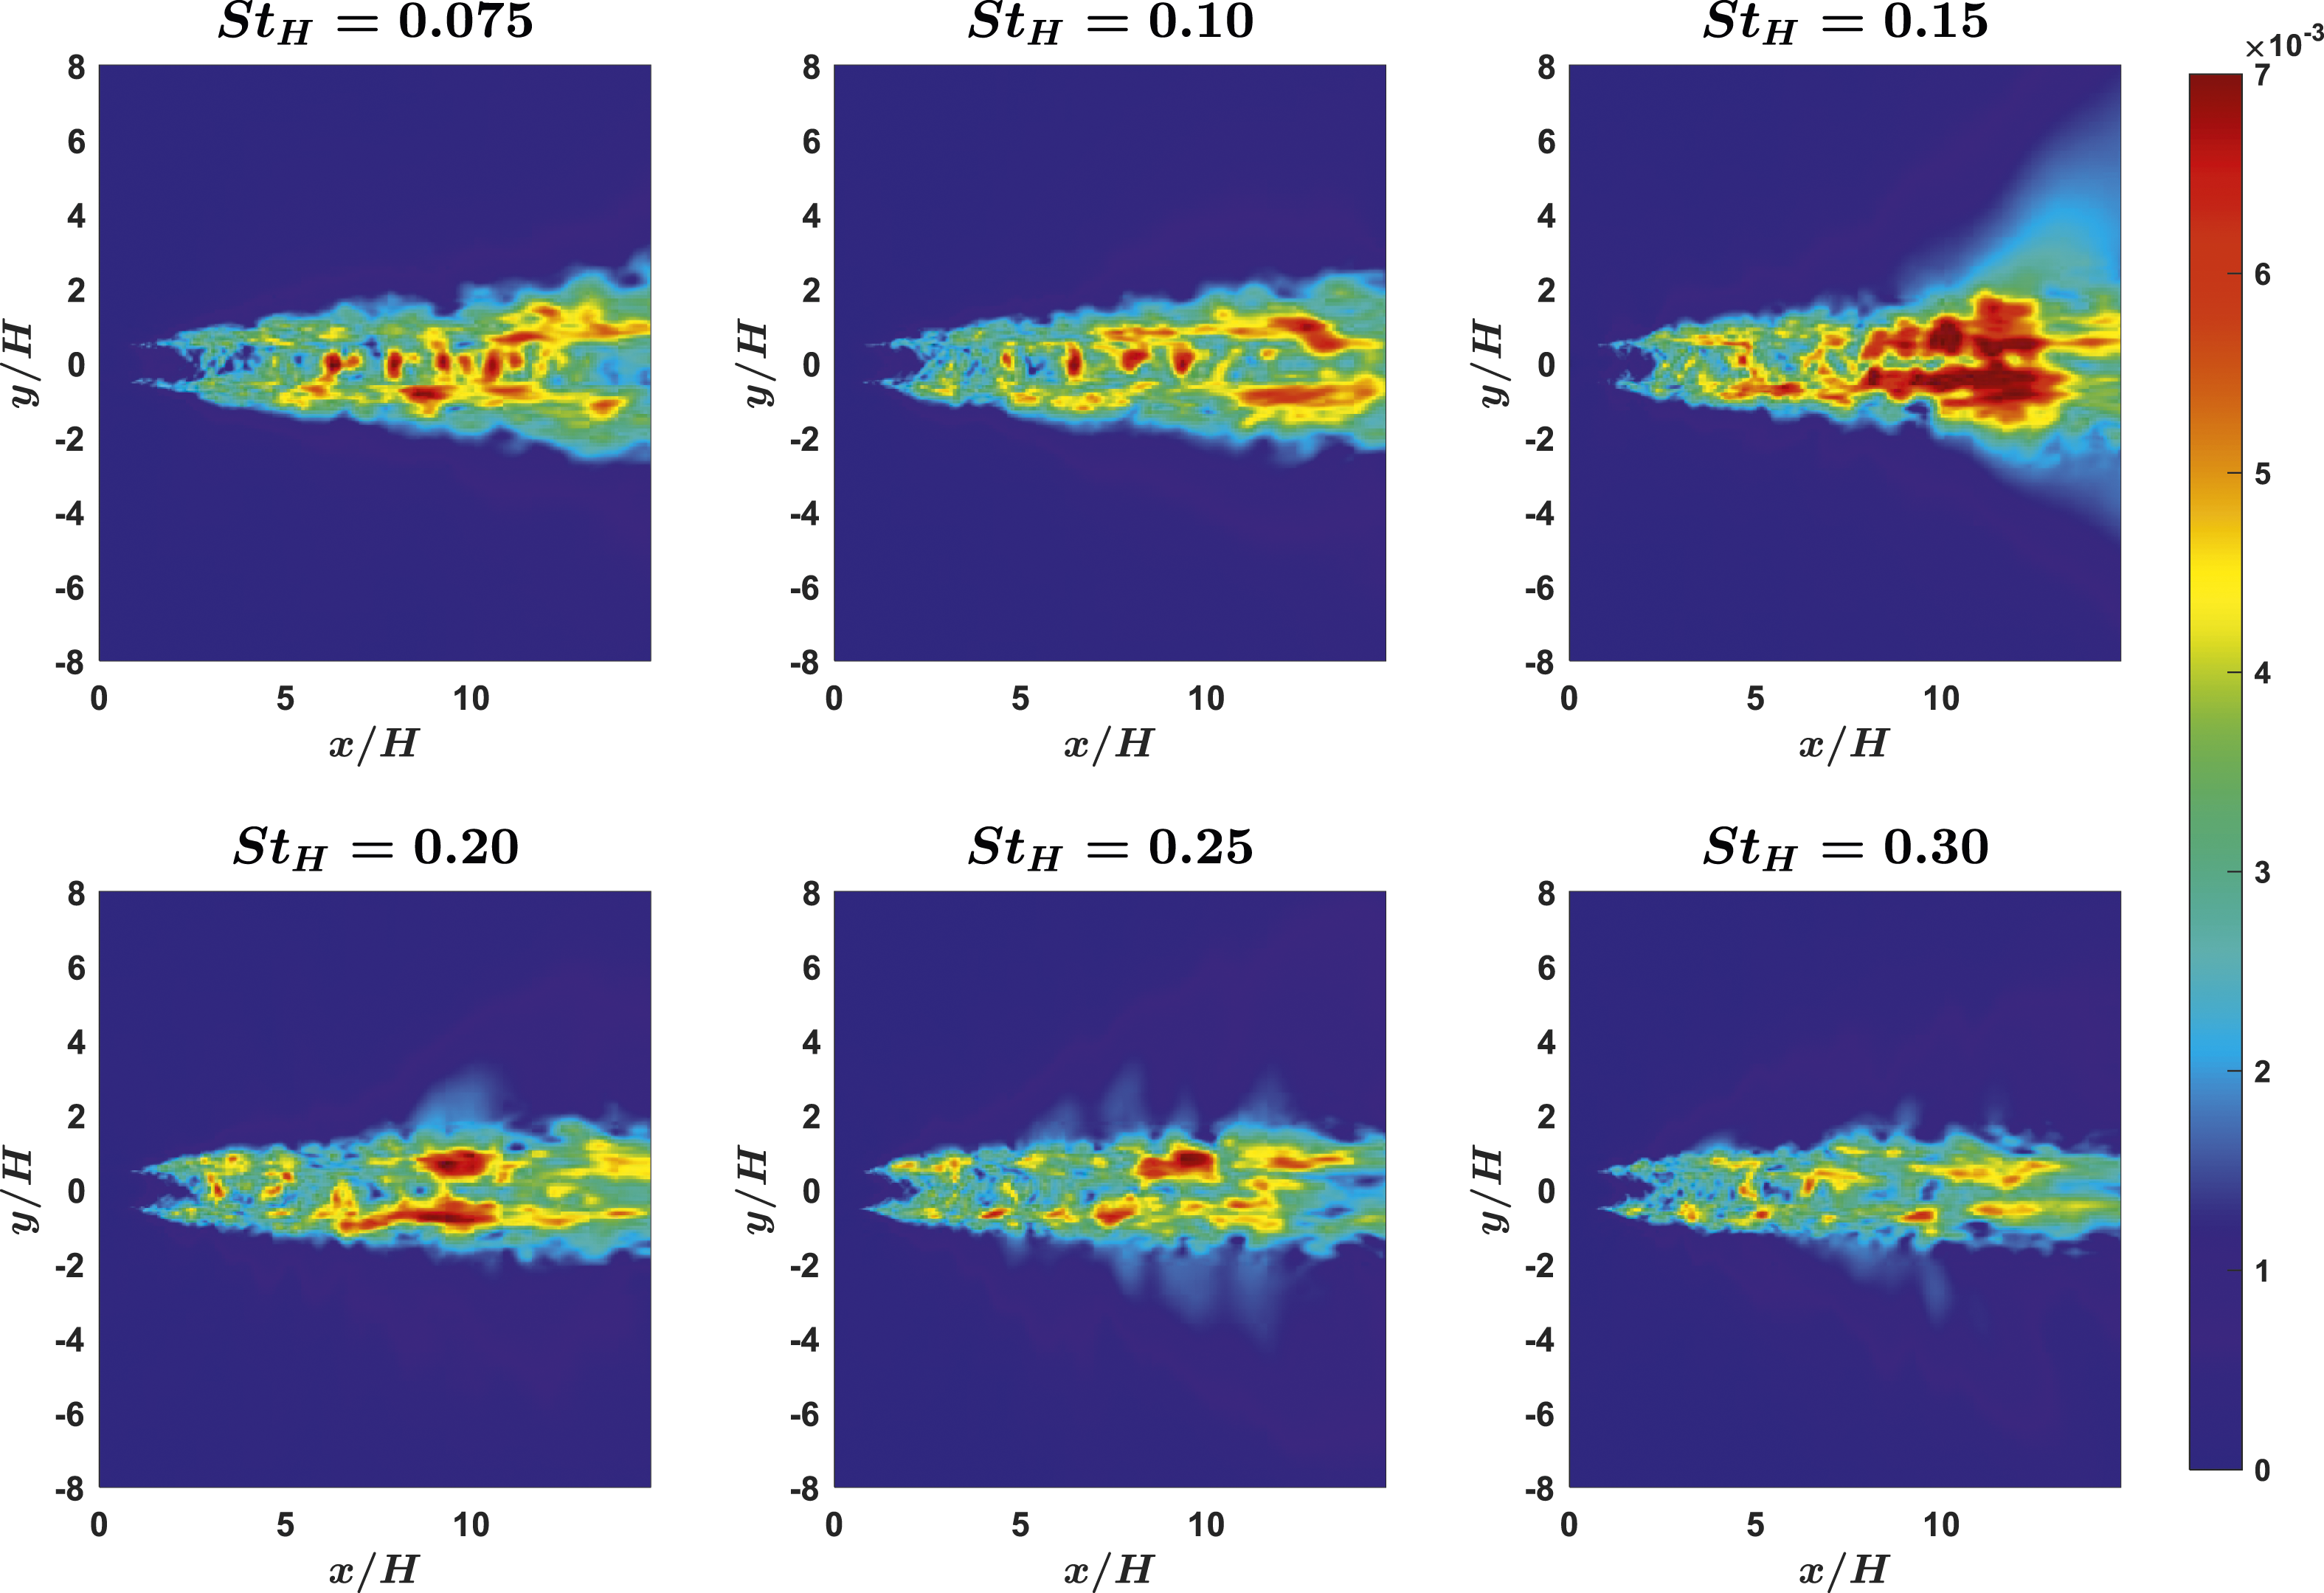
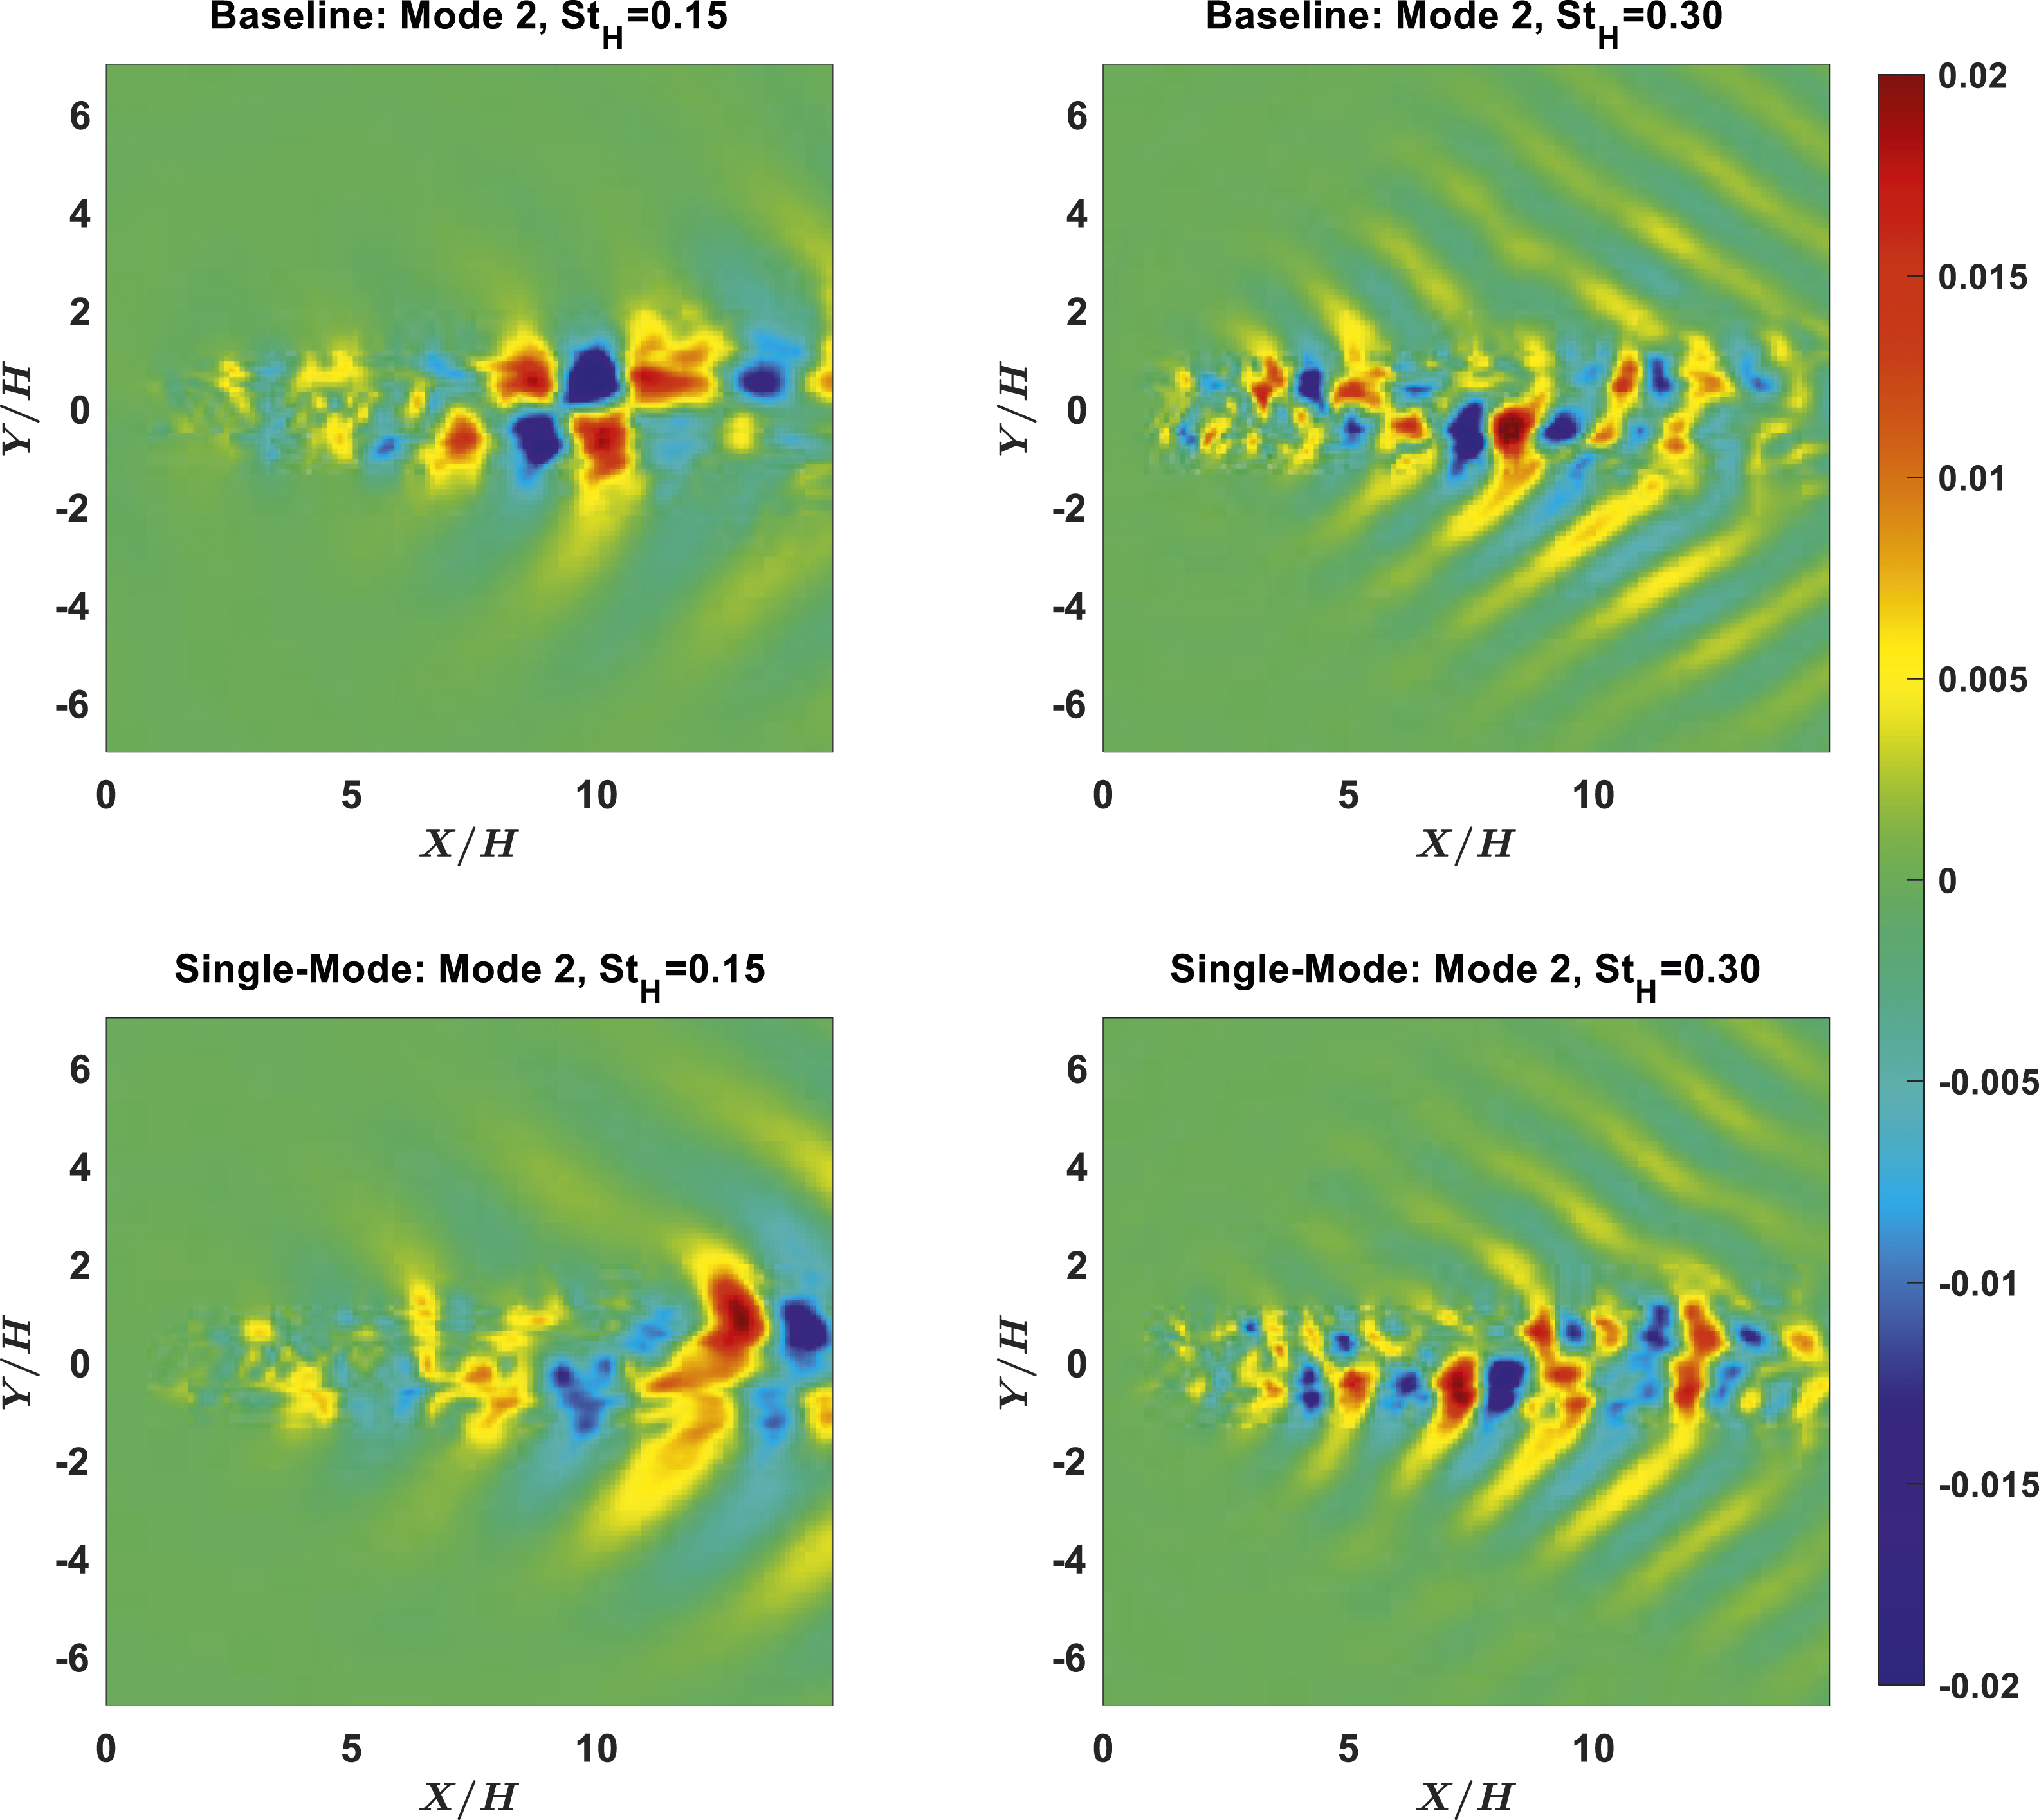
Figure 11 shows a comparison of pressure contours for St’s 0.15 and 0.30 between the excited and baseline case. Qualitatively, there is considerable reduction of St 0.15. The forced St, 0.30, does not considerably amplify downstream for the excited case, so actuation tones should be absent in the far field spectra. The symmetric structure of the excitation is also clearly visible up to Near field minor plane contours of 

This integration is shown in Figure 12. The reduction of St 0.15 is again very apparent at streamwise locations of Integrated pressure comparing baseline and single-mode excited cases; St’s 0.15 (left) and 0.30 (right) are displayed.
Positions of the near field large-scale structures were manually tracked, and convection velocities were backed out. The eddy displacement, Eddy displacement (left) and eddy convection velocity (right) comparing single-mode excitation and baseline case.
Far field noise directivity is shown in Figure 14. In the minor plane, there is a slight increase in the peak noise, about 0.3 dB. However, in the major plane, there is a peak noise reduction of 1 dB. In both planes, the peak emissivity angle remains Minor (left) and major (right) plane OASPL comparison with single-mode excitation. Minor (left) and major (right) plane 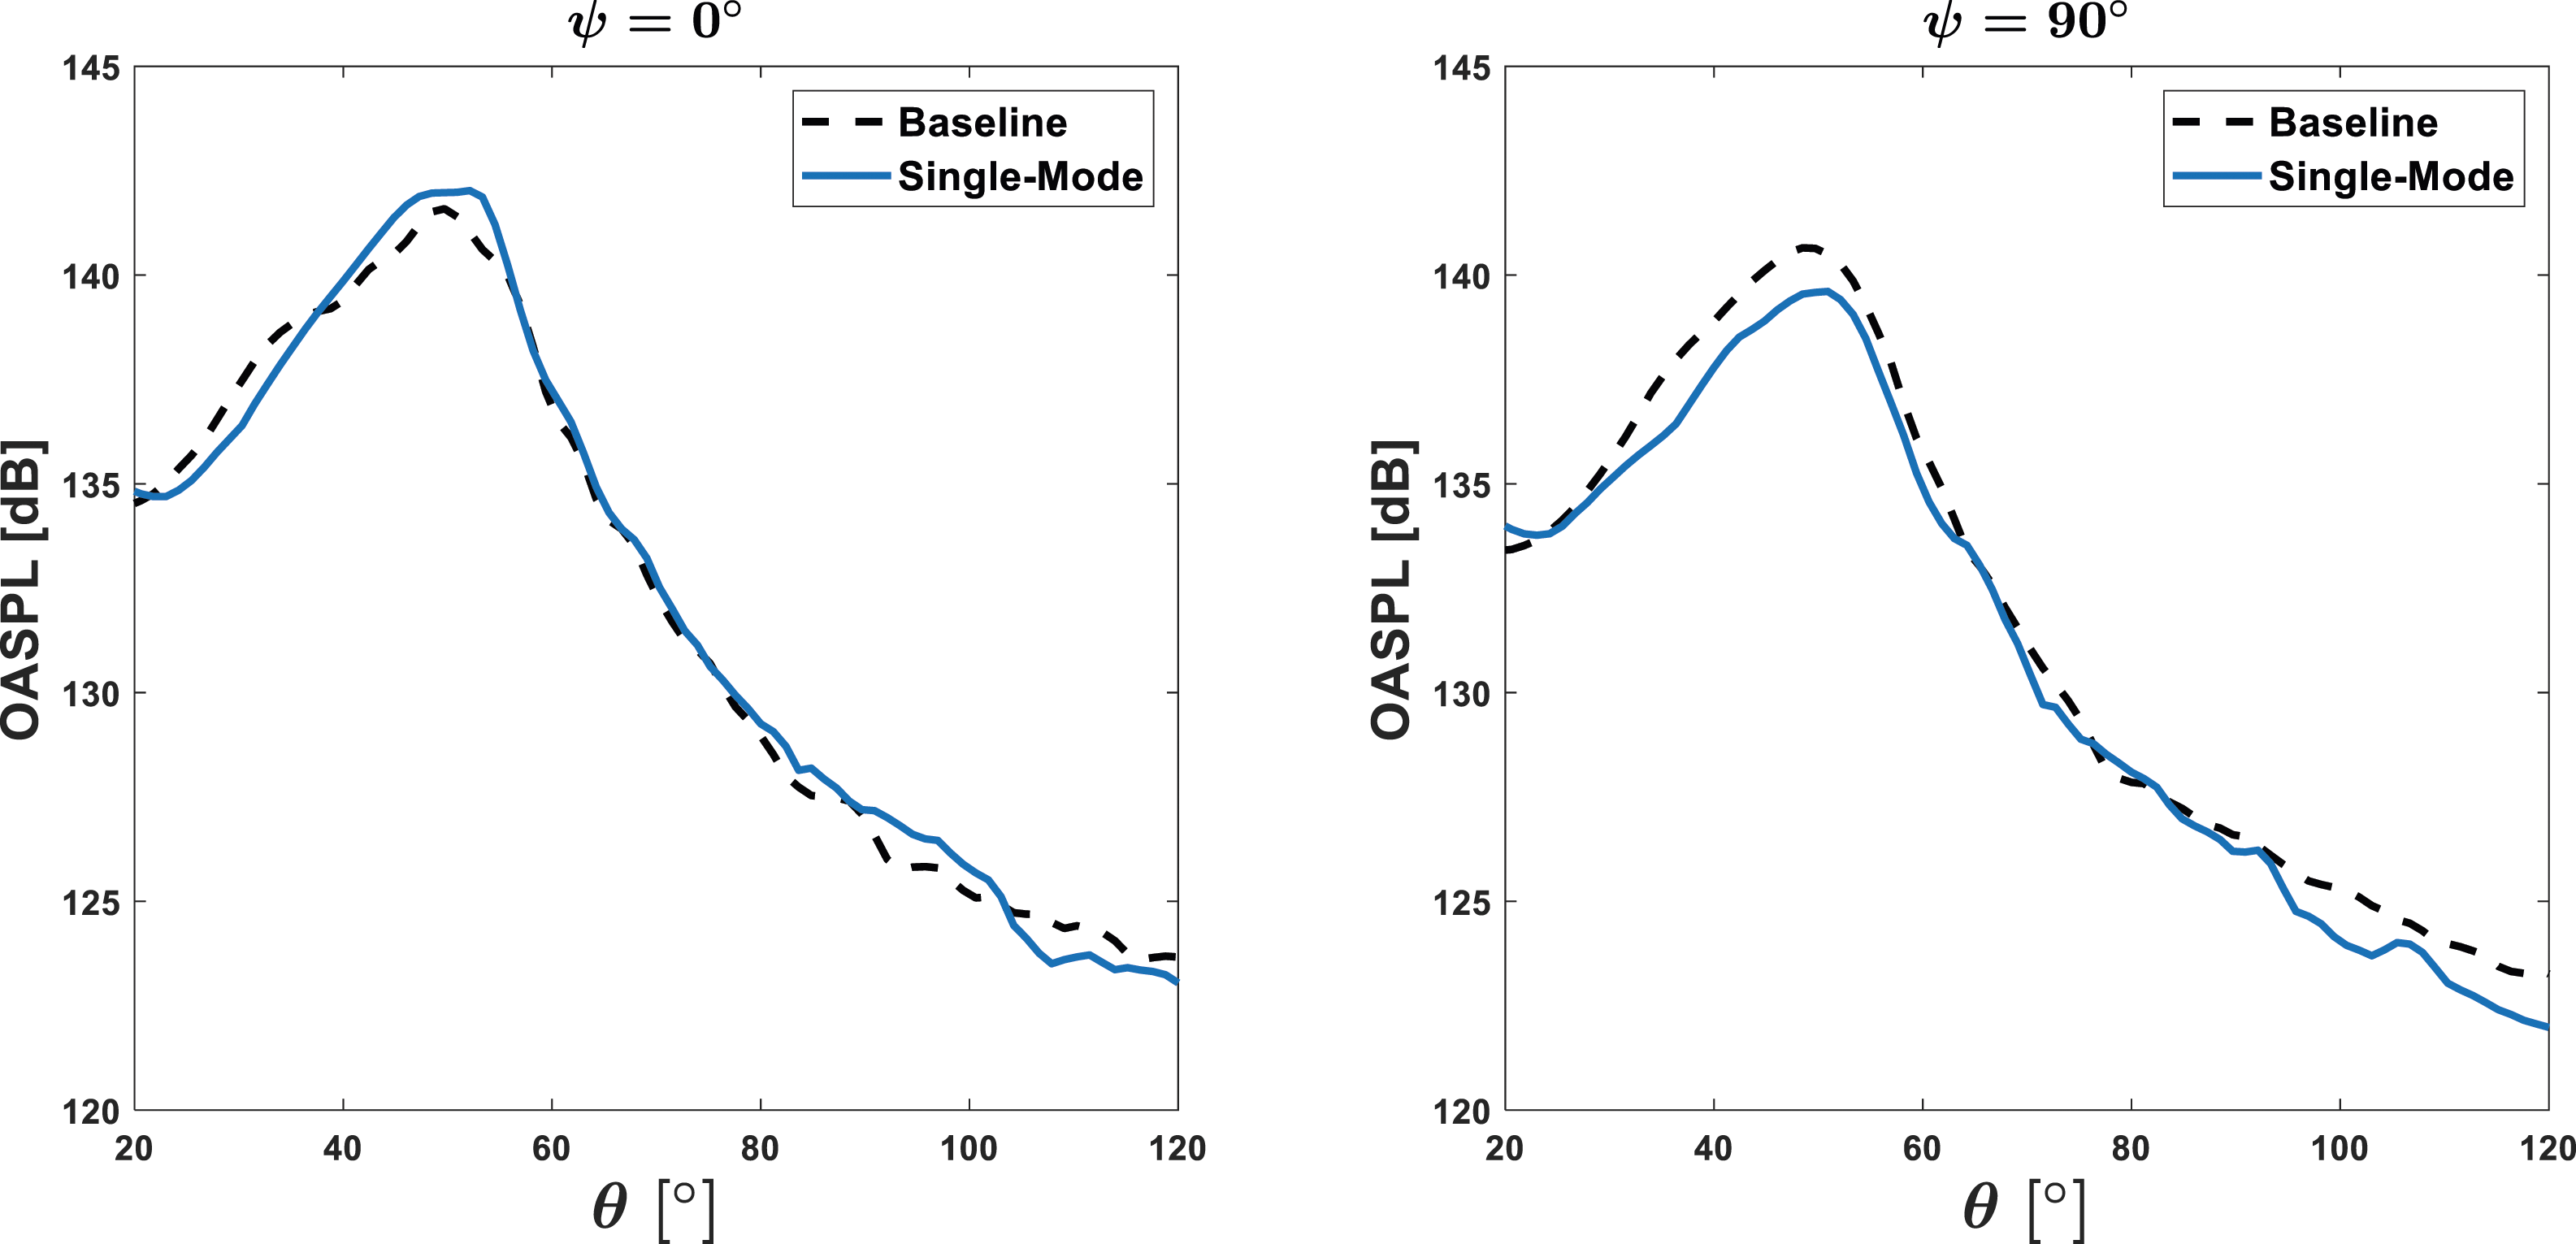

Spectra at the peak emissivity angle are shown in Figure 16. In the minor plane, there is an increase in the noise between St’s 0.15 and 0.20, which is where the rise in OASPL comes from. The major plane sees a drastic decrease in noise around the peak of St 0.25, resulting in the 1 dB of OASPL. It is noted that at the peak emissivity angle, St 0.15 was not the dominant peak. An additional spectra comparison is shown for Comparison of spectra at peak emissivity angle for single-mode excitation. Comparison of spectra at Comparison of SPL at St 0.15 for single-mode case.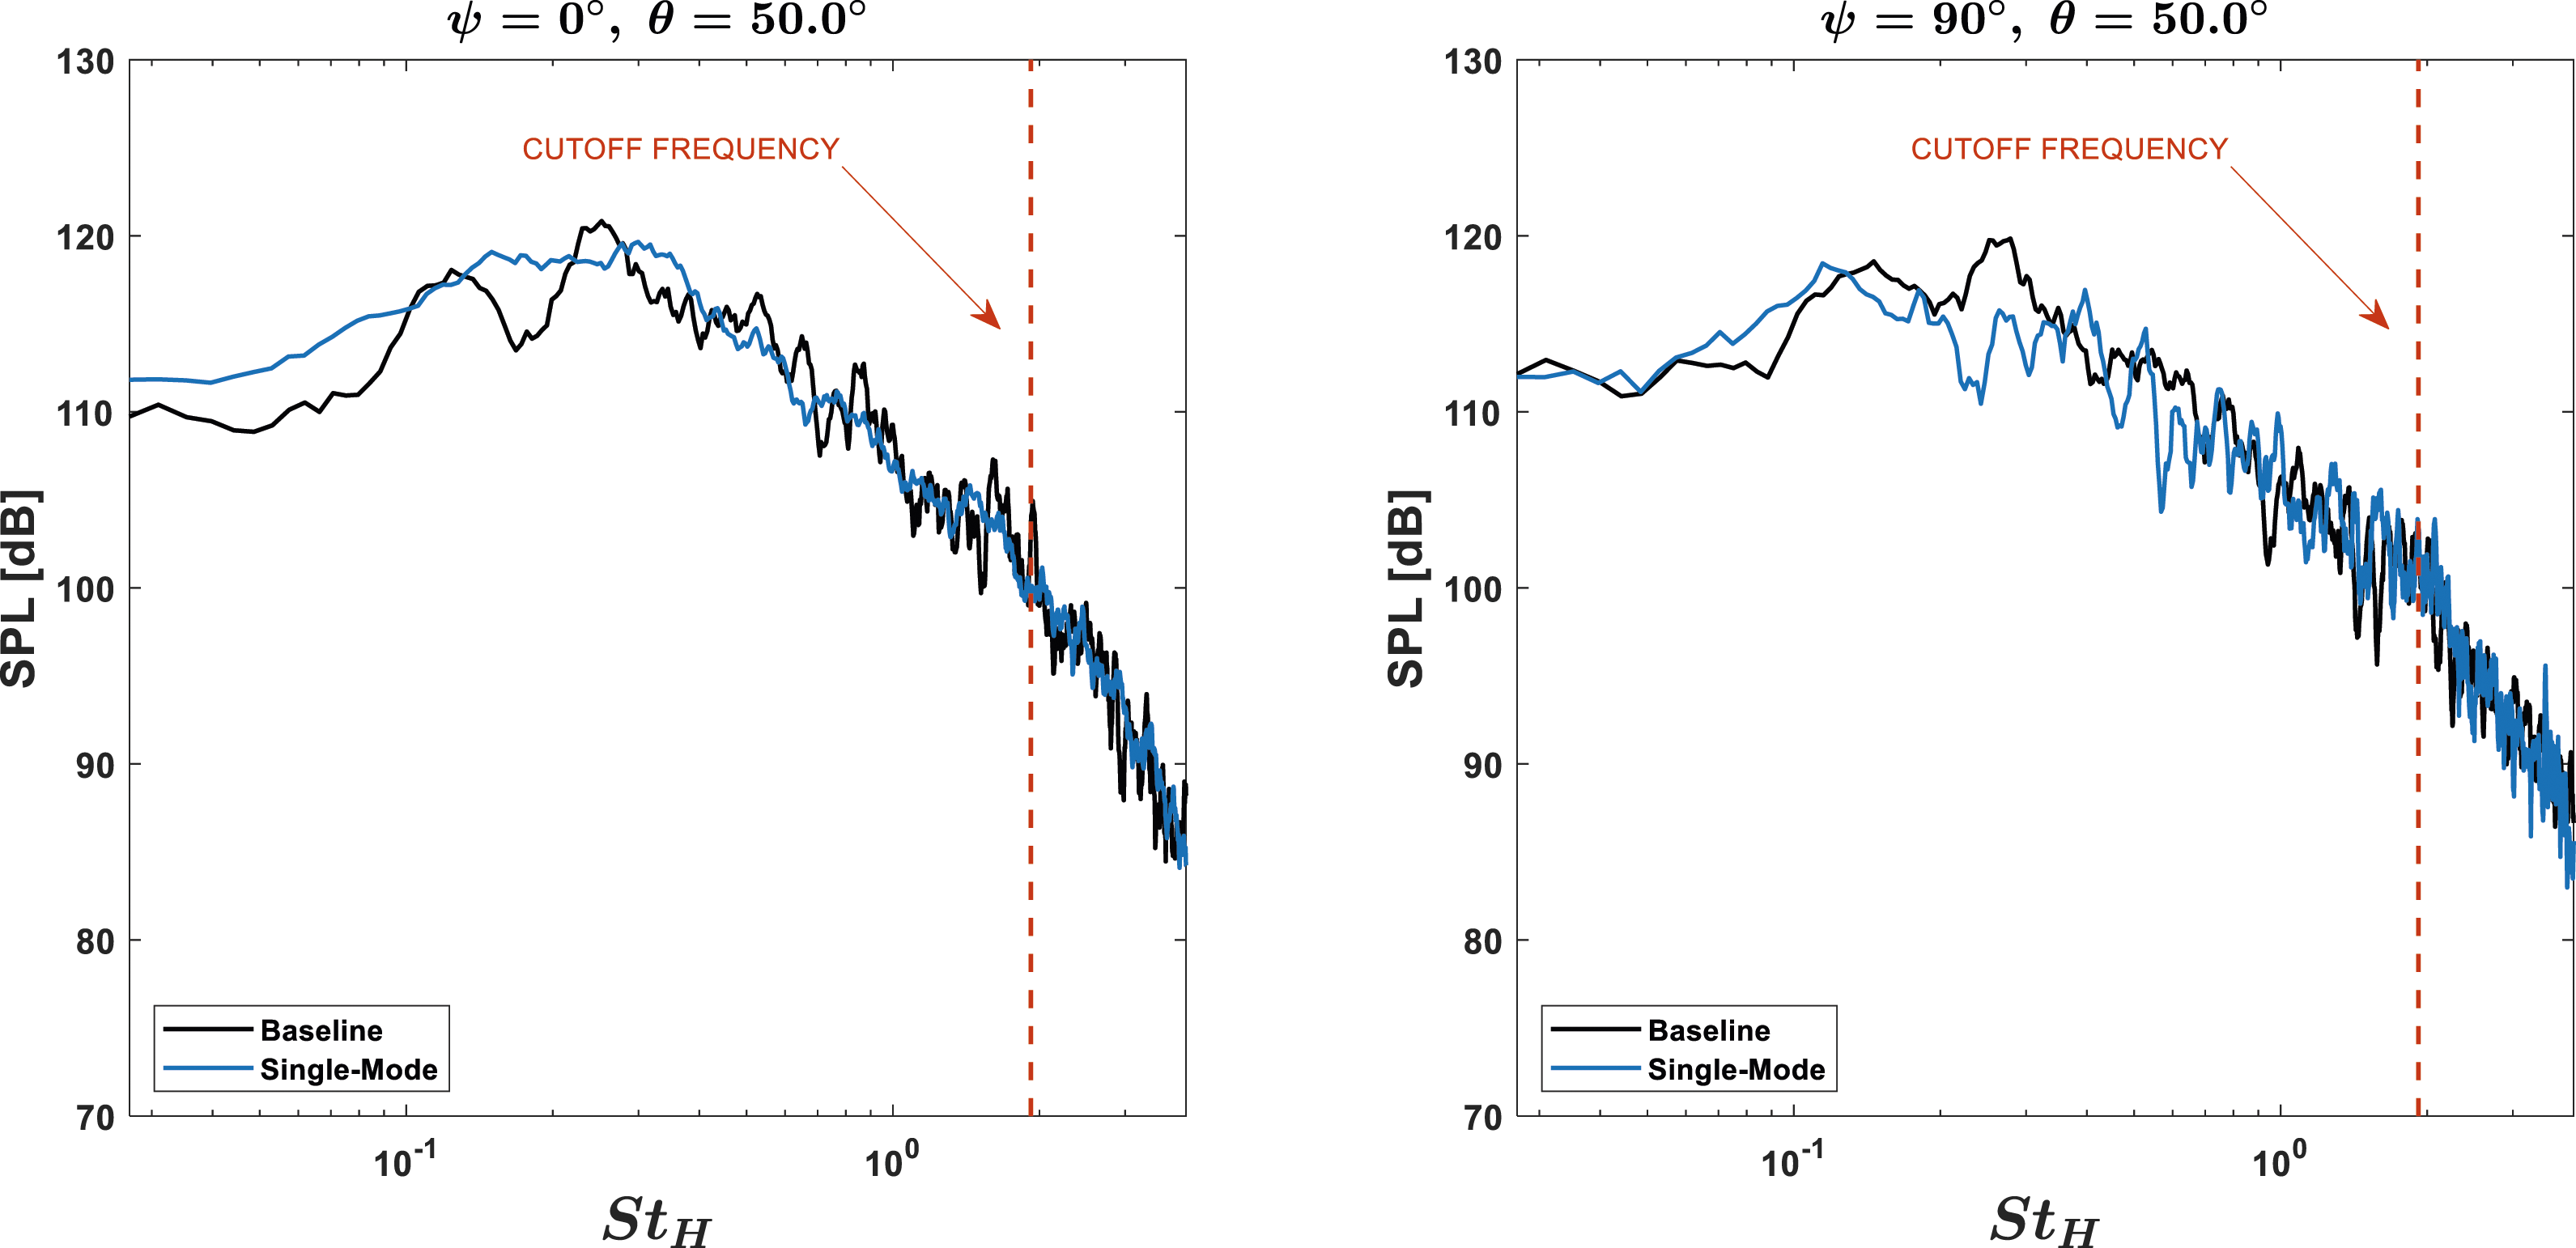


Spectral proper orthogonal decomposition (SPOD) is used to separate the spectra into energy containing modes. 66 The objective of SPOD analysis is to identify wave packets based on their associated frequencies. These modes capture the variations in wave packet shapes for each St These variations are crucial to the jet’s acoustic properties and identifying the effectiveness of excitation frequency, and later phase, on reducing jet noise. The same set of 4200 snapshots are used in the minor plane. These snapshots are split into 31 blocks, each containing 256 snapshots with a 50% overlap. This struck a balance between having a well-resolved spectra and having distinct spatial modes.
Spectra showing the first and second mode energies are shown in Figure 19. These spectra are normalized by the flow energy integrated over the spectra, allowing the spectra to be thought of as a percentage of that energy represented by that mode.
67
A notable feature of the spectra for the single-mode case is that there is an increased gap between the first and second mode around St 0.30, indicating the introduction of a new wave packet at that frequency from the excitation. It is also observed that there is a narrowing of the gap between the first and second mode in the lower frequency range for St<0.15, also indicating an effect on those frequencies. SPOD spectrum comparing baseline and single-mode case showing first and second mode energies; mode number increases moving downward.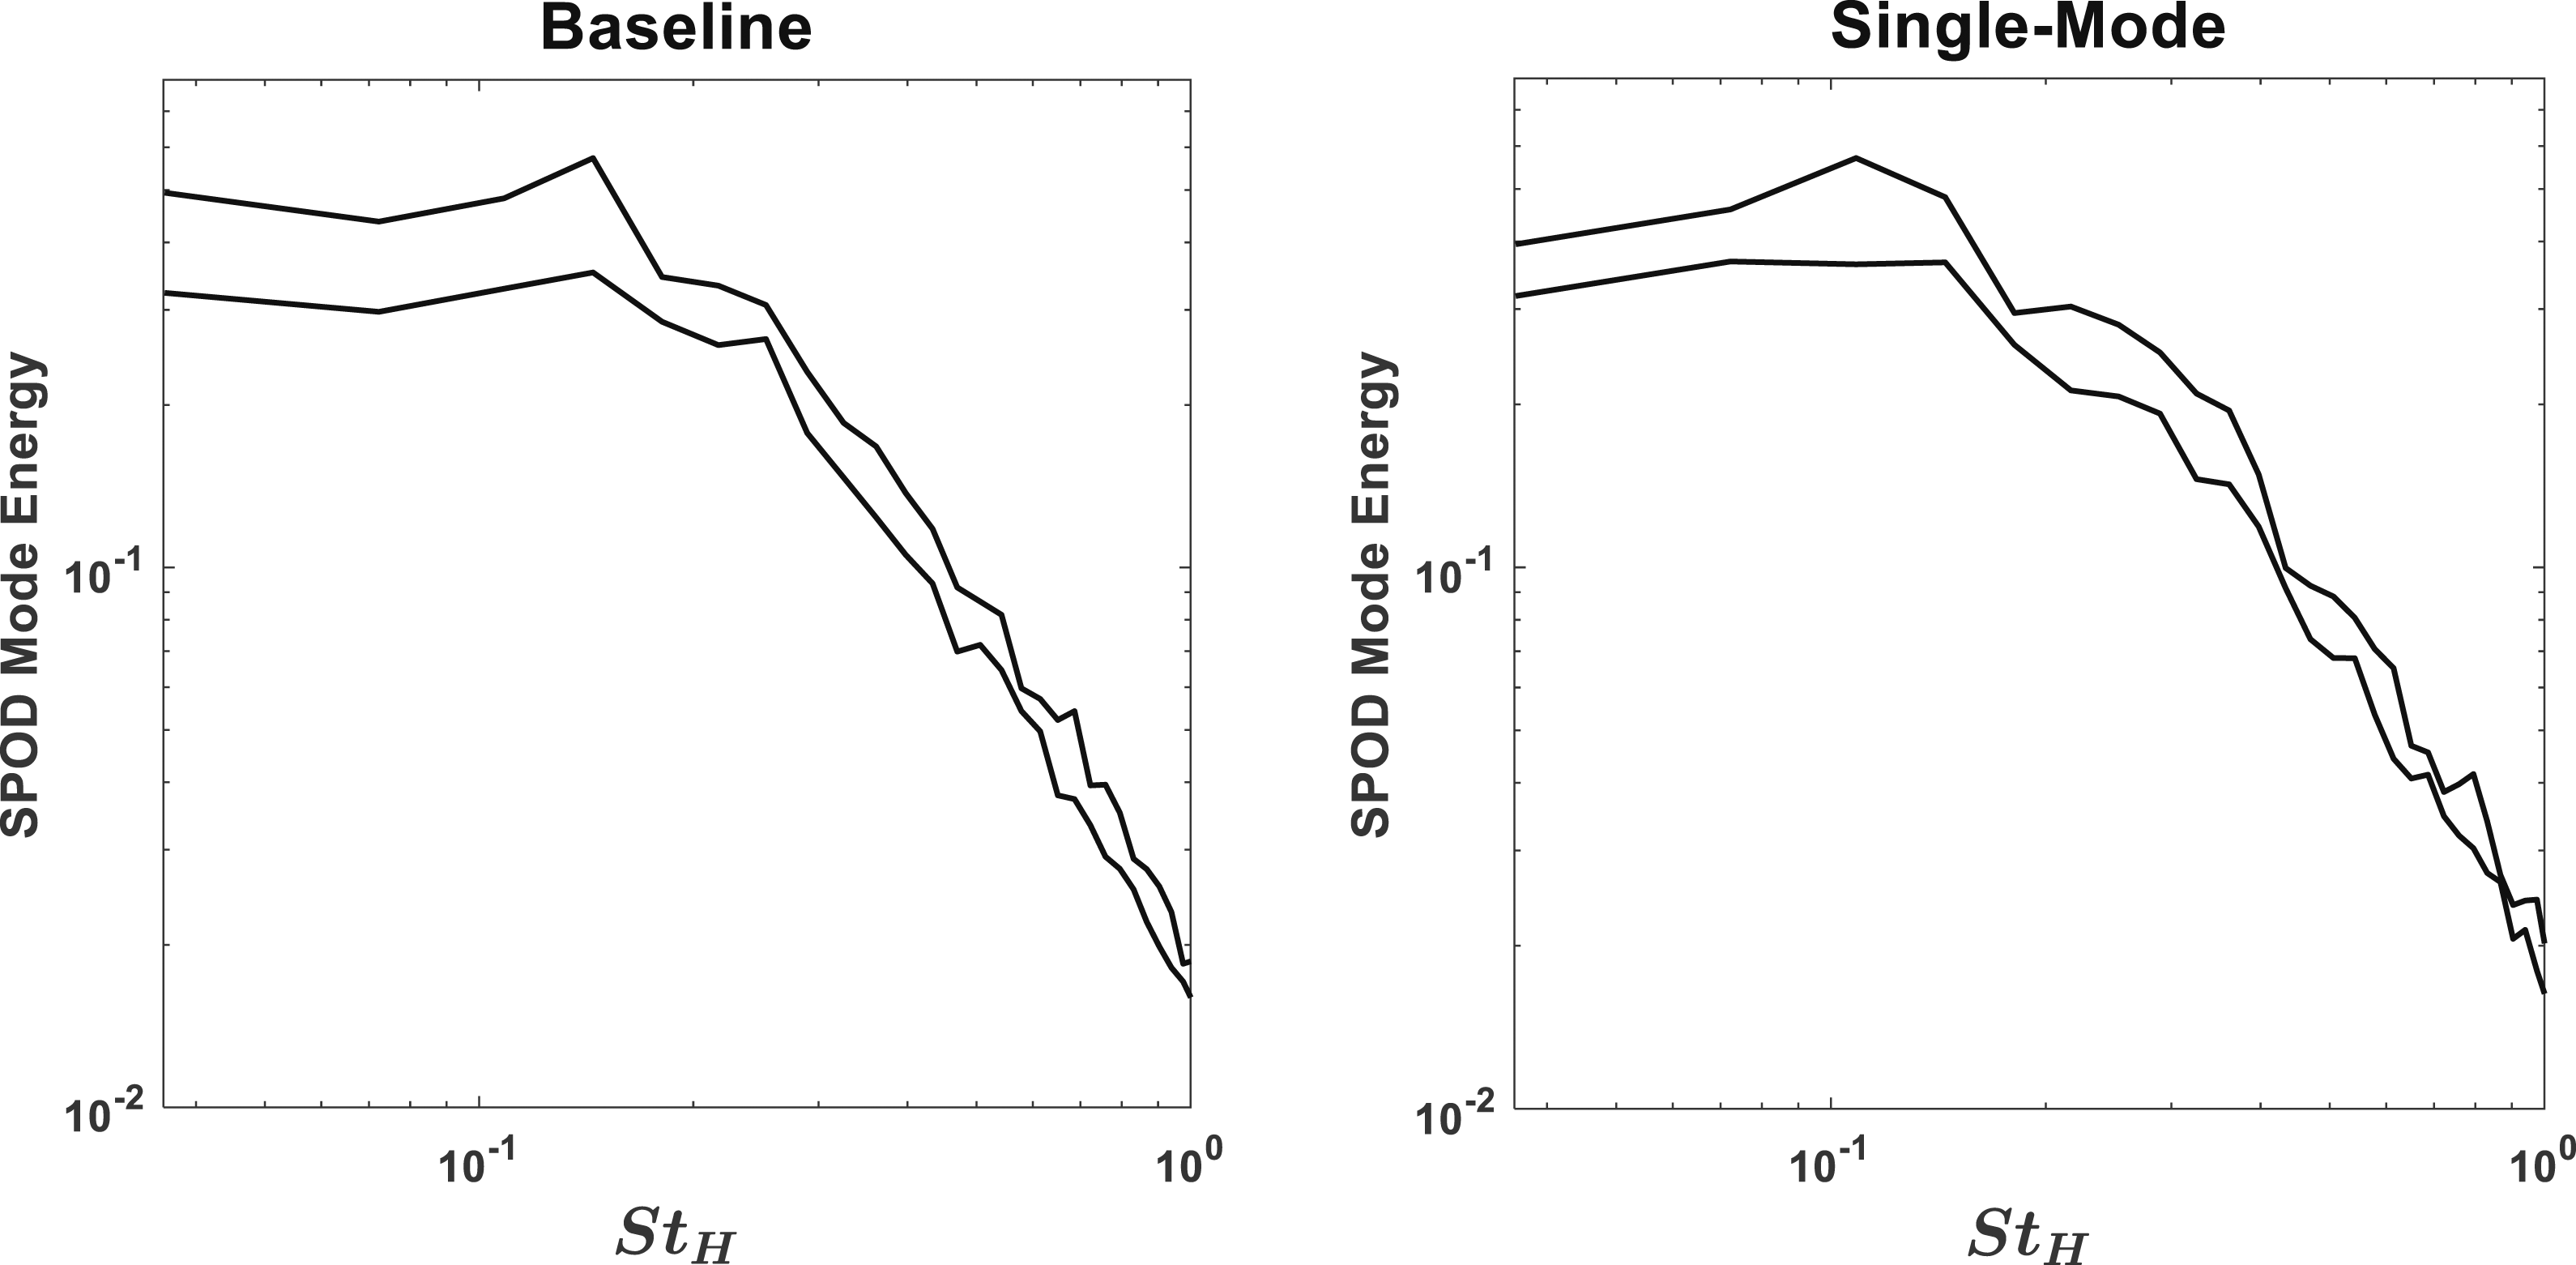
The real component of the first and second modes are shown in Figures 20 and 21, respectively. The figures show that the excitation increases the coherence of the wave packet structures at St 0.15. Then in the second mode the structures at St 0.15 are significantly broken up. In the baseline case, they formed into coherent structures at First mode SPOD contours comparing baseline and single-mode excited case; shown are St’s 0.15 and 0.30. Second mode SPOD contours comparing baseline and single-mode excited case; shown are St’s 0.15 and 0.30.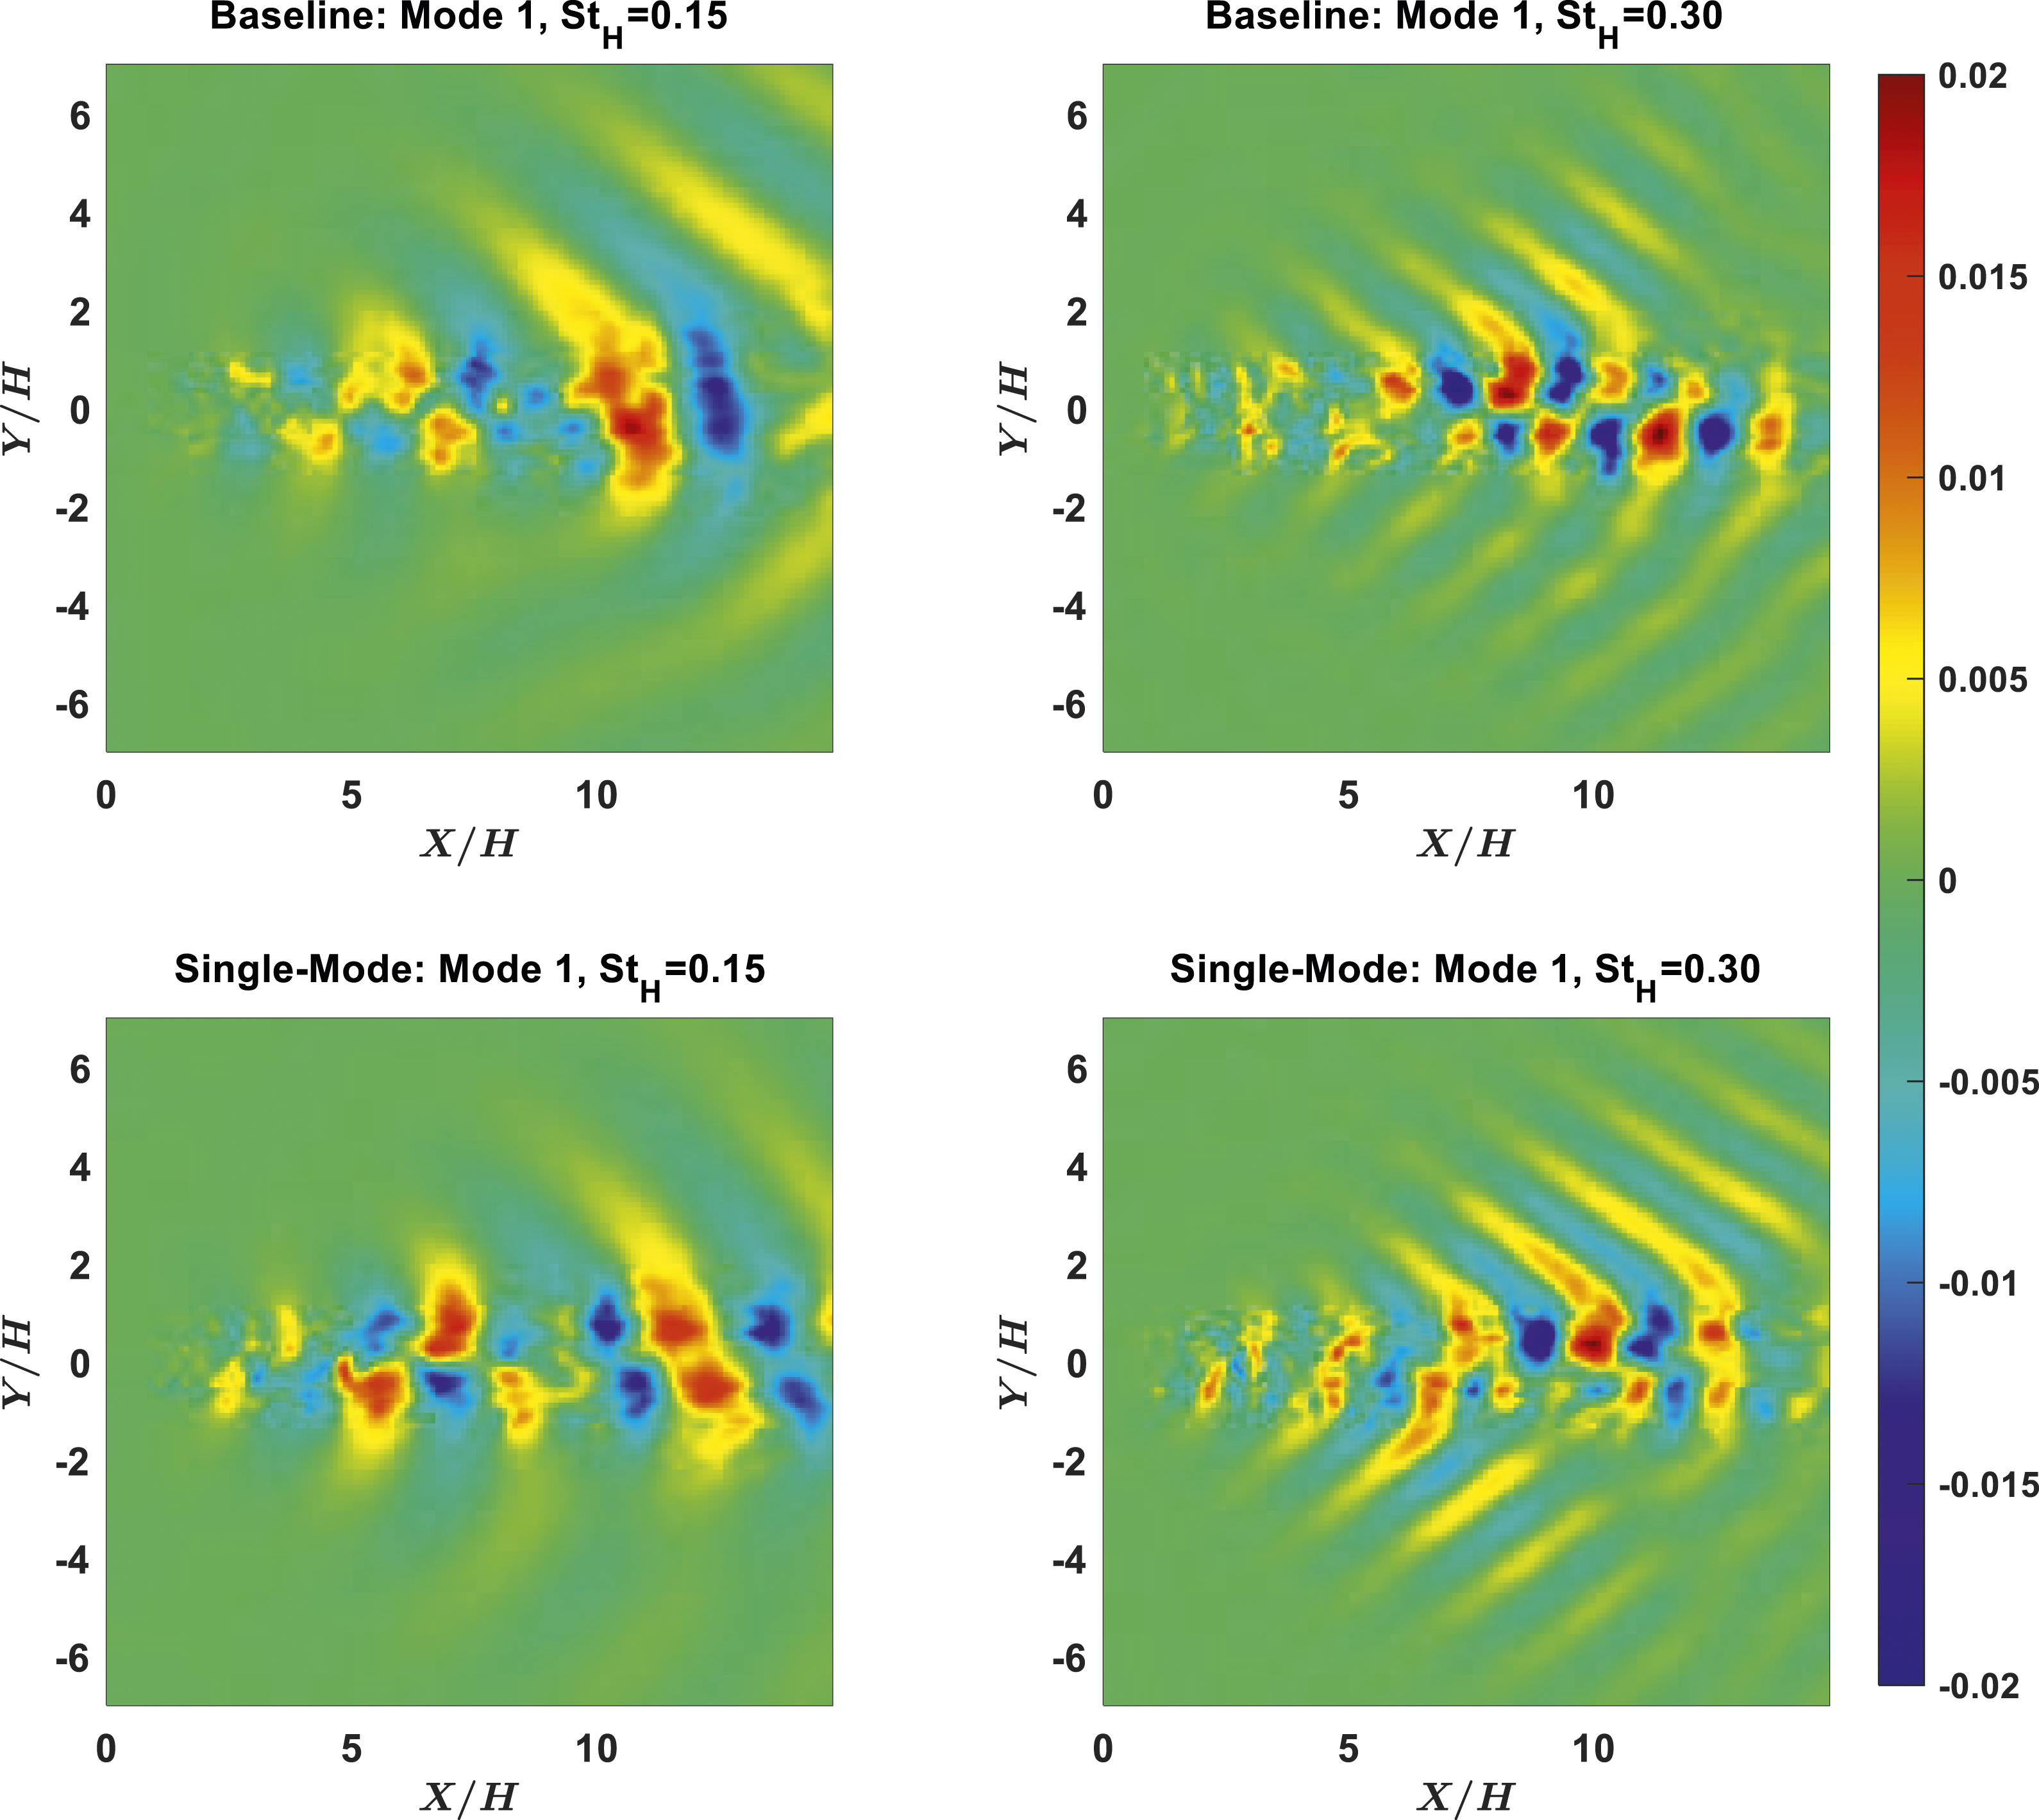
Turbulent kinetic energy (TKE) is computed along the shear layer and displayed in Figure 22. At X/H = 0 (middle), the increase in initial TKE is apparent and the difference from the baseline is due to the excitation at St 0.30. This mode proceeds to amplify until reaching a peak around X/H = 2.5, where the TKE peak of the excited case is slightly higher than that of the baseline case. This location corresponds to the streamwise location where the integrated pressure greatly increases at St 0.30 in the excited case as was shown in Figure 12. As was earlier suggested, St 0.30 is amplified by absorbing energy from St 0.15, but the overall energy between all modes is conserved. Since the added energy at X/H = 0 is small, the peak energy around X/H = 2.5 is comparable between the two cases. Shear layer turbulent kinetic energy between baseline and single-mode excitation cases; shown are magnitudes for the full shear layer (left), initial shear layer (middle), and at the peak (right).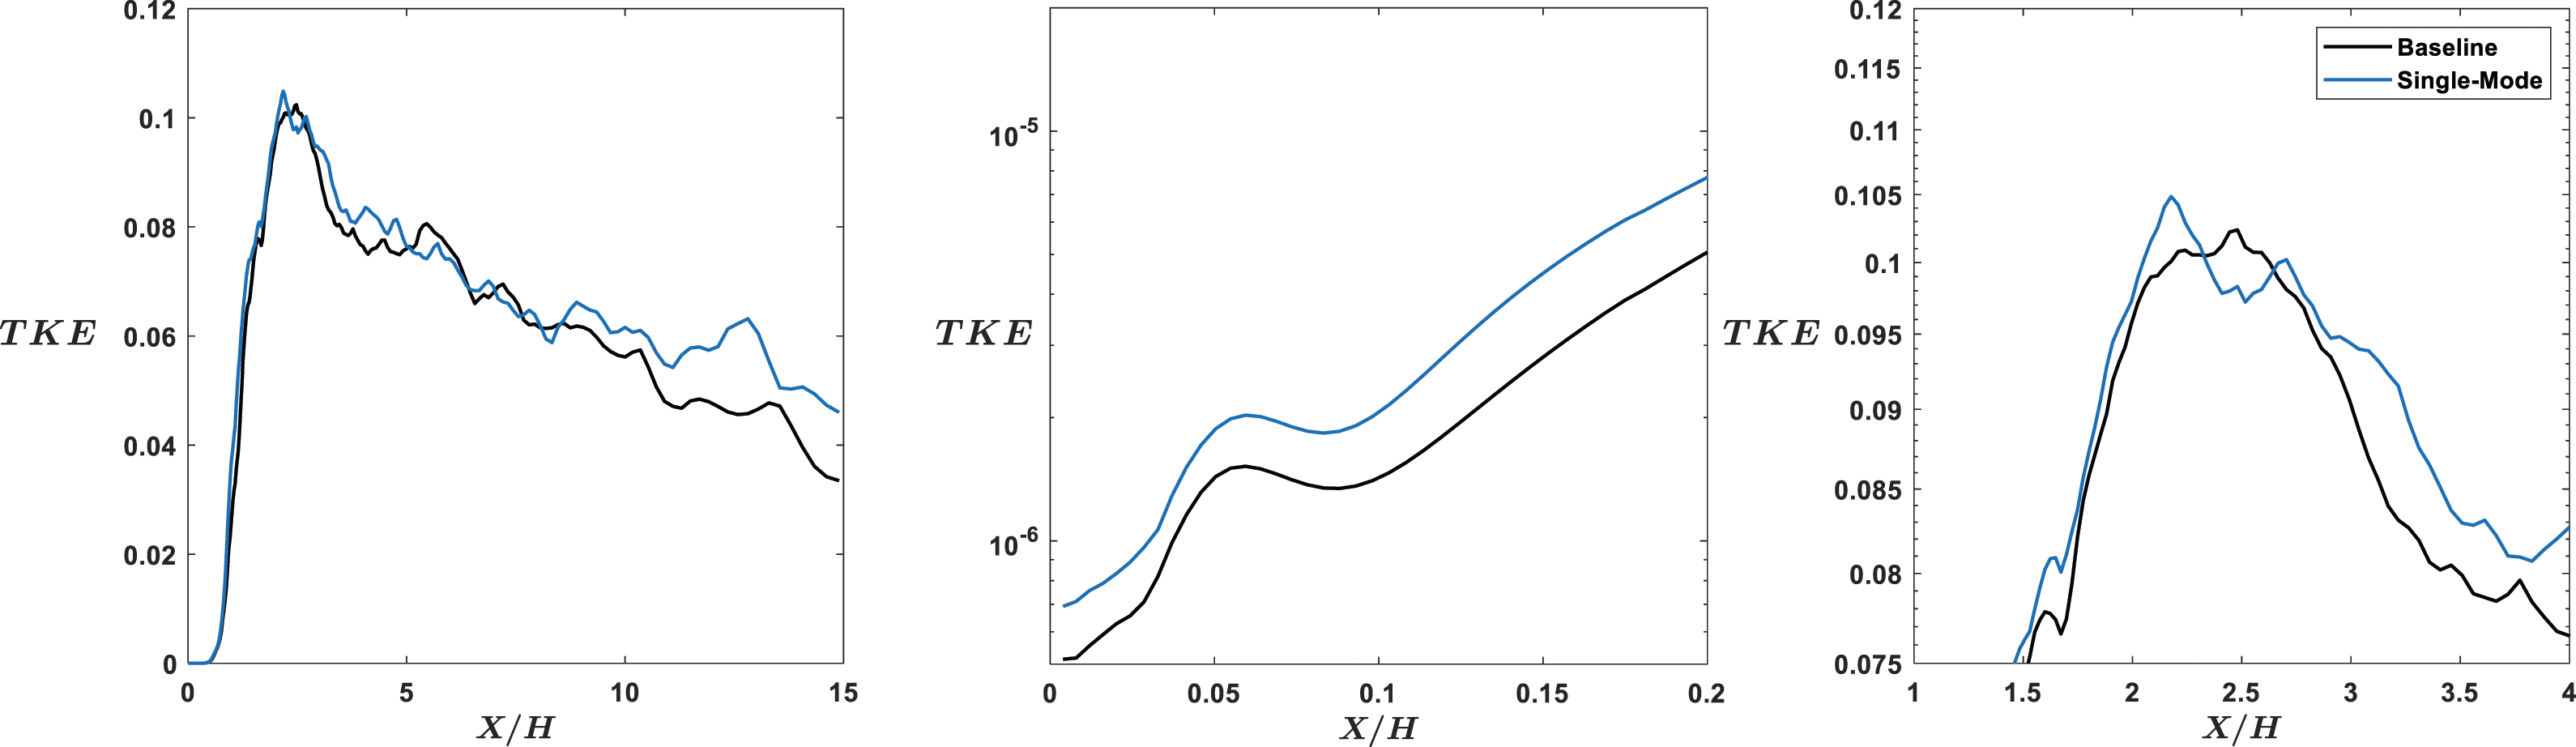
By investigating the TKE evolution in the shear layer, along with SPOD breakdown of fluctuations, the mechanism involved in the excitation can be explained as energy transfer between the fundamental (St = 0.15) and harmonic (St = 0.30) modes. The input energy introduced near the nozzle energizes the fluctuations up to X/H = 5, which show themselves as coherent structures shown in Figure 20. However, such structures have the potential to absorb energy in the region 5 < X/H<8. The energy is absorbed from the dominant frequency as shown in Figure 21. Which leads to reduction of fluctuations for St 0.15 frequency located around X/H = 10, which has been previously show as the dominant source of noise specifically in the maximum radiation angle shown in Figure 8. Hence, from the energy conservation prospect, the introduced energy due to excitation by energy transfer mechanism between the fundamental (St = 0.15) and harmonic (St = 0.3) modes. Energy conservation is satisfied when accounting for energy input via the excitation introducing additional energy into the system. Which leads to redistribution dynamics, where interactions through nonlinear processes redistribute the input energy between modes. Any leftover energy at higher frequency dissipates into the environment in physical case, however, would be out of the cut-off frequency of interest in this work. Although this mechanism provides small differences in peak TKE when evaluated along with the SPOD modes but provides the basis for introduction of bi-modal excitations by providing more effective noise reduction.
Bi-modal excitation cases
The cases of bi-modal excitation are now considered. Here, the jet is excited with two frequencies, St’s 0.15 and 0.30, in accordance with equation (4). This is done to exert control over the phase lag between the two frequencies. Four cases are run with different phase lags,
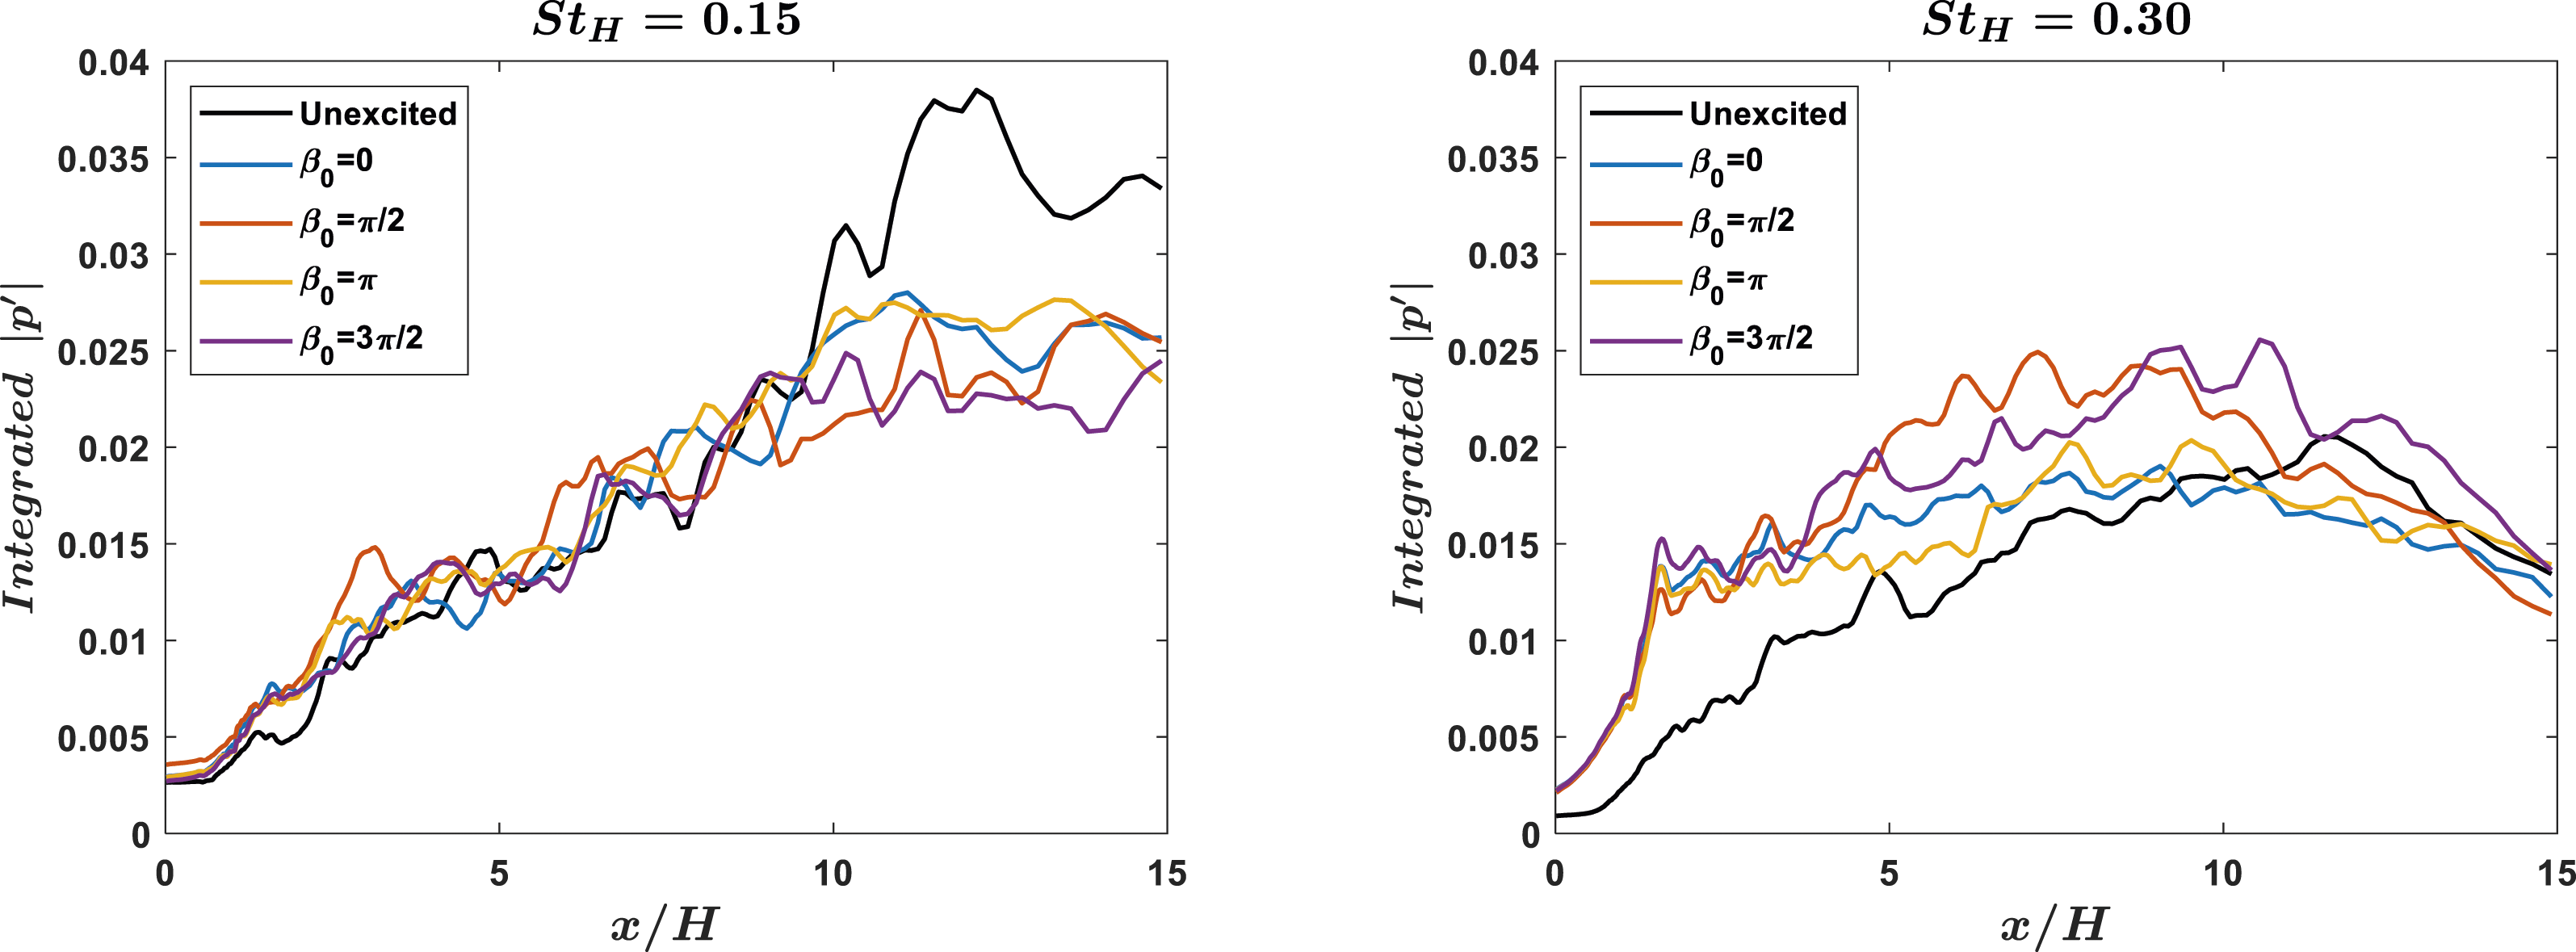
Figure 23 shows the near field pressure contours for the bi-modal cases. Qualitatively, each of the bi-modal cases appear to have reduced St 0.15. However, the extent of reduction is significantly different depending on the initial phase lag. St 0.30 shows a clear amplification for all excited cases, with a sharp initial peak occurring at Near field minor plane contours of Integrated pressure comparing baseline and bi-modal excited cases; St’s 0.15 (left) and 0.30 (right) are displayed.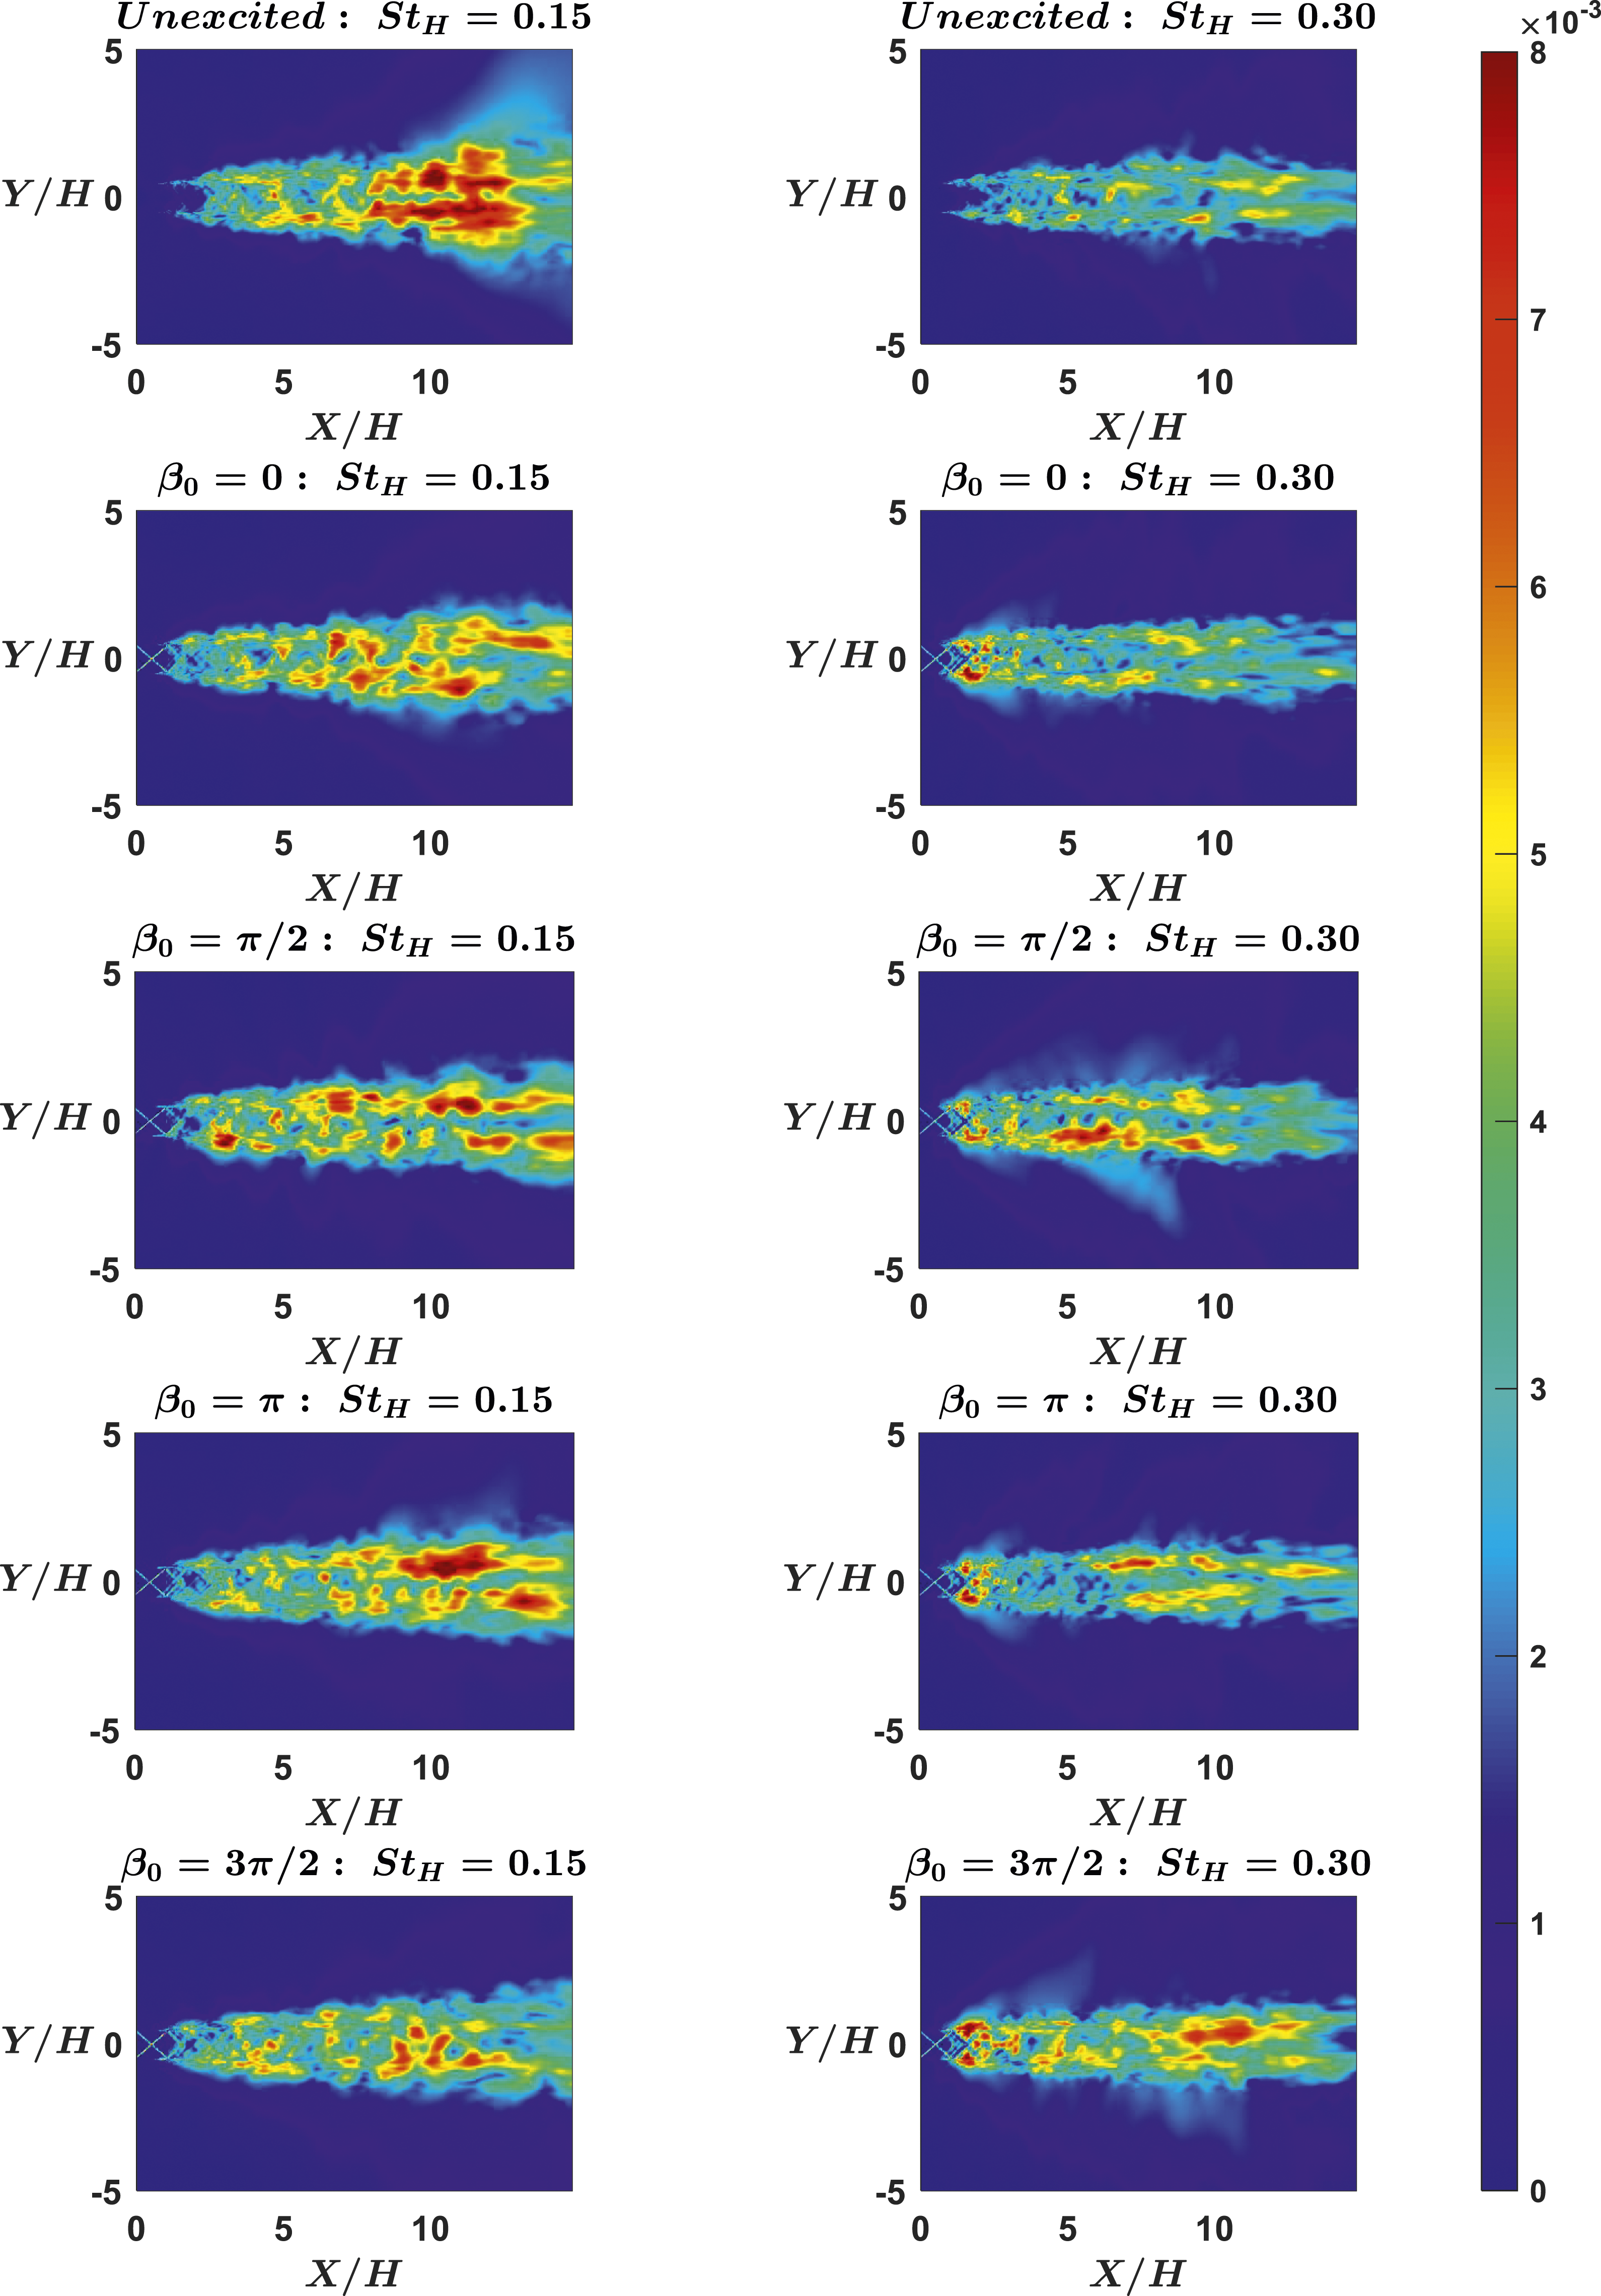
Eddy displacements and convection velocities are once again computed and shown in Figure 25. It is shown that the bi-modal excitation reduced the peak convection velocity for all cases. The greatest overall reduction comes from the Eddy displacement (left) and eddy convection velocity (right) comparing bi-modal excitation and baseline case.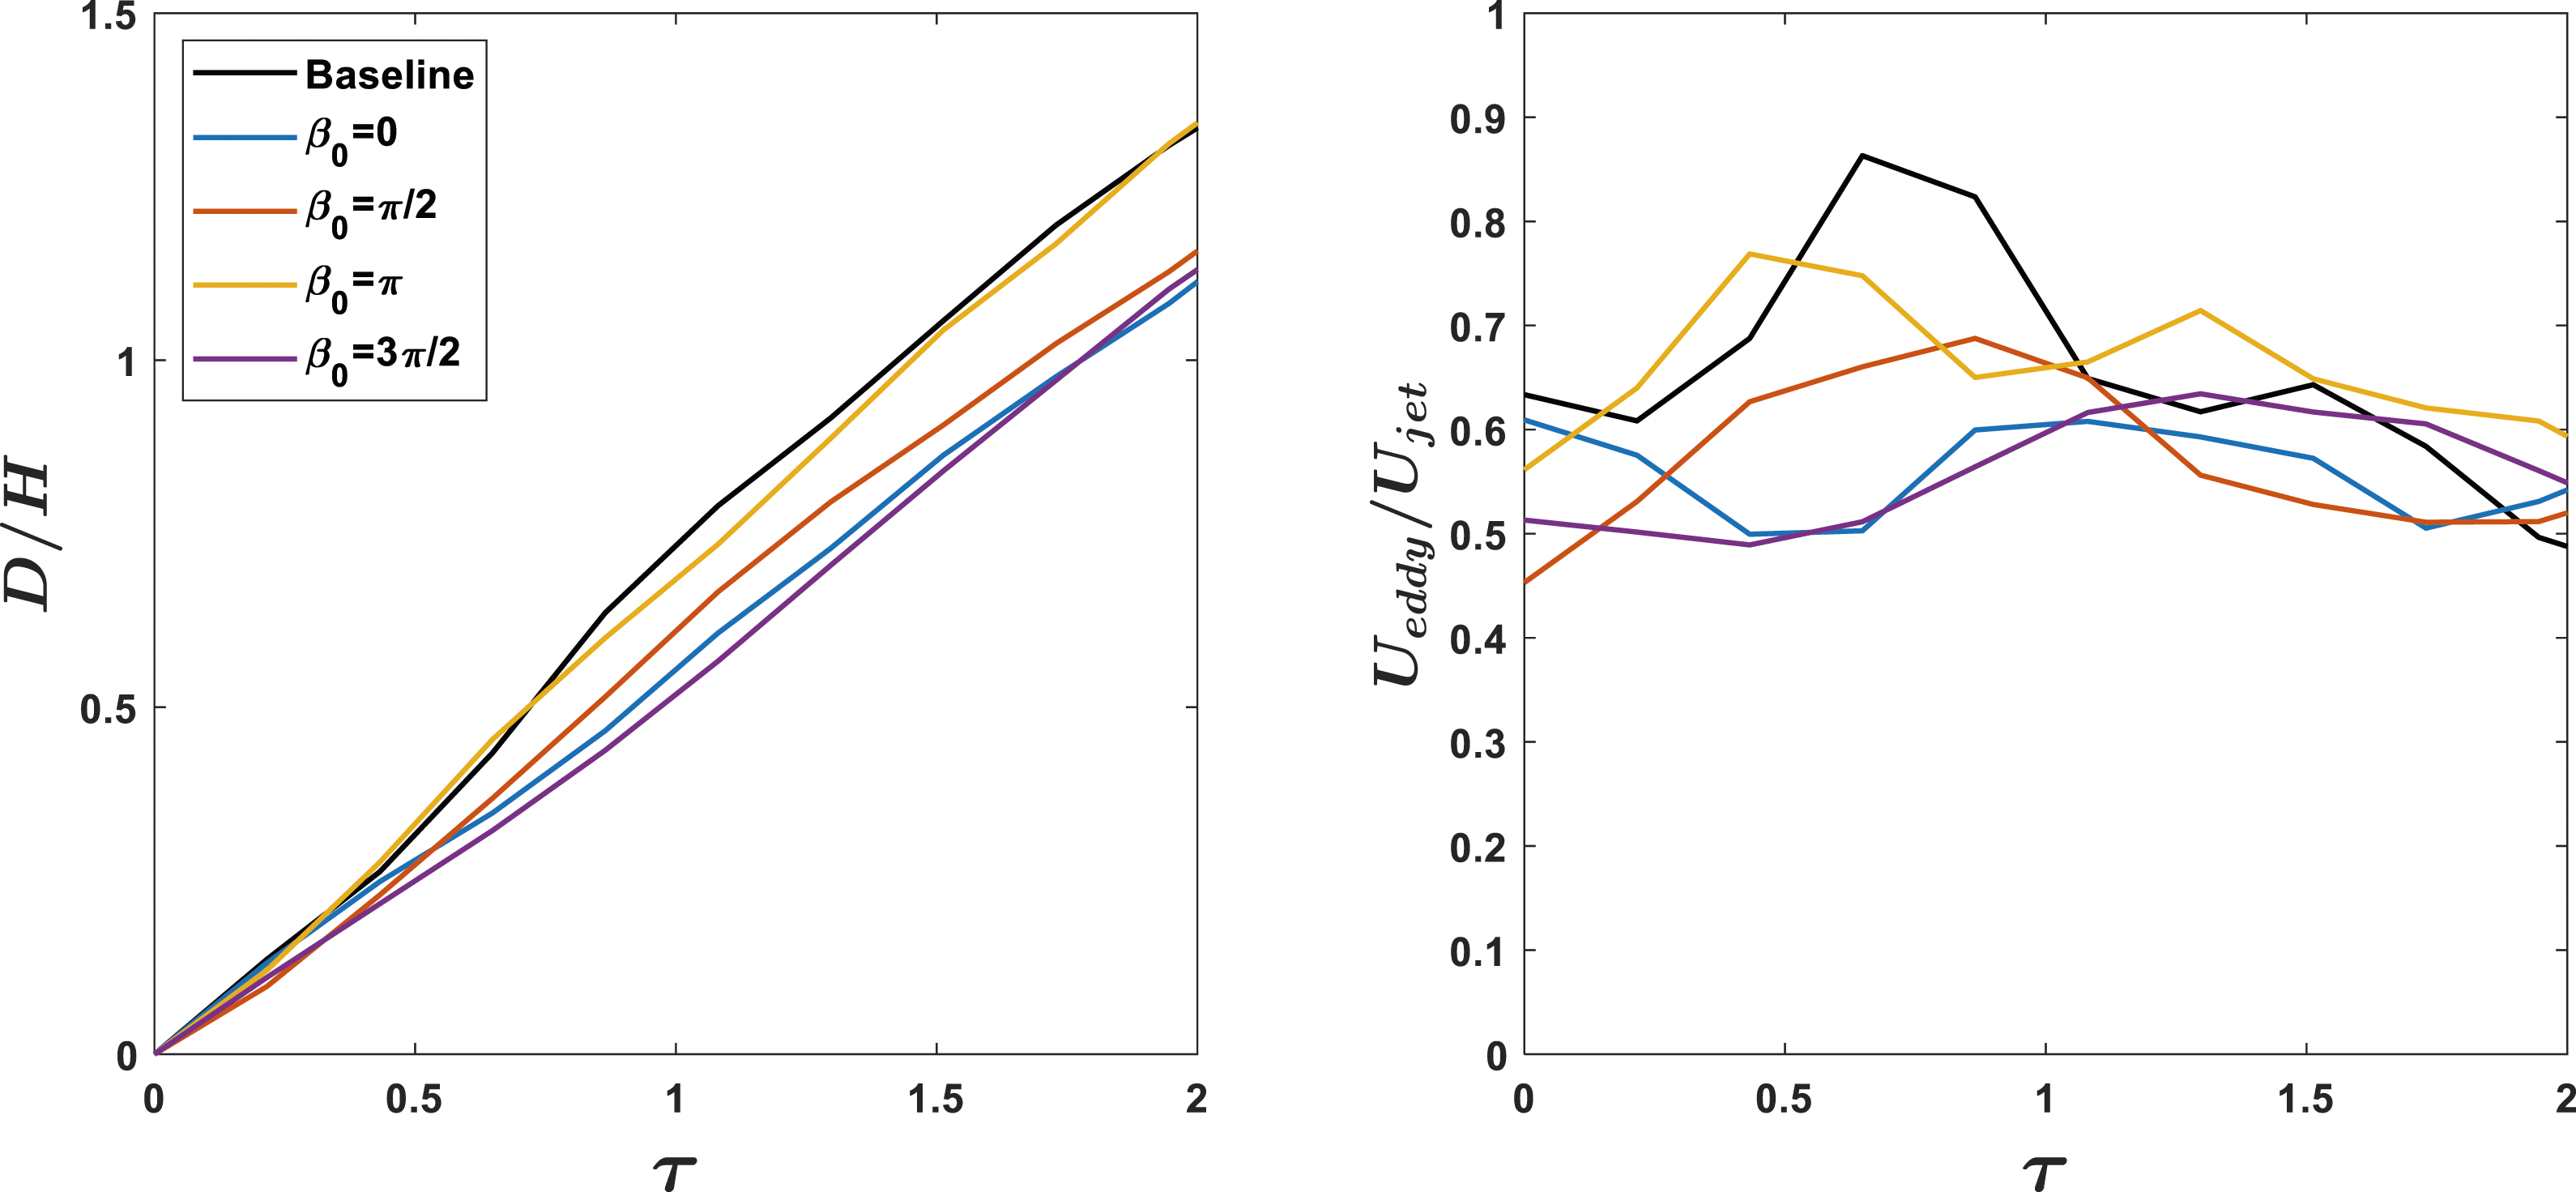
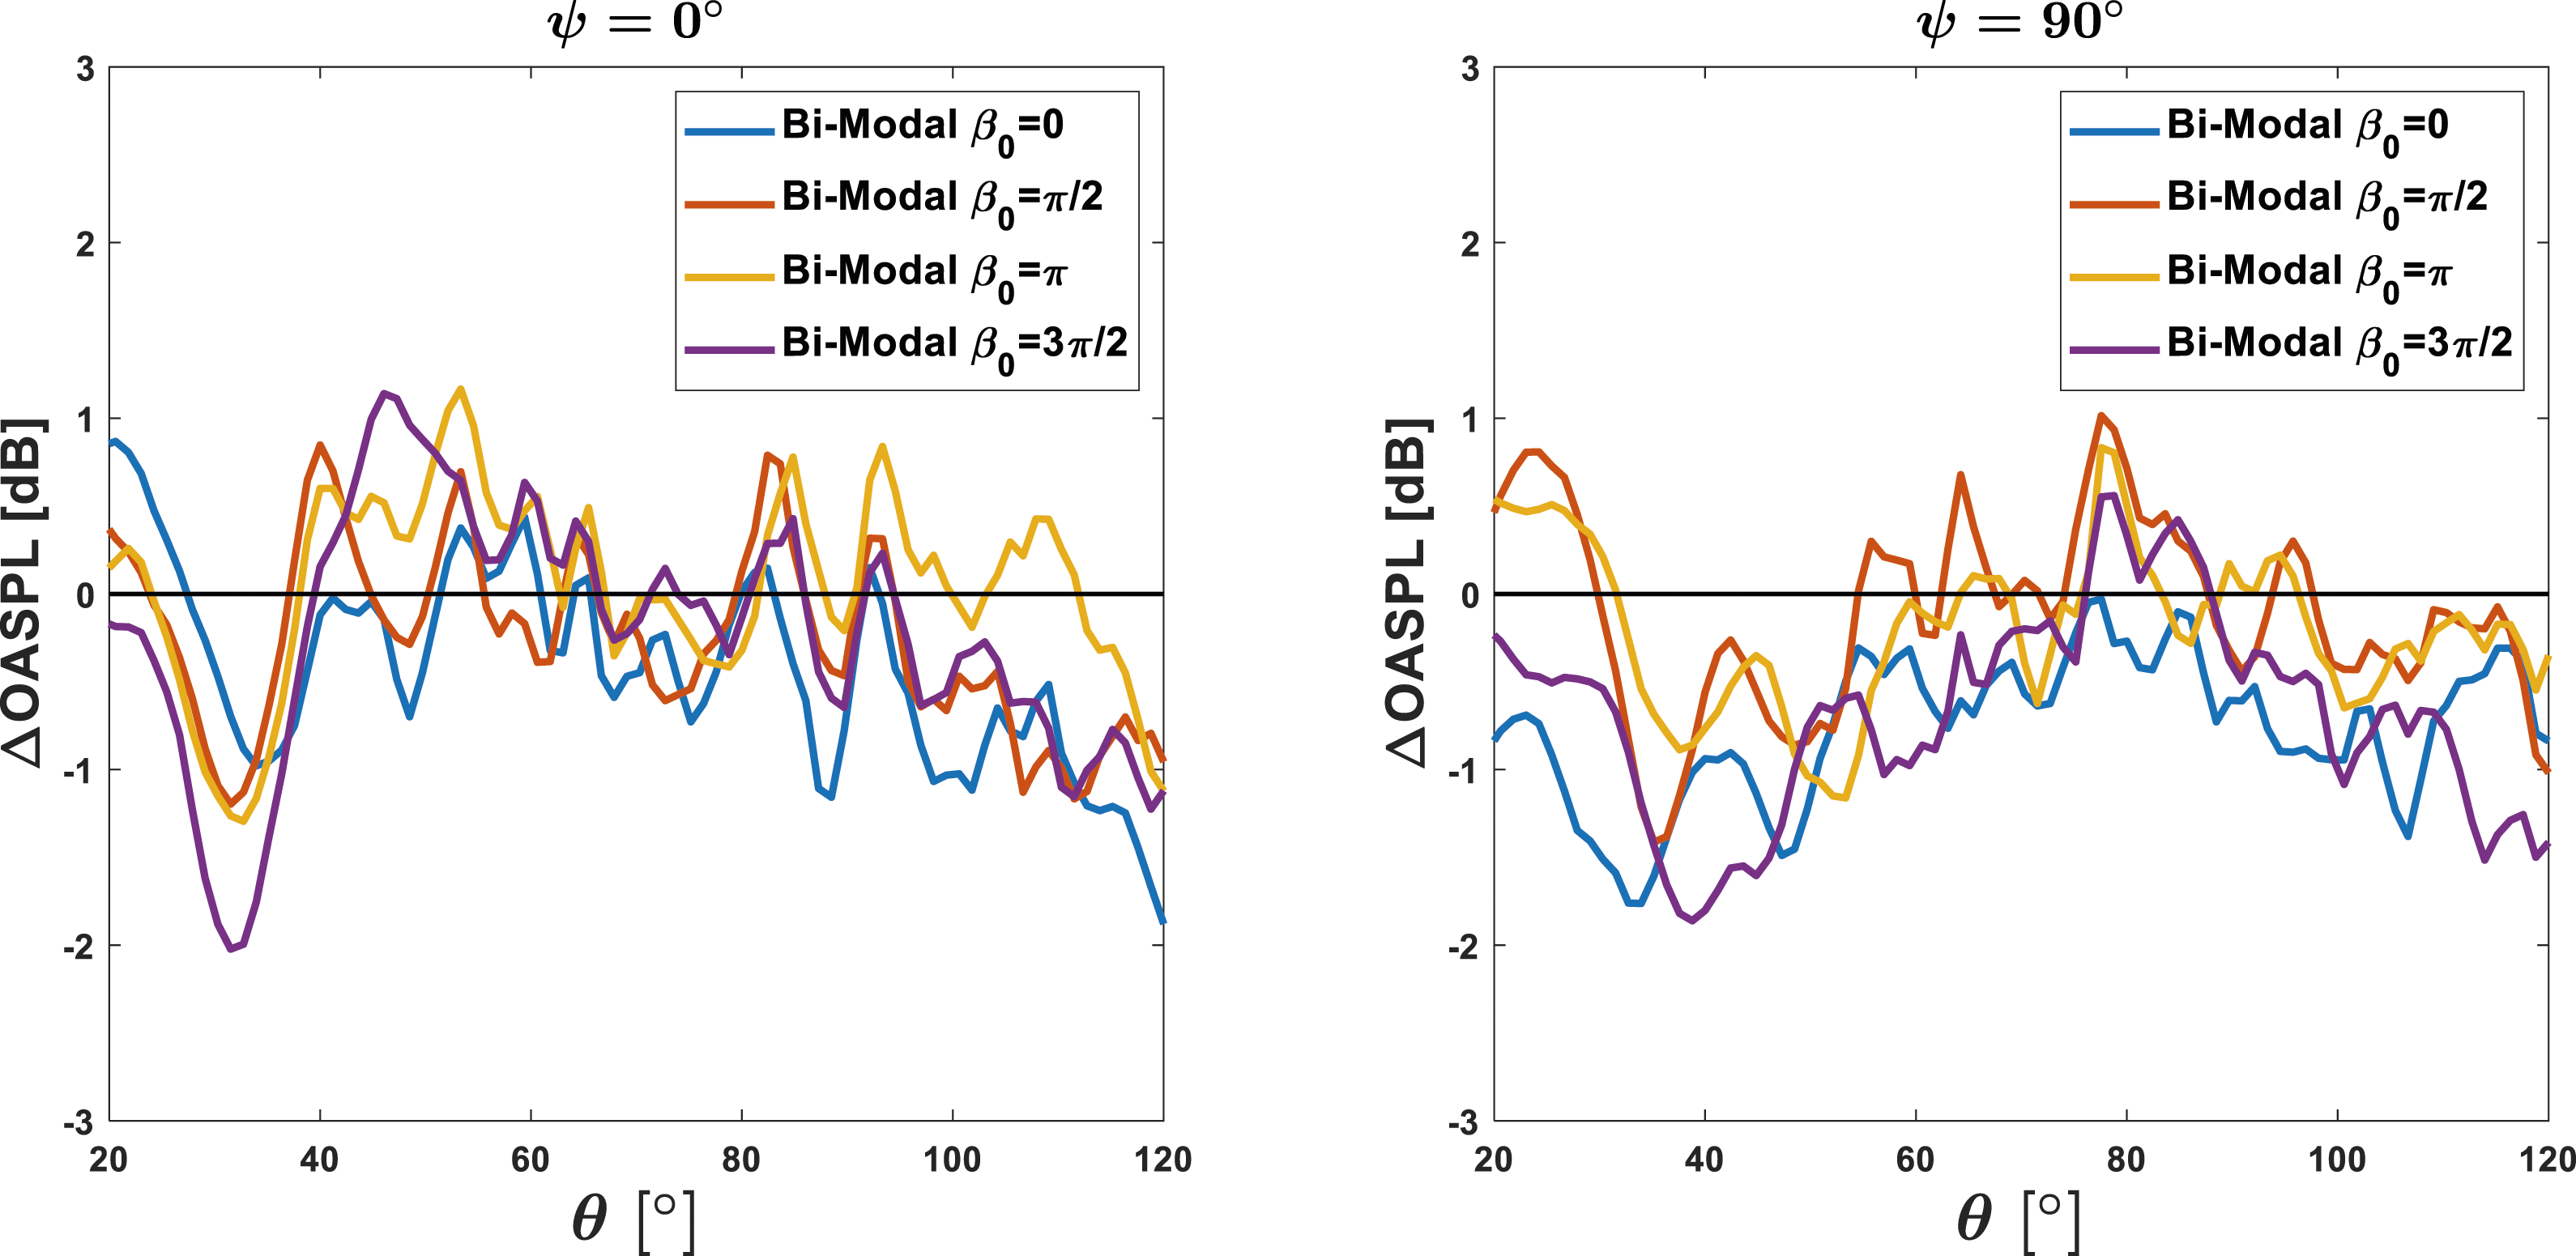
Figures showing Minor (left) and major (right) plane OASPL comparison for bi-modal excitation cases. Minor (left) and major (right) plane 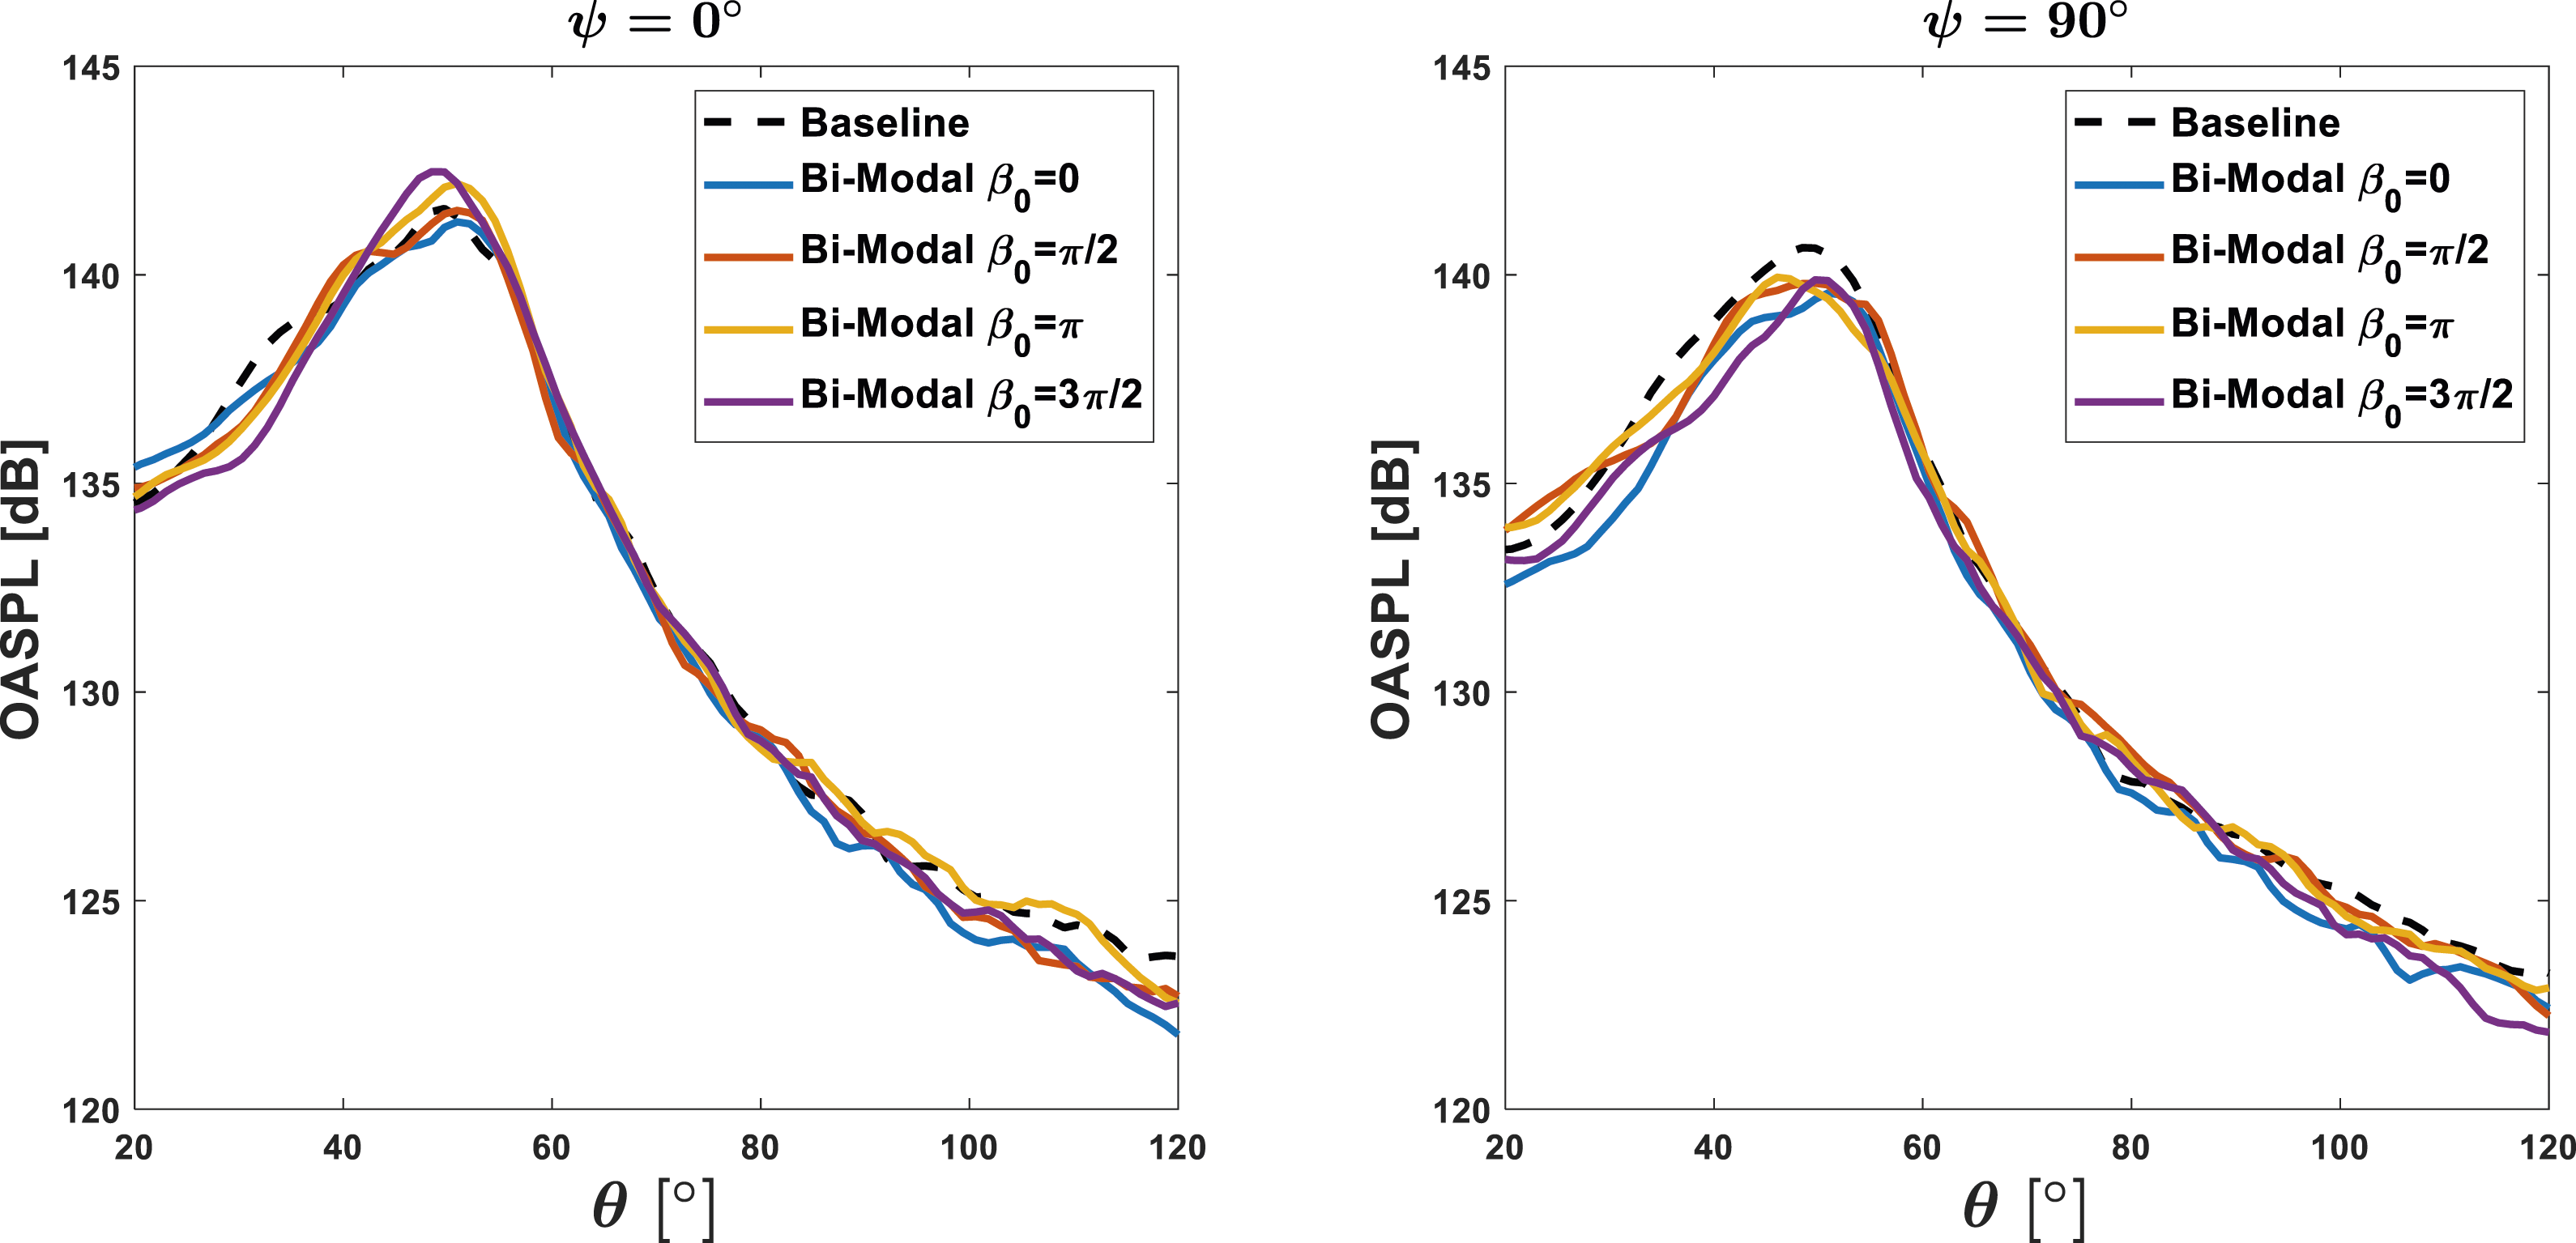
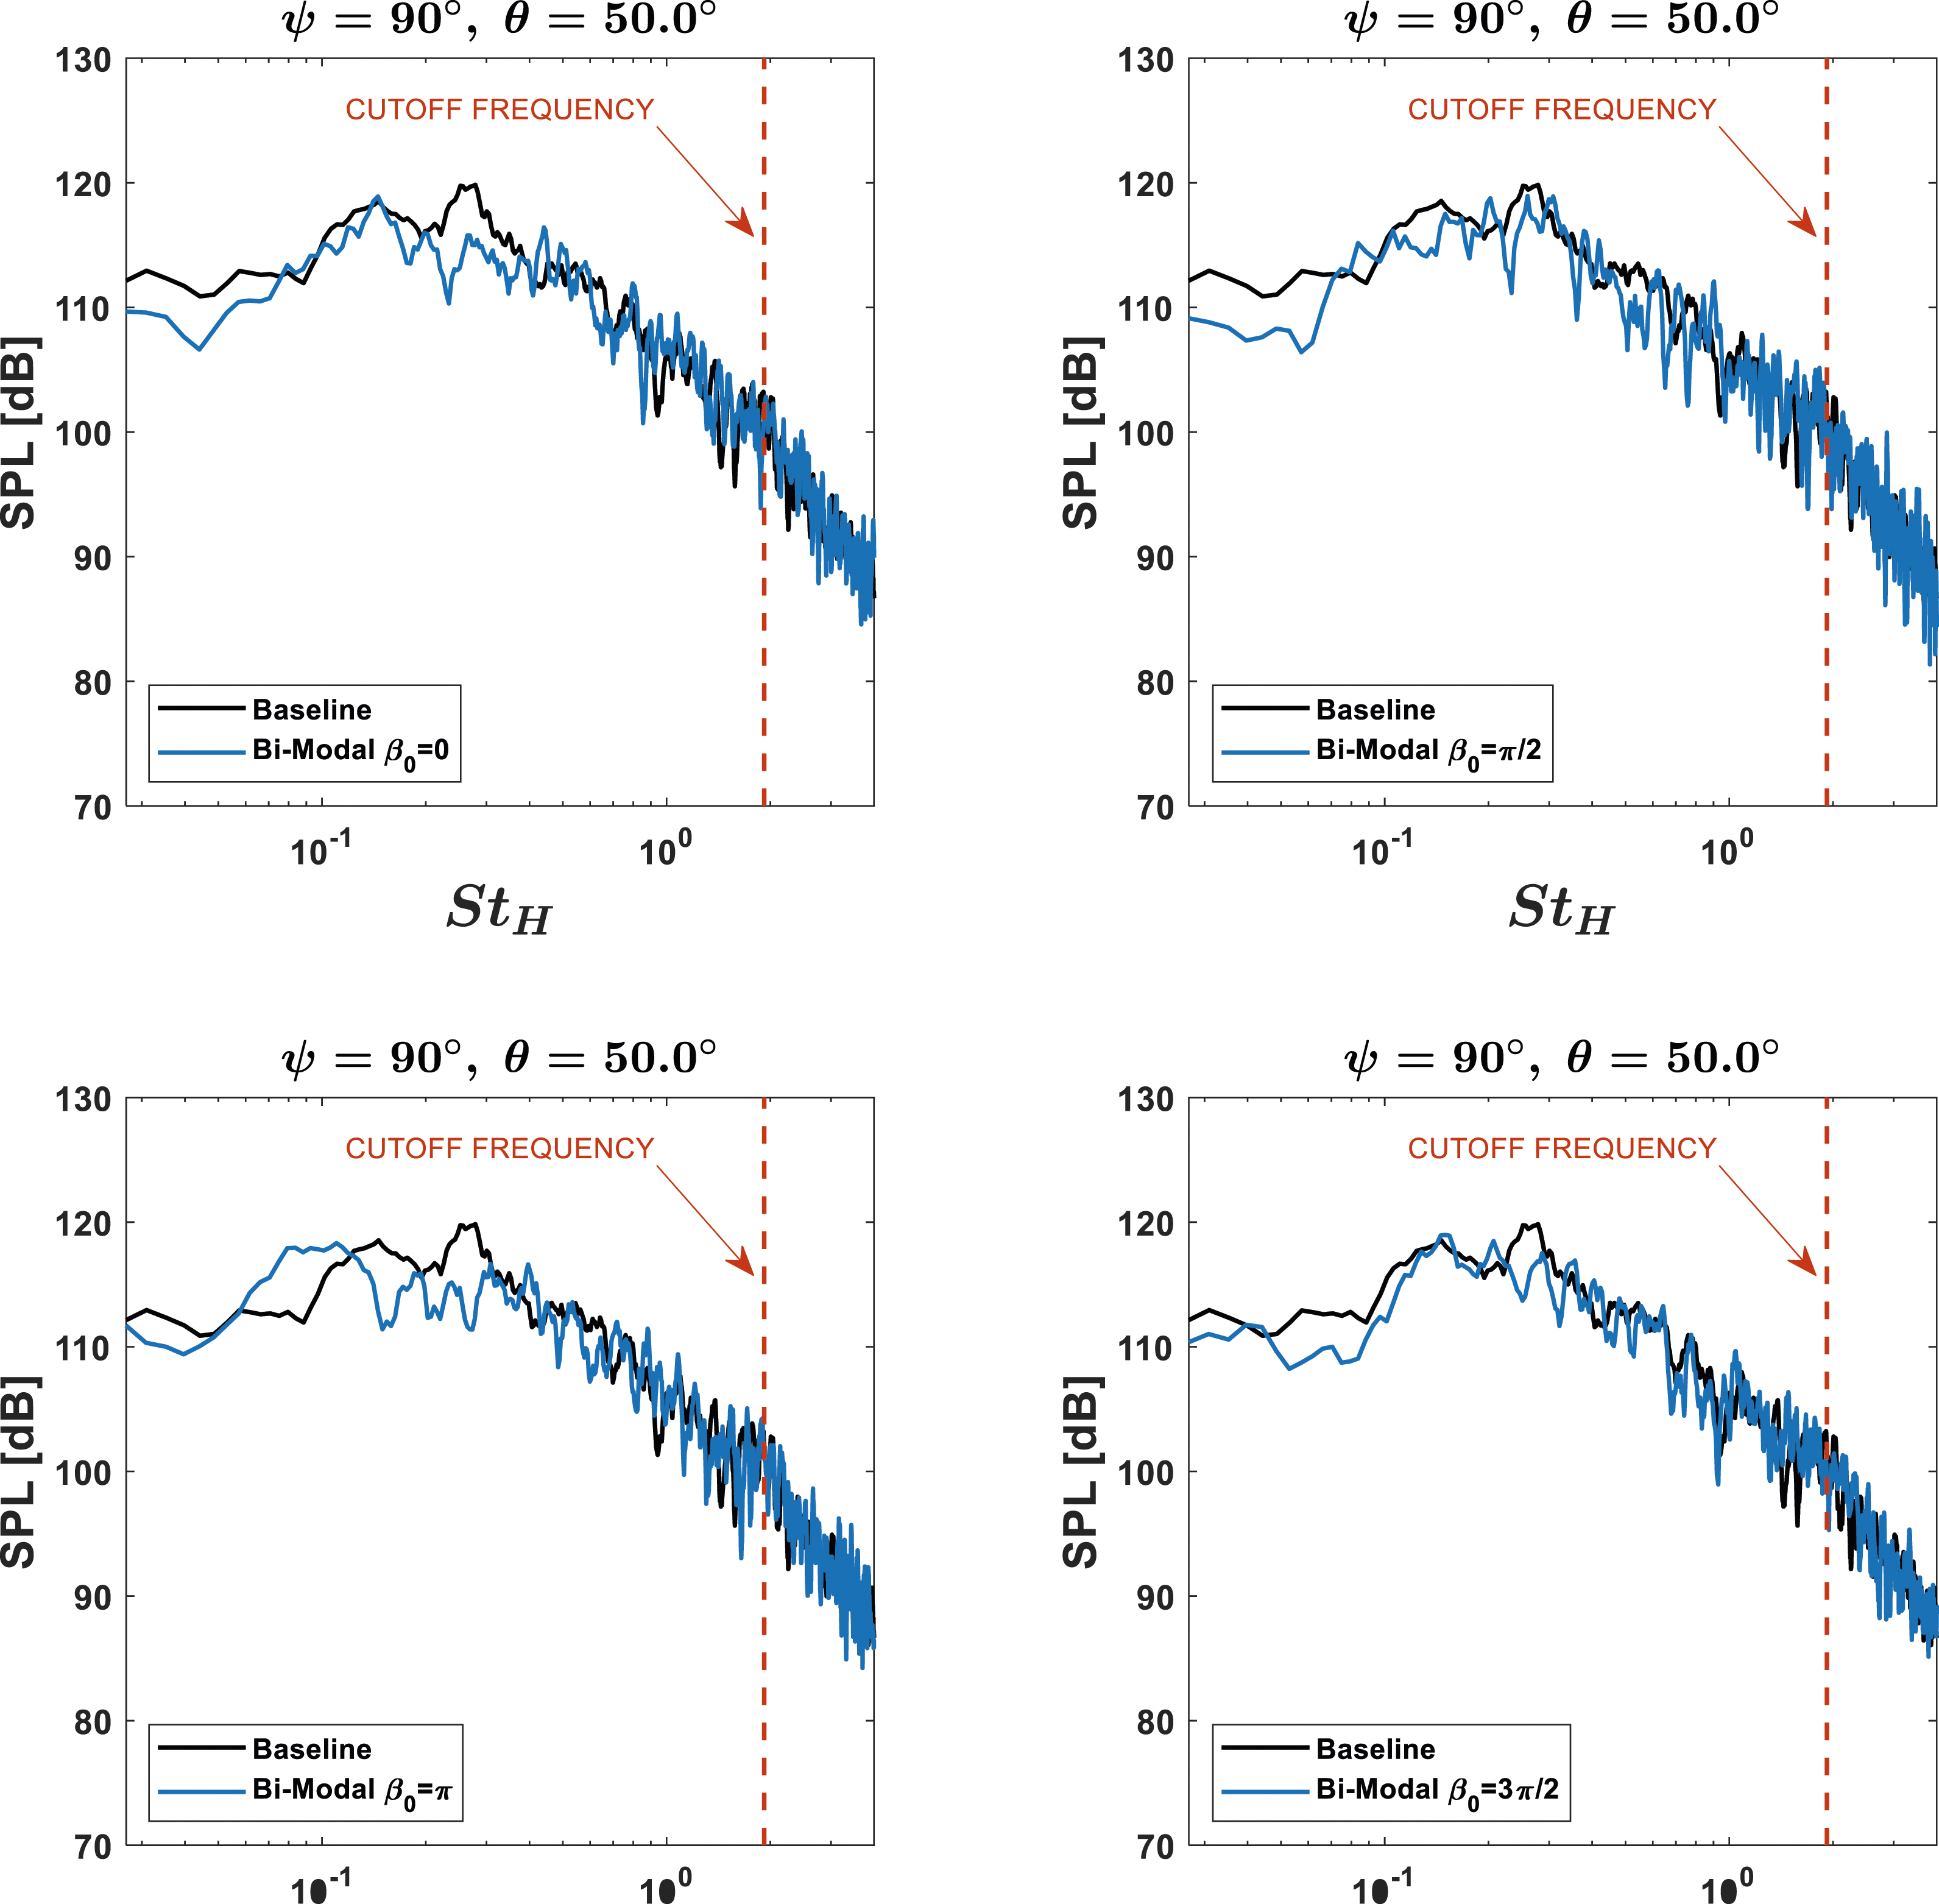
Figures 28 and 29 show the peak emission far field spectra in the minor and major planes, respectively. In the minor plane, each case still sees an amplification around St 0.15, which is likely a result of the actuation. However, there are stark contrasts between the cases around St 0.30. Particularly for the case of Far field spectra at peak emissivity angle in minor plane comparing bi-modal excited cases to baseline case. Far field spectra at peak emissivity angle in major plane comparing bi-modal excited cases to baseline case.
It was noted earlier that St 0.15 is dominant at lower emission angles, where Figures 26 and 27 show reduction for all bi-modal cases in both planes. Looking at the spectra for Far field spectra at Far field spectra at 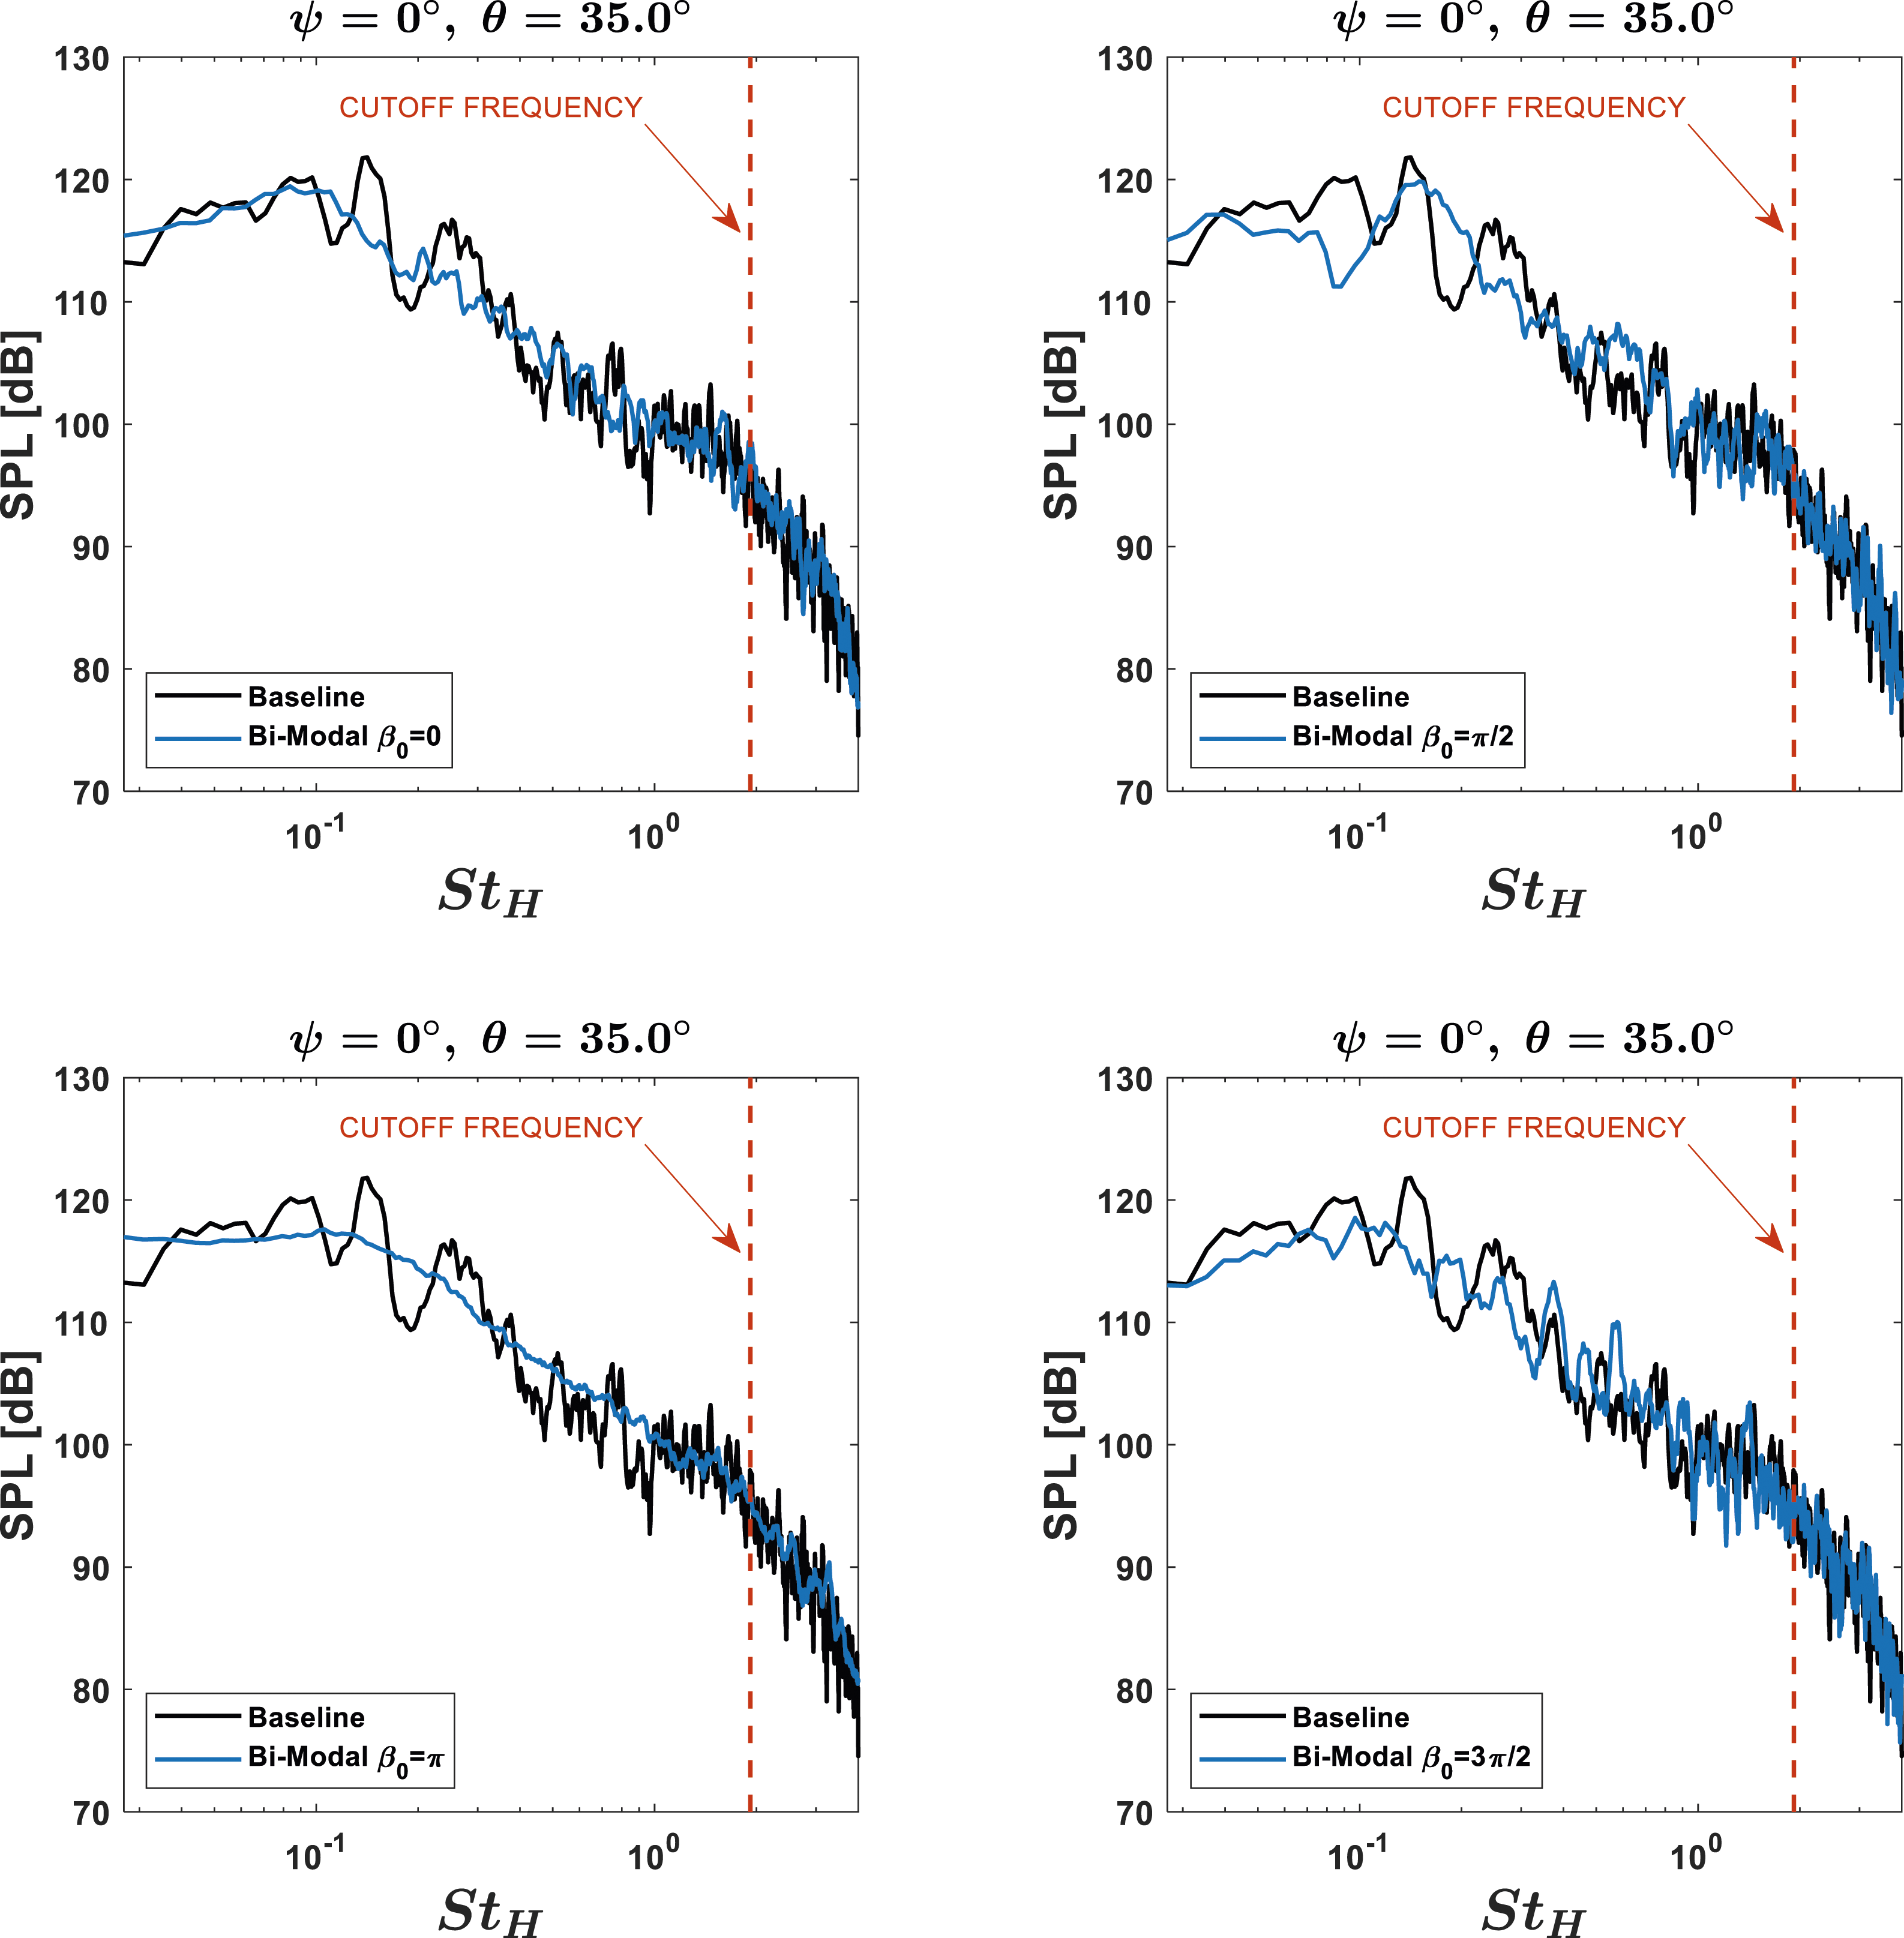
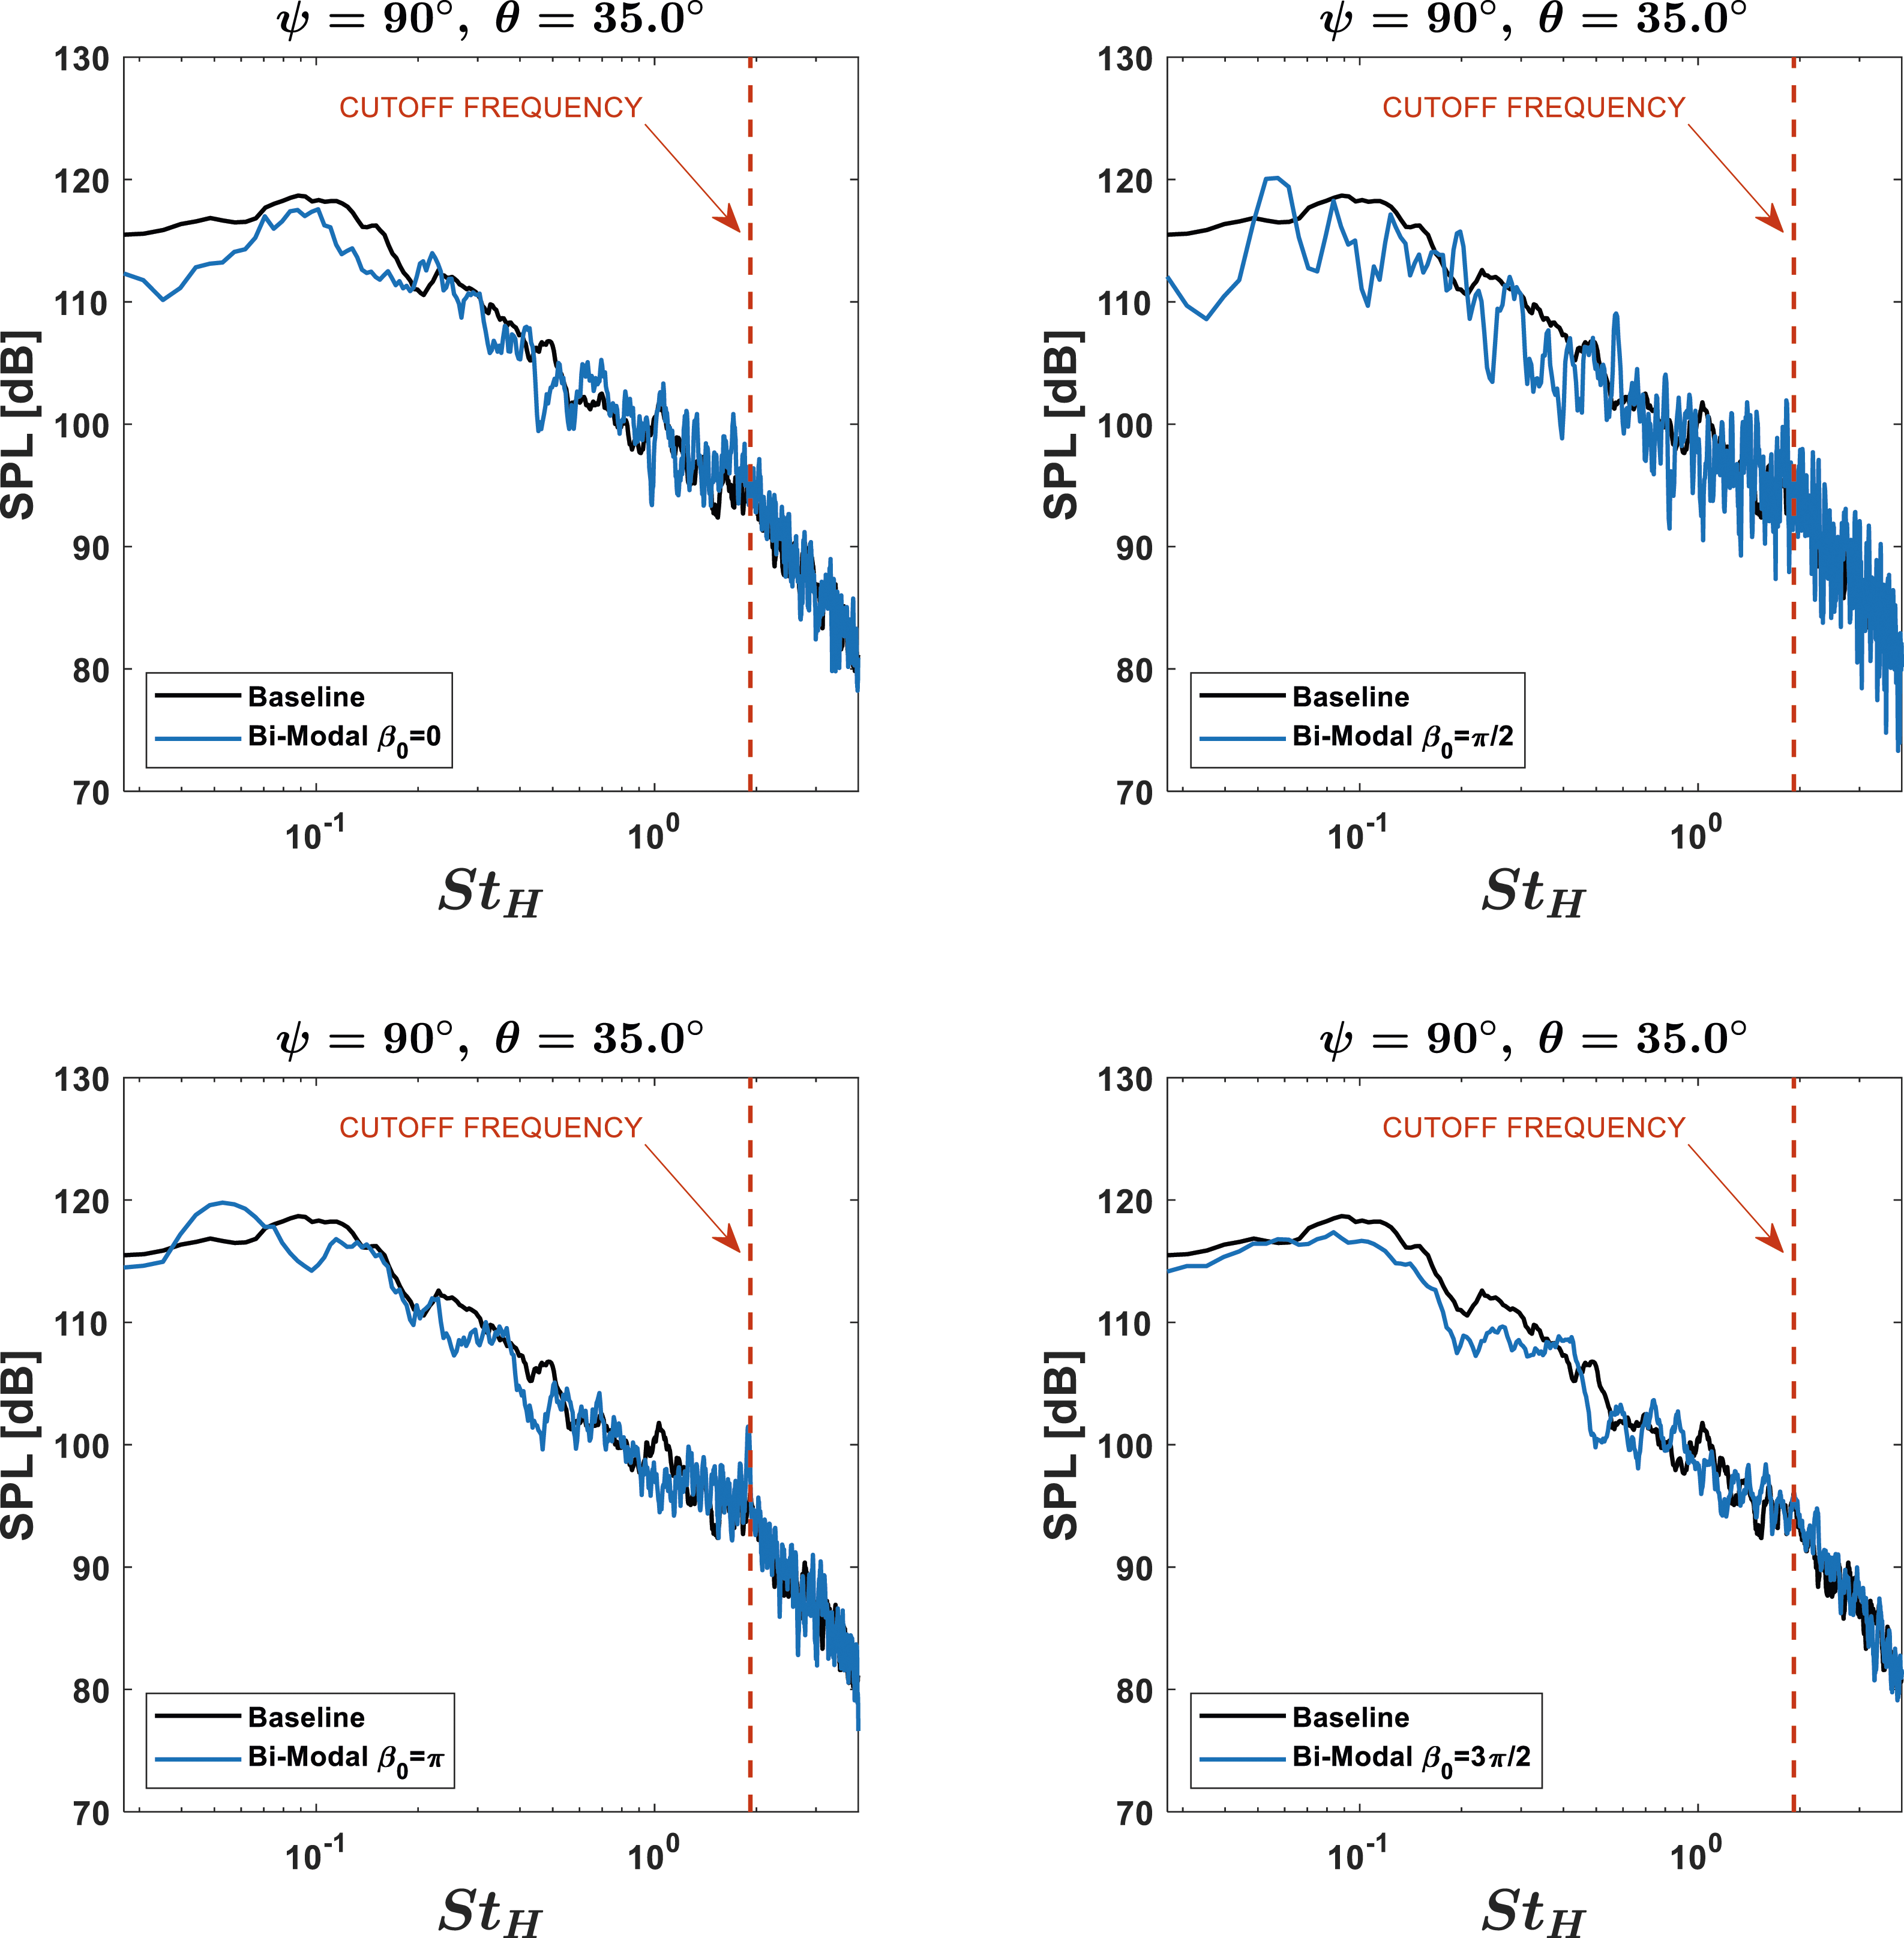
Figure 32 shows the SPL at St 0.15 in the minor and major planes. Again, there is a noticeable peak-to-peak noise reduction in the minor plane up to 8.5 dB for Comparison of SPL at St 0.15 for bi-modal excited cases.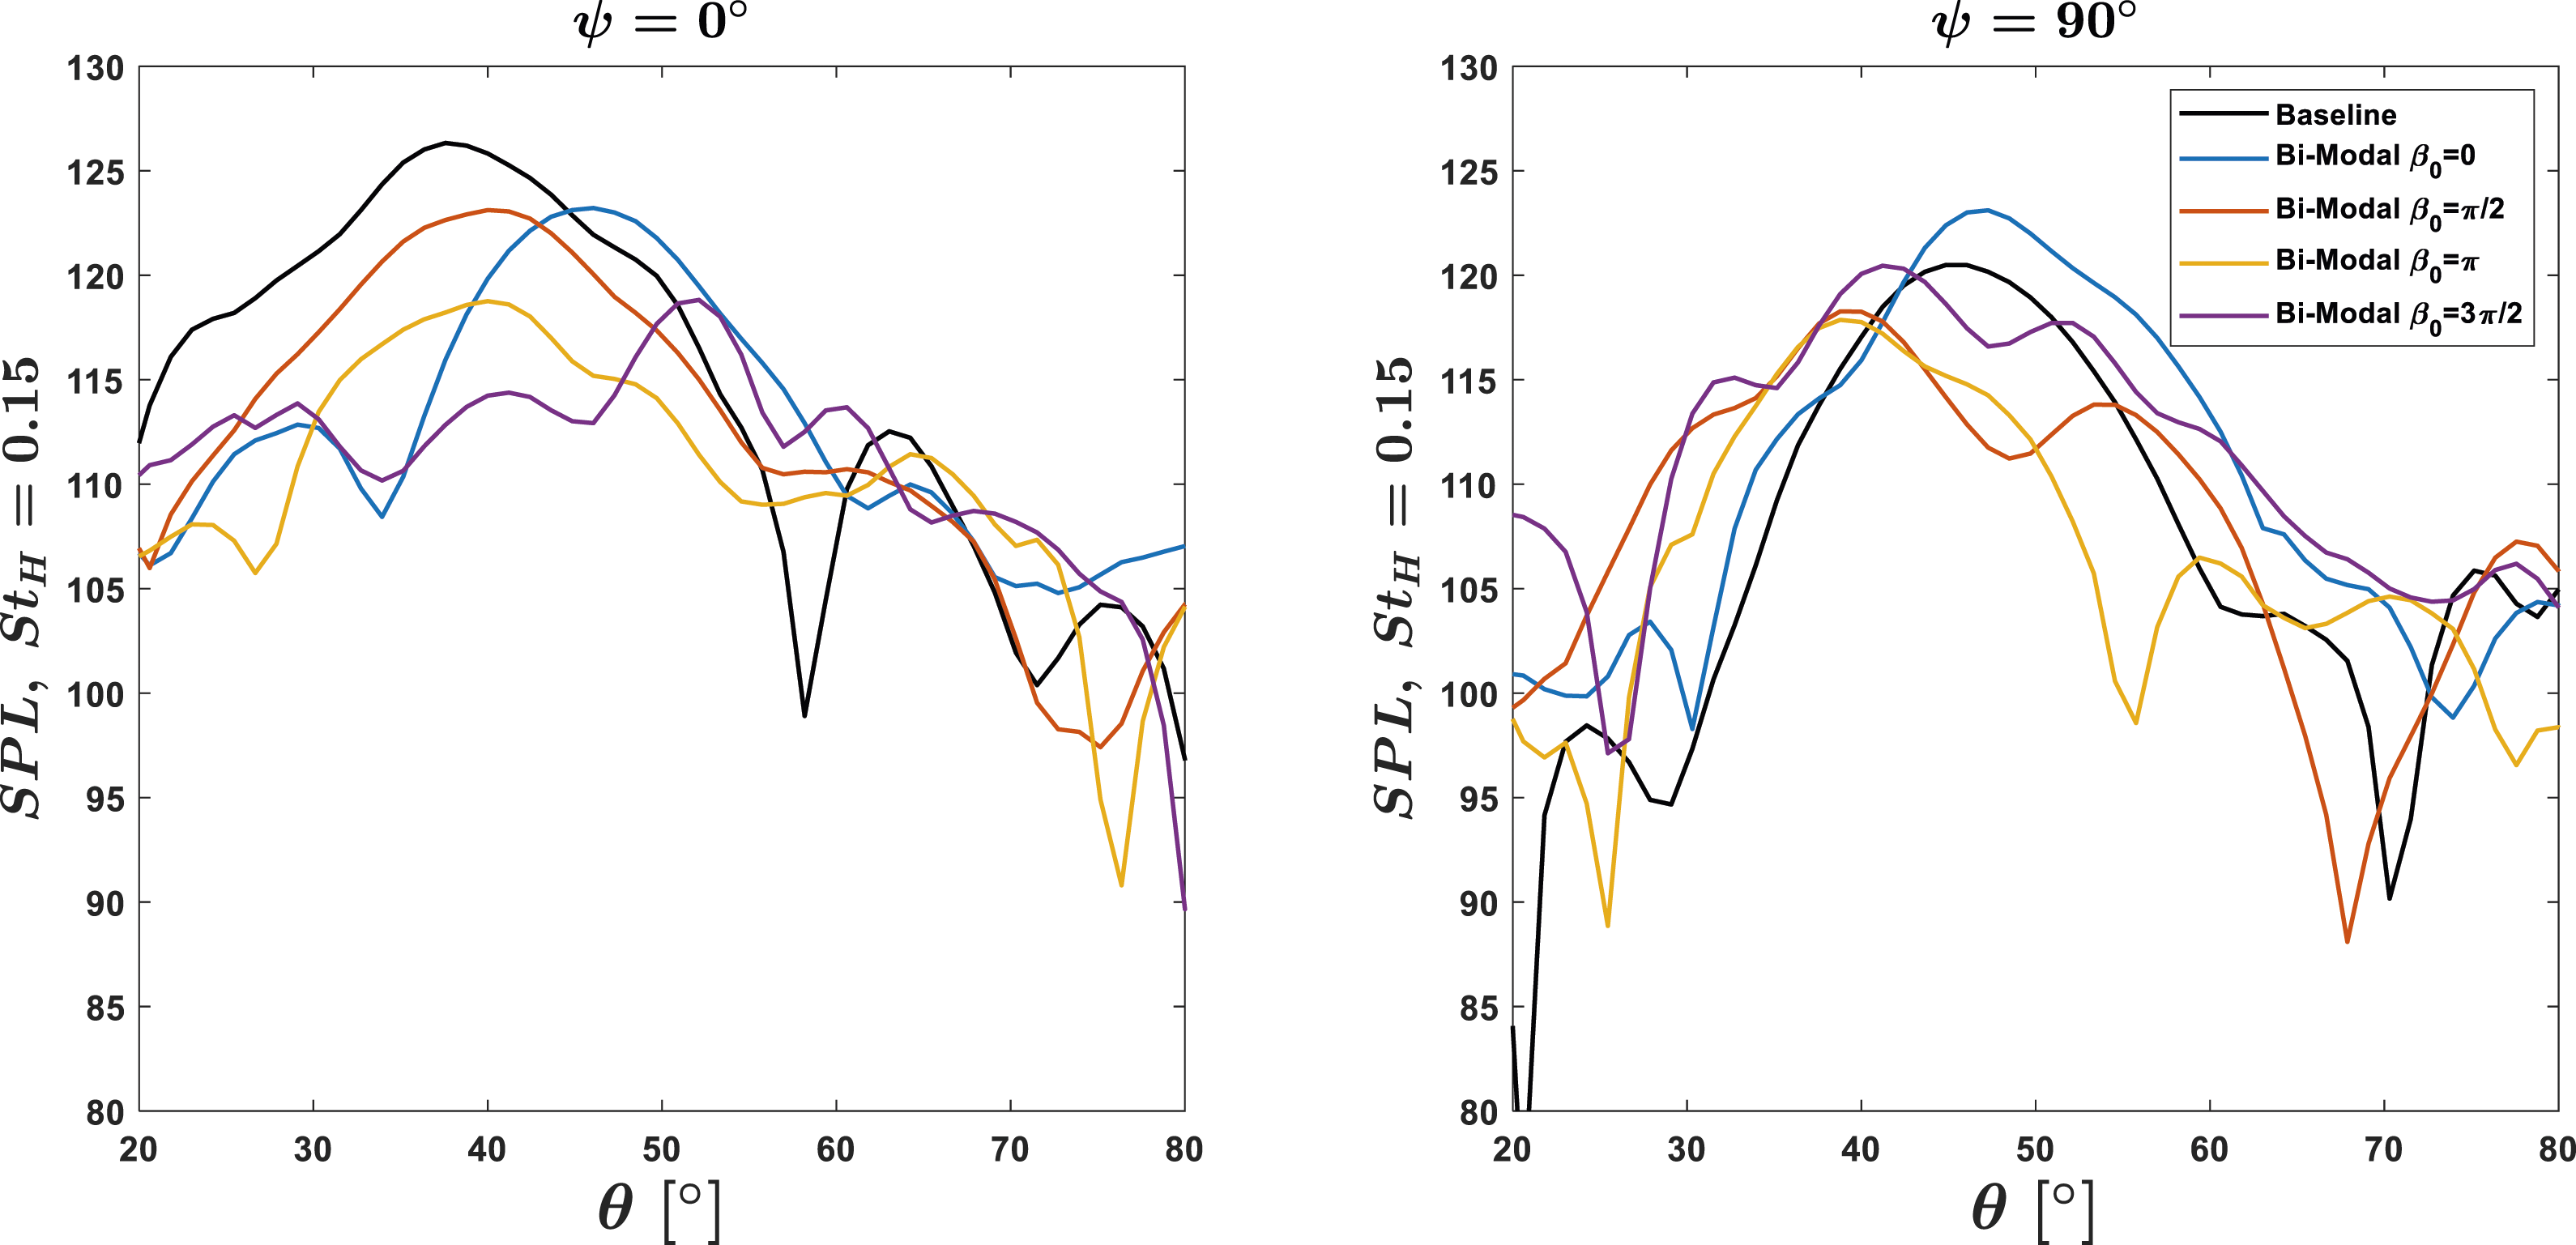
The results for the bi-modal cases are a mix of the expected and unexpected. It has long been observed that the phase lag affects the interaction between noise sources.19,20 It was predicted by the ROM of Malczewski and Mankbadi
44
that some phase lags would decrease the noise, while others would amplify it. This is best shown when analyzing the SPL at St 0.15 in the minor plane where the excitation is imposed. The trends between the ROM and LES agree and they only differ in the specific phase lags that reduced the noise. Minor plane peak-to-peak noise was not considerably reduced by any of the bi-modal cases; however, some reduction is observed at the lower directivity angles where St 0.15 is dominant. The greatest reduction in this region came from
SPOD analysis is once again performed. Mode energy spectra are shown in Figure 33. SPOD spectrum comparing baseline and bi-modal cases showing first and second mode; mode number increases moving downward.
Like with the single-mode case, there are considerable differences in the gaps between the first and second modes. For all bi-modal cases, there is a reduction in the mode gap around St 0.15 indicating a redistribution of mode energy to the second mode. A general comment on the shape of the spectra here is that for all excited cases, there is a flattening of the peak in mode one around St 0.15. Qualitatively, the greatest flattening occurs for the
Contours of the first and second mode are shown in Figures 34 and 35, respectively. With the forcing amplitude being increased for the bi-modal cases, the effects are more pronounced than for the single-mode cases. The actuation at St 0.30 shows in the first mode for all bi-modal cases with the distinct symmetric structures. The streamwise amplification of 0.30 changes with the initial phase lag. The phase lag of First mode SPOD contours comparing baseline and bi-modal excited cases; shown are St’s 0.15 and 0.30. Second mode SPOD contours comparing baseline and bi-modal excited cases; shown are St’s 0.15 and 0.30.

Shear layer TKE for the bi-modal cases are finally shown in Figure 36. Again, the initial difference in energy at X/H = 0 is very clear. This difference is also greater than that of the single-mode case, which is expected since the forcing amplitude is higher here. For all excited cases, the shear layer TKE reaches a similar peak to that of the baseline case, which is not surprising. Interestingly, it is observed that two of the bi-modal cases achieve peaks higher than baseline, and two are lower. This has a correlation to the integrated pressure displayed in Figure 24, specifically at the fundamental frequency, St 0.15. The two phase lags of Shear layer turbulent kinetic energy between baseline and bi-modal cases; shown are magnitudes for the full shear layer (left), initial shear layer (middle), and at the peak (right).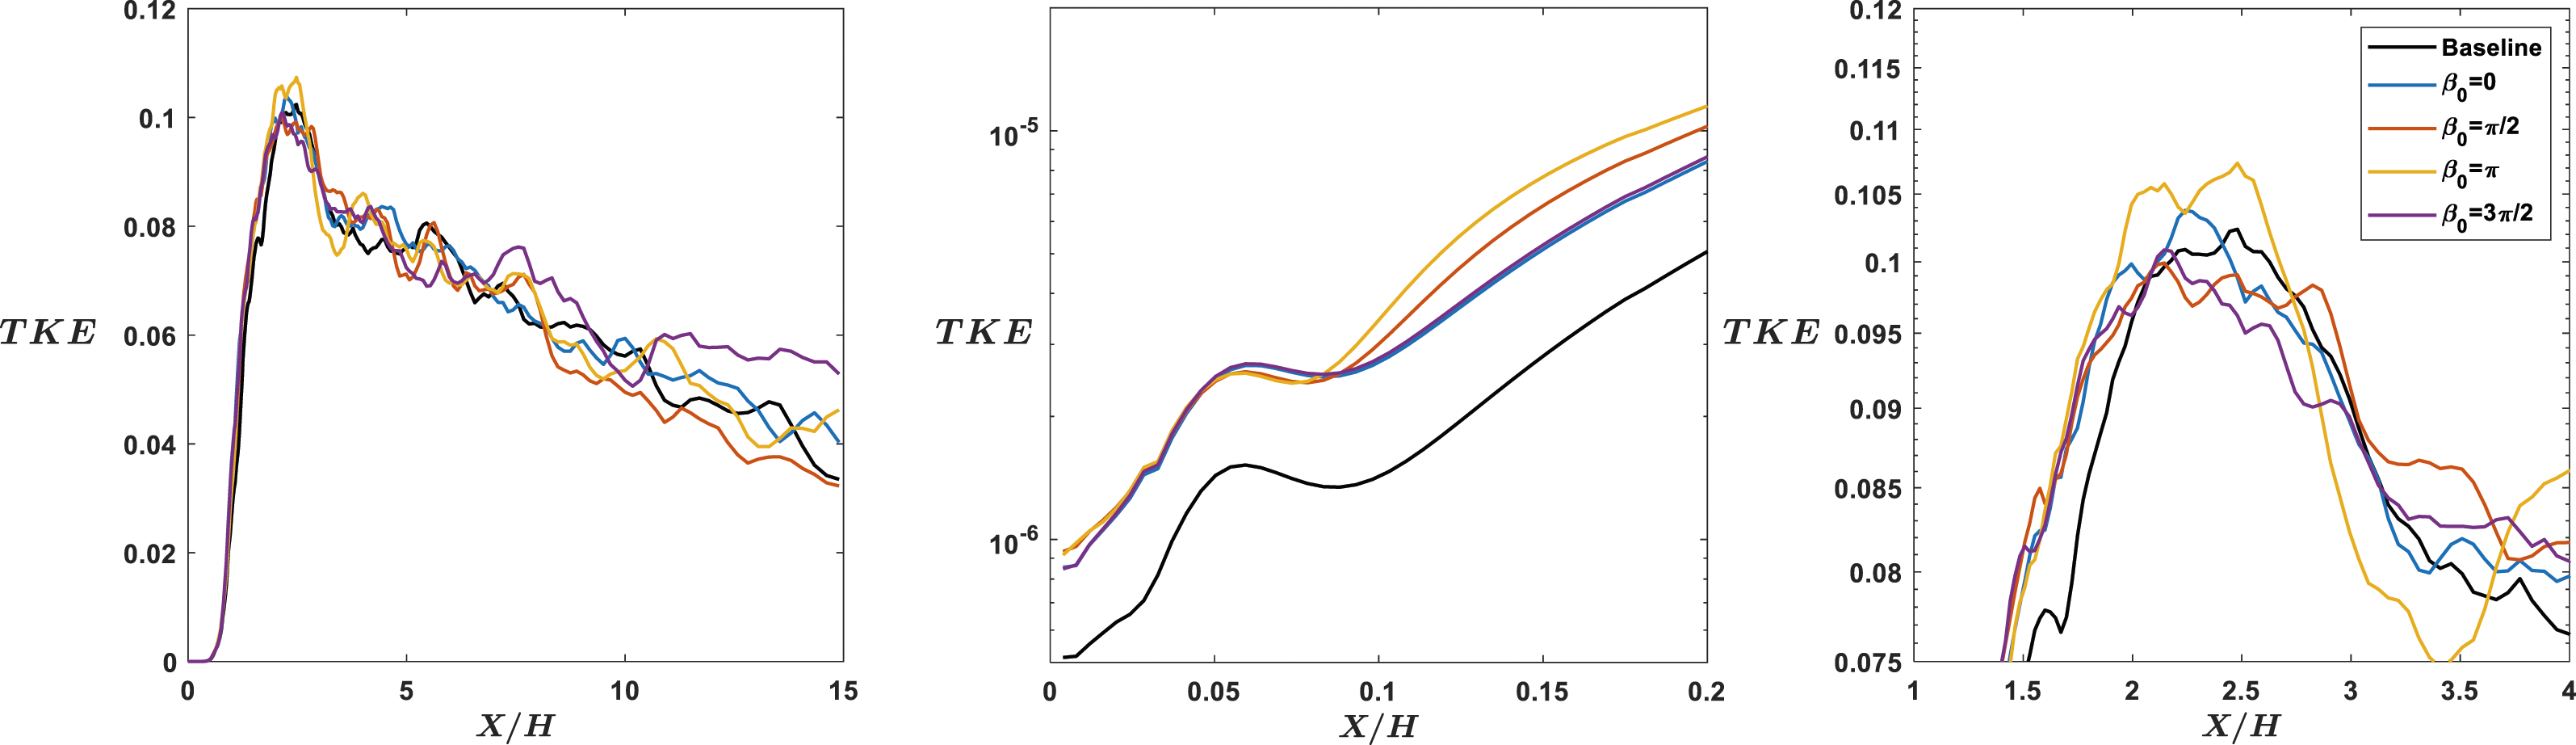
The bi-modal cases suggest that energy is conserved in the proposed theory, albeit tracking how that energy is distributed is difficult. Two frequencies are considered, St’s 0.15 and 0.30. The energy added by the excitation is small, and only small differences are observed in the shear layer TKE. But these small differences are significant and correspond to previous observations made with near field pressure and the proposed theory of Malczewski and Mankbadi.
44
In the cases where the integrated pressure at St 0.15 was most reduced (i.e.,
As described previously in Single-mode excitation case, the excitation mechanism involves energy transfer between the fundamental (St = 0.15) and harmonic (St = 0.30) modes, as seen in the evolution of TKE and SPOD analysis of fluctuations. Input energy introduced near the nozzle initially energizes fluctuations forming coherent structures. These structures absorb energy in the 5 < X/H<8 region, reducing fluctuations at St = 0.15 downstream around X/H = 10, previously identified as the dominant noise source at the maximum radiation angle (Figure 8). This redistribution aligns with the observations from Figures 34 and 35. In the bi-modal cases, streamwise amplification at St = 0.30 changes with the phase lag (
Conclusions
This work began by considering the large eddy simulation of an unexcited rectangular jet as a basis for analysis of bi-modal excitation to reduce the dominant frequency noise. Near field analysis revealed St 0.15 as the most amplified. This St appeared in the far field noise as the dominant peak for low emission angles between
Both sets of excitation cases provide strong support for the theory of Malczewski and Mankbadi.
44
Near field analysis showed that the fundamental, St 0.15, could be reduced with the addition of the harmonic, 0.30. The underlying mechanism is that energy is transferred between the modes, which was shown by amplification of 0.30 as 0.15 was reduced. The initial phase lag between the two modes was shown to have an effect in the bi-modal cases, and greater reduction of St 0.15 could be achieved depending on the phase lag. In the bi-modal cases, it is shown that the more amplified St 0.30 gets, the greater 0.15 gets reduced, further supporting the theory energy exchange between the two modes. This also corresponded to peak shear layer TKE whereby the more that St 0.30 was amplified, the lower the peak TKE. Eddy convection speed was also computed, and it is shown that all excitation cases result in reduction, which is known to reduce acoustic intensity. In the minor plane, the peak noise was not significantly reduced and was even amplified with bi-modal excitation for
Footnotes
Acknowledgements
Financial support is provided by the Office of Naval Research under Grant No. N00014-21-1-2102 monitored by Dr Steven Martens. Computations were carried out using DoD HPC. The authors would like to thank Dr Chitrarth Prasad for assistance in using the SAFF LES code.
Declaration of conflicting interests
The author(s) declared no potential conflicts of interest with respect to the research, authorship, and/or publication of this article.
Funding
The author(s) disclosed receipt of the following financial support for the research, authorship, and/or publication of this article: This work was supported by the Office of Naval Research (N00014-21-1-2102).