
Abstract
A major challenge in vibration-based structural damage detection is differentiating actual damage from environmental and operational variations. Most existing studies are limited to short-term scenarios and do not consider long-term variations. With climate change driving more frequent and intense extreme weather events, long-term structural monitoring data exhibit covariate shift, for example, annual mean temperature increases over time. Such shifts pose fundamental challenges for machine learning models trained on historical datasets, as traditional algorithms often fail to extrapolate to these out-of-distribution environmental domains. This study develops a domain-adaptive nonlinear probabilistic latent variable model to advance long-term damage detection under climate change. First, Bayesian inference and kernel techniques are integrated to capture underlying nonlinear environmental effects without explicit environmental data. Second, domain adaptation is incorporated to enhance model adaptability to covariate shift scenarios due to climate change. The developed method is applied to a laboratory-tested slab and the practical Z24 bridge. Structural vibration properties are estimated under changing temperature and humidity conditions with consideration of four climate emission scenarios. The results demonstrate that the proposed method can distinguish damage-induced variations from climate-related environmental effects. It outperforms traditional methods that may result in false-positive and false-negative damage detections due to climate change and environmental nonlinear impacts.
Keywords
Introduction
Structural health monitoring (SHM) is an advanced technology to continuously monitor and evaluate safety conditions of civil infrastructures. Structural damage is defined as changes in the physical parameters that adversely affect structural current or future performance. 1 Vibration-based structural damage detection techniques have been extensively developed over the past decades,2–4 which can be broadly classified into model-based and data-driven categories. While model-based methods rely on finite element updating, 5 which often suffers from substantial modeling uncertainties in boundary conditions, data-driven methods 6 leverage statistical pattern recognition, making them highly effective and adaptable to various types of structures for real-time monitoring without the need for physical models.
The impact of environmental and operational variations on structural vibration properties poses a great challenge to data-driven damage detection methods.7–9 Civil structures are typically subjected to a wide range of operational and environmental conditions, such as temperature fluctuations, humidity changes, and varying loads, which may also lead to changes in structural damage-sensitive features. Failing to account for these effects can obscure actual structural damage and lead to false-positive (i.e., healthy structures are mistakenly identified as damaged) or false-negative (i.e., actual damage is misidentified as a healthy condition) detections. 10 Therefore, filtering out these environmental influences prior to damage detection is critical. The advancement of machine learning (ML) techniques, known for their strong capabilities in big data mining, has led to widespread exploration of ML-based data-driven damage detection methods. Farrar and Worden 11 provided a comprehensive overview of ML techniques for SHM and highlighted their potential to enhance the accuracy and reliability of damage detection. Bao and Li 12 summarized the ML paradigm for SHM challenges including data processing and pattern recognition, environmental uncertainties, improving damage detection accuracy and reliability.
Dimensionality reduction is a key branch of ML methods to distinguish the effects of environmental variations from actual structural damage. 11 In many cases, the variations in observations are influenced by only a few underlying factors. Dimensionality reduction techniques map high-dimensional data into a lower-dimensional space, capturing essential environmental factors while filtering noise. Healthy data can be reconstructed using these reduced dimensions, and subsequent new measurements that exhibit high reconstruction errors are then flagged as damage. Representative dimensionality reduction techniques include cointegration, 13 independent component analysis,14,15 linear discriminant analysis, 16 factor analysis,7,17 non-negative matrix factorization, 18 and principal component analysis (PCA).8,19 However, these models face two major constraints. First, they are limited to linear models, while environmental effects on structural vibration properties can be nonlinear. Second, ML models may experience performance degradation when dealing with out-of-distribution detection problems, where the model encounters data samples that follow a different distribution from the training data (i.e., distribution shift).
The first issue regarding the nonlinear environmental effects on structural vibration properties may arise due to varying temperature-sensitive mechanical properties of materials and complicated boundary conditions. 9 For example, Peeters and De Roeck 9 monitored the Z24 bridge for around 10 months and found that natural frequencies had a nonlinear relation with the temperature due to the frozen asphalt layer in cold days. Oh et al., 20 Reynders et al., 21 and Ghoulem et al. 22 applied kernel PCA to handle nonlinear damage detection examples. However, kernel PCA necessitates the manual selection of optimal parameters for the kernel function, and the dimensionality to be retained in the feature space is typically determined based on researchers’ experiences or through a trial-and-error approach. Additionally, the non-probabilistic model does not account for uncertainties that inherently exist in SHM data. More recently, advanced nonlinear frameworks have been exploited and demonstrated powerful feature extraction capabilities, such as deep learning-based approaches. 23 The black-box deep learning models typically require massive training data and lack interpretability. Alternatively, the Gaussian process latent variable model 24 offers a rigorous probabilistic approach to nonlinear dimensionality reduction, by providing a flexible mapping from the latent space to observation space and handling uncertainty. Nevertheless, the application of these models is currently limited to short-term SHM scenarios.
The second issue is that damage is a slow, progressive, and long-term process. The environmental factors may keep changing gradually in the context of climate change. Over a structure’s lifespan, the operational data will inevitably fall outside the distribution of the historical data used to train SHM models, thus demanding more robust and adaptive methods. Climate change leads to heightened intensity of monsoons, 25 increased frequency and strength of tropical cyclones, 26 greater duration of heat waves, 27 and elevated concentration of CO2. 28 The global average temperature has risen by more than 0.7°C from 1986 to 2016 compared to the period from 1901 to 1960. 29 The extreme temperature values have increased at a much faster rate than the mean values, and some regions experienced a more increase than others. 30 The impact of climate change on infrastructure has been investigated by many researchers, including the corrosion and deterioration of metals 31 and timber materials, 32 deterioration and creep of reinforced concrete,33–35 and wind-induced damages to infrastructures. 36 However, there is limited research related to the impact of climate change on vibration-based structural damage detection, which has recently become a critical area of investigation as the non-stationarity introduced by a changing climate can render historical training data obsolete and compromise the reliability of ML-based SHM systems. For example, Figueiredo et al. 37 have demonstrated through studies on the Z24 bridge data that significant shifts in mean temperature can cause trained classifiers to produce false negatives, misidentifying damaged conditions as healthy due to outdated reference datasets. To address this challenge and develop more resilient SHM strategies, Möller et al. 38 have proposed enhancing data-driven models with physical knowledge to improve robustness against unobserved environmental conditions. Furthermore, Quqa et al. 39 have put forward the idea of establishing new regional-scale monitoring paradigms that integrate remote sensing and knowledge transfer to adapt to emerging climate risks. Performance degradation is a common and challenging issue when ML models encounter data that significantly differs from the training data. 40 Many existing ML-based data-driven damage detection methods are trained using historical data. Their performance will inevitably deteriorate applied to long-term damage detection, since the test data will fall outside the range of the training data in the context of climate change. To mitigate the issue of distribution shift (or domain shift), domain adaptation techniques have been widely explored to align the statistical distributions of features across different domains to improve generalization.40–43 However, most existing studies in SHM focus on population-based transfer (between different structures) 43 or simulation-to-real 42 transfer. There is still a lack of specialized domain adaptation frameworks specifically designed to handle the temporal distribution shift caused by long-term non-stationary climate change within a single structure’s lifespan. Therefore, improving the robustness of ML models to long-term distribution shifts under the impact of climate change is highly necessary.
Considering the research gaps stated above, this study develops a novel dimension reduction approach for long-term damage detection in the context of climate change. The primary contributions of this study are as follows:
From a methodological perspective, this study establishes a rigorous nonlinear latent variable model that integrates domain adaptation directly into a probabilistic framework. Rather than simply combining techniques, the feature augmentation is embedded within the kernel function of a sparse Gaussian process model. This novel embedding allows the model to simultaneously address structural nonlinearity and retain the Bayesian probabilistic framework for efficient automatic parameter estimation without requiring explicit correlation expressions. Crucially, this formulation provides the mathematical capacity to compensate for distribution shifts, a capability lacking in standard dimensionality reduction techniques.
From a problem-solving perspective, this study overcomes the fundamental limitation of stationary environmental assumption in current SHM literature by applying transfer learning to the context of climate change. The model’s performance in out-of-distribution extrapolation scenarios where test data falls outside the range of the training data is enhanced. The performance is tested for climate change projections under four shared socioeconomic pathways (SSPs) scenarios 126, 245, 370, and 585, demonstrating the ability to mitigate false-positive damage detection caused by data extrapolation and false-negative detection caused by latent nonlinearities.
Domain-adaptive nonlinear probabilistic latent variable model
Denote the measured structural vibration properties (such as frequencies) as

where
The formulation presented in Equation (1) has been extensively employed for structural damage detection subject to varying environmental conditions.7,21,22 Unlike black-box models, this probabilistic latent variable formulation inherently maintains physical interpretability by modeling the underlying relationship between structural responses and unobserved environmental factors. This formulation encompasses several classical methods as special cases:
Linear factor analysis.7,44 When both mapping functions
Kernel PCA.21,22 When
Therefore, an ideal model should maintain probabilistic properties for automatic parameter optimization and the nonlinear flexibility of kernel PCA, but with significantly lower computational demands. Hence, this study interprets the model in Equation (1) as both probabilistic and nonlinear, to address the nonlinear effects and distribution shifts inherent in long-term damage detection. A latent variable model is defined as

where
Maximum likelihood estimation of the latent variable
The estimation of unknown parameters and variables in Equation (2) begins with a tractable linear model and is then extended to the nonlinear case via kernel substitution. Consider the linear model
where
where
By replacing the inner product

where
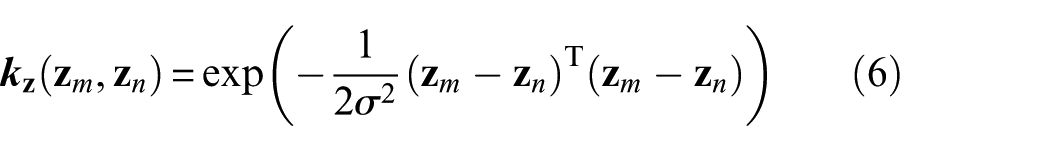
where
where
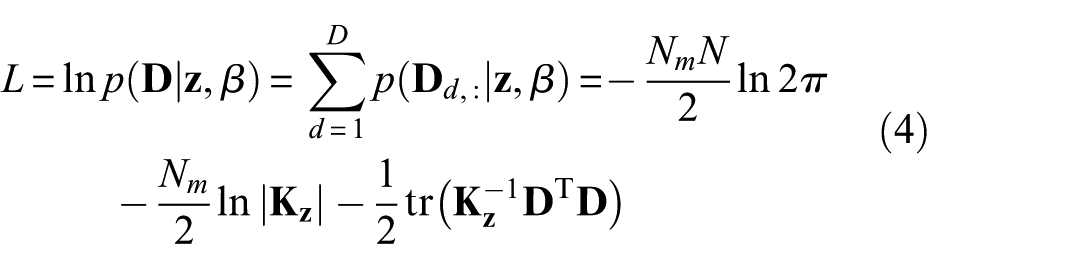
With the kernel function selected, the next step is to optimize the latent variables
where
Domain-adaptative sparse Gaussian process for observation reconstruction
With the latent variable
Domain adaptation addresses the divergence in data distribution between source and target domains, facilitating the transfer of knowledge learned from a source domain to a related but different target domain.43,46 To address the distribution divergence between the source domain (historical health data) and target domain (test data under climate change), the feature augmentation
47
-based domain adaptation technique can be integrated with the Gaussian process model. The feature augmentation
47
technique explicitly separates domain-invariant and domain-specific features by expanding the latent variable vector


where

where
Such a feature augmentation process explicitly separates domain-invariant and domain-specific features. The ML model thus learns domain-invariant patterns and adapts to the target domain through the target-specific features. 47 This approach was specifically chosen over other common domain adaptation techniques, such as those based on geometric alignment.40–43 Unlike geometric alignment methods that try to force distributions to overlap, which can distort the physical meaning of environmental variables in regression tasks, feature augmentation preserves the physical structure of the data while learning a mapping that accommodates the shift. This preservation is particularly crucial for our goal of observation reconstruction, which is a regression task rather than simple classification.
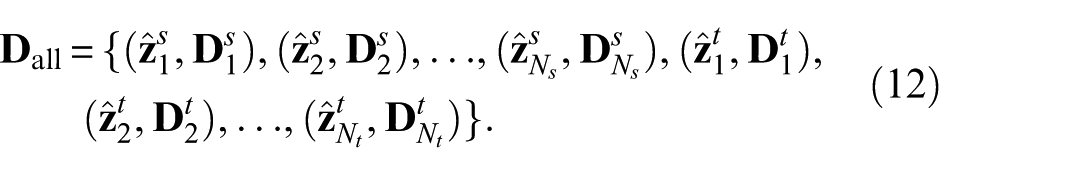
A critical challenge in this study is that the target domain
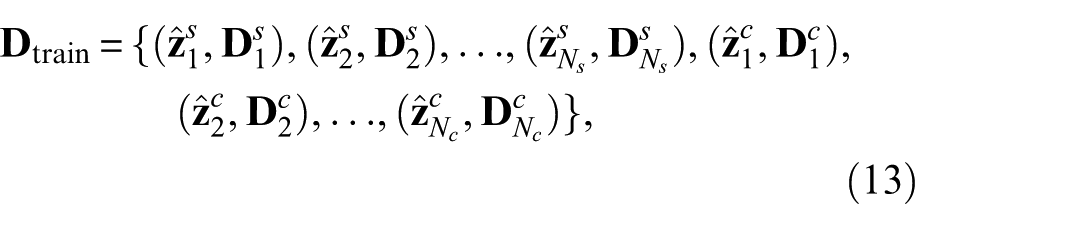
and the expanded latent variables of the training data are

This construction explicitly decomposes the representation into a shared (domain-invariant) component and a domain-specific component. The abundant source data

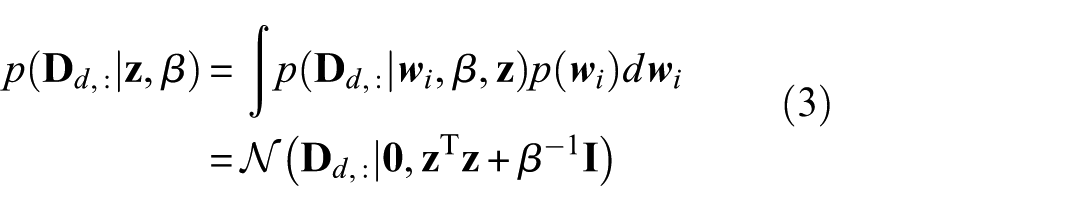
With the expanded inputs, the Gaussian process model expresses the observation

where the distributions of

where
where
Finally, the reconstruction of the target data is performed by calculating the posterior likelihood. The sparse Gaussian process model is trained based on the expanded training data in Equation (13), and then directly applied to the latent variables

where
Damage index based on reconstruction errors
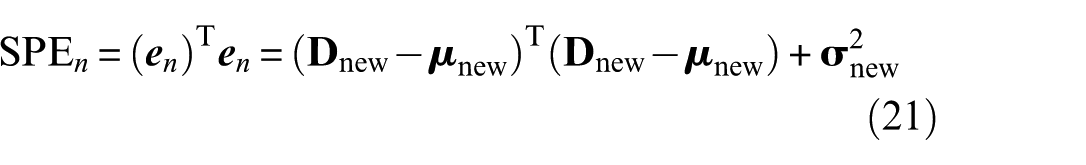
Through the proposed domain-adaptive sparse Gaussian process, the model is trained on the union of historical source data and the calibration set from the target domain. It is noteworthy that both source dataset

where
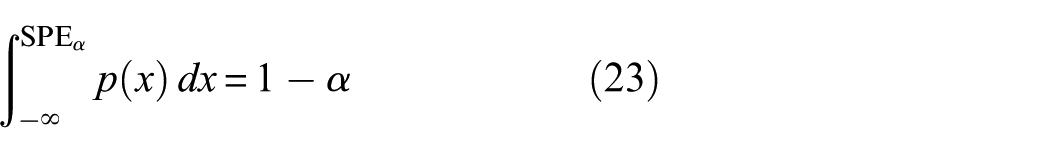
To determine the decision threshold for the SPE statistic, the kernel density estimation (KDE)
49
is employed. Assume that the SPE statistic follows the unknown probability density function
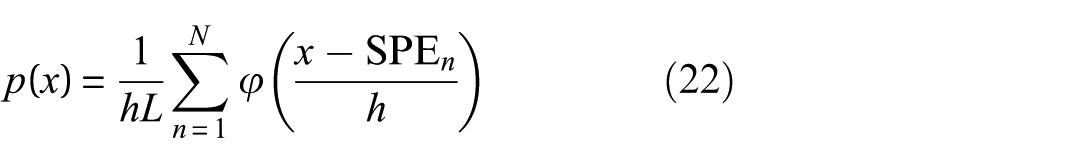
where
where
Comparison with baseline models
The domain-adaptative nonlinear probabilistic latent variable model and basic models discussed above are compared in Table 1. The model in this study offers a probabilistic and nonlinear framework that effectively manages uncertainty and variability in the data. Nonlinearity enables the model to capture complex relationships within the data, which is particularly important in fields where interactions between variables are intricate or influenced by multiple factors simultaneously. Additionally, the model demonstrates high efficiency and is well suitable for real-time analysis or involving large datasets, such as long-term damage detection. As highlighted in Table 1, the key advantage of the proposed method is its
Comparison of model characteristics and efficiency.
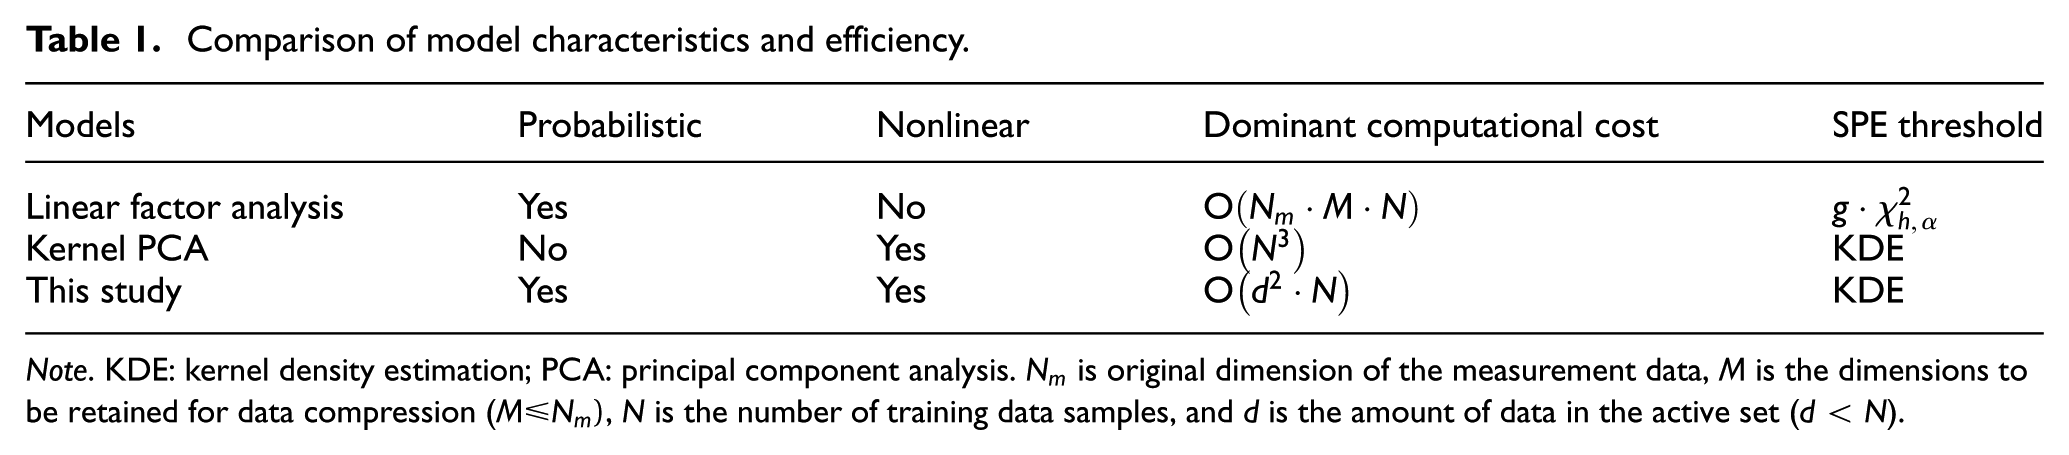
Note. KDE: kernel density estimation; PCA: principal component analysis.
To further illustrate this practical advantage in scalability, we ran a comparative test on a representative scenario with N = 3000 training samples and an active set of d = 400. The analysis was conducted on a desktop computer equipped with an Intel Core CPU, 48 GB of RAM, and an NVIDIA GeForce RTX 2080Ti GPU for acceleration. Using kernel PCA, the entire process, which includes the time-consuming trial-and-error method for selecting the optimal kernel parameter, took approximately 135 min. In contrast, the method developed in this study, which automates dimensionality determination and parameter optimization, completed the same task in approximately 9 min. This reduction to just 7% of the time required by kernel PCA underscores the proposed model’s superior efficiency and its advantage in automating parameter estimation.
Long-term damage detection method under climate change
Based on the developed domain-adaptive nonlinear probabilistic latent variable model, this study aims to propose a long-term damage detection method considering the impact of climate change, with a particular focus on whether the model can distinguish between the effects of climate change and structural damage. Therefore, the model’s training data will consist of structural vibration properties in a healthy state under varying environmental conditions. The test data, on the other hand, will include structural vibration properties under environmental conditions that fall outside the range of the training data.
To generate the test data for model performance validation, we need to predict structural vibration properties based on future climate data. The NASA NEX-GDDP-CMIP6 dataset 50 provides global, high-resolution, bias-corrected climate projections suitable for regional impact studies. Complementing this effort, the Coupled Model Intercomparison Project Phase Six (CMIP6), initiated in 2014, provides climate projections to understand past, present, and future climate changes. This study utilizes the NEX-GDDP-CMIP6 dataset, which comprises global downscaled climate scenarios derived from the CMIP6 framework, produced by 35 different global climate models from different Institutions or Countries, as listed in Table 2.
Different global climate models in NEX-GDDP-CMIP6 dataset.
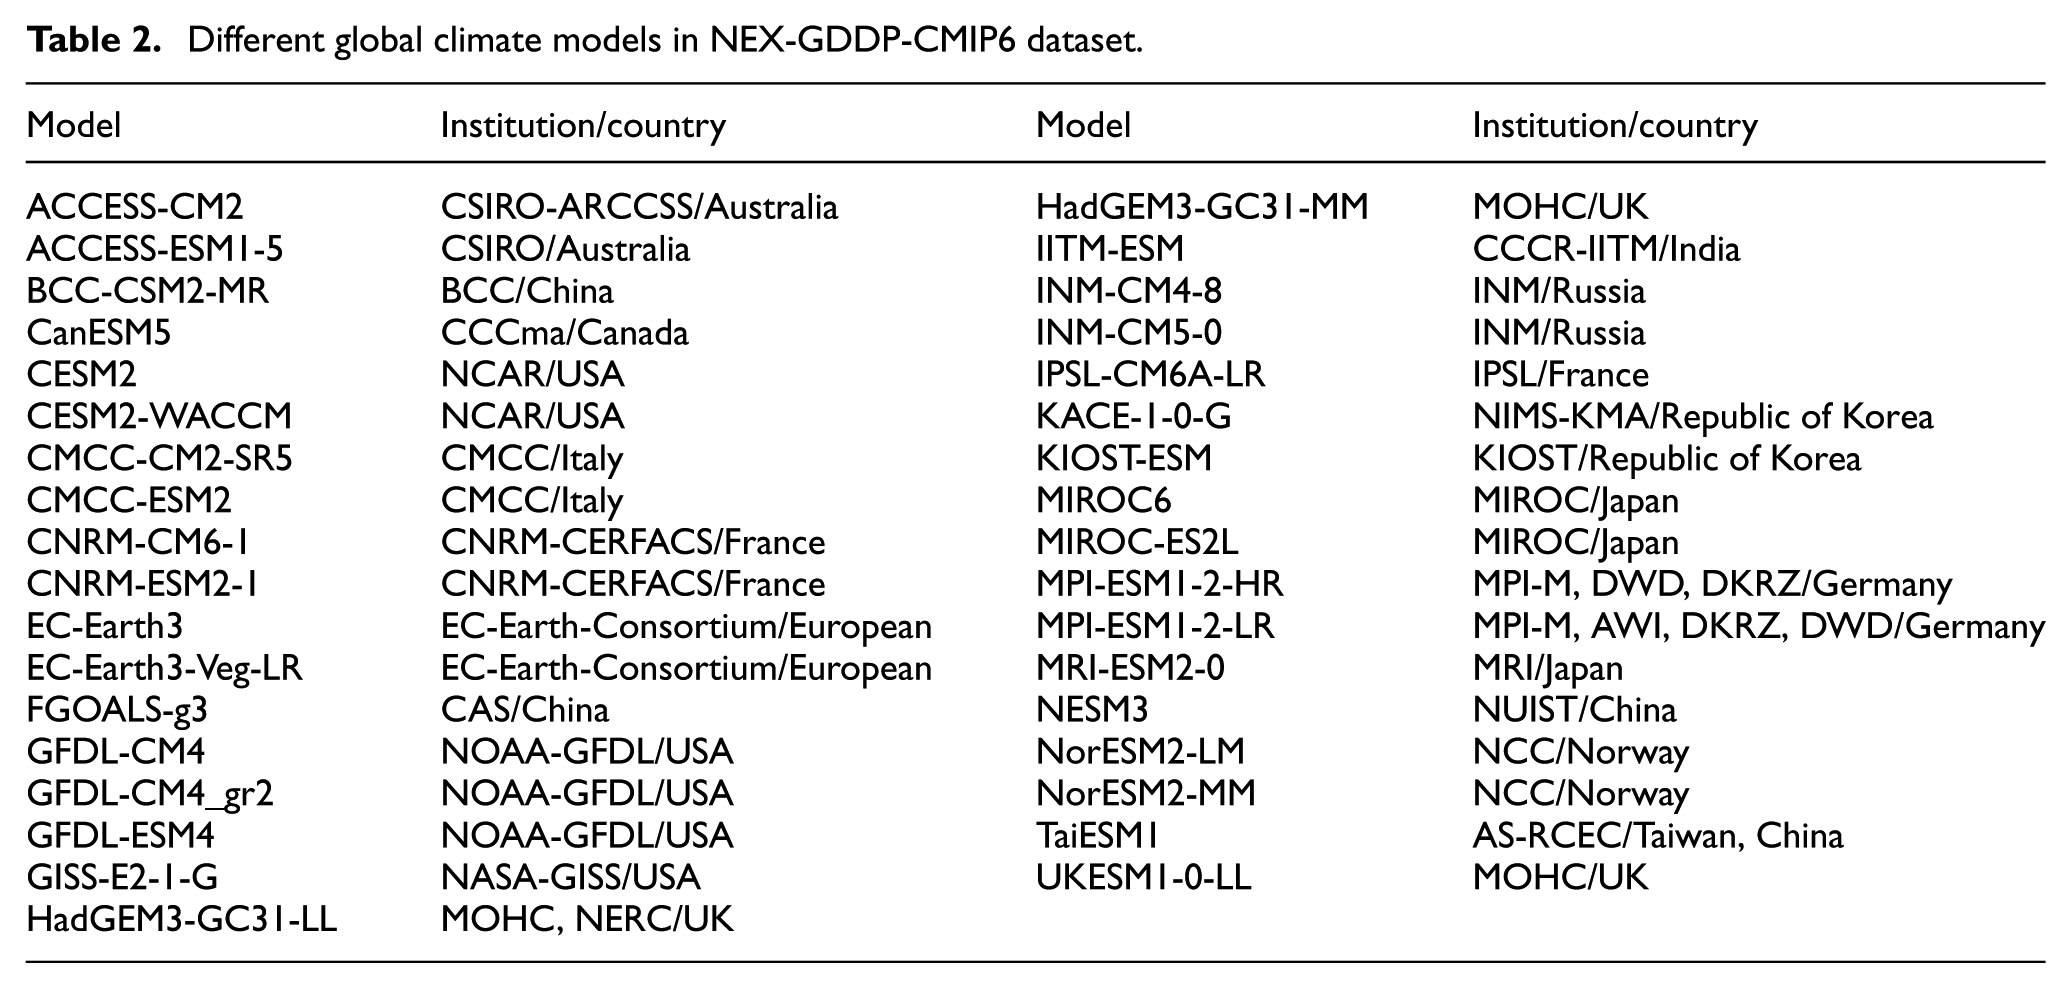
The NEX-GDDP-CMIP6 dataset encompasses historical data from 1995 to 2014 and future projections from 2015 to 2100, with a spatial resolution of 0.25° × 0.25° (approximately 27.75 × 27.75 km at the equator, decreasing poleward). The dataset includes projections across four “Tier 1” greenhouse gas emissions scenarios, namely, SSP126, SSP245, SSP370, and SSP585, each representing a different trajectory of greenhouse gas emissions and socioeconomic development. Specifically, these represent a trajectory scale ranging from SSP126 (stringent emission mitigation and green technologies) through intermediate scenarios (SSP245, SSP370) up to SSP585 (the highest emission scenario with unabated fossil fuel use).
Utilizing the NEX-GDDP-CMIP6 dataset, structural vibration properties under anticipated future climate conditions can be forecasted. These forecasts serve as test data to evaluate the model’s performance. Crucially, climate change is treated here as a driver of long-term distribution shift, not as a coupled physical deterioration model. Figure 1 illustrates the steps of the developed damage detection method, with the highlighted pink block specifically emphasizing the generation of test data through these predictions. It is noteworthy that in future real applications to structural damage detection under climate change, these test data are directly available, and the steps outlined in the pink block can be bypassed.
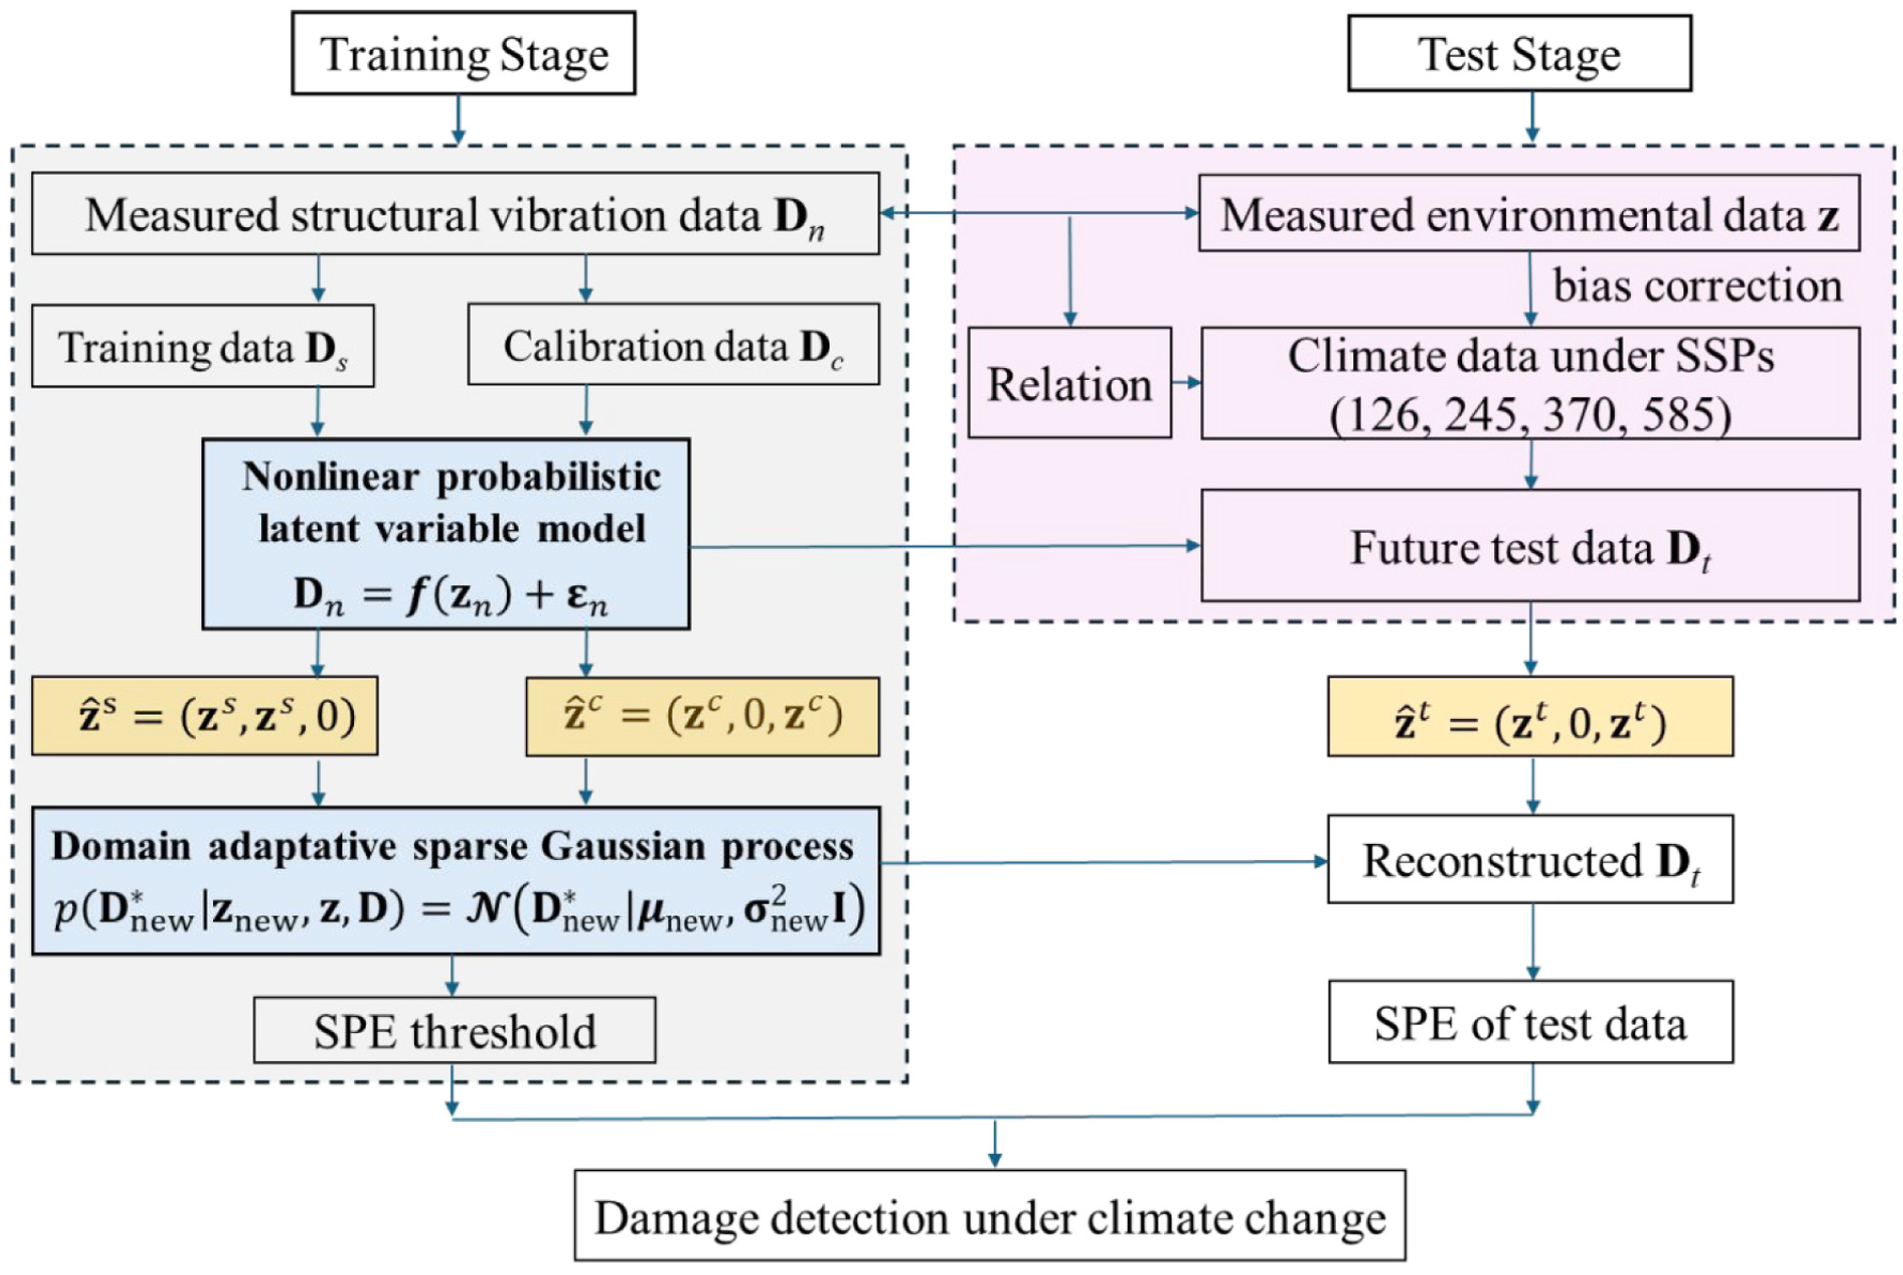
Flowchart of the developed damage detection method.
The detailed procedures in Figure 1 are as follows:

Case study 1: A reinforced concrete slab
Structural description
The reinforced concrete (RC) slab, as detailed in Refs. 51, has dimensions of 6400 × 800 × 100 mm and two equal spans of 3000 mm with an additional 200 mm at each end, as depicted in Figure 2. The structure was monitored from June 2003 to March 2005, during which 136 sets of modal properties and environmental factors including temperature and humidity were recorded. The previous study showed that the RC slab’s frequencies had a linear relation with temperature and humidity, while the mode shapes were insensitive to temperature and humidity variations. Figure 2(b) plots the first four frequencies plotted against the sample numbers.
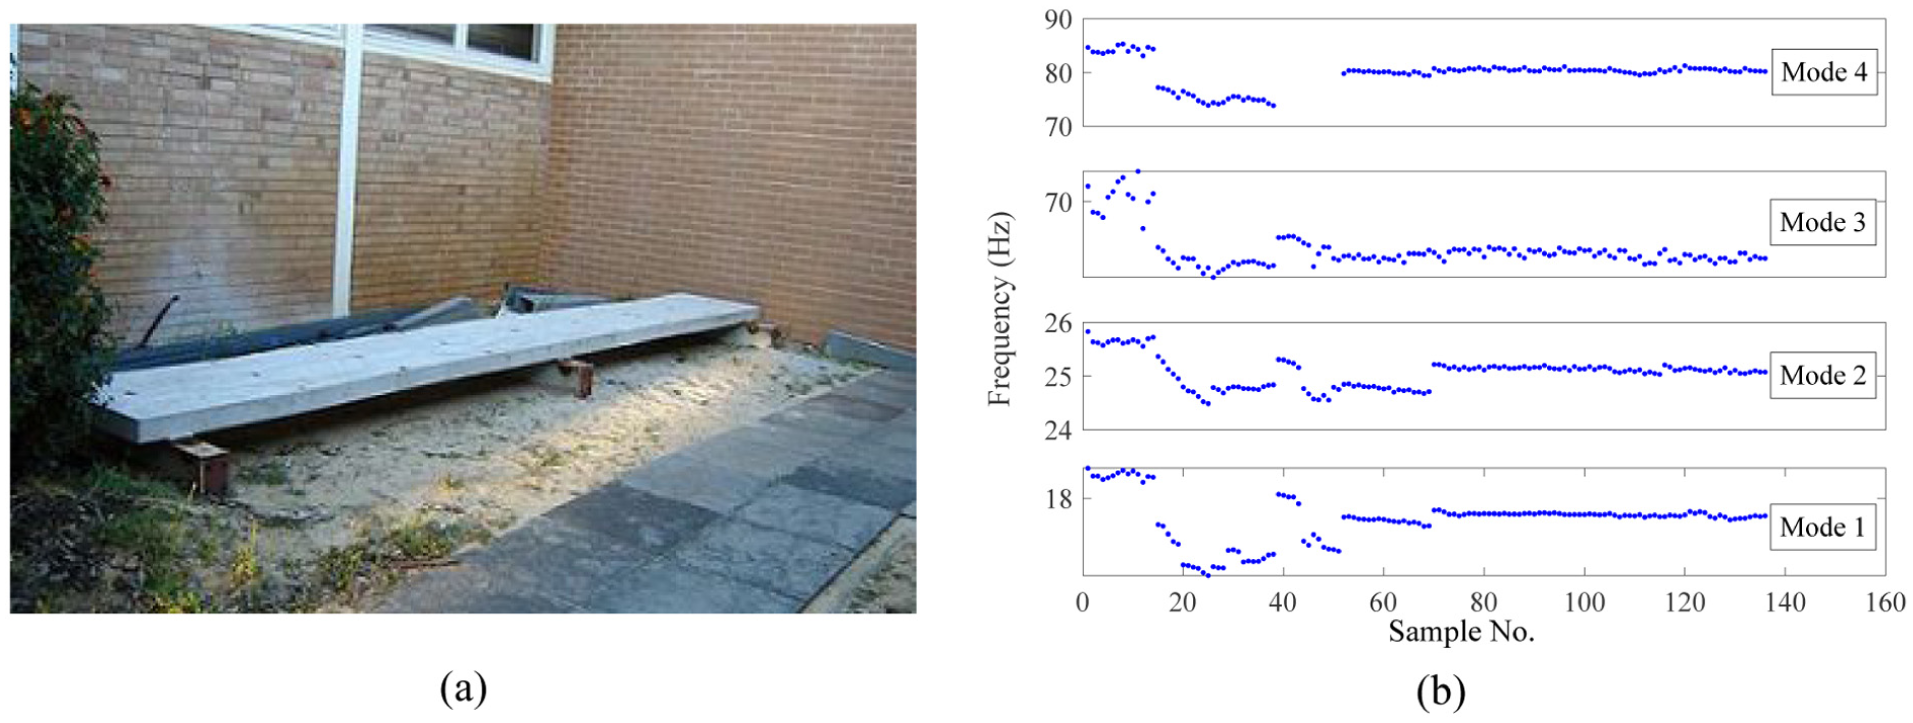
Near 2-year measured frequencies of the RC slab. (a) RC slab and (b) Frequency variations from June 2003 to March 2005.
Figure 3 shows the linear relation of frequencies to temperature. Although Figure 3 exhibits a certain degree of scattering, this variability is attributed to measurement noise and the coupled influence of humidity, as detailed in the prior long-term monitoring study of this slab. 51 Based on the estimated linear relations between RC slab’s frequencies and temperature and humidity, 51 structural frequencies under the impact of future climate change can be predicted using NASA’s climate change data including humidity and temperature.
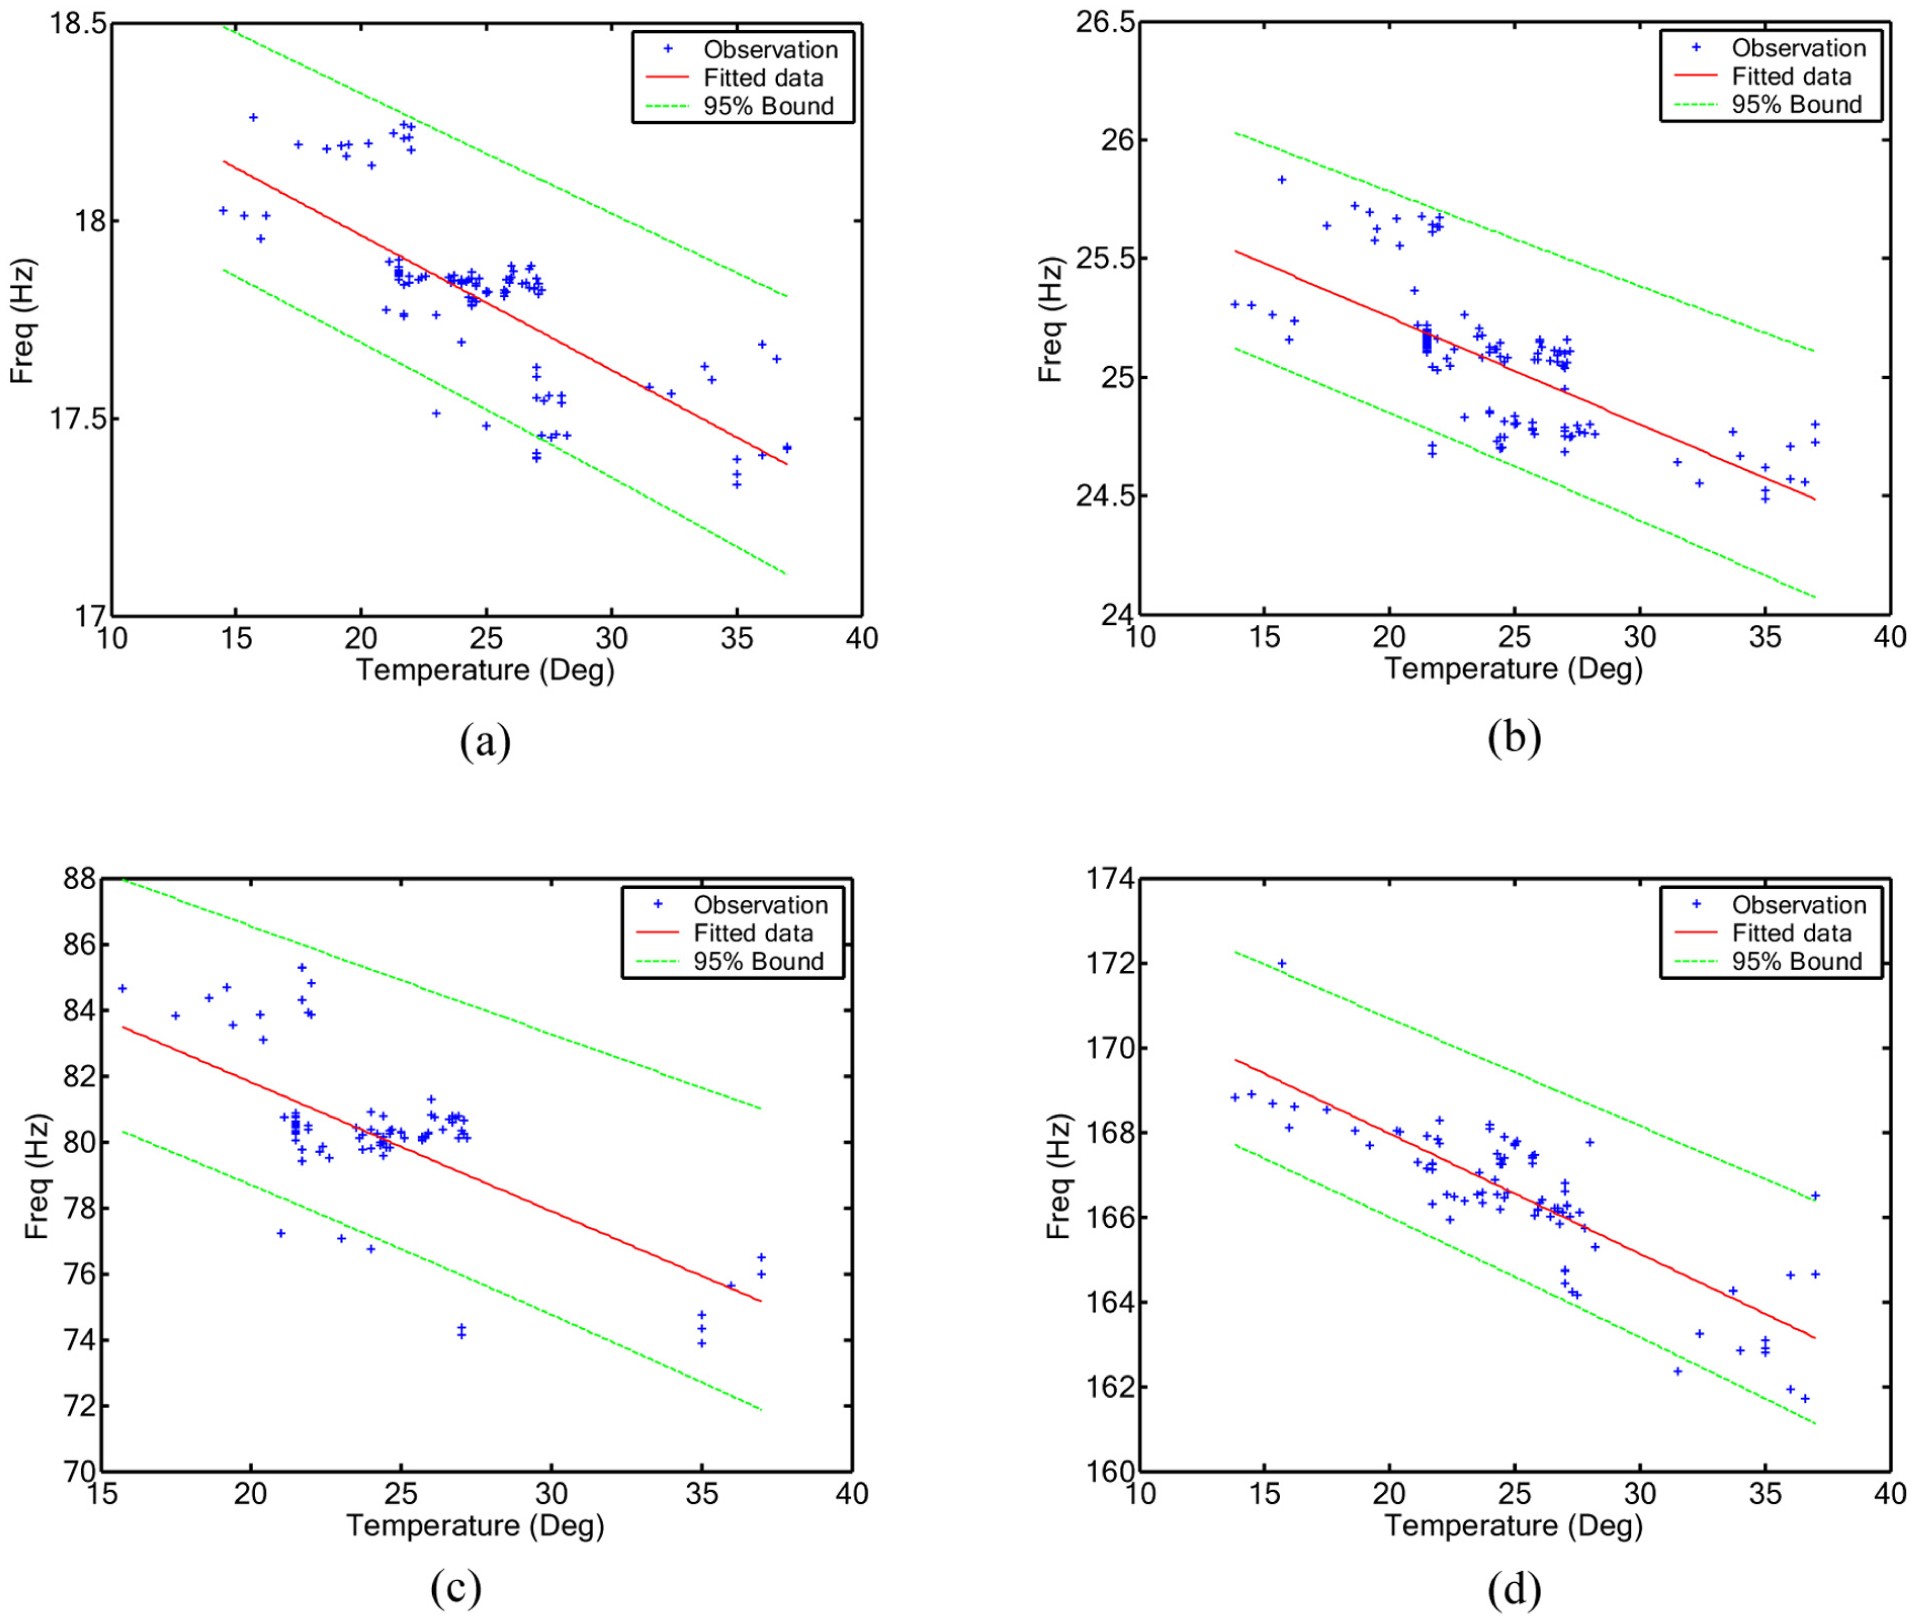
Relation of frequencies to air temperature. (a) Mode 1, (b) Mode 2, (c) Mode 3, and (d) Mode 4.
NASA temperature and humidity data and structural frequency projections
The NEX-GDDP-CMIP6 dataset (0.25° × 0.25° resolution) was utilized. The nearest downscaling point (31.8750° S, 115.8750° E) was selected to represent the RC slab’s location at The University of Western Australia (31.9789° S, 115.8179° E). The daily near-surface temperature and relative humidity data of the point were then downloaded, involving 35 different global climate models listed in Table 2. Table 3 shows the predicted near-surface temperature and relative humidity data of ACCESS-ESM1-5 and EC-Earth3 models under four SSP scenarios in Year 2040, 2070, and 2100.
Predicted temperature (°C) and humidity (%) of different climate models for RC slab.
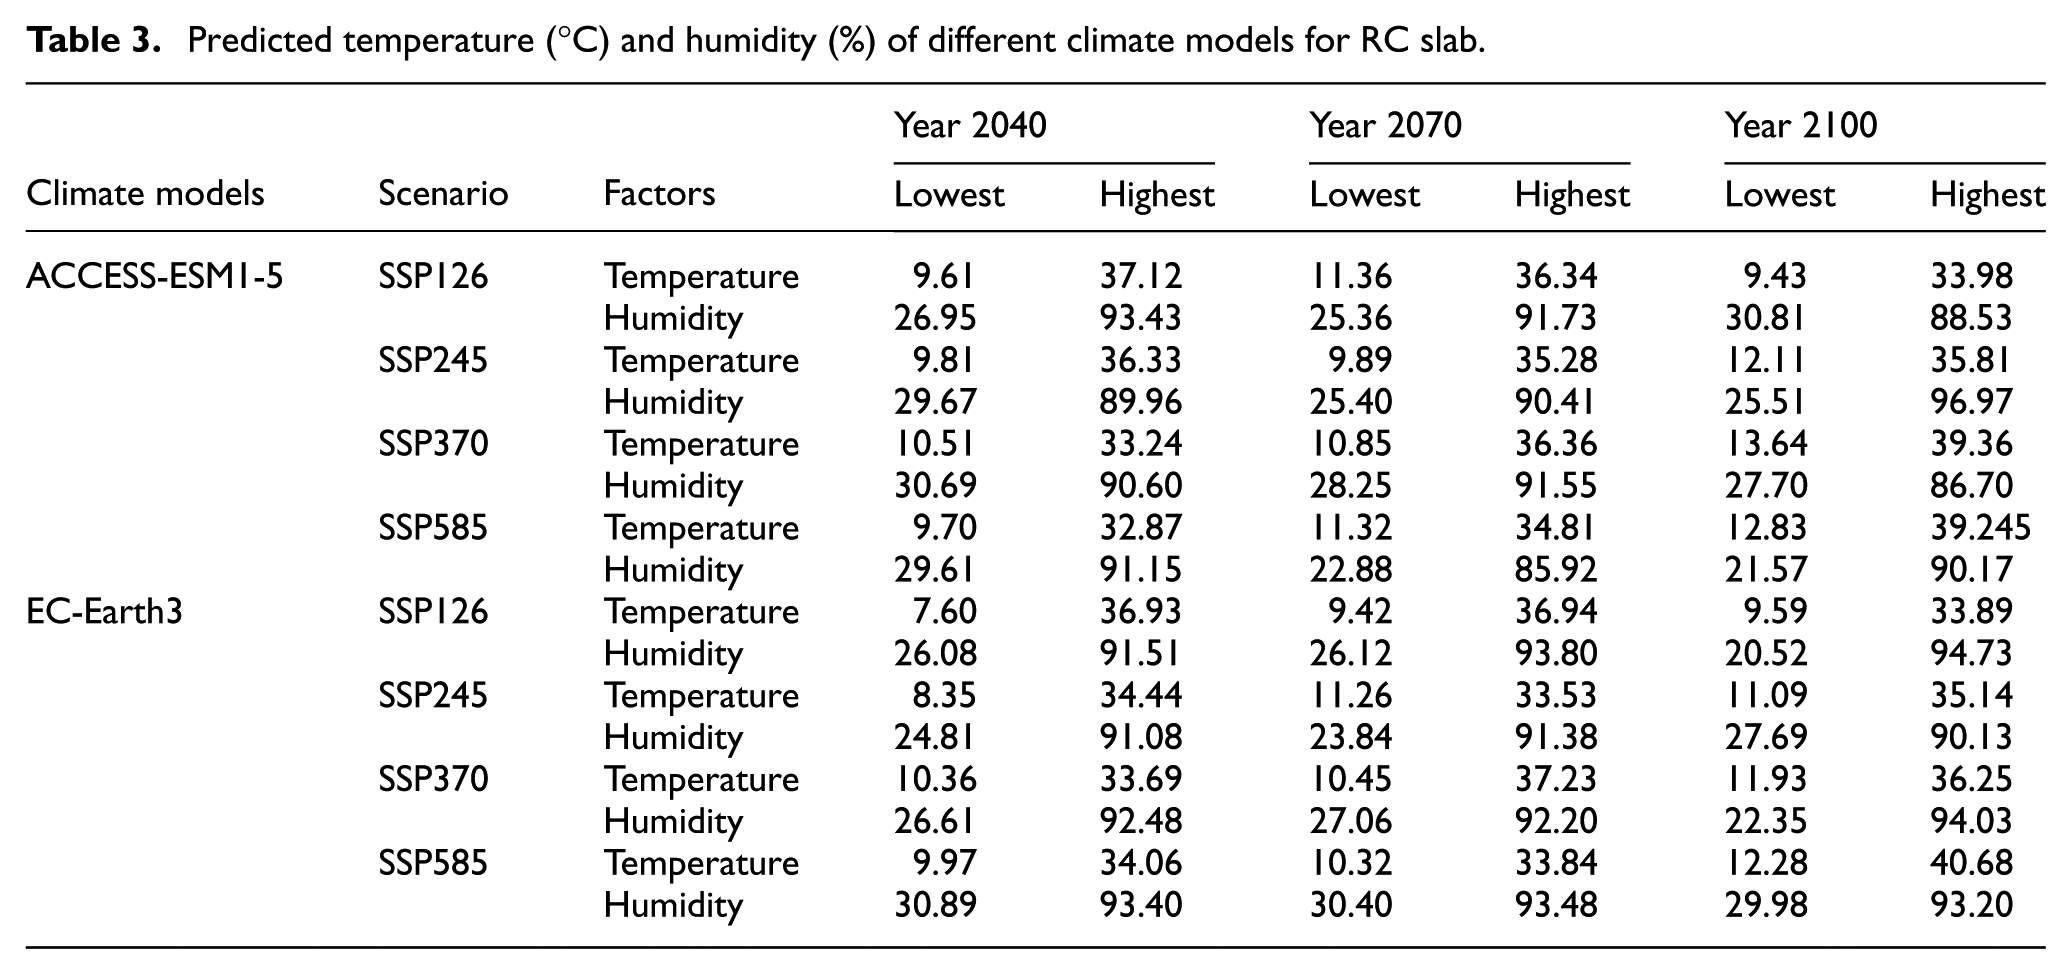
The NEX-GDDP-CMIP6 dataset is utilized to forecast future observations of the RC slab’s frequencies, based on the fitted linear relationship between environmental factors and frequencies measured from June 2003 to March 2005. Notably, as this relationship is built on the air temperature near the RC slab, whereas the NEX-GDDP-CMIP6 dataset only provides a coarse spatial resolution of 0.25° × 0.25°, an additional projection is necessary to map the air temperature data provided by the NEX-GDDP-CMIP6 dataset to the specific air temperature near the local RC slab. Quantile mapping bias correction 52 is adopted to improve the alignment of climate model outputs with observations in Year 2004. As the measured dataset and climate dataset in 2014 have different sizes, interpolation methods (such as linear interpolation) are used to estimate the quantiles of the reference dataset at the cumulative probabilities corresponding to the quantiles of the target dataset. A mapping function will be developed to relate each quantile of the target dataset to the corresponding quantile of the reference dataset. Subsequently, for each value in the target dataset, the mapping function will be used to find the corresponding value in the reference dataset. Based on the bias-corrected climate data, corresponding structural frequencies can be estimated. Figure 4 illustrates the predicted frequencies in different years under different SSPs of the ACCESS-ESM1-5 climate model.
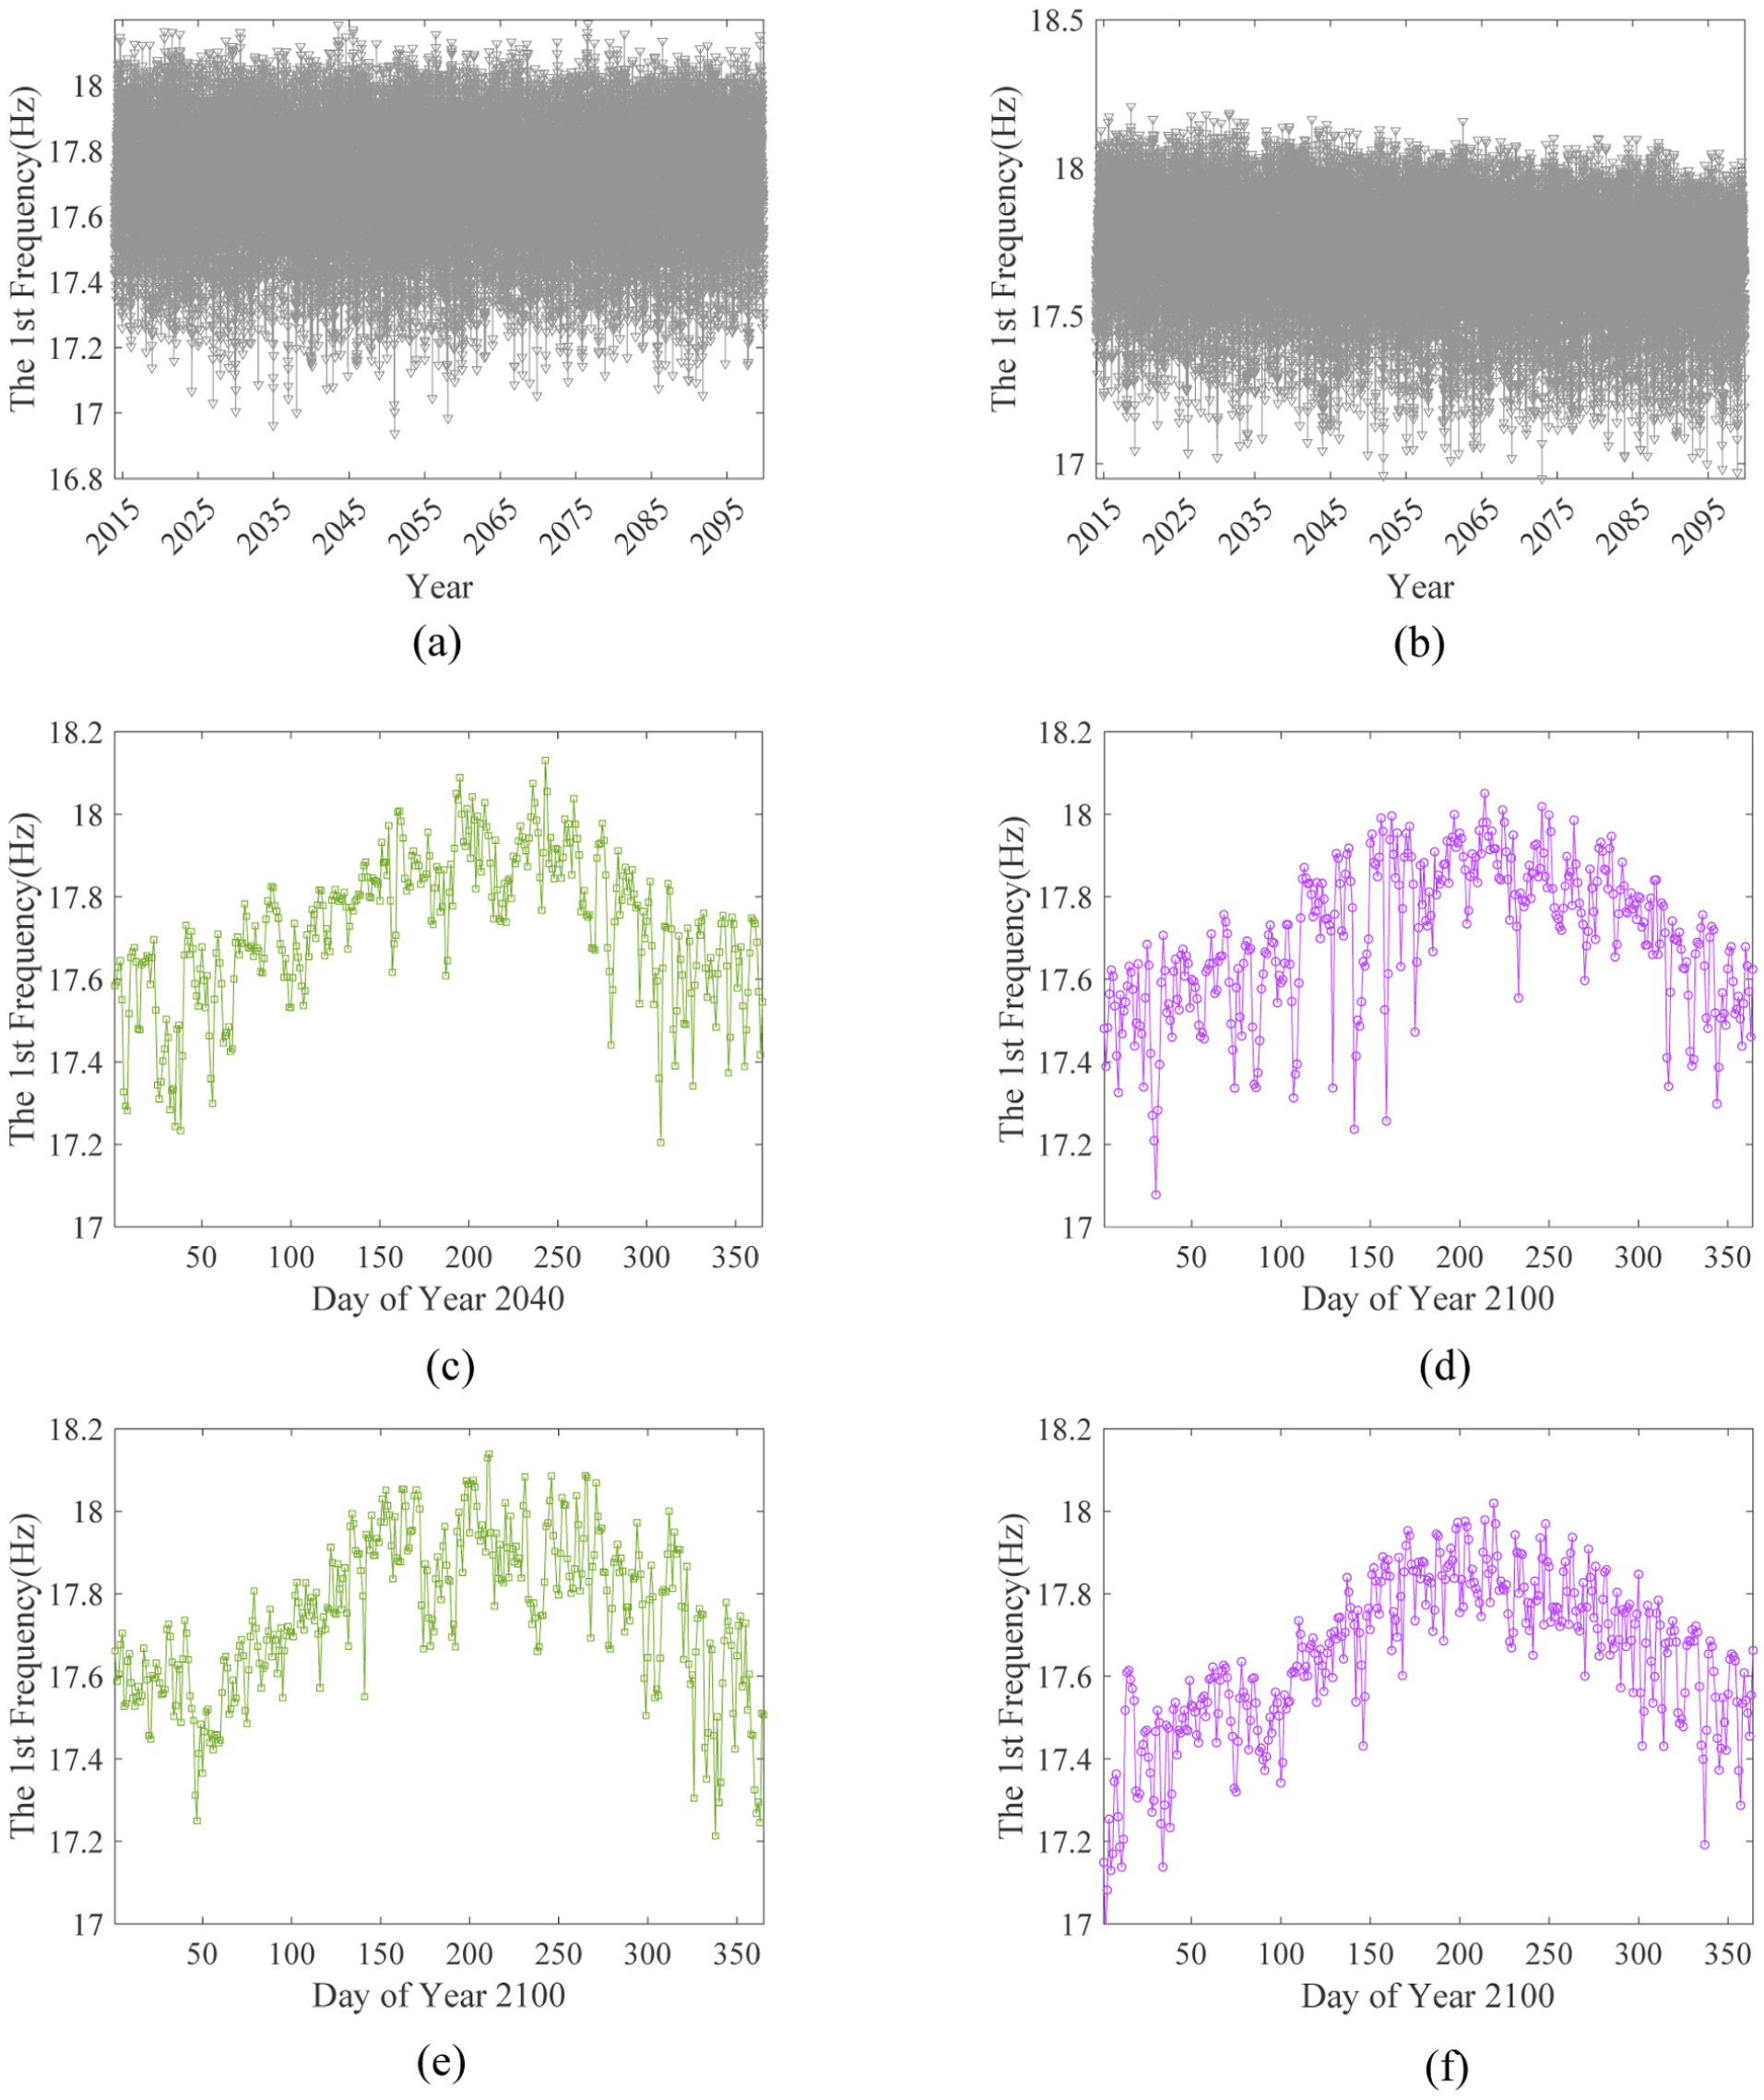
Predicted frequencies of the RC slab of ACCESS-ESM1-5 model. (a) Predicted frequencies of SSP245, (b) Predicted frequencies of SSP585, (c) SSP245 in Year 2040, (d) SSP245 in Year 2100, (e) SSP585 in Year 2040, and (f) SSP585 in Year 2100.
The training data, as illustrated in Figure 2(b), encompass a range of frequencies, such as the first frequency in the range of (17.33, 18.26) Hz. However, the predicted frequencies in Figure 4 obviously extend beyond the range of these measured frequencies, such as the frequencies in Figure 4(b) with the range of (17.07, 18.02) Hz. This discrepancy highlights an out-of-distribution problem, where the data goes beyond the range of training data. To conduct the domain adaptation introduced in Equations (13) and (14), the predicted frequencies of the first ten years (i.e., from Year 2015 to 2024) are set to be the calibration set
Long-term structural damage detection
The developed damage detection method is applied to the RC slab dataset for damage detection. In this case study, the near 2-year monitored structural frequencies will be used as the training data. The frequencies predicted under the impact of climate change are then used as the test data to evaluate the model performance.
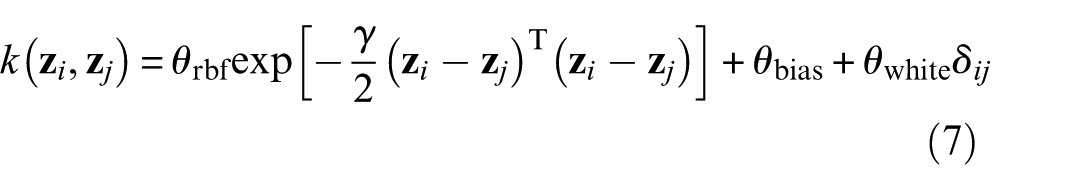
In the model training stage, parameters of the kernel functions need to be initialized first. The RBF kernel in Equation (7) is employed, and the initial parameters are
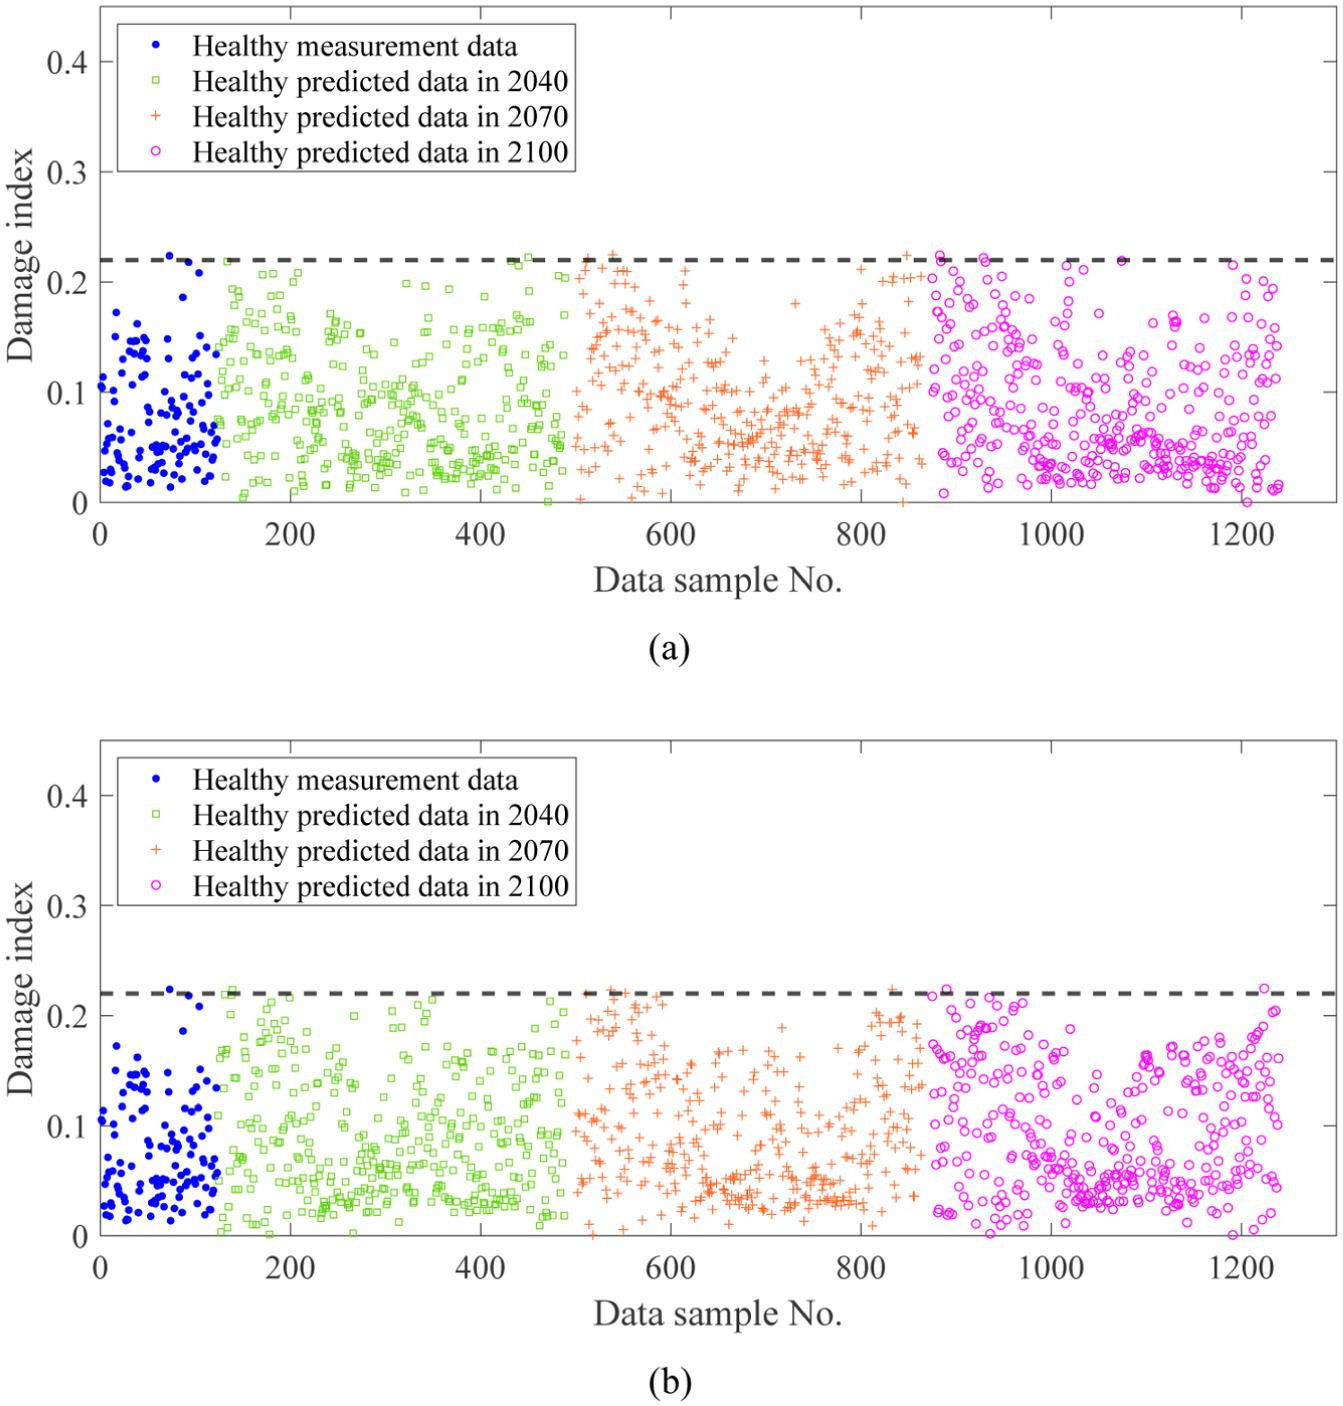
Reconstruction error of ACCESS-ESM1-5 model. (a) SSP245 and (b) SSP585.
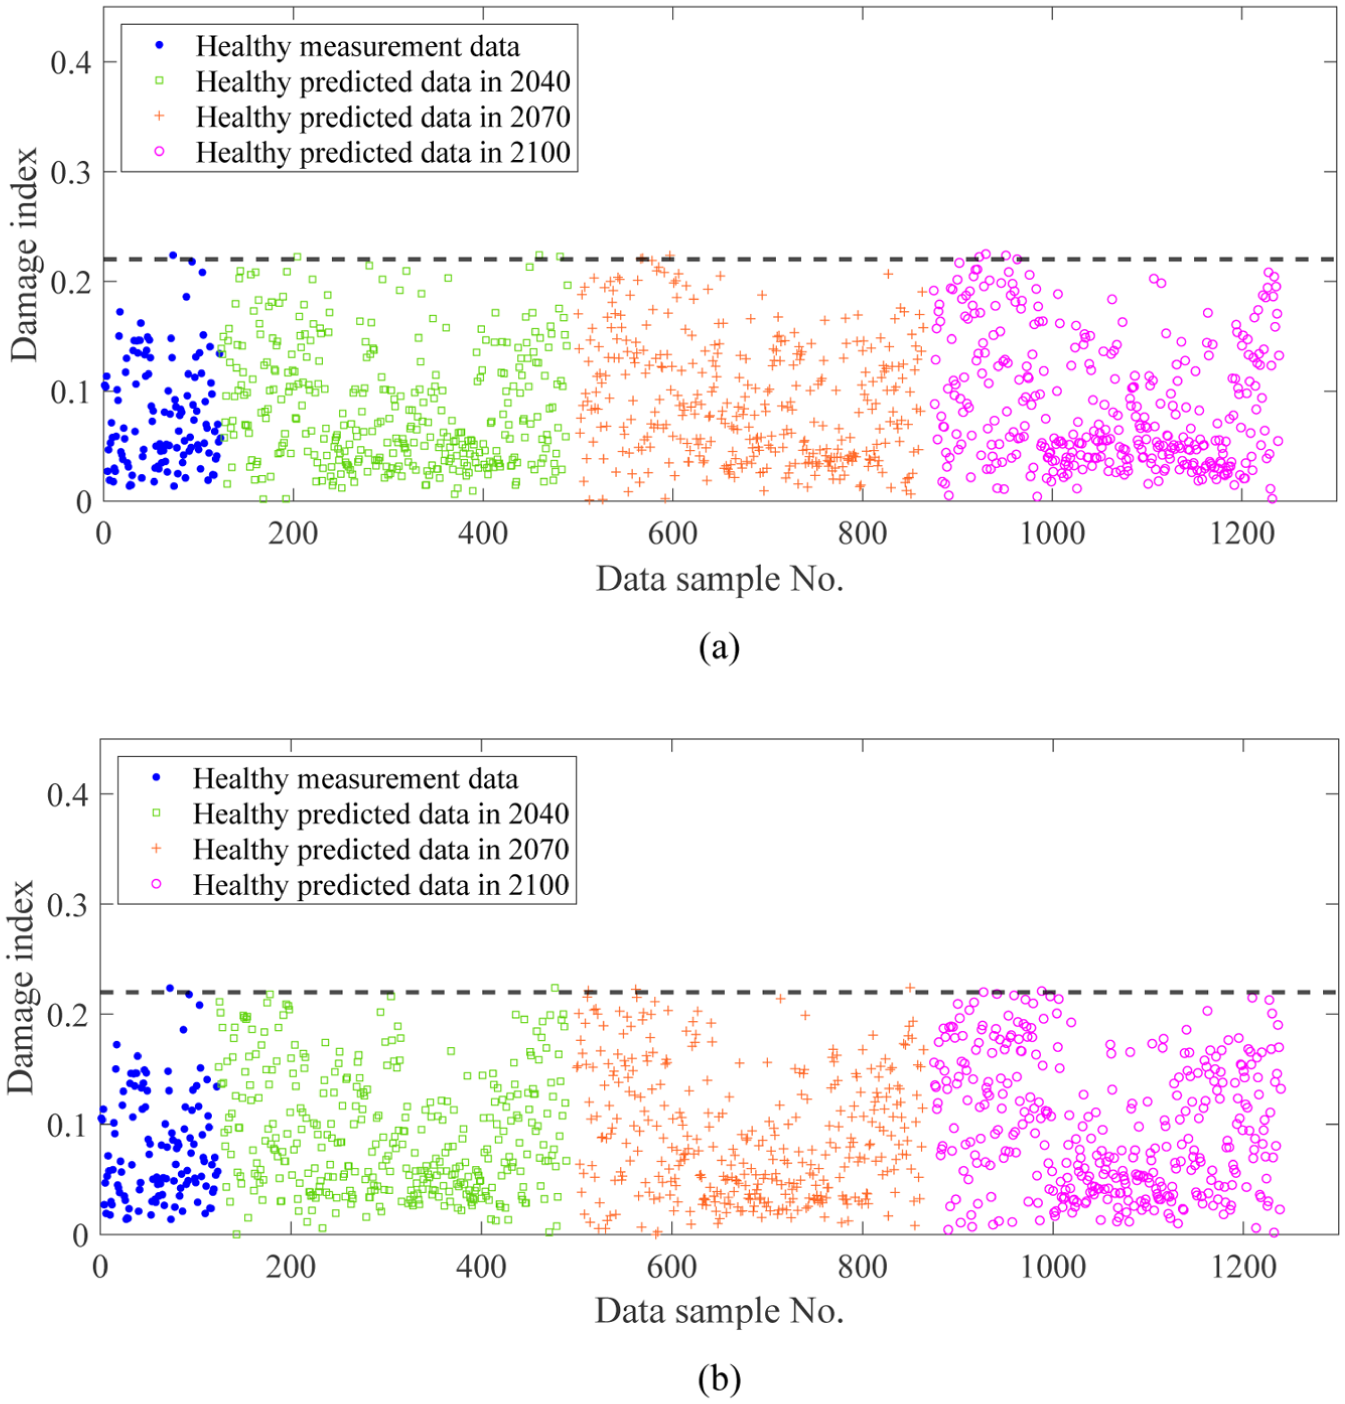
Reconstruction error of EC-Earth3 model. (a) SSP245 and (b) SSP585.
As Figures 5 and 6 show, the SPEs of the test data remain comparable with those of the training data (i.e., healthy data), indicating that the test data reflect a healthy condition, and the variations in structural frequencies are due to changes in environmental conditions rather than alterations in the structural conditions. The results accord with the reality that the test data are predicted in structural health condition under climate change. It is noteworthy that under SSP585, where the environmental conditions change most significantly and fall outside the range of the training data, the developed method still demonstrates good extrapolation performance.
The comparison study
To evaluate the performance and highlight the advantages of the proposed domain-adaptive nonlinear model, we conduct a direct comparison with the traditional linear factor analysis method,7,44 a widely used baseline for data-driven damage detection. The linear factor analysis model is trained based on the measured 136 data samples and then applied to the test data. The SPEs of the training and test datasets for the ACCESS-ESM1-5 model are plotted in Figure 7. The dash line corresponds to the threshold at the significance level
Reconstruction error of ACCESS-ESM1-5 model using the linear factor analysis. (a) Year 2040 of SSP245, (b) Year 2100 of SSP245, (c) Year 2040 of SSP585, (d) Year 2100 of SSP585.
Case study 2: Z24 bridge
Bridge description
Z24 bridge is a post-tensioned concrete box-girder bridge consisting of a 30 m long main span and two 14 m side spans, as depicted in Figure 8. The bridge, located in Switzerland connecting Utzenstorf and Koppigen, was monitored from 11 November 1997 to 11 September 1998. 9 A total of 49 sensors were installed on the bridge to record the variations of environmental conditions, including the temperature, wind, humidity, etc. Another 16 accelerometers were installed to record acceleration responses. In the later monitoring period, progressive damages were artificially introduced to the bridge in a controlled manner, beginning with pier settlement on 10 August 1998, 53 as detailed in Table 4.
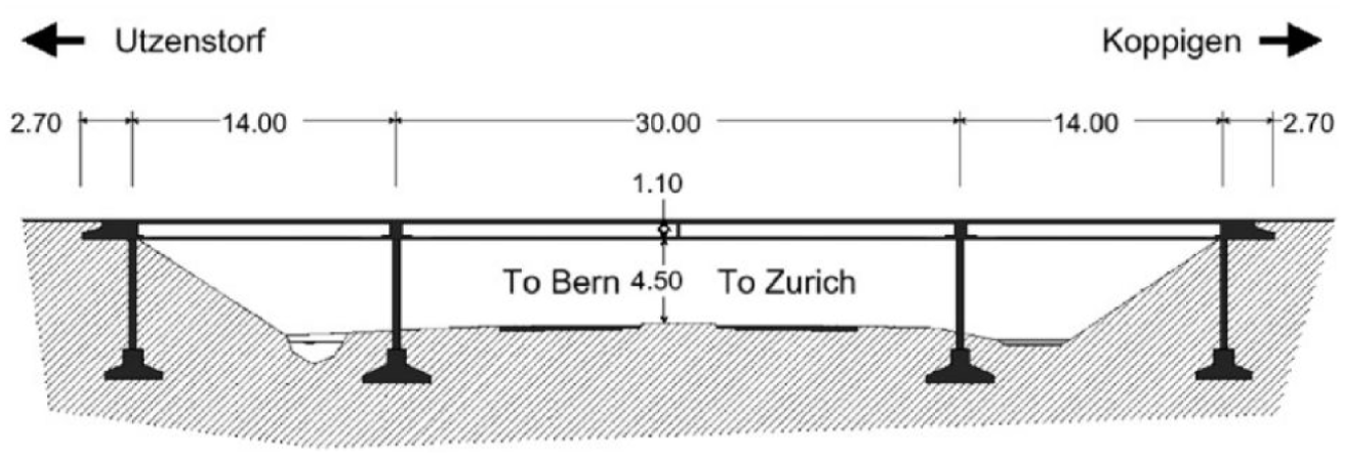
Side view of the Z24 bridge.
Progressive damage test to Z24 bridge. 53
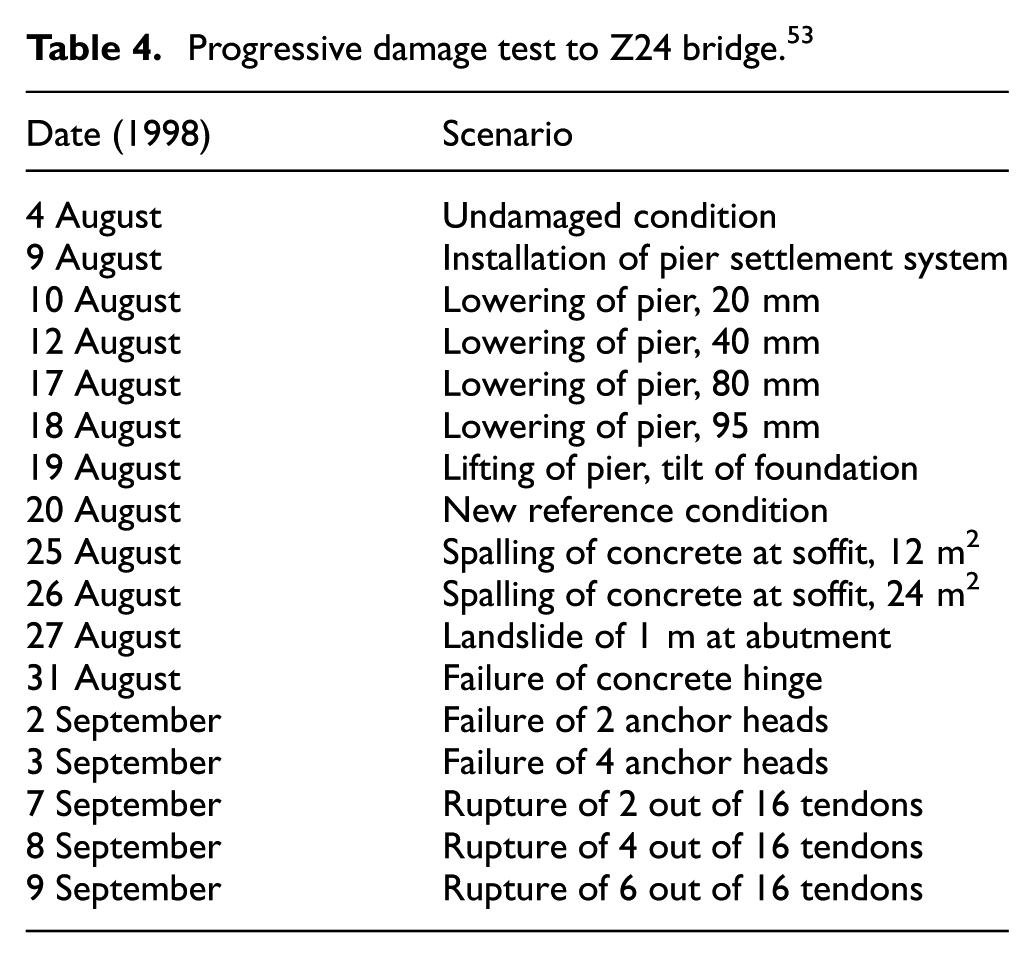
The bridge’s responses under the ambient excitations were recorded, and the stochastic subspace identification method 54 was used to extract the modal parameters. A total of 5624 sets of the first four frequencies were obtained during the entire 304 monitoring days. The variations of the first four frequencies and the temperature of the bridge over time are plotted in Figure 9. The blue data represent the healthy condition, where the purple ones correspond to the damaged state. The first damage was artificially introduced around day 266, corresponding to data No. 4789. The relation between the air temperature and natural frequencies is also plotted in Figure 10, which reflects that the natural frequencies have a bilinear (piecewise linear) relation with the temperature. The bilinear effect is attributed to the asphalt layer on the bridge’s surface, which froze on cold days (lower than 0°C) and significantly increased the stiffness of the structure. 55 This well-documented bilinear effect, physically attributed to the asphalt layer freezing, provides a critical test for any damage detection model. A model that cannot capture this nonlinear physical phenomenon is likely to fail to detect the damage. The proposed method’s ability to model this specific nonlinearity will be demonstrated in the following sections.
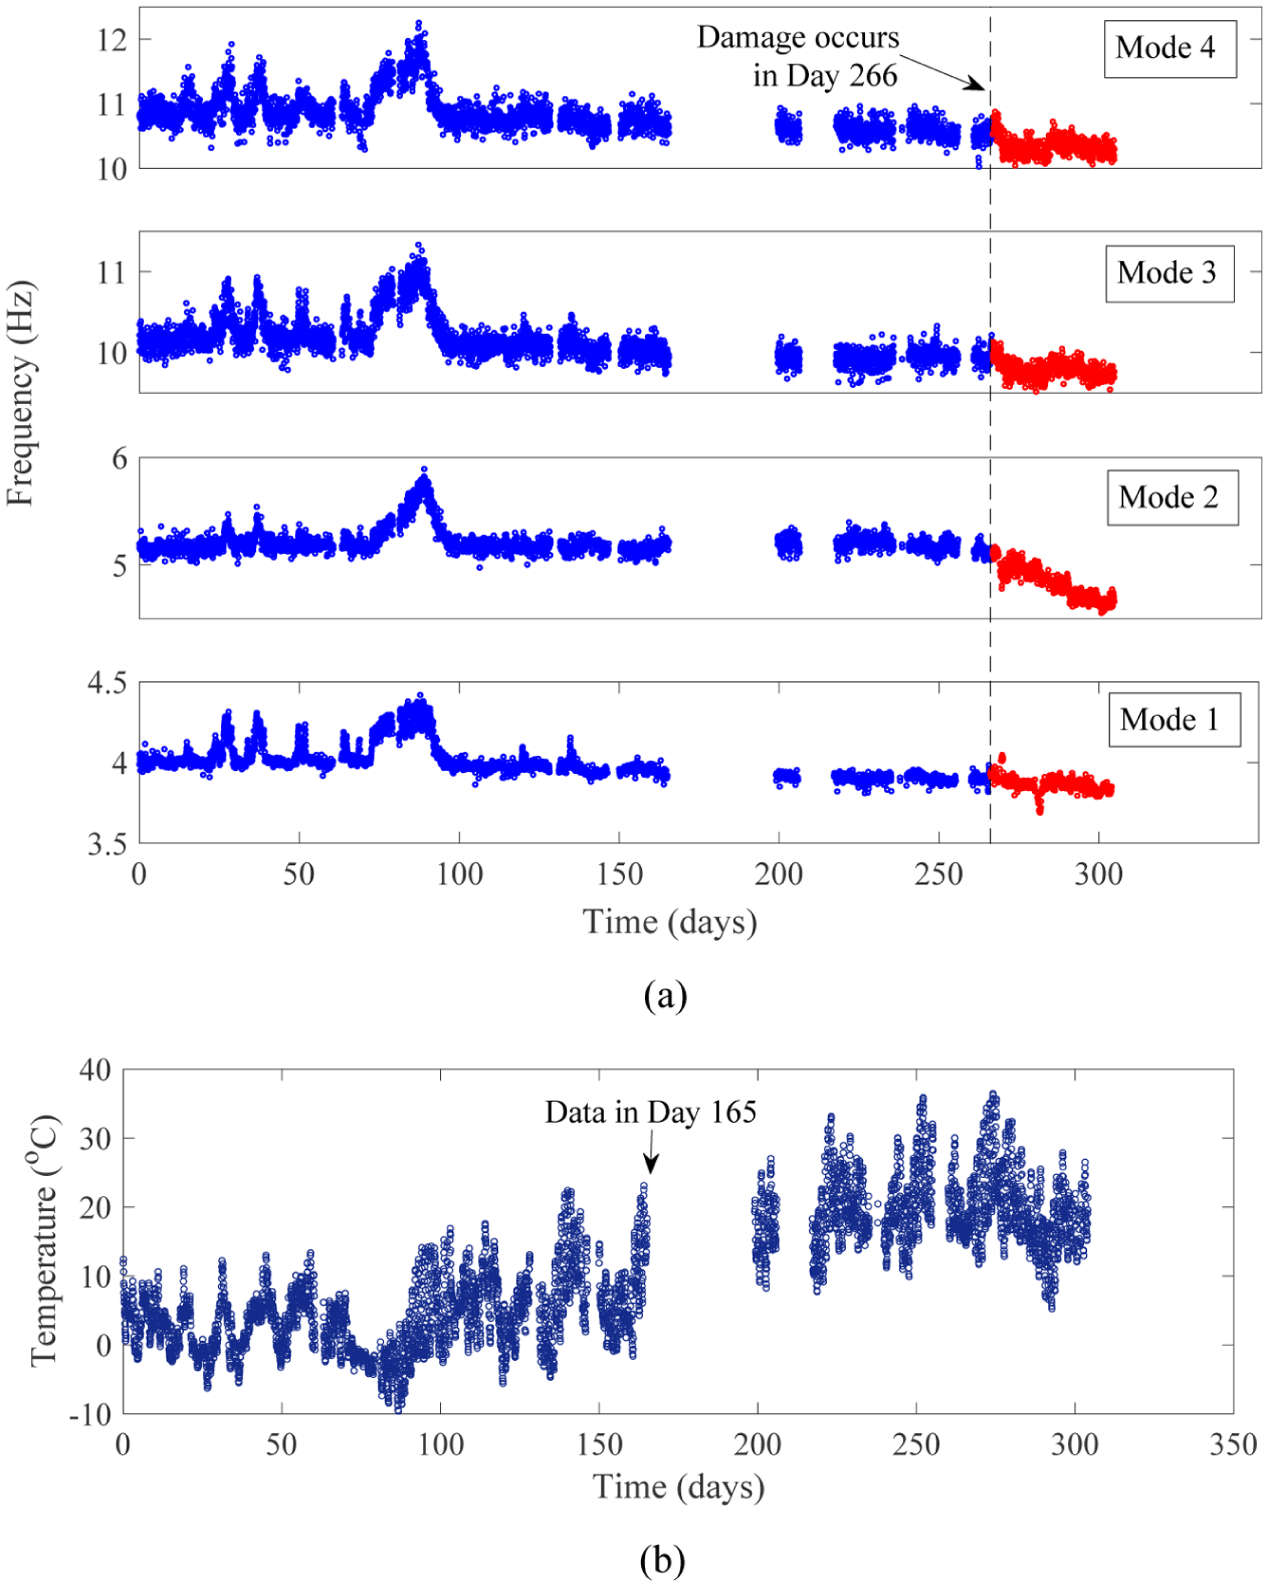
Frequency and temperature variations over time. (a) Variation of frequencies and (b) Variation of the air temperature.
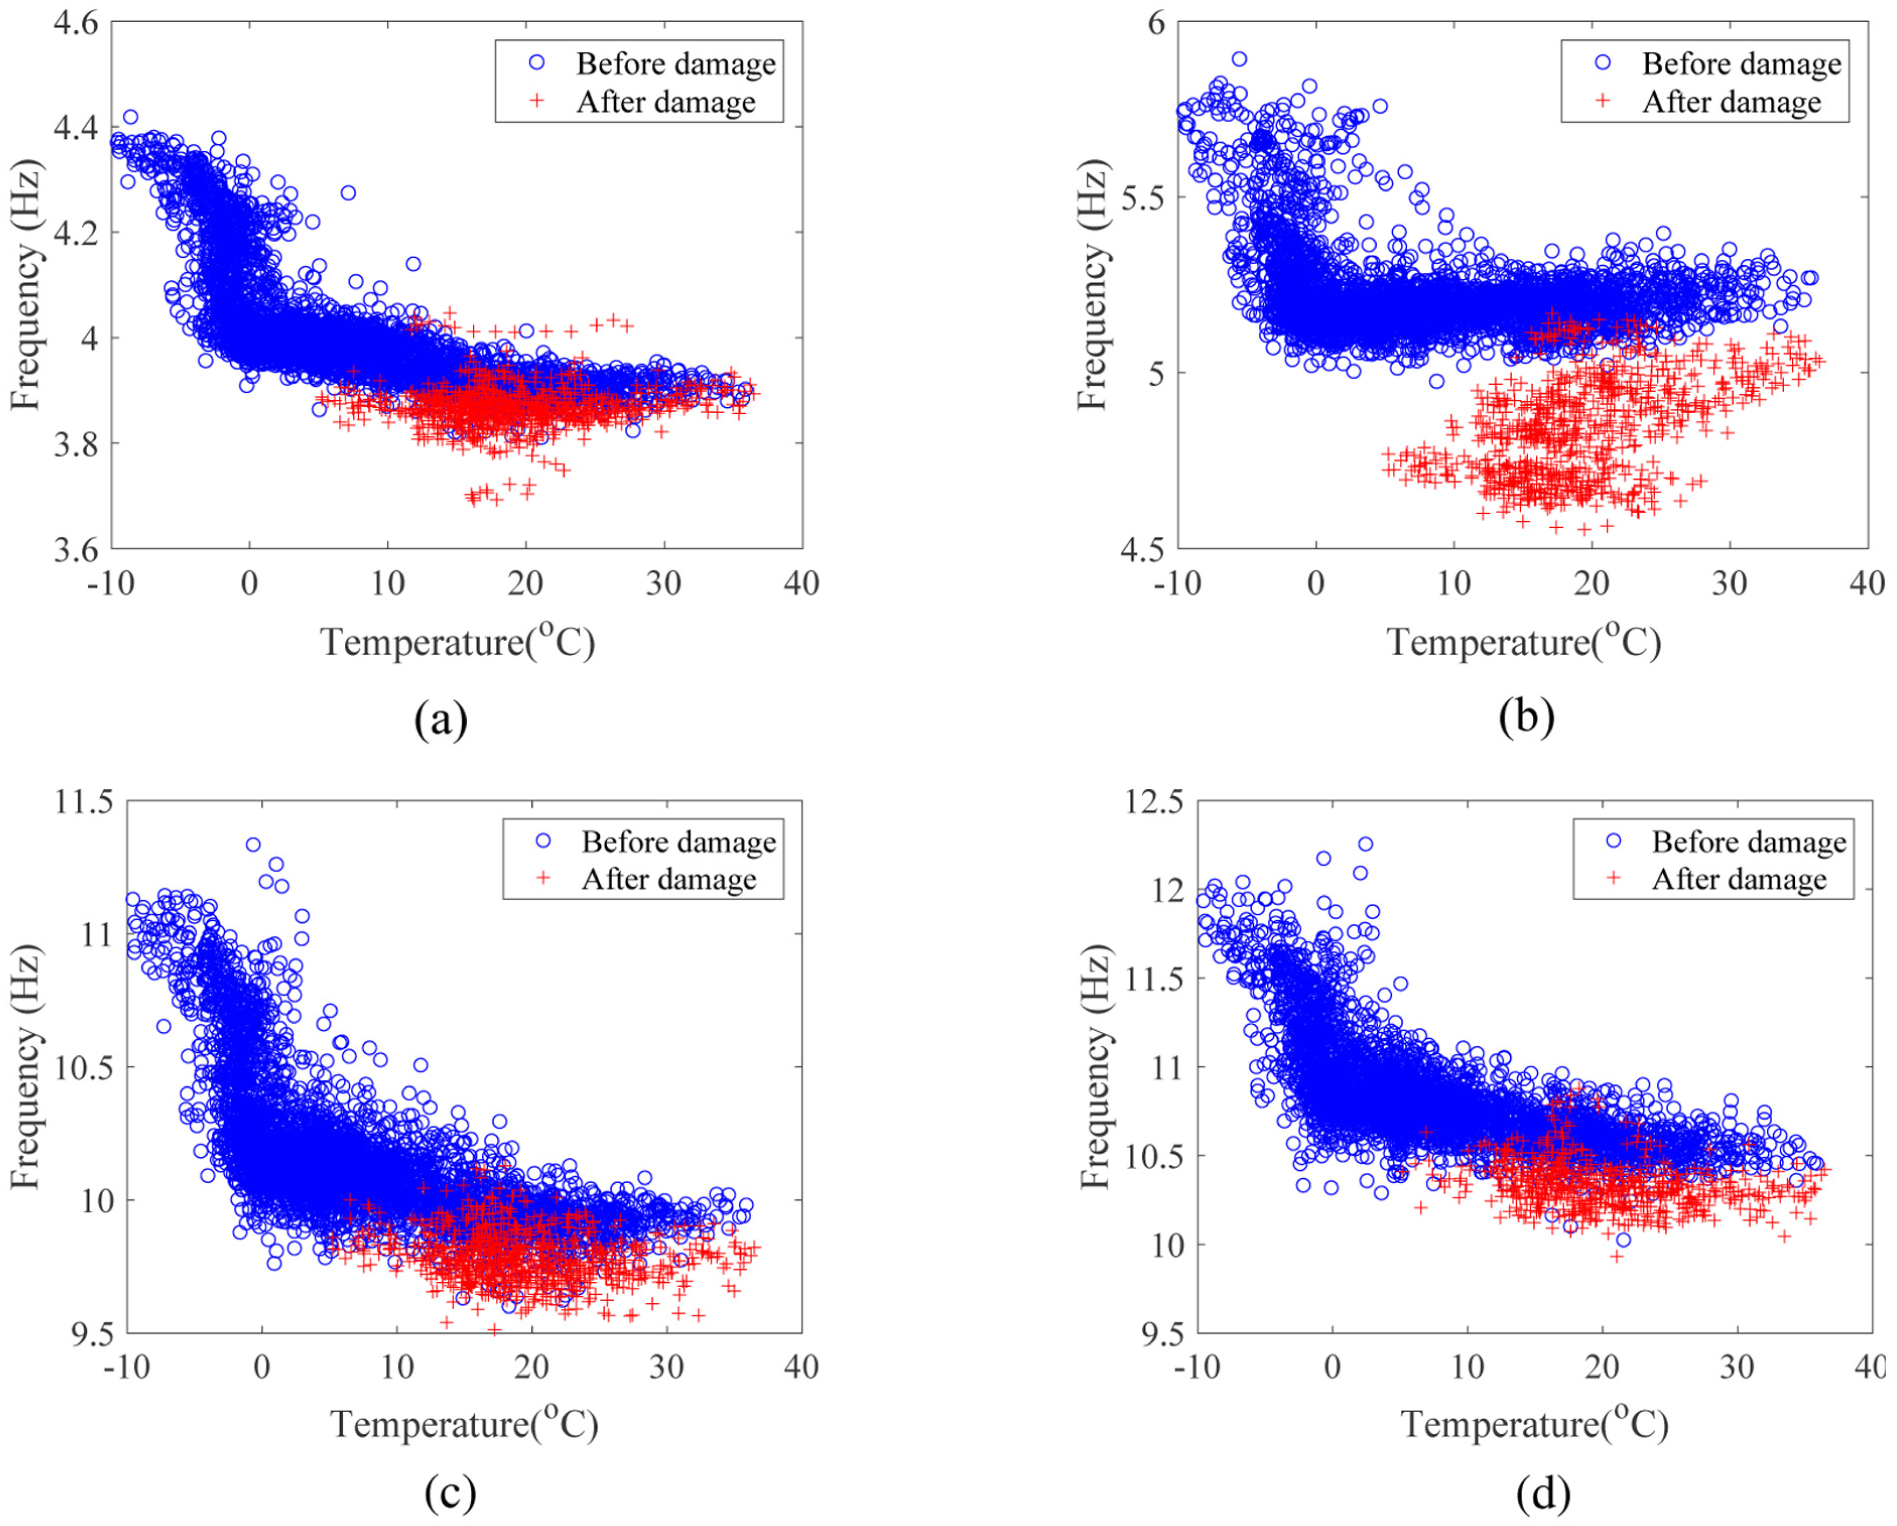
The relation between the frequency and temperature. (a) Second frequency with temperature and (b) Fourth frequency with temperature.
In this case study, the frequency data in the healthy state are divided into training and calibration sets for domain adaptation in Equations (13) and (14). As shown in Figure 9(b), temperatures recorded between days 166 and 265 exceed the range of the initial 165-day period. Consequently, data from the first 165 days are used for source training dataset
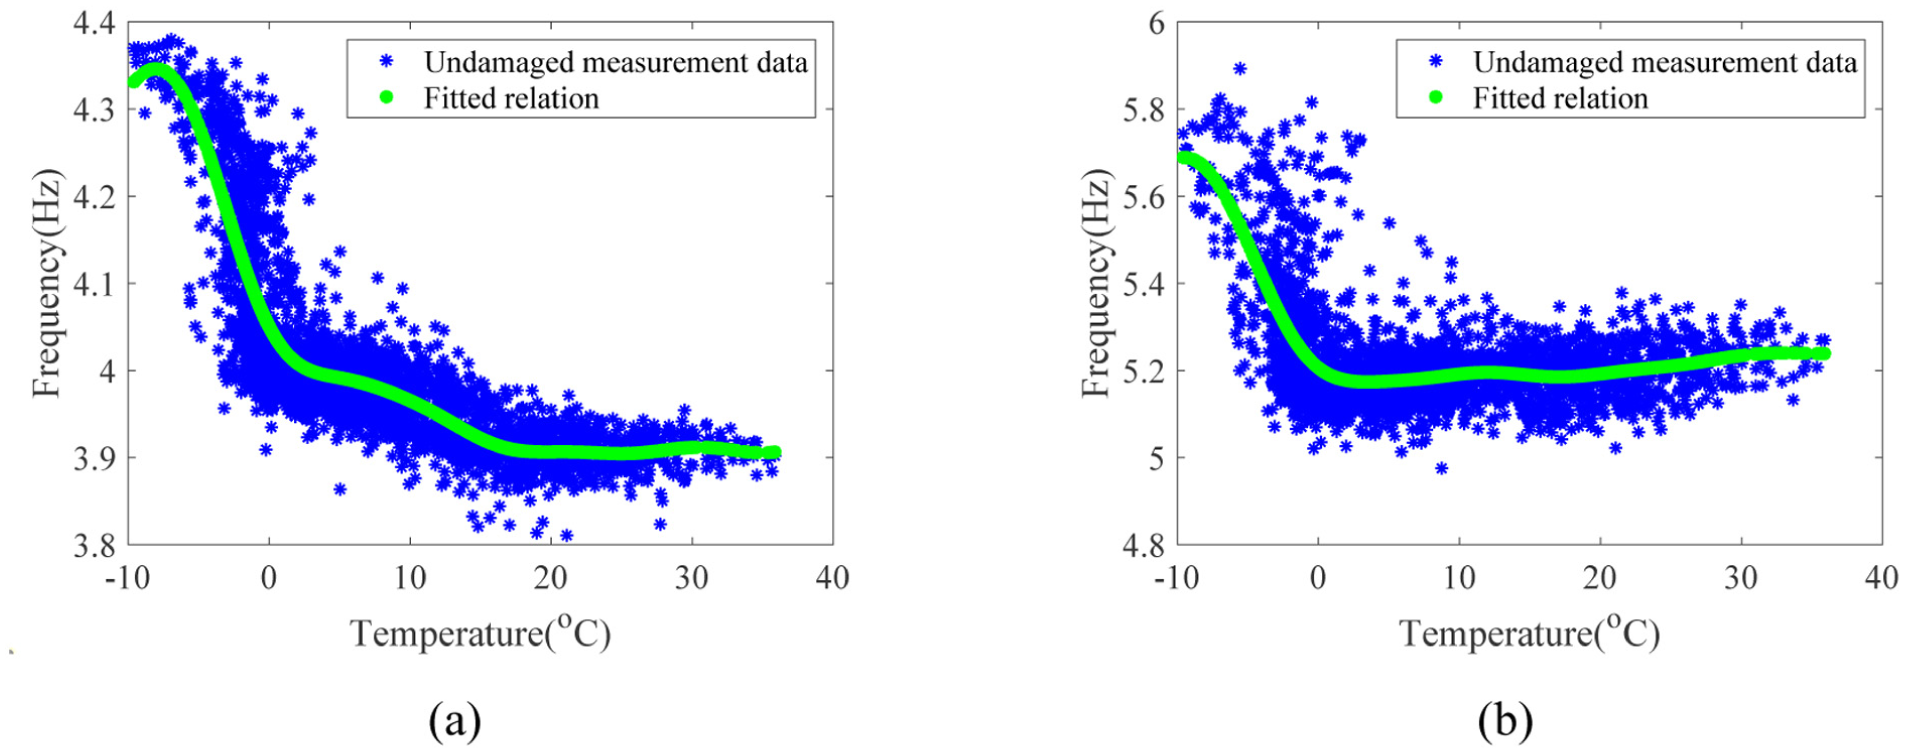
The fitted relation between the frequency and air temperature in the healthy state. (a) First frequency and (b) Second frequency.
NASA temperature data and bridge frequency projections
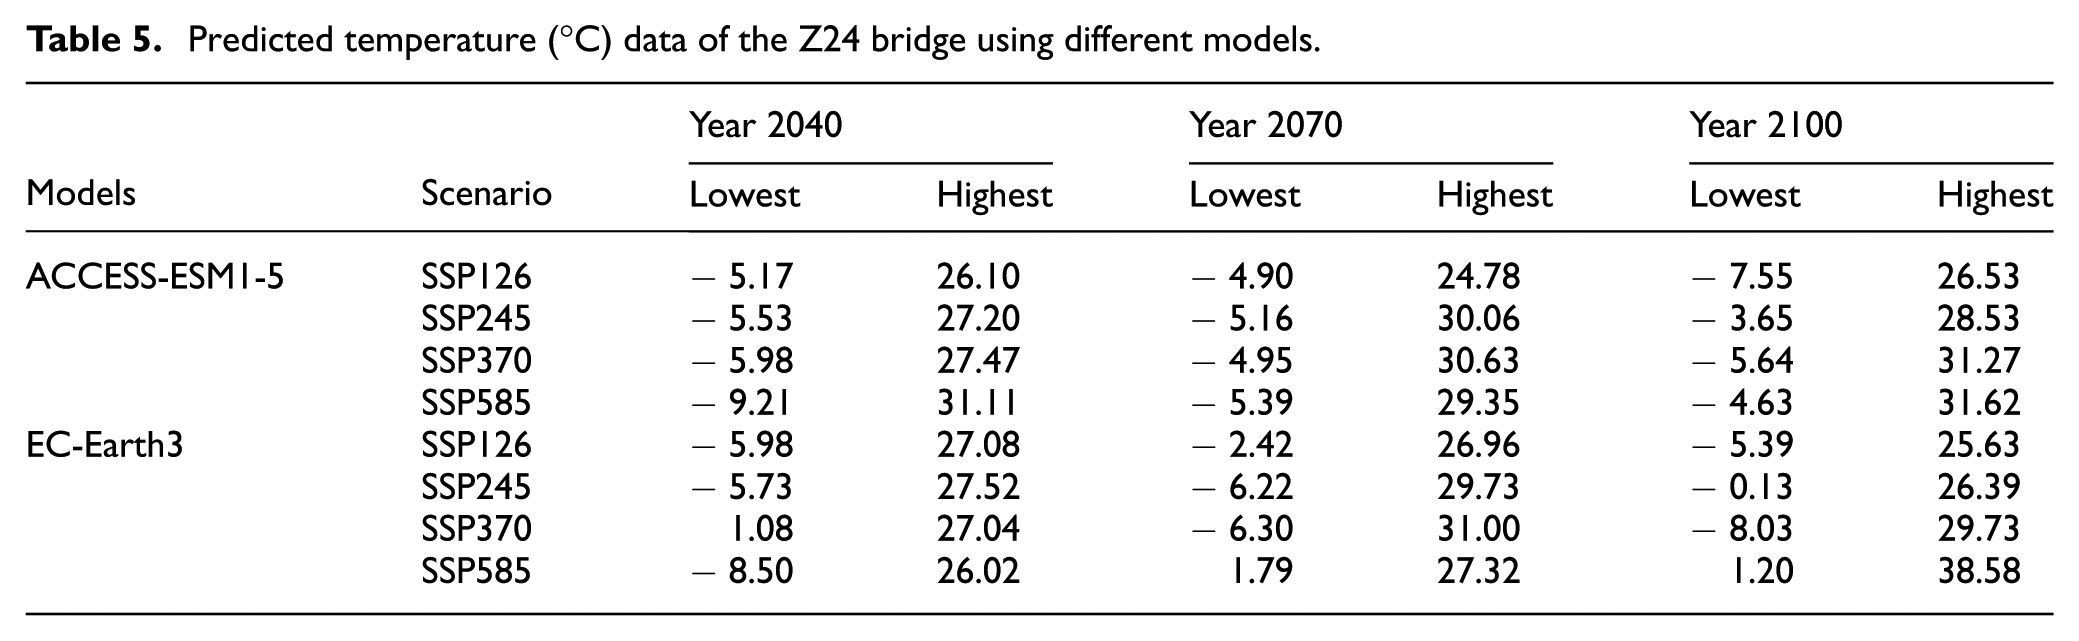
The Z24 bridge connects Koppigen (47.1340° N, 7.6002° E) and Utzenstorf (47.1277° N, 7.5596° E). The nearest NEX-GDDP-CMIP6 downscaling point is located at 47.1250° N, 7.6250° E. The daily near-surface air temperature data of the point are downloaded from 35 different global climate models. Table 5 presents the predicted and downscaled near-surface temperatures of the bridge from the ACCESS-ESM1-5 and EC-Earth3 models. Figure 12 further illustrates the specific temperature variations in certain years, highlighting the differences in temperature trends under different scenarios. The temperature projections under the SSP 585 scenario exhibit a more pronounced increasing trend compared to those under SSP 126.
Predicted temperature (°C) data of the Z24 bridge using different models.
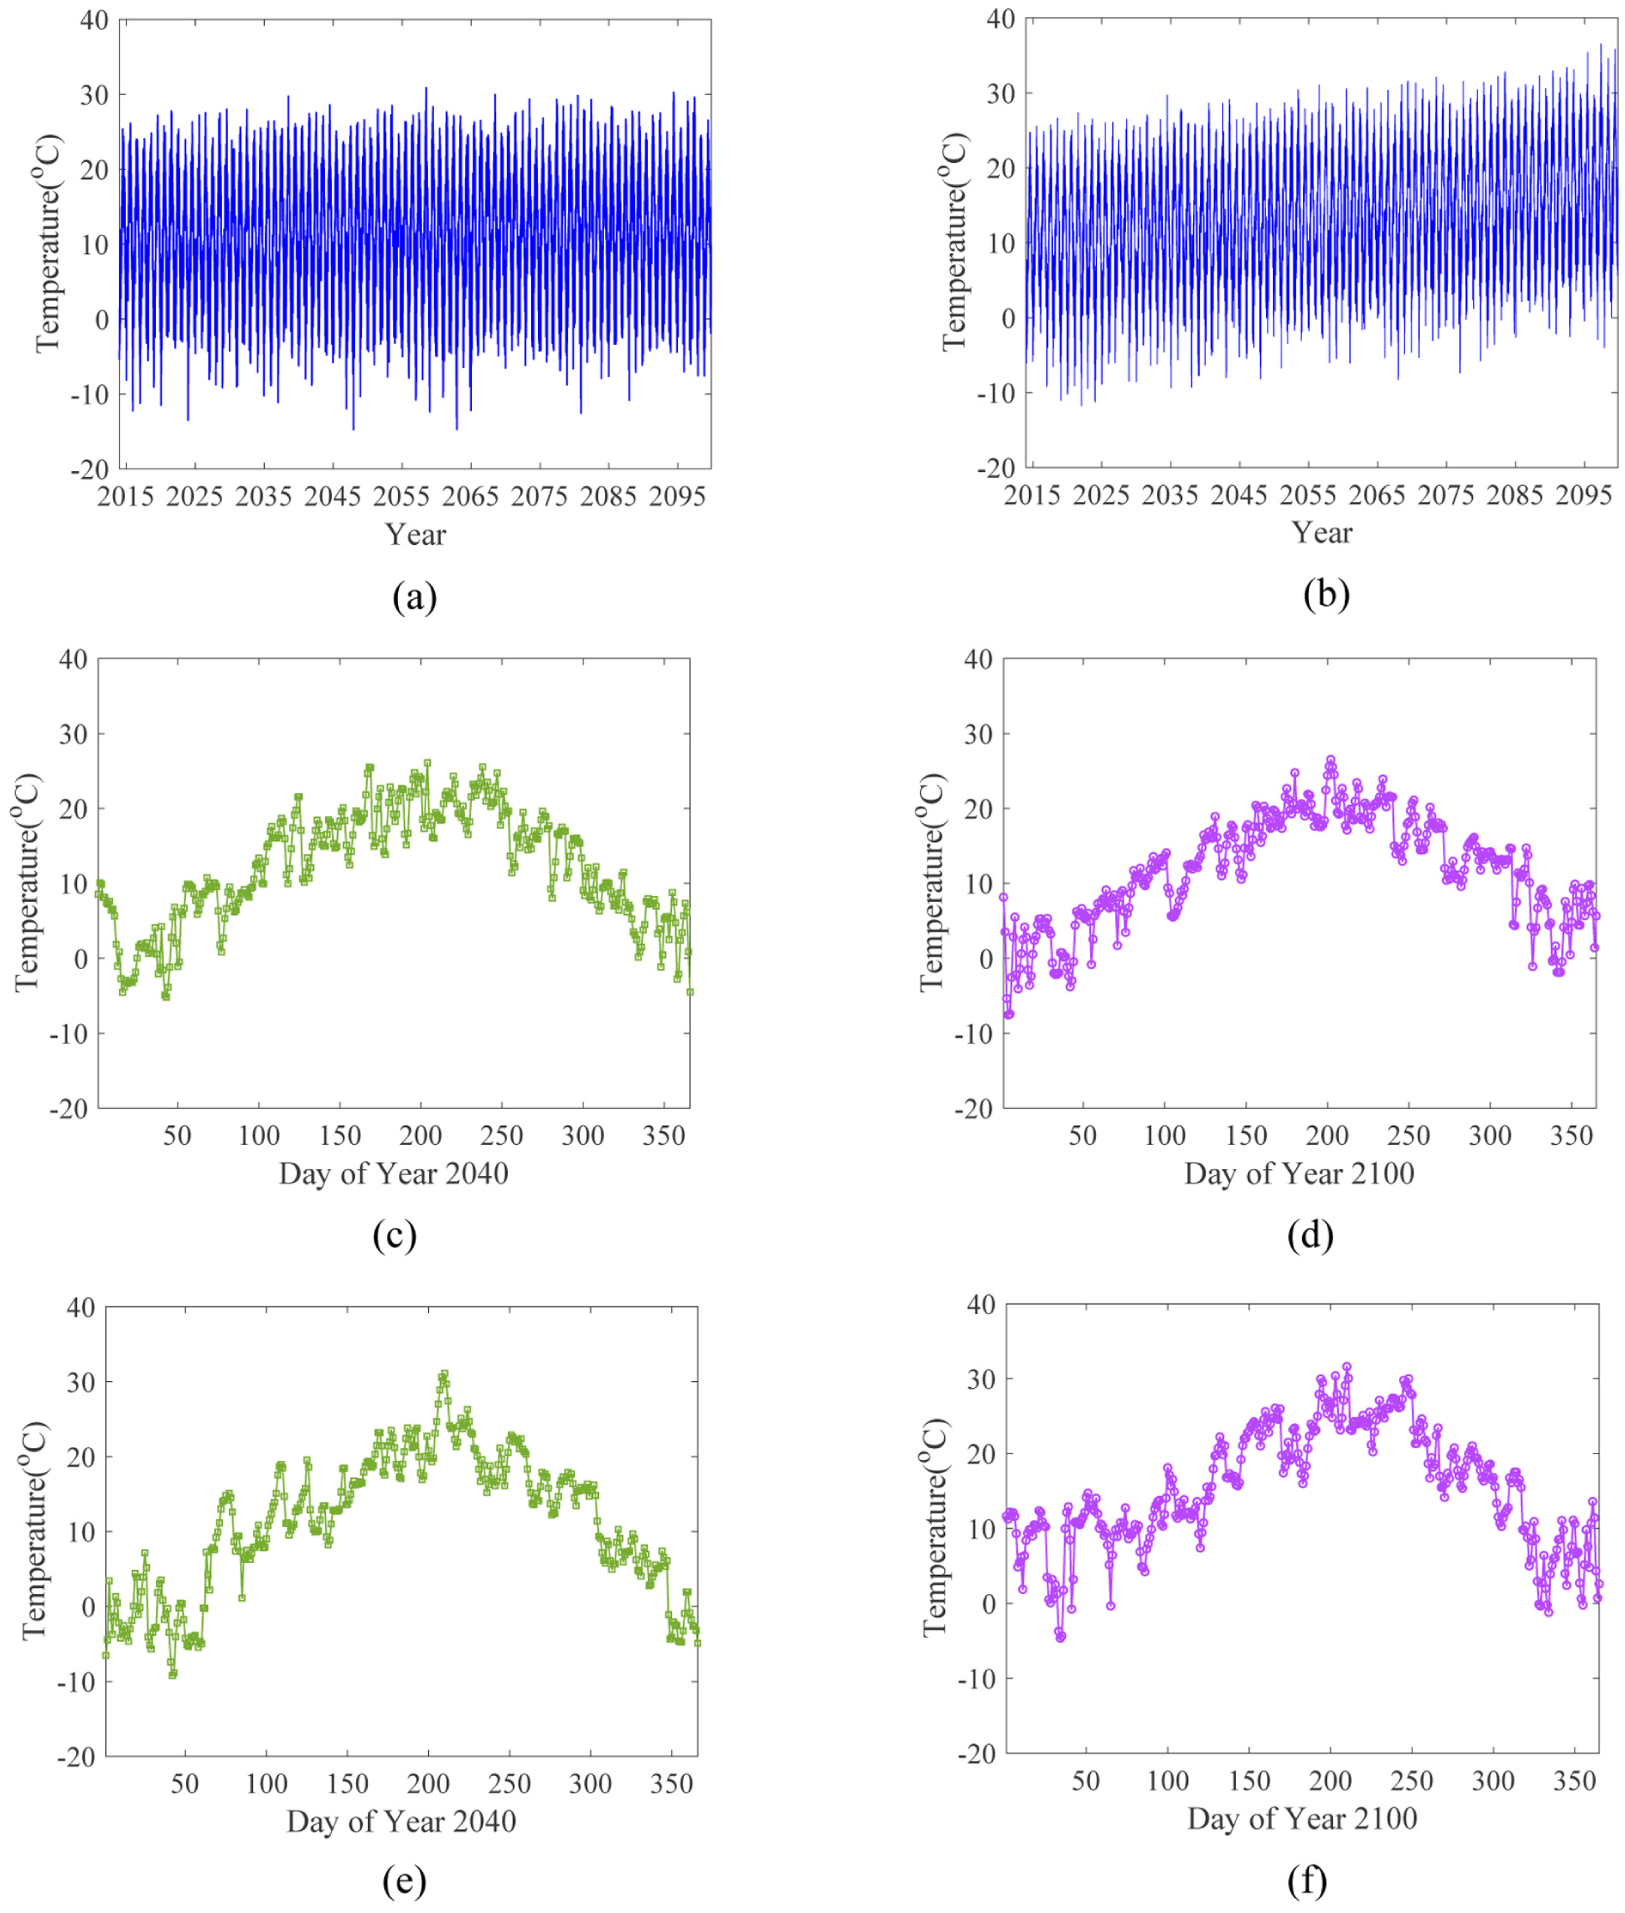
Downscaled temperature data from ACCESS-ESM1-5 model. (a) Downscaled temperature of SSP126, (b) Downscaled temperature of SSP585, (c) Year 2040 of SSP126, (d) Year 2100 of SSP126, (e) Year 2040 of SSP585, and (f) Year 2100 of SSP585.
The temperature dataset is then used to project future observations of natural frequencies of Z24 bridge, based on the fitted relationship between temperature and frequencies. The quantile mapping bias correction method mentioned in Case study 1 is employed to correct the bias of datasets. Figure 13 illustrates the predicted second frequency of the bridge under SSP 126 and SSP 585, based on the ACCESS-ESM1-5 climate model. Compared with Figure 10, the predicted frequencies do not obviously exceed the established range of the training data, because the upper frequency limit was established by training data under temperature below 0°C, whereas the climate change leads to warmer test data and yields lower frequencies. Nevertheless, the test data exhibit the distributional shift (e.g., mean shift) that clusters around new warmer conditions. Notably, the sudden spikes in the predicted frequencies shown in Figure 13(c)–(f), particularly prominent during the winter months (the beginning and end of the 1-year period), correspond to days when the temperature drops below 0°C. This reflects the physical bilinear effect caused by the freezing of the asphalt layer, significantly increasing the structural stiffness.
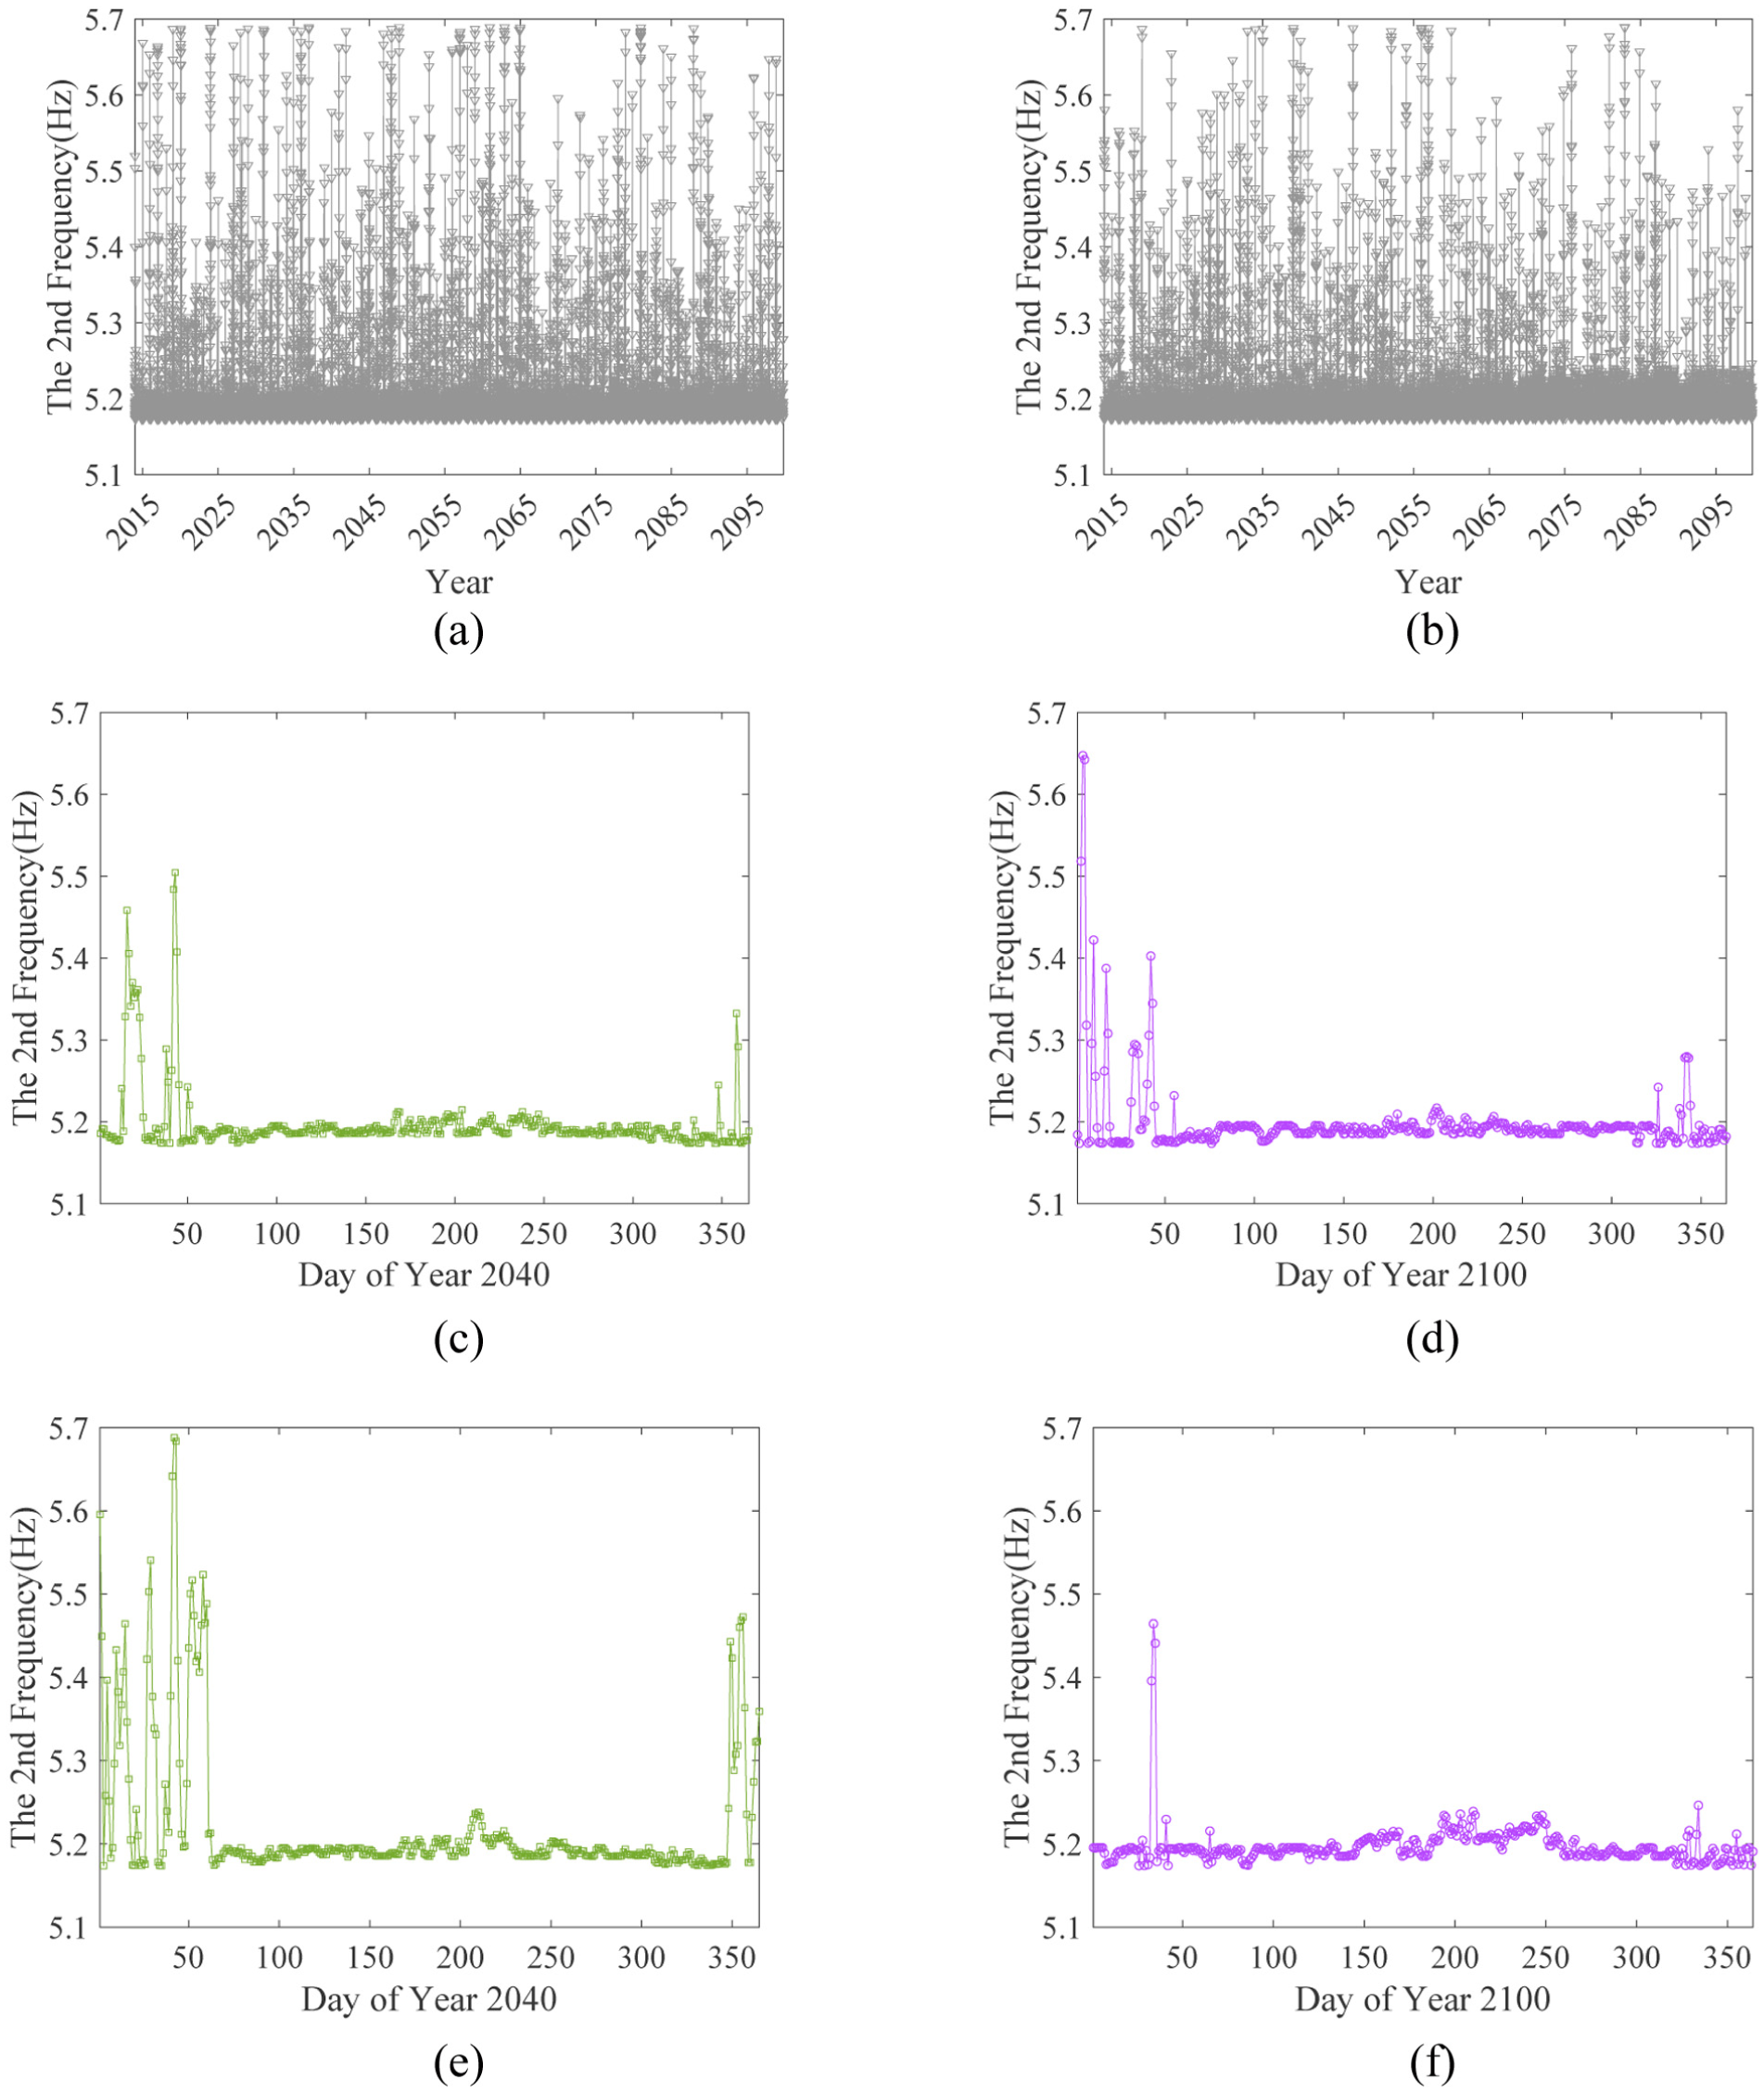
Predicted bridge frequency (test data) using ACCESS-ESM1-5 model. (a) Frequencies prediction of SSP126, (b) Frequencies prediction of SSP585, (c) Year 2040 of SSP126, (d) Year 2100 of SSP126, (e) Year 2040 of SSP585, and (f) Year 2100 of SSP585.
Long-term bridge damage detection
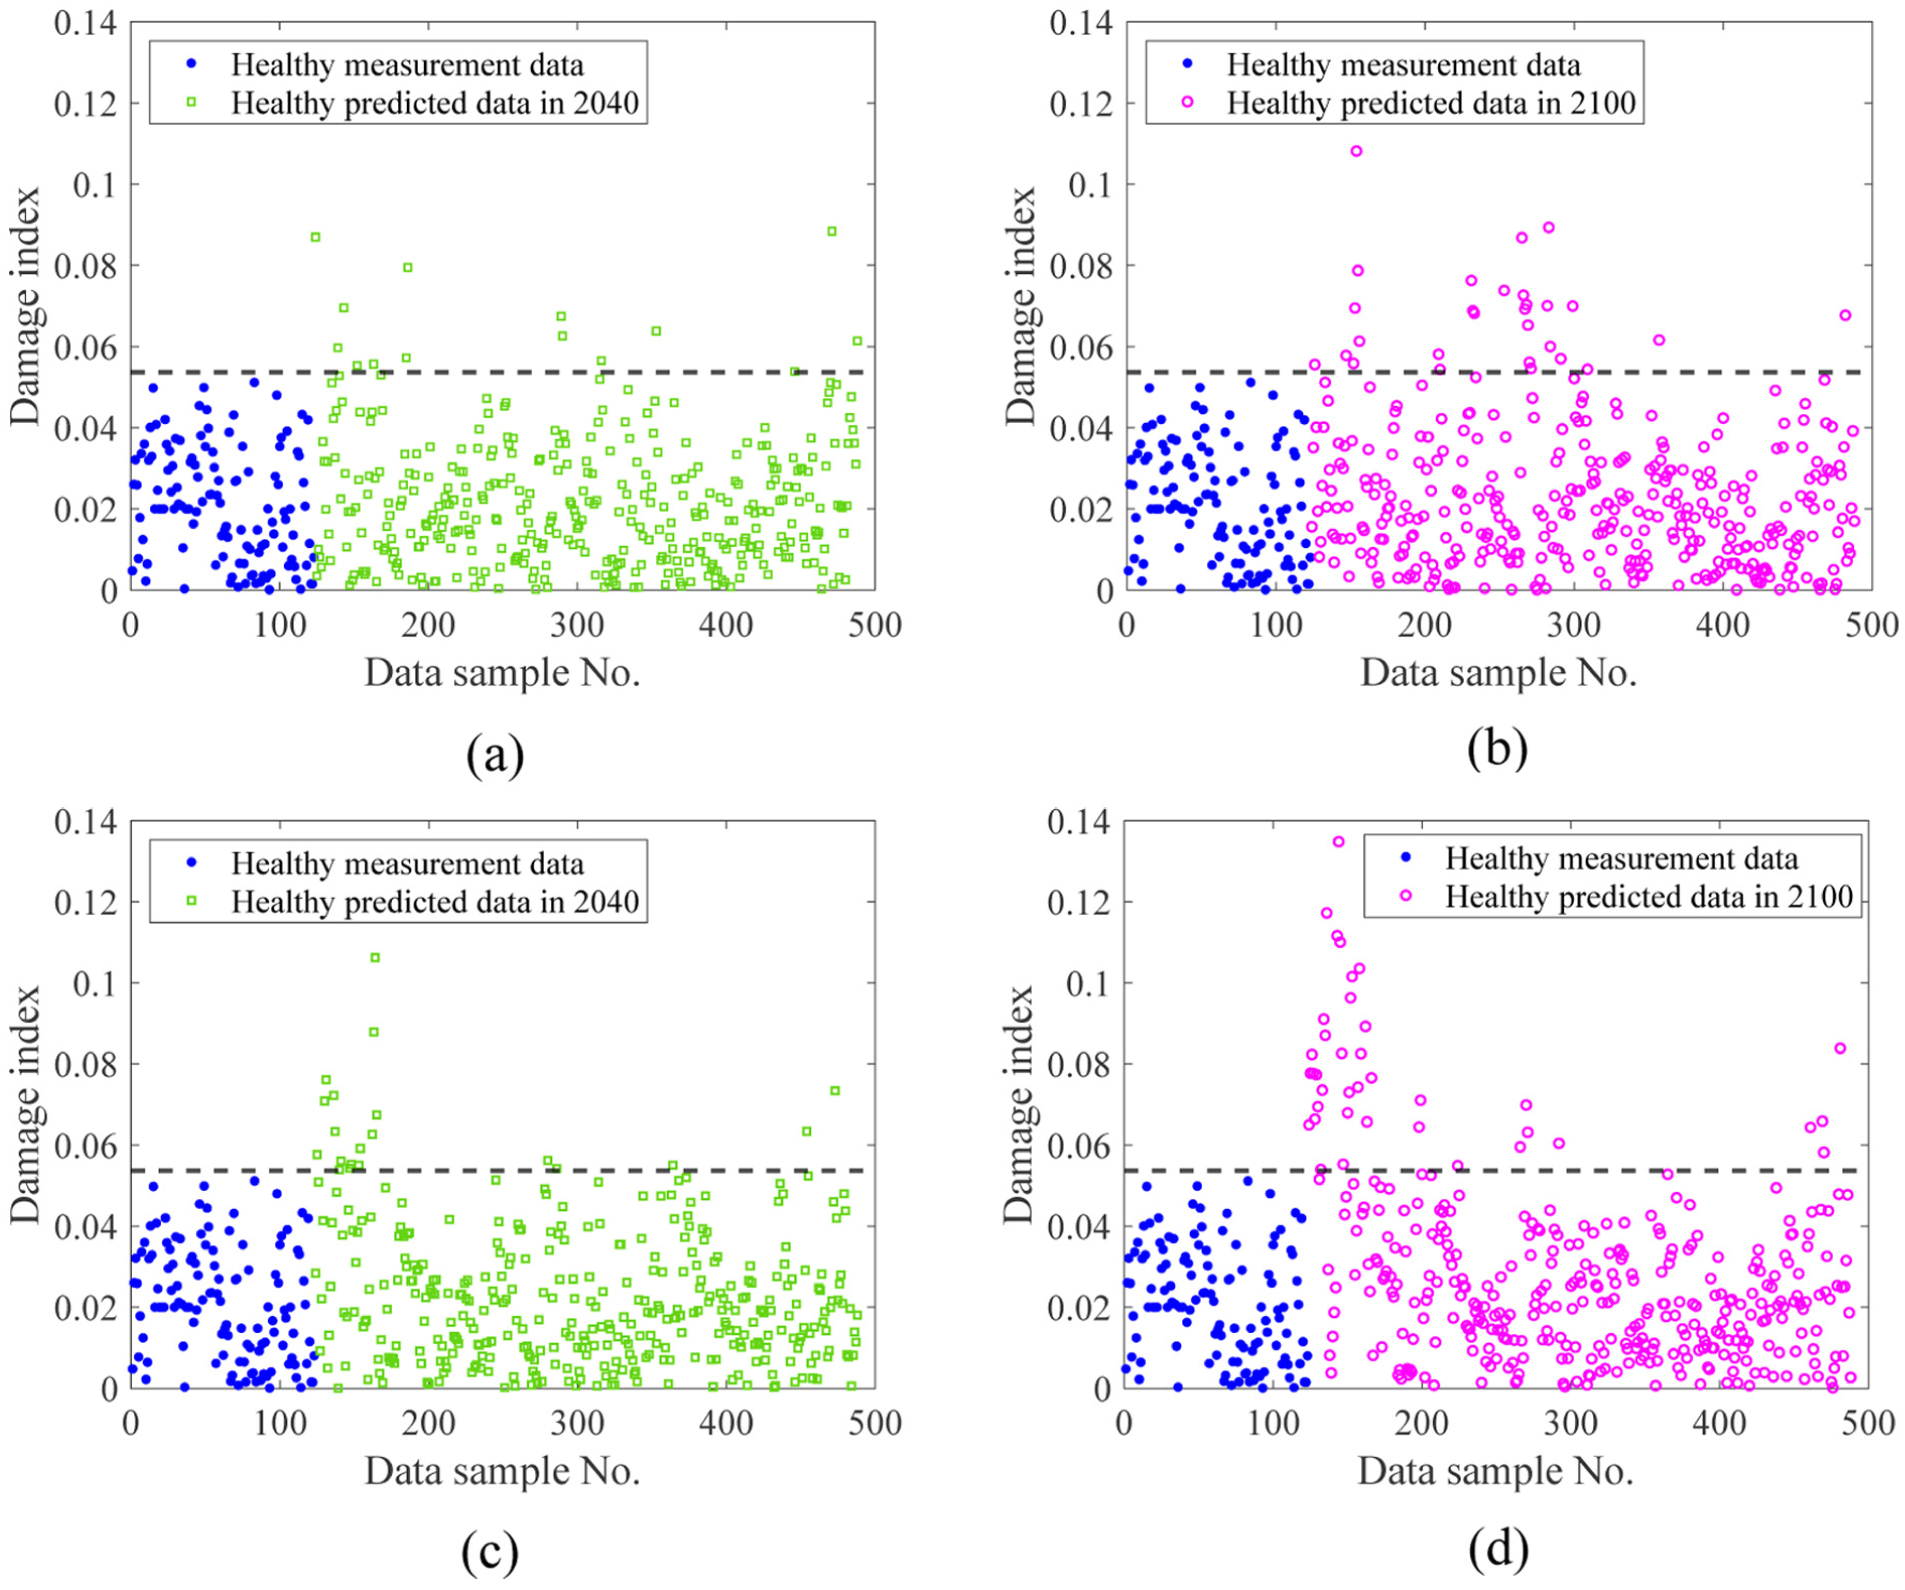
All SHM data under the healthy condition, specifically the first 4788 data points, are used as the training data. The RBF kernel in Equation (7) is employed, and the initialized kernel parameters remain the same as Case study 1. The active set d in the IVM algorithm is set to
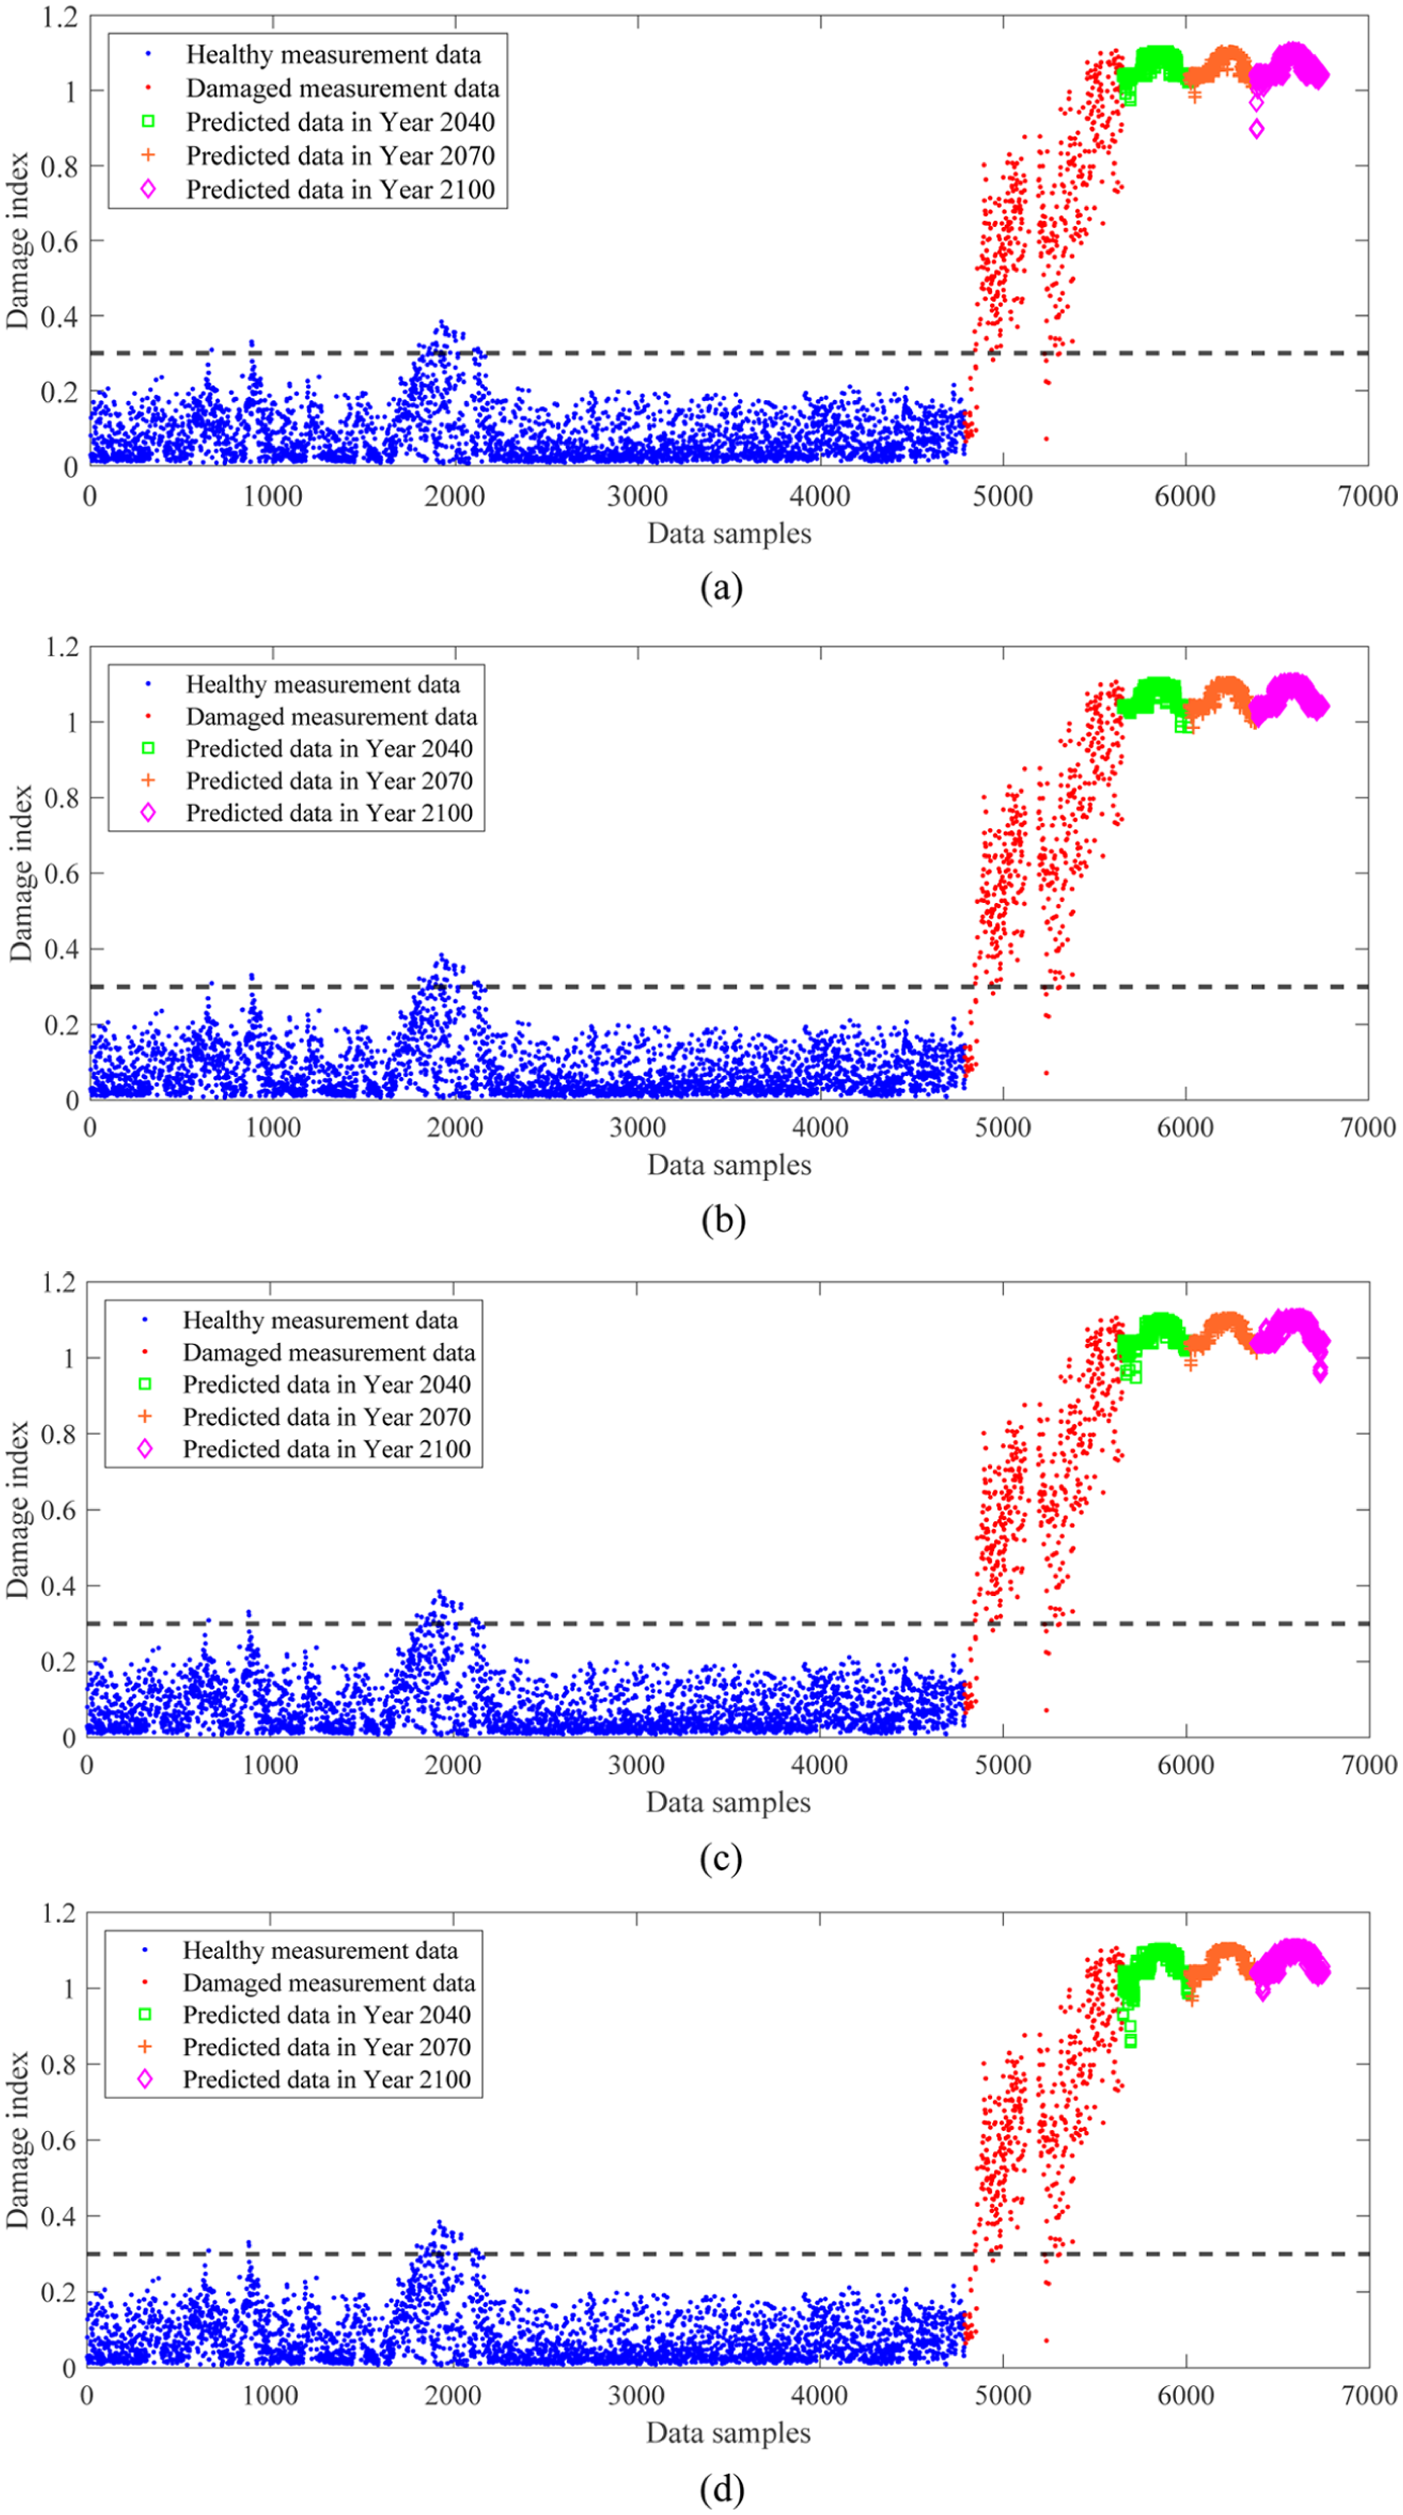
Reconstruction error of ACCESS-ESM1-5 model using the proposed method. (a) SSP126, (b) SSP245, (c) SSP370, and (d) SSP585.
As illustrated in Figure 14, the damage index in the damaged state (i.e., red dots) can be clearly distinguished from that in the healthy state, even for the slight damage at the initial stage. As damage progresses across more locations, the damage index rises and significantly surpasses the threshold. The magnitude of the damage index also indicates the severity of the damage. Regarding data under future climate conditions, the damaged state is accurately classified as such and can be distinctly separated from the healthy state. This example underscores the robustness and reliability of the developed method in identifying structural damage at early stages with latent nonlinear relationships. The efficiency and effectiveness of the developed method in addressing damage detection under environmental nonlinear impacts and climate change is also demonstrated.
The comparison study
For comparison, the classical linear factor analysis method is also applied. As illustrated in Figure 15, linear factor analysis fails to clearly separate most damaged states from the healthy condition. This leads to dangerous false-negative detections, particularly during the early stages of progressive damage 53 or under climate-induced distribution shifts, allowing structural issues to worsen undetected. In contrast, the method developed in this study effectively addresses this challenge and clearly identifies the damaged condition in Figure 14. The developed method is capable of accurately detecting even minor damage, reducing the risk of false negatives.
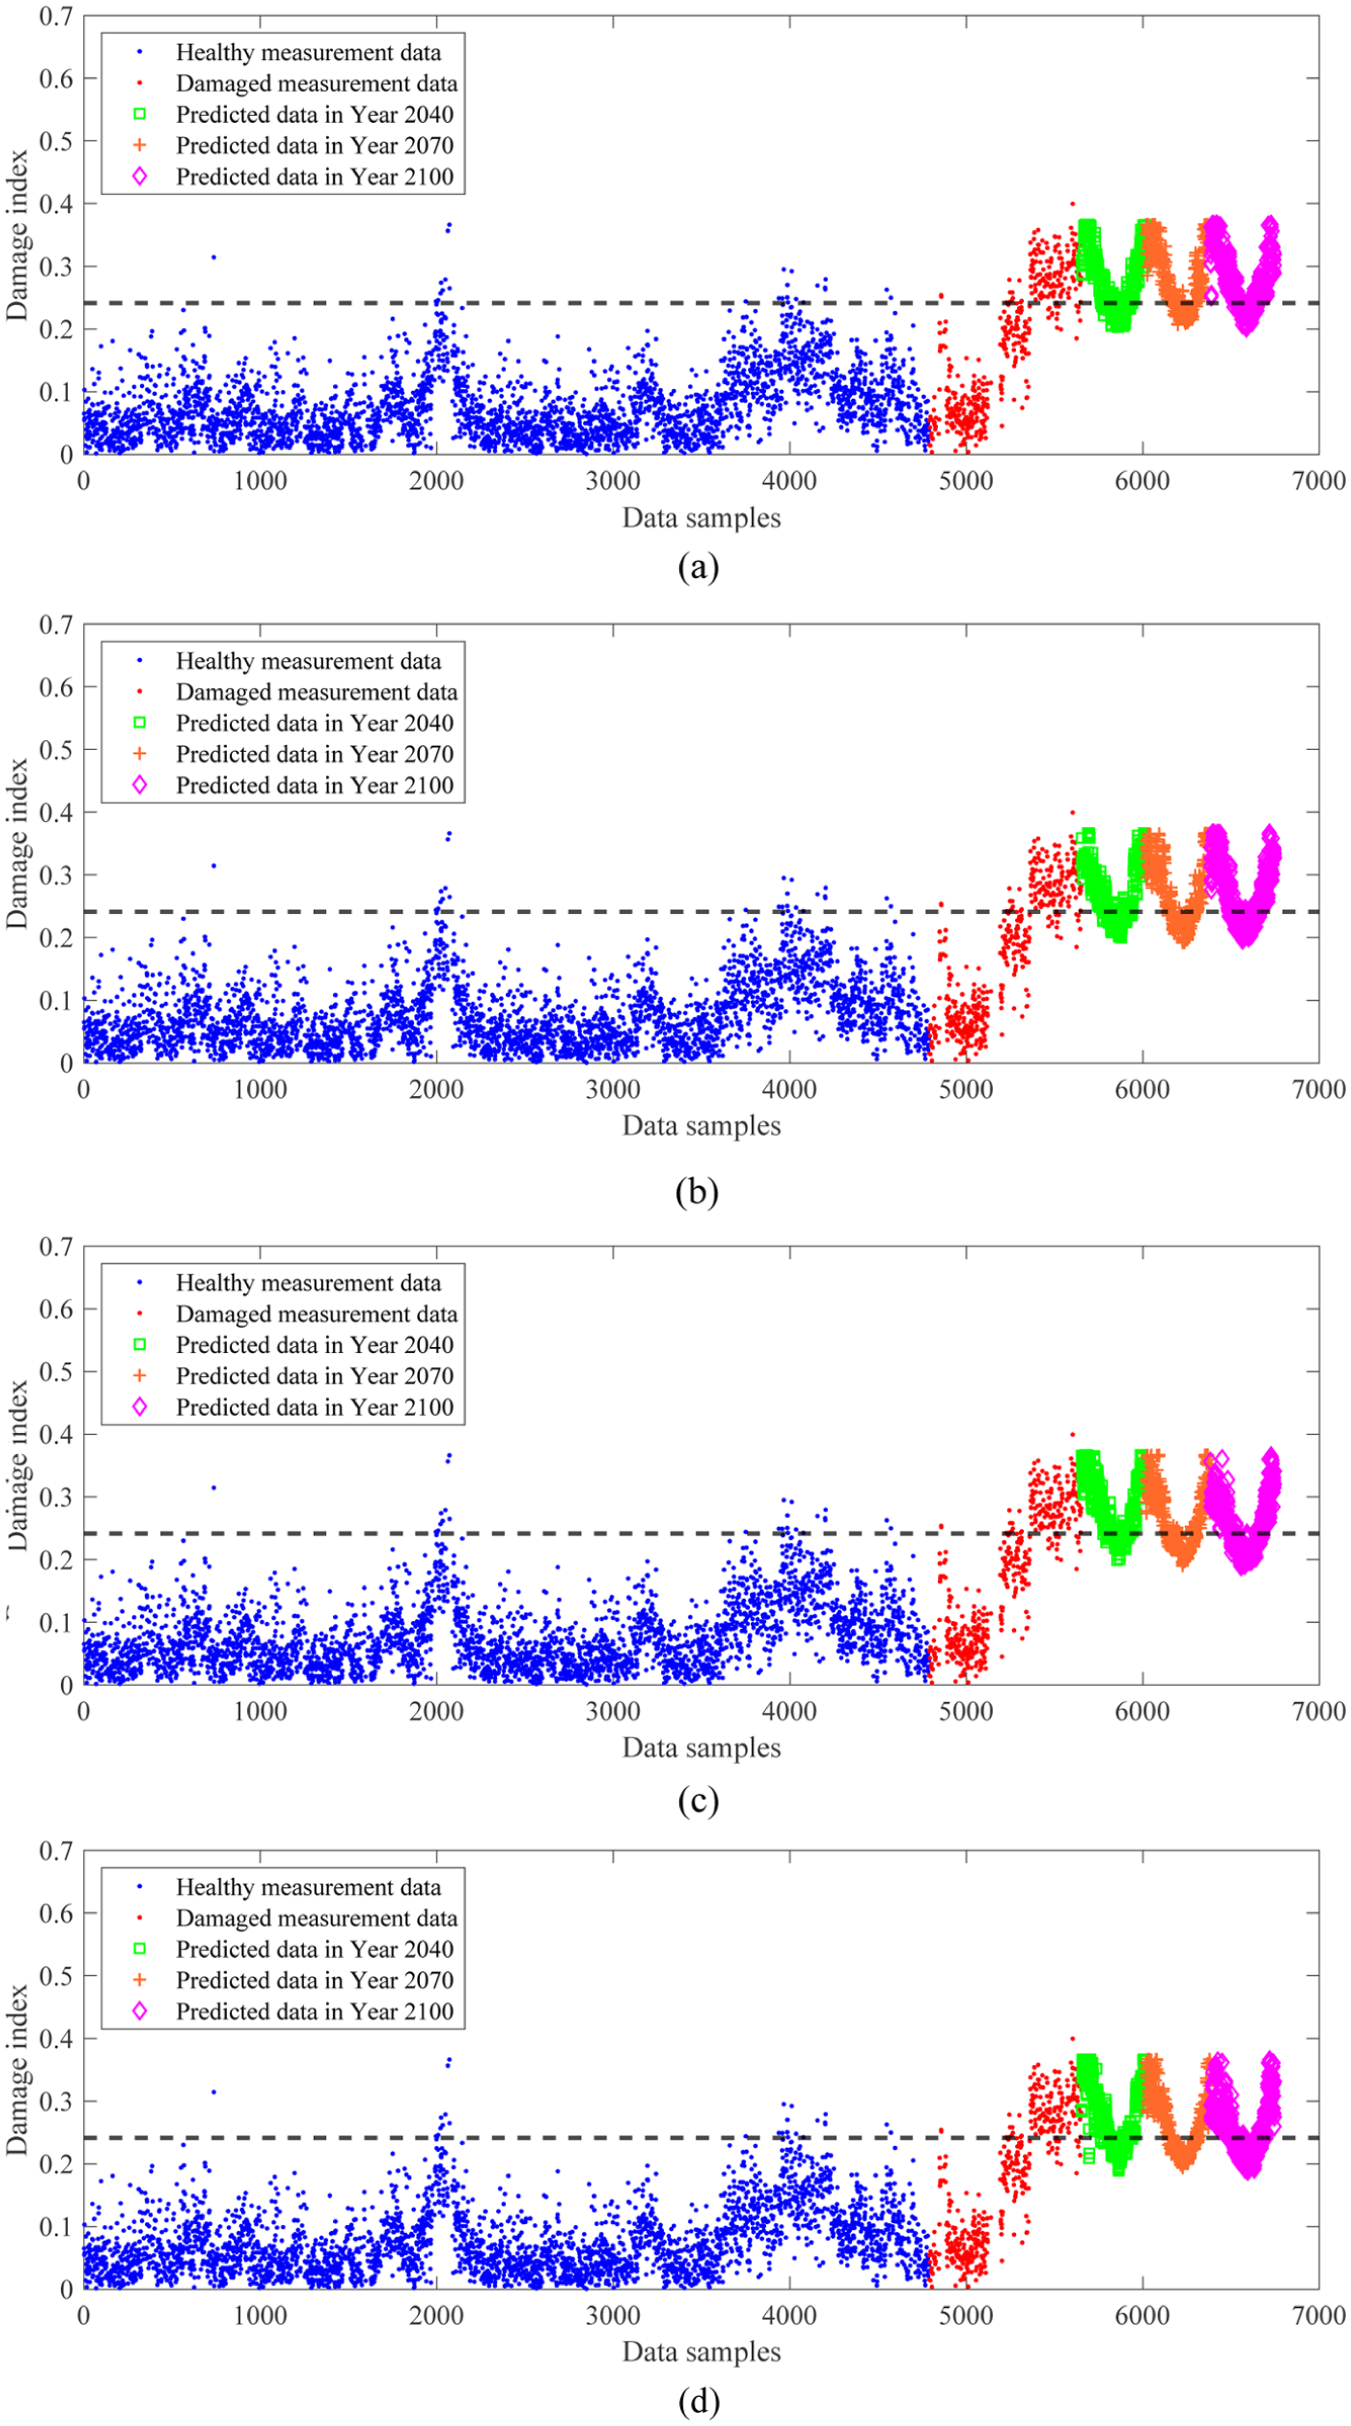
Reconstruction error of ACCESS-ESM1-5 model using the linear factor analysis. (a) SSP126, (b) SSP245, (c) SSP370, and (d) SSP585.
Conclusions
This study develops a novel domain-adaptive nonlinear probabilistic latent variable framework for long-term damage detection, specifically designed to address distribution shifts caused by climate change. By optimizing existing ML models to handle out-of-distribution problems, the research significantly enhances the robustness and accuracy of damage detection results. The introduction of a nonlinear latent variable model, combined with the Bayesian technique and kernel trick, allows for the modeling of complex physical relationships, such as the nonlinear temperature effects observed in the Z24 bridge. By building upon a transparent mathematical framework rather than a black-box approach, the model successfully distinguishes damage from these intricate environmental patterns. Furthermore, the feature augmentation method employed in this study expands the feature space rather than forcing a complex distribution projection. Hence, the model avoids the sensitivity to initial parameters often associated with traditional transfer learning, ensuring consistent performance across different scenarios. The model’s ability to operate without explicit environmental data further extends its utility to scenarios where sensor coverage is limited. The underlying principle that separating statistical environmental anomalies from structural changes is applicable to a wide range of civil infrastructure subject to thermal expansion and climate variability.
The approach has been tested on two case studies under various climate change projections. In the RC slab example, where test data exceeded the training temperature range (e.g., SSP585), the traditional linear factor analysis resulted in a high false-positive detection rate, with damage indices consistently exceeding the threshold. In contrast, the proposed method effectively eliminated these false positives, maintaining the damage index of healthy condition entirely within the 99% confidence threshold. In the Z24 bridge case study involving latent nonlinearities, the linear baseline suffered from significant false-negative detections that masked damage signals. The proposed framework achieved a clear separation between healthy and damaged states, successfully identifying damage scenarios even under extreme climate projections. The advancement of this method represents a significant contribution to the field of SHM, offering a robust damage detection approach to address the evolving challenges posed by climate change.
Nevertheless, climate change in this study is treated primarily as a driver of long-term distribution shift (i.e., covariate shift) rather than through a coupled physical deterioration model. It is important to acknowledge that while the latent variables provide a statistical convenience for capturing environmental variability, they represent abstract statistical dimensions and do not strictly correspond to isolated physical parameters. The proposed framework focuses on mitigating the statistical divergence caused by evolving environmental conditions to prevent false-positive and false-negative damage detection, rather than explicitly modeling material degradation phenomena such as creep, shrinkage, or corrosion. While the current algorithm can flag deviations in the structure-environment correlation, whether caused by acute damage or gradual aging, the performance relies on the premise that solving the distribution shift is a prerequisite for robust monitoring. Future research will aim to bridge this gap by integrating physics-based aging models into this domain-adaptive framework, thereby enhancing physical interpretability and enabling a more detailed classification that distinguishes between reversible environmental effects, gradual structural aging, and acute damage.
Footnotes
Acknowledgements
The authors are thankful for the KU Leuven structural mechanics section for providing the data of the Z24 bridge.
Funding
The authors disclosed receipt of the following financial support for the research, authorship, and/or publication of this article: The research in this paper was supported by the RGC-GRF (Project No. 15217522) and RGC-CRF (Project Number C5004-23GF).
Declaration of conflicting interests
The authors declared no potential conflicts of interest with respect to the research, authorship, and/or publication of this article.
Data availability statement
The climate data used in this study are obtained from publicly available open-access datasets (https://ds.nccs.nasa.gov/thredds/catalog/AMES/NEX/GDDP-CMIP6/catalog.html). This global high-resolution, downscaled climate dataset is extensively utilized in environmental science and infrastructure risk assessments to project regional climate change impacts. The SHM data of the reinforced concrete slab in Case Study 1 will be released (https://github.com/xiaoyou-wang/RC-Slab-Data) upon publication. This experimental dataset was originally reported to study the correlation between structural frequencies and environmental factors (temperature and humidity) under stationary conditions. The SHM data of Z24 bridge in Case Study 2 are open-access (![]() ) widely recognized third-party benchmark dataset extensively used in the SHM community. Notable prior usages include Peeters and De Roeck, who first documented the physical bilinear frequency-temperature relationship caused by asphalt freezing, and Maeck and De Roeck, who utilized the dataset for vibration-based damage assessment. Unlike these prior stationary or traditional assessments, this study uniquely utilized these datasets to validate a new domain-adaptive framework against future climate-induced covariate shifts.
) widely recognized third-party benchmark dataset extensively used in the SHM community. Notable prior usages include Peeters and De Roeck, who first documented the physical bilinear frequency-temperature relationship caused by asphalt freezing, and Maeck and De Roeck, who utilized the dataset for vibration-based damage assessment. Unlike these prior stationary or traditional assessments, this study uniquely utilized these datasets to validate a new domain-adaptive framework against future climate-induced covariate shifts.