




Abstract
We investigate the relationship between top management team compensation disparity and corporate social performance. We argue that pay structures with high disparity are reflective of transactional, individualistic organizations that foster a shareholder orientation. In contrast, pay structures with low disparity are indicative of relational, cooperative organizations that foster a stakeholder orientation. Examining the effect of these attributes on corporate social performance, we find that corporate social performance is higher in low pay disparity firms than in high pay disparity firms. We discuss our contributions to executive compensation and corporate social performance research and suggest directions for future research.
Keywords
Introduction
To what end do pay structures motivate executives? This is a fundamental question in the field of strategy, with which we as a field continue to wrestle (Devers et al., 2007). Complicating this question is that historically, the goal of firms has been primarily to maximize shareholder value (Sundaram and Inkpen, 2004). However, an ever-increasing number of firms see themselves as having a “multifiduciary duty to all stakeholders” (Bradley et al., 1999: 44) and thus seek to balance the interests of all stakeholders (Donaldson and Preston, 1995). These competing orientations are impacted by a number of organizational policies, of which executive pay structures are a critical component. In this work, we examine how the structure of executive pay disparity affects the treatment of stakeholders, as reflected in corporate social performance (CSP).
Prior work has investigated various aspects of the relationship between executive compensation and CSP but has focused almost exclusively on the chief executive officer (CEO) and has found mixed results (e.g. Deckop et al., 2006; McGuire et al., 2003). Perhaps one reason for these inconclusive findings is that these studies tend to approach this issue from the perspective of how using incentives to align the interests of the CEO with those of shareholders impacts other stakeholders. The emphasis on using pay to align CEOs with shareholders is incomplete because it fails to consider how some elements of pay can serve to align executives more closely with all their various stakeholders, not just shareholders. We address this shortcoming in the literature and explain that it is incumbent on the broader top management team (TMT), not just the CEO, to manage the interrelated and complex needs of stakeholders. Indeed, managing the interdependent (Rowley, 1997) and often conflicting (Frooman, 1999) needs of stakeholders is quite difficult (Sundaram and Inkpen, 2004: 354) and, as recent work finds, improves when the TMT works together to address the challenge (Wong et al., 2011). Accordingly, rather than looking at types of pay and pay levels of TMTs, we shift the focus to the distribution of pay within the TMT, to examine how vertical and horizontal pay disparity encourages a stakeholder orientation by executives that affects CSP.
We theorize that firms with executive pay structures with low disparity will encourage egalitarianism (O’Brien and David, 2014), trust (Harrison et al., 2010), cooperation (Bradley et al., 1999), and reciprocity (Bosse et al., 2009) that fosters a stakeholder orientation conducive to higher levels of CSP. This is in contrast to pay structures with high disparity that encourage individualistic (Brickson, 2007), self-regarding (Bridoux and Stoelhorst, 2014), competitive behavior (Bradley et al., 1999) which fosters a shareholder orientation and relatively lower levels of CSP. In our study of 1834 firms over a 15-year window, we find evidence for these assertions.
Our research makes two important contributions to existing literature. First, we provide clear evidence that the distribution, and not just the level, of pay in the TMT has a significant impact on CSP. Second, we contribute to the extremely small body of work that investigates the vital role that the broader TMT plays in affecting CSP (e.g. Thomas and Simerly, 1995; Wong et al., 2011). These contributions enhance our understanding of the influence of executive pay disparity on shareholder and stakeholder orientations, with implications for CSP.
Theory and hypotheses
Executives in organizations are tasked with effectively balancing many varied and diverse corporate strategies, goals, objectives, and initiatives (Hambrick and Mason, 1984; Hill and Jones, 1992). Some firms are structured primarily to maximize financial performance for shareholders, others with enhancing CSP for a broader set of stakeholders (Donaldson and Preston, 1995; Sundaram and Inkpen, 2004). CSP has been defined as “a business organization’s configuration of principles of social responsibility, processes of social responsiveness, and policies, programs, and observable outcomes as they relate to the firm’s societal relationships” (Wood, 1991: 693). While there are many classifications and definitions of who and what are stakeholder groups of an organization (e.g. Mitchell et al., 1997), they are generally regarded as parties such as shareholders, employees, customers, the environment, vendors, and communities who affect or are affected by the firm (Freeman, 1984).
Strategy research distinguishes between shareholder-oriented firms that are primarily structured to benefit one stakeholder group, shareholders (Sundaram and Inkpen, 2004), and stakeholder-oriented firms that are structured to benefit all stakeholder groups (Donaldson and Preston, 1995). A shareholder orientation has been likened to a contract-based (Bradley et al., 1999), transactional (Rousseau and Parks, 1992) set of calculative (Gooderham et al., 1999) and individualistic (Brickson, 2007) relationships. Shareholder-oriented firms have shareholder maximization as the primarily purpose of the firm (Sundaram and Inkpen, 2004).
Alternatively, other firms adopt a more stakeholder-oriented view (Freeman, 1984). TMTs that attempt to manage their organizations for the benefit of all stakeholder groups can be described as relational (Brickson, 2007), communitarian (Bradley et al., 1999), reciprocal (Bosse et al., 2009; Bridoux and Stoelhorst, 2014), and collaborative (Gooderham et al., 1999). Stakeholder-oriented firms espouse a “multifiduciary duty to all stakeholders” (Bradley et al., 1999: 44) and embrace the challenges associated with balancing the complex (Aguilera et al., 2007) and interdependent (Rowley, 1997) needs of all stakeholders. Recent work calls this mindset “stakeholderism” in which the interests of all stakeholders deserve consideration (Adams et al., 2011). Reflecting the shifting landscape from a more narrowly focused shareholder orientation to a more inclusive stakeholder view, Lorsch and MacIver (1989) reported that directors considered themselves to be more accountable to all stakeholders than to just the shareholders.
Given the differences in shareholder and stakeholder orientations, the debate regarding the appropriateness of each position, and the outcomes thereof, continues in earnest (Jones and Felps, 2013; Sundaram and Inkpen, 2004). A primary focus of these lines of research is the level of CSP generated by firms with a shareholder or stakeholder orientation. One stream of reasoning is that firms that adopt a more single-minded, shareholder-oriented focus should generate strong CSP because all stakeholders would benefit from improved financial performance (Sundaram and Inkpen, 2004). However, their relationships with stakeholders are more transactional (Brickson, 2007), whereby organizations allocate just enough resources to stakeholders to induce contributions needed for shareholder wealth maximization (McWilliams and Siegel, 2001) and prevent those stakeholders from exiting their relationships with the firm (Coff, 1999).
In contrast, firms with a multi-stakeholder orientation intentionally seek to maximize the return of all stakeholders’ investments, allowing all stakeholder groups (shareholders included) to jointly benefit. A stakeholder orientation is more relational in nature and fosters the development of long-term, mutually beneficial relationships among all stakeholder groups (Brickson, 2007). Indeed, such firms encourage interdependent stakeholder relationships (Brickson, 2007) and seek to provide more of a return to stakeholders rather than the bare minimum required (cf. Coff, 1999: 122–123). The implication is that firms that utilize structures that foster greater reciprocity both within and outside the firm (Bosse et al., 2009) (i.e. stakeholder-oriented firms) will more intentionally consider the needs of all stakeholders which will lead to higher levels of CSP, relative to shareholder-oriented firms.
At the center of these conflicting perspectives are the executives who are expected, and incentivized, to make decisions that execute and enact a shareholder or stakeholder focus. Executives are tasked with making decisions that affect the allocation of managerial, financial, and other resources to stakeholders (Hambrick and Mason, 1984; Hill and Jones, 1992). Scholars on both sides of the discussion have examined the role that executive compensation plays in motivating executives toward desirable behaviors (Devers et al., 2007; Walsh and Seward, 1990), such as increasing CSP (McGuire et al., 2003).
Traditional executive compensation literature focuses on aligning the interests of owners with managers (Devers et al., 2007) and, as such, has traditionally been shareholder-oriented. Prior research investigating the relationship between executive pay and CSP has focused almost exclusively on the amount and type of CEO pay (as opposed to the pay of the broader TMT) and has produced mixed results. For example, Deckop et al. (2006) found that long-term pay amounts were positively associated with CSP, Manner (2010) found no significant relationship, and McGuire et al. (2003) found mixed results. As for short-term pay amounts, Deckop et al. (2006) and Manner (2010) found a negative relationship with CSP, while McGuire et al. (2003) again found mixed results. The diversity of results from prior work indicates that the understanding of this relationship is far from settled. Perhaps one reason for these inconclusive findings is that, by focusing on amounts and types of pay, they inherently adopt an agency theory perspective that attempts to provide the right mix of incentives to align the interests of owners with managers. By focusing only on how pay aligns managers with shareholders, this body of work ignores how some elements of pay can serve to align the TMT more closely with stakeholders, thereby failing to uncover implications for CSP for other stakeholders.
We propose that there are other aspects of executive pay that more directly impact attitudes toward stakeholders. Consideration of these aspects can help illuminate these unclear prior results. Organizational scholarship recognizes that executives are motivated not just by the amount or type of their own compensation (Festinger, 1954; Siegel and Hambrick, 2005), but also by the differences in pay among the members of the TMT. Recognizing this, scholars have begun investigating how differences in pay, namely vertical pay disparity (the disparity in pay between the CEO and the rest of the TMT) (Henderson and Fredrickson, 2001) and horizontal pay disparity (the disparity of pay among the non-CEO executives) (Fredrickson et al., 2010), impact important organizational outcomes such as financial performance (Siegel and Hambrick, 2005). These studies focus on firm performance and argue that the behaviors of executives are strongly affected by the perceptions about the fairness of their pay when compared with the CEO (vertical disparity) and their fellow executives (horizontal disparity). We extend this research and suggest that such structures also encourage either a shareholder or a stakeholder orientation, with implications for CSP.
Vertical pay disparity
The foundation of many prior studies examining vertical pay disparity is tournament theory (Gupta et al., 2012; Lazear and Rosen, 1981). Most modern corporations create a pyramid compensation structure within firms in which the CEO is the highest paid person, the TMT members are the next highest paid employees, then middle managers, and so on down an organizational hierarchy (Henderson and Fredrickson, 2001). Tournament theory argues that utilizing pyramid compensation structures like this creates an environment within organizations in which individuals are motivated to, and rewarded for, outperforming their fellow competitors (Lazear and Rosen, 1981). Management scholars argue utilizing tournament structures for executive compensation helps to elicit the best individual efforts from executives and discourage shirking and free riding (Gibbons and Murphy, 1990; Hambrick, 1995; Jensen and Meckling, 1976), which most effectively aligns the interests of managers with shareholders.
Prior work has studied contexts in which individuals were motivated by financial incentives and found that, indeed, individuals are motivated by high pay disparity and put forth higher levels of effort in such situations (Lazear and Rosen, 1981). For example, research from retail sales members (Casas-Arce and Martinez-Jerez, 2009), professional sports (Becker and Huselid, 1992; Bloom, 1999; Ehrenberg and Bognanno, 1990), and motor carrier and concrete pipe industries (Shaw et al., 2002) all find support that individuals put forth greater effort when there are financial incentives to do so. This type of research supports a shareholder-oriented view in that maximizing financial profits will create the most total value, which will then spill over to benefit all stakeholders (Jones and Felps, 2013).
However, parallel research in this area has found that high pay disparity also gives rise to undesirable behaviors within groups such as the TMT (Harbring and Irlenbusch, 2008, 2011), with adverse consequences for CSP. For example, when individuals are in a setting of high pay disparity, they may take subversive actions to make themselves appear better at the expense of their peers (e.g. Eisenhardt and Bourgeois, 1988). At the executive level, these actions may include preventing fellow executives from obtaining vital information (Eisenhardt and Bourgeois, 1988; Lazear, 1989), manipulating information to benefit a focal executive even if the manipulated information hurts the firm (Milgrom and Roberts, 1988), and holding secret meetings to attempt to influence decision makers (Eisenhardt and Bourgeois, 1988). Thus, according to this research, high pay disparity would create a shareholder-centric perspective which would introduce negative behaviors into the executive team, with potential harmful consequences for CSP. Because of the challenges inherent with a stakeholder orientation, these destructive behaviors would indeed make it “wishful thinking” (Sundaram and Inkpen, 2004: 354) for executives to balance competing executive claims.
Firms with high vertical pay disparity structures foster competition and individual ambition which is linked with a profit-maximizing, shareholder orientation (Brickson, 2007). Therefore, we argue that executives in a high vertical pay structure will adopt a shareholder orientation and will not exhibit the requisite stakeholder-centric attitudes of egalitarianism (O’Brien and David, 2014), trust (Harrison et al., 2010), and cooperation (Bradley et al., 1999) needed to effectively manage complex stakeholder issues (Rowley, 1997; Wong et al., 2011), resulting in lower CSP.
Hypothesis 1: The higher the vertical executive pay disparity, the lower the CSP.
Horizontal pay disparity
Prior work has found that the behaviors of non-CEO executives are influenced not only by perceptions of pay fairness as compared with the CEO (i.e. vertical disparity) but also with their fellow non-CEO executives (i.e. horizontal disparity) (Fredrickson et al., 2010; Siegel and Hambrick, 2005). The theoretical foundation for horizontal pay comparisons is equity theory (Adams, 1963; Gupta et al., 2012). According to equity theory (Adams, 1963), individuals take stock of the inputs into their work (e.g. time, effort) and the outputs they receive from that work (e.g. compensation) and compare the input-to-output ratio with others they view as similar to themselves. When individuals feel that their input/output ratio is in balance with others’ ratios, equity exists. However, when individuals perceive that their ratio is worse than those of other similar individuals, they seek to alter their behavior as a response to the inequity.
Examining this phenomenon at the executive level, prior work finds that executives, like other individuals, compare themselves with others based on observable differences (e.g. Fredrickson et al., 2010). These comparisons are justified since executives are likely to have similarities in educational achievement, employment success, and hierarchical position within the firm (March and March, 1977). Additionally, executives often have similar personalities and generally tend to be “highly motivated, achievement-oriented, power-seeking, and status-driven” individuals (Finkelstein and Hambrick, 1996: 1033).
Despite these observable similarities, executives do have differences such as age, gender, ethnic origin, and most notably in the quality and quantity of their work. However, as Fredrickson et al. (2010) argue, individuals in general, and executives in particular, tend to overestimate the value of their own contributions and diminish the value of others’ efforts (Kruger and Dunning, 1999). In this way, executives typically perceive they are generally similar to their fellow executives on superficial, observable characteristics and superior to them in regards to their less observable but more meaningful contributions to their organizations (Hiller and Hambrick, 2005).
Prior work has examined outcomes of high horizontal pay disparity and found positive results in situations where the need for collaboration and interdependence were low. For example, higher levels of horizontal pay disparity aid in attracting (Cadsby et al., 2007) and retaining high performers within the organization (Carnahan et al., 2012) and also increasing individual effort (Cadsby et al., 2007; Shaw et al., 2005). However, in these settings, individuals were motivated to work for individual outcomes, not for group or organizational outcomes. Thus, in situations where cooperation and collaboration are important for achieving desired group or organizational outcomes, prior work finds that pay disparity is detrimental for achieving those outcomes (Lazear and Rosen, 1981: 562–563).
Examining reasons for the adverse effects of horizontal disparity on group and organizational outcomes, Siegel and Hambrick (2005: 263) argue that executives making more than their peers experience feelings of “condescension, aloofness, and social distancing” toward their inferior fellow executives. For those who make less than their peers, feelings of jealousy (Barnard, 1938), decreased job satisfaction (Pfeffer and Langton, 1993), and resentment toward those who are receiving more compensation are experienced (Siegel and Hambrick, 2005: 263). The combination of responses by those making more than their peers and those making less than their peers results in more independent behavior and in-fighting and less integration and collaboration within the TMT (Fredrickson et al., 2010; Siegel and Hambrick, 2005).
Accordingly, prior research has linked horizontal pay disparity with a number of negative outcomes. For instance, Shaw et al. (2002) found that in the trucking industry, high pay disparity resulted in a higher rate of accidents. In professional sports, scholars found that higher pay disparity was associated with worse team performance (Bloom, 1999; Mondello and Maxcy, 2009). Also, in academic departments, Pfeffer and Langton (1993) found that higher pay disparity was linked with lower job satisfaction, lower research productivity, and less collaboration with fellow colleagues. Moreover, higher horizontal pay disparity is associated with higher executive turnover (Bloom and Michel, 2002), worse financial performance in high-tech industries (Siegel and Hambrick, 2005), and worse financial performance across multiple industries (Fredrickson et al., 2010).
These findings suggest that high horizontal pay disparity structures encourage shareholder-oriented individual competition (Bradley et al., 1999) and discourage collaborative efforts, indicative of a stakeholder orientation. Since characteristics such as cooperation (Bradley et al., 1999), reciprocity (Bosse et al., 2009), and egalitarianism (O’Brien and David, 2014) are the very qualities needed by TMTs to balance competing stakeholder claims, we argue that high horizontal disparity pay structures foster a shareholder-centric orientation which undermines the collaboration and cooperation needed for firms to generate high levels of CSP.
Hypothesis 2: The higher the horizontal executive pay disparity, the worse the CSP.
Sample and data collection
To test our assertions, we collected and merged data for every US-based, publicly traded firm for which firm-level financial data from COMPUSTAT, executive compensation data from EXECUCOMP, and governance variables from RISK METRICS were all available over the time period 1996–2010. To avoid discrepancies in the reporting of industry data documented in years prior to 1996, we chose 1996 as the initial year for data collection (Kahle and Walking, 1996). We then merged that data with firms for which CSP data from the Kinder, Lydenberg & Domini, & Co. (KLD) database was available. We did this for the time period of 1997–2011 (because CSP is measured at time t + 1). These steps resulted in an initial sample of 1834 firms across 58 industries over a 15-year window period and 13,464 observations for which all variables were available for all firms.
This time range captures a period both before and after the introduction of the Sarbanes–Oxley Act of 2001, which imposed new regulations on firms and their executives (Fredrickson et al., 2010). Also, this time period witnessed a dramatic rise in financial investments based on CSP, as evidenced by a dramatic increase in socially responsible investing (SRI) from 1995 (US$639 billion) to 2012 (US$3.7 trillion invested) (US SIF Foundation, 2014), with the trend expected to continue. Thus, the governance changes and rise in SRI make this 15-year window an attractive time period to examine our research question.
Consistent with prior research, we excluded from our sample financial companies (such as banks, insurance companies, and real estate investment trusts) due to increased government regulation of these industries, which creates compensation structures that are less likely to be generalizable to most other firms (Wright et al., 2005). Logarithmic transformations of key variables (short-, long-, and total-vertical disparity), some of which were initially negative, resulted in null values which were excluded (Henderson and Fredrickson, 2001; Lin et al., 2013). Due to the lagged structure of the analysis, a final sample of 1315 unique firms across 58 industries (two-digit Standard Industrial Classification (SIC) codes) for a total of 8567 firm-year observations was produced. The average dollar value of total assets for firms in the sample was US$8.9 billion (low of US$26.4 million and high of US$797.8 billion).
Measures
Dependent variable
The CSP measure was constructed using the KLD database. The KLD data are generated by an independent rating company that examines a variety of secondary and primary sources to determine firms’ CSP toward specific stakeholder groups. While there are other CSP rankings currently available (e.g. FTSE4Good, Calvert, Innovest), the KLD data are the most frequently used measure of CSP in social performance research (Deckop et al., 2006: 334; Waddock, 2003: 369). Despite (or perhaps because of) their extensive usage, the data have also been subject to numerous critiques (e.g. Chatterji and Levine, 2006). Notwithstanding these critiques, the validity of the data have been empirically substantiated (Hart and Sharfman, 2012; Sharfman, 1996) and have been used in numerous academic investigations over the past 20 years, becoming “the de facto research standard” when studying CSP (Waddock, 2003: 369).
KLD assesses CSP based on seven different categories (human rights, corporate governance, employees, products, environment, community, and diversity) for each firm it evaluates (RiskMetrics, 2010). Within each category are a number of subcategories to which KLD assigns a “1” or a “0” according to whether specific criteria are met. Because the number of subcategory items changed over the course of the years covered in our sample, we standardized each of the scored items to put each dimension on the same scale so that even with variations in the number of items, each dimension carried equal weight. We then followed prior literature to first sum all of the strengths (“CSP Strengths”) and all of the concerns (“CSP Concerns”) separately, and then subtract the concerns from the strengths to create a Net CSP variable (David et al., 2007; Wong et al., 2011). Because there is a lag between executive behavior and firm-level outcomes, we follow prior literature (Hillman and Keim, 2001; Wong et al., 2011) and measure Net CSP at t + 1.
Some work has argued that subtracting CSP Concerns from CSP Strengths may result in the scores canceling each other out or one of the scores overshadowing the other (Mattingly and Berman, 2006; Strike et al., 2006). When the research question focuses on how strong the CSP Strengths are and how concerning the CSP Concerns are, examining strengths and concerns separately may be appropriate (e.g. Strike et al., 2006). However, in the present case, we are focused on how stakeholder management affects overall CSP. In managing these stakeholder claims, tradeoffs may frequently be made that affect strengths and concerns separately or jointly. Thus, for this work, a specific focus on either strengths or concerns is unwarranted. Rather, we focus on how the degree of collaboration and interdependent effort exhibited by the executive team as a result of vertical and horizontal pay disparity affects the overall level of CSP within the firm. In so doing, we are following a long line of research that utilizes Net CSP as an indicator of the CSP of the firm (David et al., 2007; Wong et al., 2011).
Independent variables
Data for calculating pay disparity were collected from the EXECUCOMP database. We follow prior literature and include the highest paid five members of the TMT (the CEO and the next four highest paid executives) (Barron and Waddell, 2003; Fredrickson et al., 2010). Prior work has found that varying compensation amounts and types can have differing effects on CSP (Deckop et al., 2006; McGuire et al., 2003; Manner, 2010). While different types of compensation are linked with executive motivations, extant literature is silent as to why or how different types of pay disparity (e.g. short-term vs long-term pay disparity) would have different effects on executive behavior or CSP. Moreover, theory does not suggest a priori why one type of disparity (total, short-term, or long-term) would differ substantially from another in its effects on CSP. Rather, the focus of disparity literature has been on the degree of disparity and the negative effects upon group outcomes, not the temporal make-up of the compensation.
In light of these factors, our hypotheses are that compensation disparity will have negative effects on CSP, regardless of the type of compensation (i.e. total, short-term, and long-term). Thus, to employ a vigorous test of our hypotheses and to advance research in these fields, we examine the effect on CSP from all three aspects of vertical and horizontal compensation disparity (total, short-term, and long-term). That is, we examine the effect of total, short-term, and long-term vertical disparity on CSP to test Hypothesis 1 and total, short-term, and long-term horizontal disparity on CSP to test Hypothesis 2.
The calculation of these variables follows a two-step process. First, following prior research, short-term compensation is determined as the sum of annual salary and bonuses, long-term compensation as the sum of the Black–Scholes value of stock options and restricted stock grants, and total compensation as the sum of short-term and long-term compensation (Devers et al., 2007; Yanadori and Marler, 2006).
With these data, we then calculate the actual disparity values. The vertical disparity values were calculated as the log of the difference between the compensation of the CEO and the average compensation of the rest of the TMT (Carpenter and Sanders, 2004). From these values, we calculated three measures of vertical pay disparity: Total vertical disparity, Short-term vertical disparity, and Long-term vertical disparity (Yanadori and Marler, 2006). The horizontal disparity values were created by calculating the coefficient of variation (CV) of pay for the non-CEO executives. These values are calculated as the standard deviation divided by the arithmetic mean of TMT pay (times 100 for ease of presentation) (Fredrickson et al., 2010). From these values, we calculated Total horizontal disparity, Short-term horizontal disparity, and Long-term horizontal disparity.
Control variables
In addition to the focal variables of interest, we also include a number of control variables in our analysis. The independence and composition of the board of directors has been linked with CSP (Johnson and Greening, 1999), so Board Independence was calculated as the ratio of outside directors to total board members (Sanders and Carpenter, 1998). Board Size was calculated as the total number of directors serving on the board (Sanders and Carpenter, 1998). TMT background diversity (e.g. gender) can also influence corporate strategies (Cannella et al., 2008), so we used the Ratio of Female Executives as an indicator of TMT background diversity, which was calculated using the number of female executives divided by the total number of top executives. The ability of the CEO to influence CSP may be influenced by the position the CEO holds on the board (Zajac and Westphal, 1996). CEOs have greater influence over corporate strategies if they also serve as Chairman of the board. Thus, CEO Duality was calculated as “1” if the CEO is also Chairman of the board and “0” if the CEO is not the Chairman (Boyd, 1994; Sanders and Carpenter, 1998). In addition, CEOs with long-tenure may be able to assert particular influence on corporate strategies (Henderson and Fredrickson, 2001), which in turn may influence CSP as well. Thus, we also controlled for CEO Tenure, which was measured as the number of years since the CEO took office (Fredrickson et al., 2010).
Additionally, Capital Investment Activity has been found to affect executive pay gap effects (Henderson and Fredrickson, 2001), thus we controlled for it and calculated that variable as annual capital equipment expenditures divided by sales. A firm’s slack resources can also affect corporate strategy (Finkelstein and Hambrick, 1990). To capture the degree of immediate resource availability, we adopted Immediate Slack (working capital divided by sales) to assess the cushion a firm has to meet opportunities and needs on a short-term basis (Bourgeois, 1981; Singh, 1986). An extensive amount of prior work has examined the relationship between financial and social performance (e.g. Orlitzky et al., 2003). Although a majority of studies have found a positive relationship between financial and social performance, the results are somewhat mixed and research in this area continues (Aguinis and Glavas, 2012: 942). Because of possible effects on our results, we control for Firm Performance. Researchers often employ accounting-based (e.g. return on assets (ROA), return on equity (ROE)) and market-based (e.g. Tobin’s Q) measures of firm performance (Wright et al., 2005). In this study, we measure firm performance as Tobin’s Q (Montgomery and Wernerfelt, 1988) and the firm’s ROA (Bloom and Michel, 2002). To test the robustness of our findings and provide evidence that the relationships are not sensitive to the measure of firm performance, we re-ran the analysis measuring firm performance as Tobin’s Q and ROE (Waddock and Graves, 1997) and found the direction and significance levels of those findings are substantially similar to the reported results.
Prior work has found an empirical connection between horizontal pay disparity and firm size (Bloom and Michel, 2002; Henderson and Fredrickson, 2001). Also, because firms with more employees are likely to have more hierarchical compensation structures which may influence vertical pay disparity, prior work in this area controls for the number of employees as a measure of firm size (Siegel and Hambrick, 2005). Thus, we controlled for Firm Size by using the natural logarithm of the number of employees.
Industries have different norms regarding executive compensation (Finkelstein and Hambrick, 1989). Because executives may compare their pay to industry-peers as well as firm-peers, prior research controls for industry averages of vertical and horizontal disparity (Fredrickson et al., 2010). In this study, we control for the average Industry Total, Short-Term, and Long-Term Vertical Disparity, and Industry Total, Short-Term, and Long-Term Horizontal Disparity. The industry-averaged vertical and horizontal disparity were calculated as the average of vertical and horizontal pay disparity in two-digit primary industries, respectively, following prior work (e.g. Coombs and Gilley, 2005). Additionally, the Sarbanes–Oxley Bill of 2002 imposed new reporting requirements on firms and increased the potential personal liability for directors and executives of firms for actions. Thus, we created a dummy variable Post SOX, and coded the years from 2002 on as “1” and the years prior to 2002 as “0” (Fredrickson et al., 2010).
Analysis
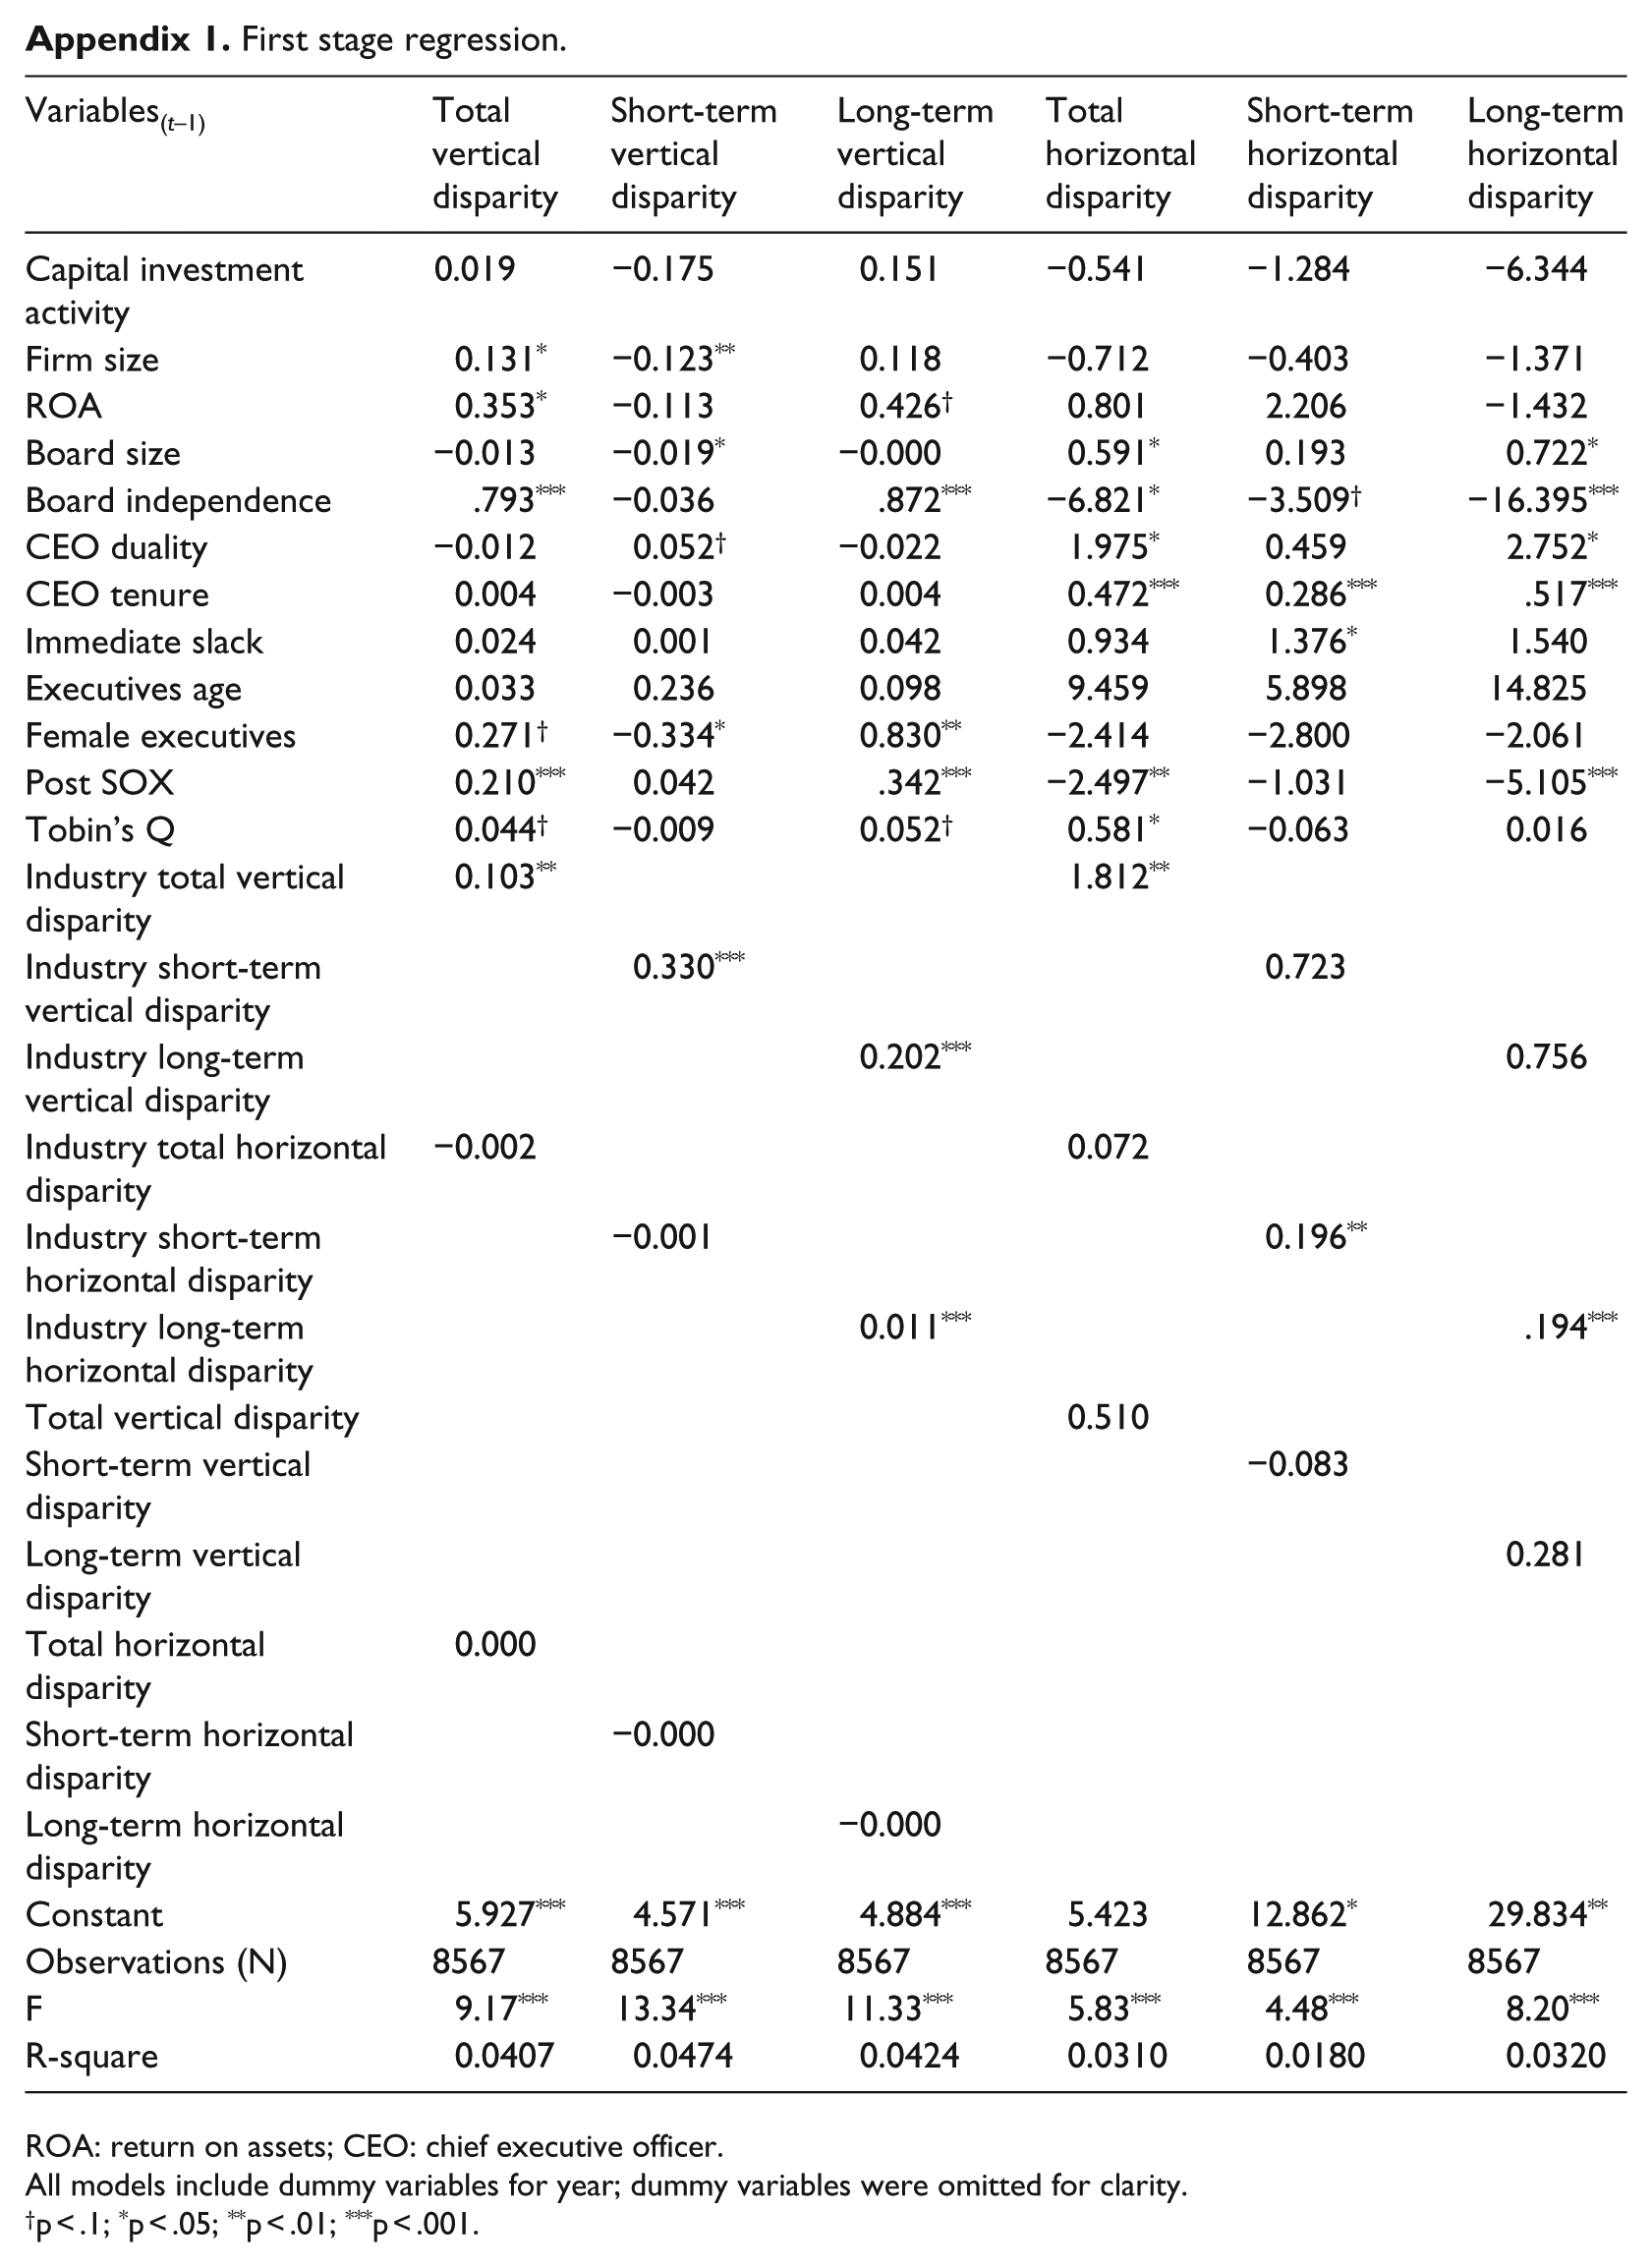
Prior empirical work on executive compensation suggests potential endogeneity issues (Rajgopal and Shevlin, 2002). The presence of endogeneity in our model could undermine our ability to make causal inferences of the relationships we propose. Thus, following prior studies on executive compensation, we added endogeneity controls in the models (Chatterjee and Hambrick, 2007, 2011; Sanders and Hambrick, 2007). The endogeneity control is a parameter created by regressing vertical and horizontal disparity in t on firm, board, and executive variables in t – 1. The overall model is significant (p < .001). These results are consistent with prior research on the antecedents of CEO pay gaps (Henderson and Fredrickson, 2001).
We identified significant predictors for each measure of vertical and horizontal pay disparity, which are detailed in Appendix 1. After identifying these variables, we calculated the predicted value of each disparity measure using the regression coefficients of the significant variables identified in this step. We then included the predicted value as an endogeneity control in the respective models. For example, in our model, the significant predictors of long-term vertical disparity are board independence, female executives, post-SOX dummy, the average industry long-term vertical disparity, and the average industry long-term horizontal disparity. We calculated the predicted value of long-term vertical disparity using the regression coefficients for these variables and included the predicted values as an endogeneity control in Models 5 and 6 (i.e. long-term vertical and horizontal disparity models). We utilized these same steps for each of the three measures of vertical and horizontal pay disparity. In following these procedures, we have controlled for potential issues of endogeneity, which strengthens our ability to make causal inferences in these relationships.
Additionally, to further strengthen our arguments for causal inferences, we directly test reverse causality by using CSP in time t – 1 as the independent variable and vertical and horizontal disparity variables in time t as the dependent variable. The results of this additional analysis (which are available from the authors upon request) indicate that CSP is not a significant predictor of pay disparity. Empirical analysis utilizing secondary data is limited in conclusively proving causality. However, by adding endogeneity controls, as well as testing for reverse causality, we have greatly reduced the likelihood that some other factor (such as a common third factor related to vertical and horizontal disparity and CSP) is exerting undue influence in our model. In so doing, while we cannot definitively prove causality, we have strengthened our claims for the causal relationships we propose.
Our dataset consists of multiple unbalanced panels of observations because not all of the firms are represented in every year of the panel. Because of this, ordinary least squares regression is not appropriate to analyze the data. Therefore, we employed a cross-sectional time series estimation model, using the XTREG procedure in STATA with robust standard errors. The Breusch–Pagan test was used to detect the presence of heteroskedasticity. Results rejected the null hypotheses (p < .001), which indicates that heteroskedasticity was present. A Hausman test (Hausman and Taylor, 1981) indicated that the random-effects model should be rejected in favor of fixed-effects specification. The Wooldridge test for autocorrelation revealed the existence of first-order autocorrelation (Drukker, 2003; Wooldridge, 2002). Considering the existence of heteroskedasticity and first-order autocorrelation, we utilize the “fe cluster” procedure in STATA (Wooldridge, 2002). The standard error estimates using this procedure are robust to disturbances that are heteroskedastic and autocorrelated (Wooldridge, 2002). To ascertain the threat of collinearity, we examined the variance inflation factors (VIF) of the data for each model. For all models, the VIF of the data ranges from a low of 1.02 to a high of 2.41, well below the recommended ceiling of 10, indicating that collinearity is not a concern in the data (Neter et al., 1996). Finally, we also utilized the Winsor technique (Kennedy et al., 1992; Miller and Parkhe, 2002) to examine the extent to which outliers may be unduly affecting the data and found that outliers do not meaningfully affect the data.
Results
Table 1 reports the means, standard deviations, and correlations of the dependent, independent, and control variables used in this study. Our hypotheses predict that vertical and horizontal disparity negatively affects CSP. Hypothesis 1 predicts that vertical pay disparity is negatively associated with CSP. We test this hypothesis by examining the effect of total, short-term, and long-term vertical disparity on Net CSP. As shown in Table 2, we find significant results in the hypothesized direction for the negative effect that vertical pay disparity has on CSP. Each of our compensation measures, total (p < .001), short-term (p < .001), and long-term disparity (p < .01), were negative and significant. These results provide strong evidence that high levels of vertical compensation disparity result in worse overall CSP for firms, thus supporting Hypothesis 1.
Descriptive statistics and correlations.

ROA: return on assets; CEO: chief executive officer; SRI: socially responsible investing; CSP: corporate social performance.
The table reports the means, standard deviations, and correlation coefficients of the variables.
Fixed-effects regression of vertical and horizontal disparity on Net CSP.
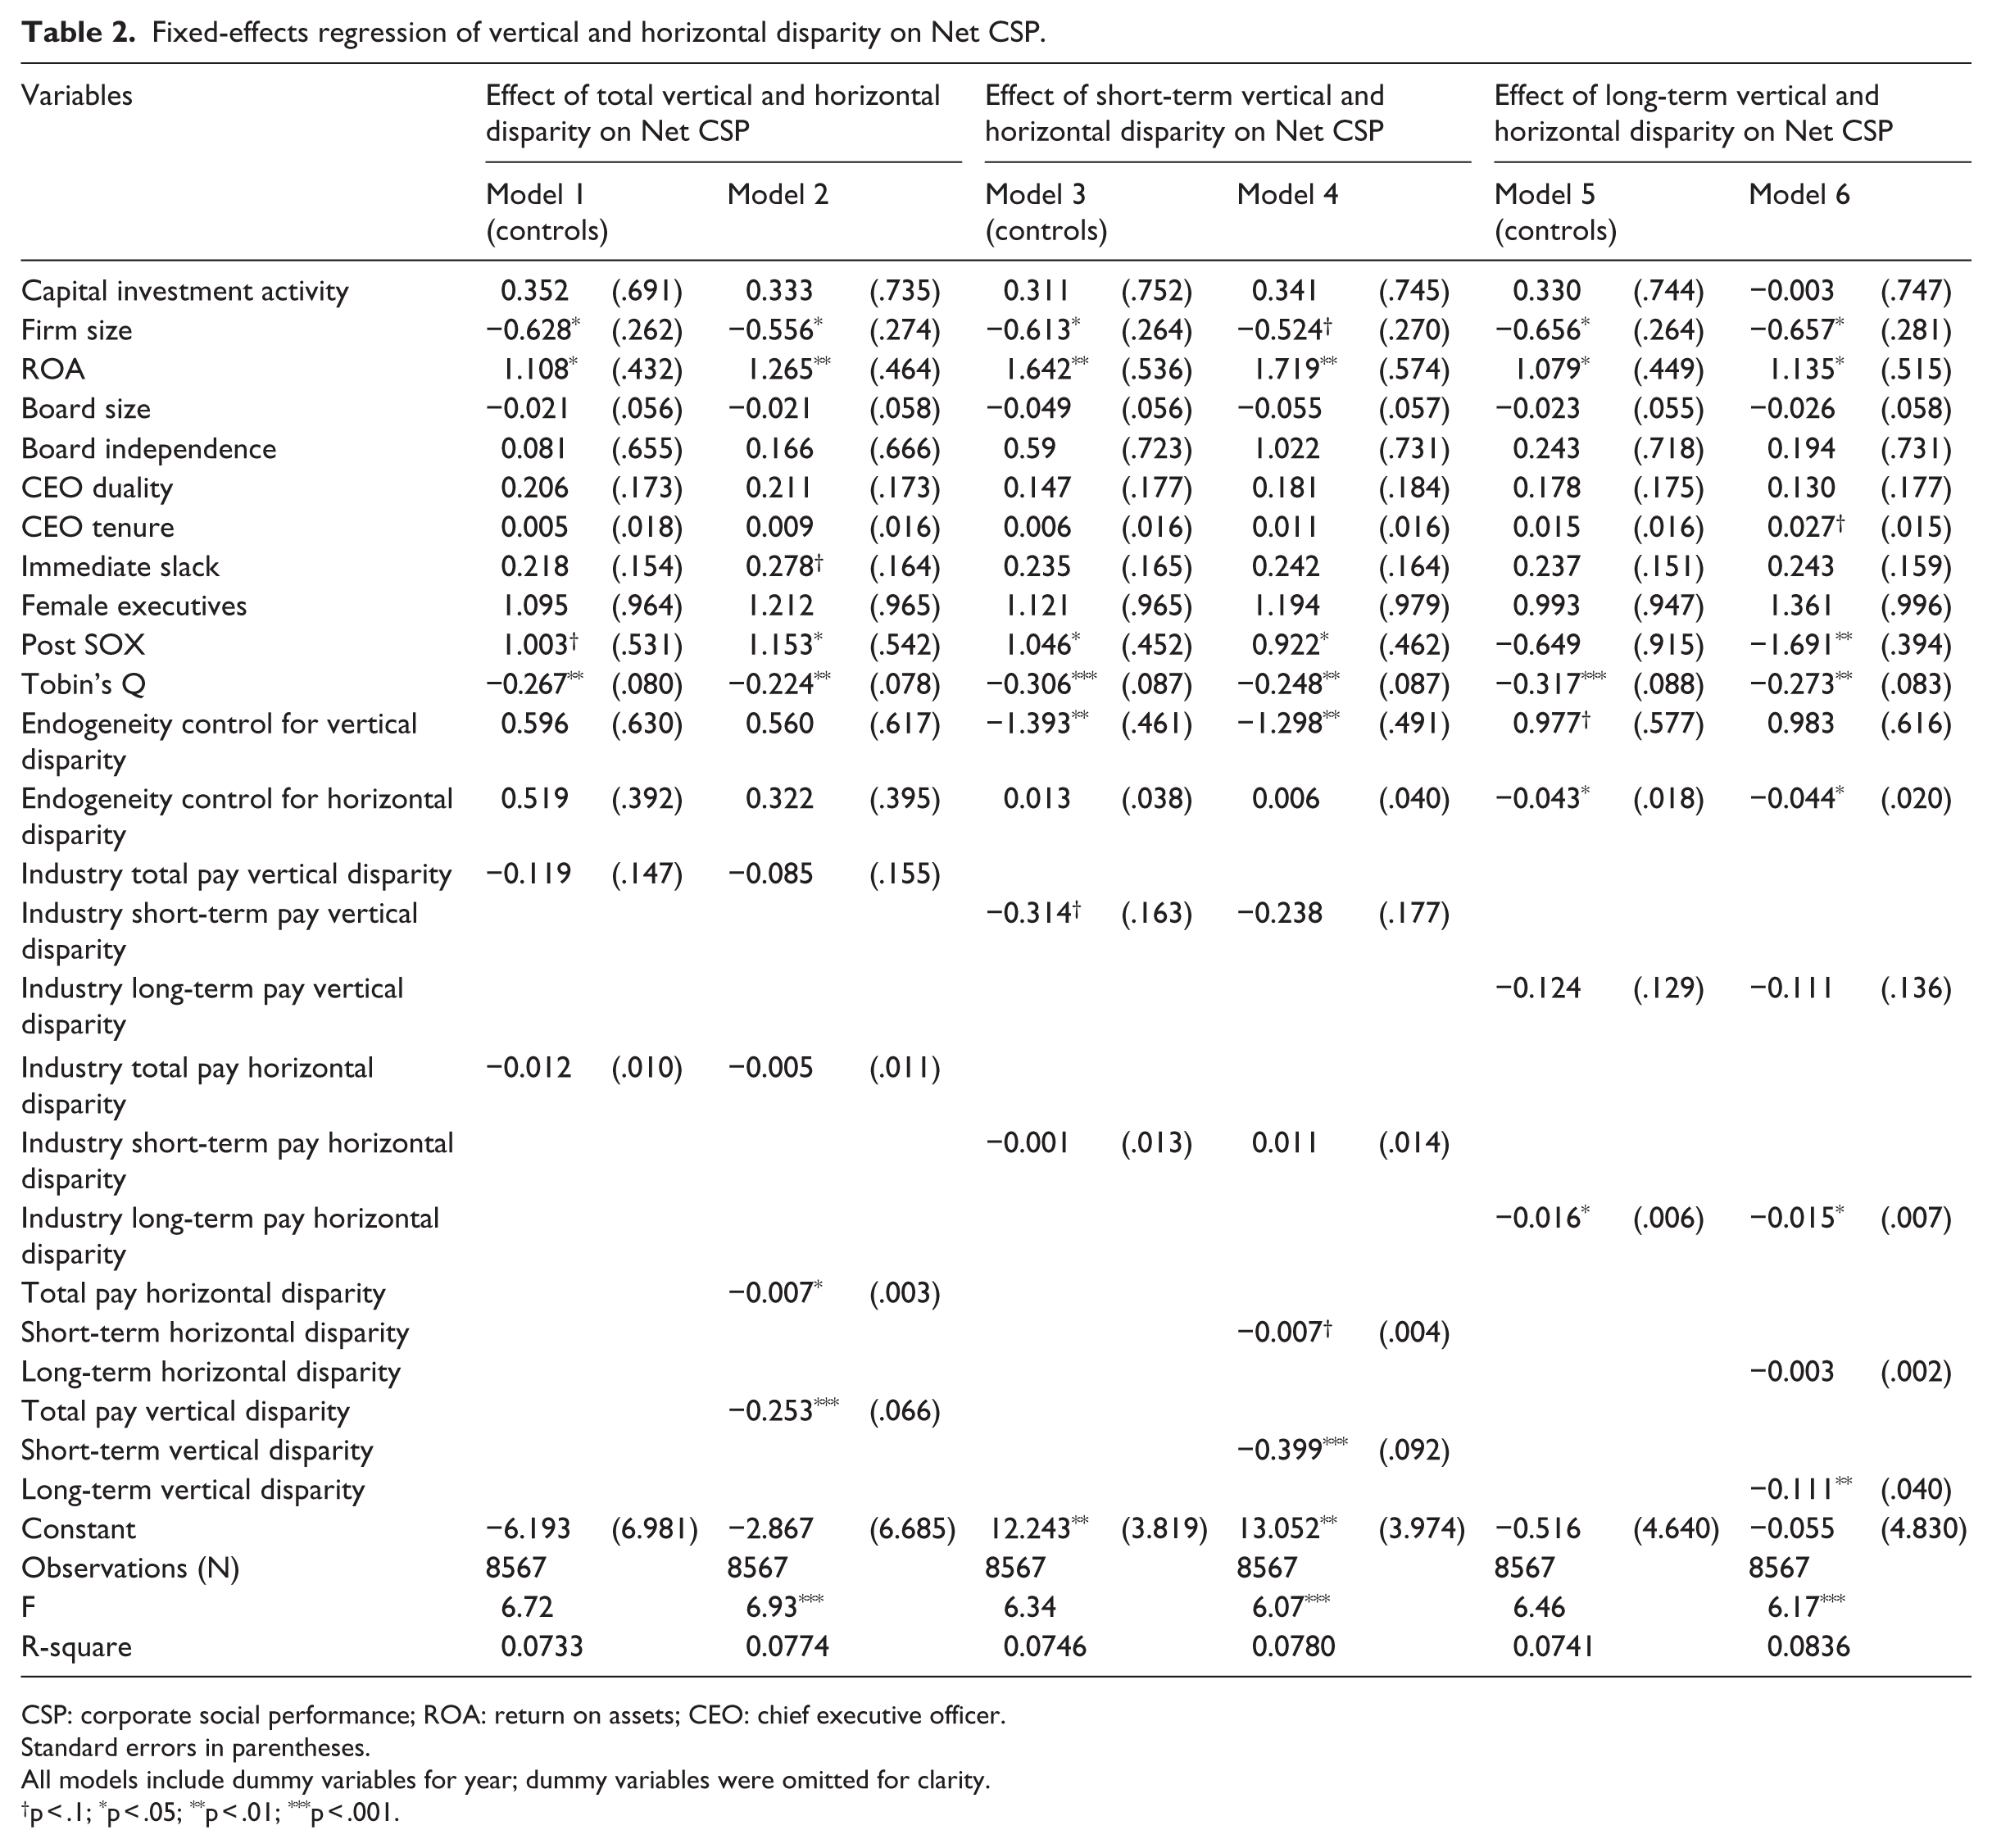
CSP: corporate social performance; ROA: return on assets; CEO: chief executive officer.
Standard errors in parentheses.
All models include dummy variables for year; dummy variables were omitted for clarity.
p < .1; *p < .05; **p < .01; ***p < .001.
Hypothesis 2 predicts that horizontal pay disparity is negatively associated with CSP. As shown in Table 2, we find significant results in the hypothesized direction for the negative effect on CSP for total horizontal pay disparity (p < .05). However, for short-term horizontal disparity (p < .10) and long-term disparity (p = NS), we find relationships in the predicted direction but significance levels less than p < .05. Thus, Hypothesis 2 is partially supported. However, because total horizontal pay disparity is significant, an assertion can still be made that high levels of total horizontal executive pay disparity result in worse overall CSP for firms. Overall, despite mixed results with short- and long-term vertical and horizontal disparity, we find strong evidence that total vertical and horizontal pay disparity adversely affect CSP, providing new evidence to the question of how a shareholder or a stakeholder orientation affects CSP.
Discussion
In this work, we sought to understand how vertical and horizontal executive pay disparity affects CSP. We argue that the extent of pay disparity in an organization promotes either a shareholder or a stakeholder orientation in executives. In organizations with high pay disparity, we suggest that individualism (Brickson, 2007) and competition (Bradley et al., 1999) are encouraged within the executive team which fosters a shareholder orientation, which we argued would lead to worse CSP. However, in organizations with low pay disparity, egalitarianism (O’Brien and David, 2014) and reciprocity (Bosse et al., 2009) are fostered, which promotes a stakeholder orientation, leading to higher CSP. Our results show that disparate executive pay structures that align managers more narrowly with stakeholders yield lower CSP than do less disparate pay structures which align managers with a broader set of stakeholders. We find that higher vertical and horizontal pay disparity lead to lower CSP and that lower pay disparity leads to higher CSP. Given the influential role executives play in CSP (Wong et al., 2011), these findings contribute to our understanding of the relationships between executive pay structures, the relative shareholder–stakeholder orientation of firms, and CSP.
Based primarily in tournament theory, prior research on the effects of high vertical pay disparity finds that individuals are motivated to put forth higher levels of individual effort to achieve greater personal rewards (Lazear and Rosen, 1981). However, in doing so, individuals may also engage in subversive behaviors to make themselves appear more successful at the expense of their competitors (Eisenhardt and Bourgeois, 1988). Within this context, we find support for our argument that such behaviors promote individual, competitive behaviors which encourage a shareholder orientation that is not beneficial for CSP.
We also extend work on horizontal pay disparity utilizing equity theory (Adams, 1963). When executives compare their pay to their non-CEO peers, feelings of condescension are generated in those making comparatively more than their peers and feelings of resentment are stirred up in those making comparatively less (Siegel and Hambrick, 2005). These feelings result in more independent behaviors by executives and less collaborative effort (Fredrickson et al., 2010). Because of the complexity of stakeholder management (Aguilera et al., 2007; Davidson, 2007), it is important for executives to consider various viewpoints and work more collaboratively (Wong et al., 2011). Our finding that lower levels of pay disparity increase CSP extends current understanding of the effects of executive pay disparity, which had not yet considered the impact of pay disparity on CSP (cf. Henderson and Fredrickson, 2001; Siegel and Hambrick, 2005).
In addition to extending research on executive vertical and horizontal pay disparity, we also contribute to the CSP literature. Until recently, most research examining the effects of executives on CSP has focused on the relationship between the CEO and CSP (e.g. Manner, 2010). However, some work has looked more intently at how the broader TMT affects CSP (Thomas and Simerly, 1995; Wong et al., 2011). We join this later effort to bring more attention to the dynamics of the broader executive team and its impact on CSP. Our findings that vertical and horizontal pay disparity both negatively affect CSP suggest that the relationship between the CEO and the rest of the TMT, as well as relationships among the non-CEO TMT members, all have meaningful effects on CSP.
The practical contribution of this work is that we provide new insights that should play into the considerations of firms when they design their compensation systems. Our work suggests that the shareholder-centric, individualistic, and competitive attributes of pay disparity negatively affect the ability of TMTs to effectively manage stakeholders. What we contribute beyond extant research is that, across a wide range of industries, we found that pay disparity is harmful for CSP. Since CSP is an increasingly important measure upon which the performance of firms is judged (Aguilera et al., 2007), creating (or maintaining) a more compressed executive pay scale may be beneficial for most firms. However, each firm is uniquely situated and converting from high to low disparity is not a transition that should be taken lightly. Nevertheless, firms should take into account these findings when considering how to best structure executive pay to achieve their desired outcomes.
Limitations and future directions
Like all research, our work contains limitations. While the KLD database is by far the most widely used and well-respected CSP database in the world (Waddock, 2003), it is not without its critics. Recent work has challenged the conceptual adequacy of KLD as to the degree to which it measures true CSP (Chatterji et al., 2009; Entine, 2003). Despite these critics, several recent articles that examine the impact of executive compensation on CSP utilize the KLD database (Fong, 2010). Thus, until better measurements of CSP are developed, the use of KLD data has strong support from the literature and allows for comparability with prior work.
Additionally, we focus on Net CSP rather than any particular dimension to run our analysis. In doing so, we do not account for those firms which may not have a high overall score but do excel in specific CSP dimensions. Conversely, there may be firms with good overall scores but are brought down by one bad CSP dimension. Thus, by utilizing overall Net CSP instead of just CSP strengths or concerns or any specific dimension, our findings are limited to inferences made from overall CSP scores. We encourage future work to look at specific CSP dimensions, as well as CSP strengths and concerns separately.
The generalizability of our findings is limited by the fact that we used publicly traded firms in the United States for which executive compensation data, governance data, financial data, and CSP data were all available. This somewhat limited focus makes it unclear whether, or to what degree, these findings are generalizable to firms not having these characteristics. Unfortunately, this is a common limitation with research focused on these topics (e.g. Coombs and Gilley, 2005). We encourage future research to continue seeking out unique data opportunities in which similar issues may be examined in dissimilar ways and contexts.
An additional limitation in our study is that our analysis of the TMT is limited to the CEO and the next four highest paid executives rather than what each firm may have considered its TMT. Limitations in reporting requirements, data availability, and data consistency across our sample of firms contribute to this shortcoming. The Securities and Exchange Commission (SEC) only requires that public companies include compensation data for the CEO, the chief financial officer (CFO), and the three next highest compensated officers. This is most likely why compensation studies exploring vertical and horizontal disparity (Ridge et al., 2015) utilize the five highest paid executives. As a result, we adhere to this precedent and similarly use the five highest paid executives. We do believe, however, that the use of our measure does allow us to maintain consistency across our sample of firms.
Another important limitation of this work is one that we have in common with the other work in this field of research (Fredrickson et al., 2010). We argue that high pay disparity is harmful for CSP because executives take on a shareholder-centric, competitive orientation and do not adopt the more stakeholder-centric attitudes of reciprocity and collaboration. However, we do not observe or measure the actual behavior of the TMT, thus limiting our ability to make causal inferences of TMT behavior on CSP. However, a growing body of research makes a compelling argument that TMT disparity does encourage undesirable executive behaviors and we build upon this existing foundation (Siegel and Hambrick, 2005). Nevertheless, more work is needed to directly observe how pay disparity affects the actual behaviors of executives in order to strengthen the arguments for causality in research in this area. Thus, we join with others (Fredrickson et al., 2010: 1049) and encourage future work to continue exploring opportunities to increase our understanding in these fields of research.
Because so little work has examined the impact of the TMT on CSP, numerous research opportunities exist. While we have examined the impact of pay disparity on CSP, there are likely other internal and external drivers of executive behavior. For example, recent work by Wong et al. (2011) examined how sociocognitive dimensions of executives affected their ability to work together to manage stakeholders. They found that when executives possessed greater abilities to consider and differentiate among various perspectives, then such firms generated higher levels of CSP. However, they did not consider the possible effects of externally motivating factors like executive compensation. Likewise, in this work, we examined the effects of pay disparity on CSP but did not account for sociocognitive factors. Because both internal and external factors influence human behavior, future work should continue investigating how these factors interact to affect CSP.
Additionally, because no prior work has examined the effect of executive pay disparity on CSP, we felt it important to do so in a broad, generalizable fashion. Having done so, we encourage future work to extend our study and examine narrower settings and specific contexts in which these general findings are strengthened or weakened. For example, studying how technological intensity (Siegel and Hambrick, 2005) or other contextual variables (e.g. environmental dynamism) interact with executive pay disparity to affect CSP would be worthy fields of inquiry that build upon the foundation we have laid in this study. Also, examining situations where the CEO makes less than the average of the TMT members (negative disparity) would be a potentially interesting extension of the current study.
Conclusion
This work suggests, and finds evidence, that both vertical and horizontal pay disparity are harmful for CSP. Given the growing importance of stakeholder management in organizations, managers and boards of directors may wish to consider whether a shareholder- or stakeholder-centric executive compensation policy is most appropriate for achieving their desired organizational outcomes.
The broad question in our study is to what end do pay structures motivate executives? We demonstrate that disparity in executive pay, both vertical (between the CEO and the rest of the TMT) and horizontal (among the non-CEO executives), motivates executives to seek outcomes that are more narrowly aligned with shareholders, while lower pay disparity motivates executives to balance the interests of a broader set of stakeholders. Our empirical analysis shows that both vertical and horizontal pay disparity are harmful for CSP. Given the growing importance of stakeholder management in organizations, managers and boards of directors may wish to consider whether pay structures should be designed with a view to align executives more narrowly with shareholders, or to align them to balance a broader set of stakeholders for achieving their desired organizational outcomes.
Footnotes
Appendix
First stage regression.
| Variables(t–1) | Total vertical disparity | Short-term vertical disparity | Long-term vertical disparity | Total horizontal disparity | Short-term horizontal disparity | Long-term horizontal disparity |
|---|---|---|---|---|---|---|
| Capital investment activity | 0.019 | −0.175 | 0.151 | −0.541 | −1.284 | −6.344 |
| Firm size | 0.131 * | −0.123 ** | 0.118 | −0.712 | −0.403 | −1.371 |
| ROA | 0.353 * | −0.113 | 0.426 † | 0.801 | 2.206 | −1.432 |
| Board size | −0.013 | −0.019 * | −0.000 | 0.591 * | 0.193 | 0.722 * |
| Board independence | .793 *** | −0.036 | .872 *** | −6.821 * | −3.509 † | −16.395 *** |
| CEO duality | −0.012 | 0.052 † | −0.022 | 1.975 * | 0.459 | 2.752 * |
| CEO tenure | 0.004 | −0.003 | 0.004 | 0.472 *** | 0.286 *** | .517 *** |
| Immediate slack | 0.024 | 0.001 | 0.042 | 0.934 | 1.376 * | 1.540 |
| Executives age | 0.033 | 0.236 | 0.098 | 9.459 | 5.898 | 14.825 |
| Female executives | 0.271 † | −0.334 * | 0.830 ** | −2.414 | −2.800 | −2.061 |
| Post SOX | 0.210 *** | 0.042 | .342 *** | −2.497 ** | −1.031 | −5.105 *** |
| Tobin’s Q | 0.044 † | −0.009 | 0.052 † | 0.581 * | −0.063 | 0.016 |
| Industry total vertical disparity | 0.103 ** | 1.812 ** | ||||
| Industry short-term vertical disparity | 0.330 *** | 0.723 | ||||
| Industry long-term vertical disparity | 0.202 *** | 0.756 | ||||
| Industry total horizontal disparity | −0.002 | 0.072 | ||||
| Industry short-term horizontal disparity | −0.001 | 0.196 ** | ||||
| Industry long-term horizontal disparity | 0.011 *** | .194 *** | ||||
| Total vertical disparity | 0.510 | |||||
| Short-term vertical disparity | −0.083 | |||||
| Long-term vertical disparity | 0.281 | |||||
| Total horizontal disparity | 0.000 | |||||
| Short-term horizontal disparity | −0.000 | |||||
| Long-term horizontal disparity | −0.000 | |||||
| Constant | 5.927 *** | 4.571 *** | 4.884 *** | 5.423 | 12.862 * | 29.834 ** |
| Observations (N) | 8567 | 8567 | 8567 | 8567 | 8567 | 8567 |
| F | 9.17 *** | 13.34 *** | 11.33 *** | 5.83 *** | 4.48 *** | 8.20 *** |
| R-square | 0.0407 | 0.0474 | 0.0424 | 0.0310 | 0.0180 | 0.0320 |
ROA: return on assets; CEO: chief executive officer.
All models include dummy variables for year; dummy variables were omitted for clarity.
p < .1; *p < .05; **p < .01; ***p < .001.
Funding
This research received no specific grant from any funding agency in the public, commercial, or not-for-profit sectors.