
Abstract
Multimarket competition theory states that if two firms coincide in multiple markets, the level of rivalry between them changes, which, in turn, affects their performance. This article extends this perspective in two ways. We first propose that multimarket competition affects not only the rivalry levels of multimarket rivals but also the rivalry experienced by the other firms present in the markets in which these multimarket rivals operate. We refer to these indirect effects as multimarket competition spillovers, and we propose that they affect firm performance. Second, we conjecture that multimarket competition spillovers are more intense when the firm that creates the spillover and the one that receives it belong to the same strategic group. Our analyses of the Spanish retail banking sector show that the performance of firms is significantly affected by the multimarket competition spillovers of rivals that belong to the same strategic group.
Introduction
The study of competitive dynamics has become one of the core research programs in strategic management in recent decades (see Chen and Miller, 2012). 1 This literature has greatly expanded our understanding of the causes and consequences of interfirm rivalry. A key feature of competitive dynamics research is that it focuses on how a focal firm is influenced by its own competitive interdependences. Interdependences trigger (or prevent) competitive escalation between a focal firm and its direct competitors, which, in turn, damages (or enhances) its performance. In this article, we change the traditional focus of competitive dynamics research and explore the extent to which the performance of the focal firm is influenced by the competitive interdependences of its rivals. Our main argument is that rivals’ competitive interdependences generate spillovers that are transmitted to the focal firm in terms of rivalry. We analyze the generation of competitive spillovers and the mechanisms that determine their transmission to the performance of the focal firm.
To explain the generation and transmission of the competitive spillovers, we focus on two research streams of the competitive dynamics literature: multimarket competition theory and strategic group theory. Multimarket competition theory explores how firms that compete against each other across several markets alter their competitive behavior. Previous research has characterized the relationship between multimarket contact and rivalry as inverted U-shaped: at low levels of multimarket contact, there is an increase in rivalry as multimarket contact increases. Rivalry reaches its maximum at medium levels of multimarket contact. Finally, at high levels of multimarket contact, firms mutually forbear, reducing rivalry (Fuentelsaz and Gómez, 2006; Haveman and Nonnemaker, 2000; Korn and Baum, 1999). This is because the first multimarket contacts build competitive tension and increase rivalry (Baum and Korn, 1996; Chen, 1996; Chen et al., 2007). As the number of contacts grows, multimarket rivals become aware of the risk that competitive actions in a given market may result in multimarket retaliation. Consequently, they refrain from attacking each other, resulting in lower levels of rivalry (Karnani and Wernerfelt, 1985; Yu and Cannella, 2013).
Strategic group theory explores an intermediate level of industry analysis that is based on groups of firms that develop similar strategies along a set of relevant strategic dimensions (Caves and Porter, 1977; Dranove et al., 1998; Porter, 1980). These firms tend to be affected by the same contingencies and respond to them in similar ways, reinforcing their similarities over time (Barney and Hoskisson, 1990; Fiegenbaum and Thomas, 1995; Nohria and Garcia-Pont, 1991). This research stream has shown that the patterns of rivalry differ within and between strategic groups (Barney and Hoskisson, 1990; Caves and Porter, 1977; Cool and Dierickx, 1993; Mas-Ruiz et al., 2014; Peteraf, 1993).
We integrate these two theories to explain the generation of a particular type of competitive spillovers—multimarket competition spillovers—and their uneven effect on the firms that operate in the market. By multimarket competition spillovers, we refer to the consequences that multimar-ket competition between a given pair of firms has on the level of rivalry experienced by other firms operating in the same markets. Accordingly, we propose that multimarket competition dynamics affect a focal firm in two different ways. First, in the traditional way, by influencing rivalry levels between the focal firm and its direct rivals. This effect depends on the multimarket contacts of the focal firm with its direct rivals (its “first-degree” multimarket contacts). Second through the multimarket interdependences of these direct rivals with their own competitors, which we call multimarket competition spillovers. This effect depends on the multimarket contacts of these direct rivals with their own competitors (“second-degree” multimarket contacts). From this perspective, multimarket competition spillovers may affect both single and multimarket firms. The difference is that whereas multimarket firms receive the effects of “first-degree” and “second-degree” multimarket contacts, single-market firms are only affected by multimarket competition spillovers resulting from their “second-degree” multimarket contacts.
An example of the two effects may be provided by an analysis of the three main United States automakers, General Motors, Ford, and Chrysler. These firms compete with each other across a number of geographical (e.g. North America, Europe) and product (e.g. Coupe, Sedan, SUV) markets (Upson and Ranft, 2010). Interactions between pairs of these firms will be affected by the traditional approach to multimarket competition dynamics. Depending on their mutual “first-degree” multimarket contacts, each of these automakers will increase or reduce their intensity of rivalry. However, their interactions in any of their common markets will also affect the third automaker. For instance, the introduction of a new coupe in Europe by General Motors to harm Ford will also affect Chrysler in that specific market. Consequently, Chrysler will be affected by multimarket competition dynamics between Ford and General Motors. In the terms used in this article, “first-degree” multimarket contacts between Ford and General Motors are “second-degree” multimarket contacts from the perspective of Chrysler. These second-degree multimarket contacts alter rivalry between Ford and General Motors, in turn affecting the competitive conditions faced by Chrysler.
We also argue that the intensity of multimarket competition spillovers will depend on the strategic group structure of the industry. Aggressive behavior focused on a given firm will be designed to be especially harmful to it. Other firms operating in the attacked market that belong to the same strategic group as the attacked firm will also be significantly harmed by these competitive actions because they depend on similar resources and market segments. In a context of multimarket competition, this means that competitive spillovers are more easily transmitted if a focal firm and its rival are members of the same strategic group. For instance, in the example above, the coupe introduced by General Motors would be likely to include features similar to those of Ford’s coupes or that are especially valued by its customers. Other automakers operating in Europe and that belong to the same strategic group as Ford, such as Mazda and Nissan (Nohria and Garcia-Pont, 1991), would also be significantly harmed by the introduction of the new coupe. In contrast, automakers that belong to a different strategic group (e.g. low-end automakers such as Dacia and Skoda) would be less affected by this introduction. Accordingly, we expect that the strategic group structure will determine the intensity of multimarket competition spillovers.
Our article contributes to the competitive dynamics literature in three ways. First, it increases our knowledge of how a focal firm is affected by interdependences among its rivals and its rivals’ competitors. Understanding rivals’ interdependences helps firms to comprehend their competitors and to maximize the “chances of outcompeting the rival” (Chen et al., 2007: 761). We empirically demonstrate the existence of competitive spillovers, that is, that the competitive interdependences of rivals affect the focal firm. The existence of competitive spillovers shows the importance of understanding rivals’ relationships with their competitors when firms formulate their competitive strategies (Porter, 1980; Tsai et al., 2011). Second, we propose that, in the context of multimarket competition, competitive spillovers have a U-shaped effect on focal firm performance. Traditionally, multimarket contact has been used to understand interdependences between a focal firm and its rivals (Baum and Korn, 1996; Gimeno, 1999). Studying the effect of second-degree multimarket contact on focal firm performance improves our knowledge of multimarket contact dynamics. Finally, we bring together insights from multimarket competition theory and strategic group theory to further explore the dynamics of multimarket competition spillovers. These two streams of research have been used to understand the effects on performance of multimarket contact among firms surrounded by mobility barriers of different heights (Guedri and McGuire, 2011). We take a different perspective and argue that the strategic group structure of the industry determines the extent to which different firms are affected by multimarket competition spillovers. We propose that managers should pay special attention to the multimarket contacts of their rivals in their strategic group when formulating their competitive strategies.
Literature review
Multimarket competition theory
Multimarket competition refers to a situation in which two firms compete with each other across several markets (Karnani and Wernerfelt, 1985). Several researchers have argued that the relationship between multimarket contact and the intensity of rivalry shows an inverted U shape (Baum and Korn, 1999; Fuentelsaz and Gómez, 2006; Haveman and Nonnemaker, 2000; Stephan et al., 2003). The first multimarket contacts increase rivalry levels because the potential for retaliation is low compared to the competitive tension that results from increased market overlap. However, as the number of contacts increases, firms realize their interdependences and the high risk of retaliation. When a certain multimarket contact level is reached, the risk of broad retaliation becomes more important than competitive tension with multimarket rivals, and as a result, additional multimarket contacts reduce rivalry. Taking these situations into account, rivalry is expected to be low at low and high levels of multimarket contact, while for intermediate levels of multimarket contact, rivalry is expected to be high. Evidence of an inverted U shape relationship between multimarket contact and rivalry has been found for market entry rates (Baum and Korn, 1999; Fuentelsaz and Gómez, 2006; Haveman and Nonnemaker, 2000; Stephan et al., 2003) and growth rates (Haveman and Nonnemaker, 2000). The corresponding U-shaped relationship between multimarket contact and profitability has also been documented in previous research (Fuentelsaz et al., 2014).
The bulk of the literature on multimarket competition focuses on the consequences of multimarket contact between a focal firm and its rivals (Baum and Korn, 1996; Gimeno, 1999). However, multimarket competition between pairs of firms may also affect the rivalry to which the other firms that operate in the same markets are subject. Previous research has shown that single-market banks in the US banking industry benefited from the presence of large multimarket banks in the form of lower rates paid for deposits (Hannan and Prager, 2004), higher fees (Hannan, 2006), and higher profitability (Hannan and Prager, 2009). Similarly, Ghemawat and Thomas (2008) found a positive relationship between the market shares held by the largest multimarket firms in the cement industry and cement prices, and Haveman and Nonnemaker (2000) found that single-market savings banks in California showed greater entry rates into markets characterized by high levels of multimarket contact, which is interpreted as evidence of more favorable conditions in those markets.
Although the evidence revised above suggests that multimarket competition spillovers may reduce rivalry, other researchers have observed the opposite. D’Aveni (2002) discussed how the three largest US air carriers restrained from aggressive behavior against each other in the core markets in which they compete and focused their competitive efforts against second-tier airlines. Baum and Korn (1999) found that commuter air carriers in California entered markets in which they had relatively low multimarket contacts and avoided markets of important multimarket rivals. These findings can be interpreted as aggressive behavior being diverted from multimarket rivals to other rivals with whom there are lower multimarket interdependences. In these cases, multimarket competition spillovers produce an increase in rivalry.
In sum, previous research has identified empirical patterns that are consistent with the existence of multimarket competition spillovers. However, it is not possible to confirm whether these spillovers increase or reduce the level of rivalry felt by firms. These conflicting findings may be due to two main reasons: (1) the non-monotonic effect of multimarket competition on rivalry and (2) the strategic group structure of the industry.
Strategic group theory
Firms within industries are heterogeneous in terms of the strategies they use to create competitive advantage. So, an industry may be defined as a collection of strategic groups (Caves and Porter, 1977; McNamara et al., 2003). A strategic group is a group of firms pursuing similar strategies along different strategic dimensions (Porter, 1980). These firms have similar scopes and resources (Cool and Schendel, 1987). Strategic groups are important to understand competitive dynamics because they determine how rivalry is distributed within an industry. Previous literature has shown that the intensity of rivalry differs between and within strategic groups (Barney and Hoskisson, 1990; Caves and Porter, 1977; Cool and Dierickx, 1993).
Strategic group theory initially focused on strategic similarities among firms within a strategic group and barriers to mobility were seen as the centripetal force that kept firms bound to their strategic groups (Caves and Porter, 1977; Porter, 1980). Researchers have since demonstrated that there are many other forces that keep firms in the same strategic group, including dependence on common resource bases (Mehra, 1996; Mehra and Floyd, 1998), the existence of an identity shared by the members of the group (Peteraf and Shanley, 1997; Reger and Huff, 1993), or shared mental models of competition (Porac et al., 1989, 1995). The similarities among group members are also translated into their competitive behavior and strategic adaptation, as these firms take each other as reference focal points and coevolve in their strategic behavior (Fiegenbaum and Thomas, 1995; Nair and Filer, 2003; Nair and Kotha, 2001).
An important point to our theoretical framework is that the homogeneity among firms within a strategic group in terms of strategies, resources, identities, mental models, and evolutionary patterns makes them vulnerable to similar environmental contingencies. Firms of the same strategic group occupy a similar niche (Carroll and Swaminathan, 2000; Hannan and Freeman, 1977), and consequently, “they are likely to be affected in the same way by external shocks” (Nohria and Garcia-Pont, 1991: 107).
Previous literature has considered how strategic groups and multimarket competition relate to each other. Guedri and McGuire (2011) find that mobility barriers and multimarket contacts are complementary devices in the promotion of coordination between members of the same group. Barnett (1993) shows that multimarket competition tends to occur within but not between strategic groups. Mas-Ruiz and Ruiz-Moreno (2011) argue that multimarket competition could be one of the mechanisms that explains within-group rivalry levels. These articles discuss how strategic groups and multimarket competition interact to shape direct competitive interdependences. In contrast, in this research, we analyze the role of strategic groups in the transmission of competitive spillovers coming from multimarket competition.
Hypotheses development
The review above shows that multimarket contact determines the interdependences between a focal firm and its rivals. The literature shows that “first-degree” multimarket contacts have an inverted U-shaped effect on rivalry (Baum and Korn, 1999; Fuentelsaz and Gómez, 2006; Haveman and Nonnemaker, 2000; Stephan et al., 2003). It also provides some evidence consistent with the existence of multimarket competition spillovers, although with conflicting results. In this section, we hypothesize how multimarket competition spillovers are generated and how they affect the performance of the focal firm. Therefore, we focus on the consequences of “second-degree” multimarket contacts. We also argue that the intensity of multimarket competition spillovers depends on whether the focal firm and its rivals belong to the same strategic group.
Multimarket competition spillovers and firm performance
Rivalry is manifested through different actions, including price changes, marketing and promotional campaigns, new product introductions, market entry, capacity additions, legal actions, and signaling actions (Baum and Korn, 1996; Ferrier et al., 1999; Young et al., 1996). Some of these actions are directed against a particular rival and their effect is restricted to that firm. For example, legal actions, such as patent litigation, only affect the targeted rival (or set of rivals). In contrast, many other competitive actions have an effect within specific product and market contexts (Gimeno and Jeong, 2001). For instance, a price cut may attract customers from any firm in the market. These competitive actions affect all the firms that operate in the product–market segment, even those that were not the intended targets of the action. In this vein, Derfus et al. (2008) found that the number of actions in an industry had a negative effect on the performance of a focal firm, irrespective of whether it was the intended target or not.
This implies that, to understand how multimarket dynamics affect a focal firm, it is important to not only consider the effect of first-degree multimarket contact but also the spillovers that are generated by second-degree multimarket contacts. Second-degree multimarket contacts will trigger multimarket competition dynamics among the rivals of the focal firm and these rivals’ competitors. These multimarket competition dynamics will influence their mutual levels of rivalry and their exchanges of competitive actions. As competitive actions alter competitive conditions in the market, other firms operating in those markets will also face variations in the level of rivalry to which they are subject. This is what we have termed multimarket competition spillovers.
Previous research has shown that multimarket contact has an inverted U-shaped effect on rivalry (Baum and Korn, 1999; Fuentelsaz and Gómez, 2006; Haveman and Nonnemaker, 2000). Since competitive actions affect not only the targeted firm but also other firms operating in the same markets, second-degree multimarket contact will also have an inverted U-shaped effect on the rivalry felt by the focal firm. Hence, multimarket competition spillovers can be rivalry-increasing or rivalry-reducing, depending on the level of second-degree multimarket contact. They will have a small rivalry-increasing effect at low levels of second-degree multimarket contact. At medium levels the rivalry-increasing effect will be high. Finally, at high levels of second-degree multimarket contact, competitive spillovers will be rivalry-reducing.
Rivalry is detrimental to firm performance (Scherer and Ross, 1990). Therefore, multimarket competition spillovers will also influence focal firm profitability. When multimarket competition spillovers have a rivalry-increasing effect, they will reduce the performance of the focal firm. Conversely, when multimarket competition spillovers have a rivalry-reducing effect, they will increase focal firm performance. Since multimarket competition spillovers are inverted U-shaped and rivalry is inversely related to performance, we predict a U-shaped relationship between second-degree multimarket contact and the performance of the focal firm:
Hypothesis 1. Second-degree multimarket contacts have a U-shaped effect on focal firm performance.
Strategic groups and multimarket competition spillovers
Our second hypothesis integrates multimarket competition theory and strategic group theory to propose that the intensity of multimarket competition spillovers depends on the configuration of the industry into strategic groups. Previous literature has shown that the intensity of rivalry differs between and within strategic groups (Barney and Hoskisson, 1990; Caves and Porter, 1977; Cool and Dierickx, 1993). In this article, we take a different stance and argue that the intensity of multimarket competition spillovers will be different between and within strategic groups. Therefore, the consequences of second-degree multimarket contacts on performance will also differ.
Firms within a strategic group are homogeneous across a number dimensions and organizational traits, such as resource endowments, strategic configurations, market niches, organizational identities, and cognitive structures (Caves and Porter, 1977; Mehra, 1996; Mehra and Floyd, 1998; Peteraf and Shanley, 1997; Porac et al., 1989, 1995; Porter, 1980; Reger and Huff, 1993). Conversely, firms that belong to different strategic groups are likely to be heterogeneous across many of these dimensions. As a result, external contingencies in an industry will have a more homogeneous effect on firms of the same strategic group than on firms of different strategic groups (Nohria and Garcia-Pont, 1991). For instance, the appearance of a new production technology will have a different effect on each strategic group but a similar effect within a group (Schroeder, 1990). Changes in the demand characteristics of a given market segment will more directly affect the firms that target this segment (Carroll, 1985).
Our contention is that rivalry directed against a given firm will be designed to be effective against its specific strategic configuration. Therefore, the indirect effects resulting from these actions will also be especially harmful to that strategic configuration. Conversely, mutual forbearance between firms reduces the frequency of competitive actions directed against each other. The actions prevented would have been especially harmful to the strategic configuration of the targeted firm. As a consequence, firms with the same strategic configuration will benefit more from this lack of aggressive behaviors. This reasoning implies that when a firm is involved in competitive relationships, firms that belong to the same strategic group will be more sensitive to these indirect effects. Competitive spillovers stemming from a rival of the same strategic group as the focal firm will be more intense than competitive spillovers coming from a rival that belongs to a different strategic group. For instance, a new financial product aimed at attracting savings from households and small businesses will be more harmful to the banks that also target these segments. In contrast, banks that target large multinationals will not be significantly affected.
Following our first hypothesis, second-degree multimarket contact levels have an inverted U-shaped effect on the rivalry experienced by the focal firm, which results in a U-shaped effect on its performance. Our arguments in this second hypothesis imply that multimarket competition spillovers, and the resulting effect on focal firm performance, will be more intense in the case of competitive spillovers generated by rivals that belong to the same strategic group as the focal firm than those generated by rivals that belong to a different strategic group. Empirically, this means that the downward slope part of the U shape predicted in our first hypothesis will be steeper in the case of second-degree multimarket contacts from rivals of the same strategic group. Similarly, the upward slope part of the U shape predicted in the first hypothesis will be steeper when second-degree multimarket contacts are generated by rivals of the same strategic group. Therefore, our second hypothesis can be formulated as follows:
Hypothesis 2. Second-degree multimarket contacts generate a more intense (i.e. steeper U-shaped) effect on focal firm performance when the focal firm and its rivals belong to the same strategic group than when they belong to different strategic groups.
Empirical analysis
Research context, sample, and data sources
This research is conducted in the context of the Spanish retail banking sector between 1999 and 2007. The banking sector has been a common research setting for multimarket competition theory (e.g. Barnett et al., 1994; Fuentelsaz and Gómez, 2006; Haveman and Nonnemaker, 2000; Heggestad and Rhoades, 1978). Therefore, we have a consistent background against which we can compare our findings. Existing evidence demonstrates that multimarket dynamics are economically relevant in this setting because they have a significant impact on competitive behavior and financial performance. Multimarket competition spillovers are a byproduct of conventional multimarket competition dynamics. Therefore, multimarket dynamics are a necessary condition for a competitive spillover.
Two characteristics of the Spanish retail banking sector make it especially suitable to our research. First, despite being a single country, it is possible to identify independent submarkets that are stable over time. Banks carry out their activities through networks of branches that are located in a large number of different geographical locations. Retail banking markets are geographically bounded (Radecki, 1998; Simons and Stavins, 1998). As a result, each of these locations is an independent submarket with little or no cross-elasticity of demand with other locations. This implies that retail banking firms have the opportunity to design strategies to deal with the dynamics described in multimarket competition theory. Second, Spanish banking firms use different strategic approaches to the provision of financial services. The existence of strategic groups with heterogeneous strategies has been previously documented in the sector (e.g. Zúñiga-Vicente et al., 2004). Consequently, the context is appropriate to analyze how strategic groups influence the intensity of multimarket competition spillovers.
The number of banks included in the sample fluctuates between 155 and 122, depending on the year. This fluctuation is mainly explained by mergers and acquisitions that took place over the period analyzed. The sample excludes banks that do not have more than four branches in any of the years because this is associated with extreme specialization and insignificant retail activities. Some of these organizations may still be of significant size in terms of assets, but, as they offer their products exclusively to certain types of customers (e.g. high-profile investment banking, banks of professional associations), they are not included in the sample. The sample also excludes certain banks that are identified as outliers in the analysis of strategic groups. As we will explain, we remove 12 banks from the sample following the BACON (Blocked Adaptive Computationally Efficient Outlier Nominators) procedure to identify outliers. These outliers are banks that provide financial services to specific collectives, branches of foreign banks whose main goal is the representation of the parent firm in Spain, and firms mainly focused on investment banking activities. As these banks do not strictly operate in the retail banking sector, their exclusion is appropriate.
The data used in this study have been collected from several sources. First, we obtained information on the address of every branch located in Spain from the Guia de la Banca, Cooperativas de Crédito y Cajas de Ahorro, which is published yearly by Editorial Maestre Ediban. It offers information about the location of each branch in the sector, allowing us to identify its address and ZIP code. Second, we obtained information on financial statements from yearbooks published by the different trade associations in the sector. Finally, information on market level factors and on other macroeconomic variables was obtained from the Statistical Bulletin of the Bank of Spain and from the National Institute of Statistics (Instituto Nacional de Estadística (INE)).
Identification of strategic groups
Strategic groups are one of the key elements of this research. The first step to identify strategic groups is to define the strategic configuration of each firm in the industry. Following the traditional approach in the strategic management field, we depict banking strategies as a function of firm scope and resource commitments (Cool and Schendel, 1987; Ferguson et al., 2000; Mehra, 1996). While decisions about scope include the choice of market segments, resource commitments involve the assignment of human, capital, and financial factors. In this research, the strategy of each firm is described through seven variables based on strategic scope and resource commitments. They have been employed in previous analyses of the Spanish banking sector (Fuentelsaz and Gómez, 2006; Prior and Surroca, 2006; Zúñiga-Vicente et al., 2004).
The strategic scope of a given bank is measured through the following five variables:
1. Commercial banking (Commercial loans/Financial investments). This ratio represents an orientation toward commercial banking. This strategic orientation is usually characterized by a high percentage of loans to households and small and medium-sized firms.
2. Investment banking (Portfolio of securities/Financial investments). This variable reflects orientation toward investments in stock markets. This strategic position is associated with having a high percentage of financial investments in the form of securities.
3. Institutional banking (Transactions with other financial entities and the public sector/Financial investments). This ratio captures operations with the financial system and supporting institutions. Firms that develop this kind of strategy tend to lend money to public institutions or to other financial entities.
4. Net position in the financial system (Net position in the financial markets/Total liabilities). This ratio reflects the extent to which a bank borrows from the interbank market. It captures the bank’s degree of trust in this market to obtain funds.
5. Traditional banking (Saving and deposits accounts of the private sector/Total liabilities). This variable measures the extent to which a bank obtains its funds from family savings. This approach corresponds to the traditional and conservative banking business. These banks get funds through classical financial products.
Resource commitment is captured through two ratios:
6. Human capital (Personnel expenses/Operating income). This variable captures the importance of human capital in the provision of financial services.
7. Risk commitment (Net insolvencies/Operating income). This measure proxies how firms commit their financial resources. It reflects loans with a low probability of being recovered.
Commercial, investment, and institutional banking variables refer to different ways of provi-ding financial services in the Spanish retail banking sector. Firms with a commercial orientation tend to lend funds to households and small- and medium-sized firms. Investment banking reflects the extent to which the bank operates in stock markets. Banks with an institutional banking orientation mainly lend money to public institutions or other banks. The other two variables of strategic scope, net position in the financial system and traditional banking, focus on the way in which banks obtain financial resources. While traditional entities use classical financial products to acquire funds, the variable net position in the financial system refers to firms that mainly borrow money from the interbank market. Each of these five different dimensions represents different strategies that require specific approaches. The other two variables reflect how the firm commits its resources. Human capital reflects the role of human resources in the provision of financial services and risk commitment describes how firms commit their financial resources.
After identifying the seven dimensions that summarize the strategic position of retail banking firms, we group these banks according to the similarities in their strategies. We use cluster analysis to assign each firm to one strategic group. Although this methodology is subject to some criticism (Barney and Hoskisson, 1990; Fiegenbaum and Thomas, 1990; Hatten and Hatten, 1987), it has been commonly used to identify groups of similar firms (Kim and Lee, 2002; Short et al., 2007). Following recent advice on improving the use of cluster analysis, before applying it we remove outliers from our sample and standardize all the variables reflecting banking strategies.
First, we use the BACON algorithm (Billor et al., 2000) to identify outliers in multivariate data. We identify 12 outliers. Following prior research (Bush and Sinclair, 1991; Ferguson et al., 2000), these outliers are removed from the sample before initiating the cluster analysis procedure. Second, we transform the seven strategic variables to a common scale via z-scores to avoid scale differences giving rise to a skewed identification of groups (Cool, 1985; Cool and Schendel, 1987). Our study identifies strategic groups in each of the years studied, 1999–2007.
To increase the validity of our analysis, we apply a two-step cluster analysis procedure (Ketchen and Shook, 1996). In the first step, we use hierarchical clustering to determine both the number of groups and their cluster centroids. We select Ward’s method as the agglomerative technique and measure the proximities between the variables using the squared Euclidean distance. In the second step, we employ the cluster centroids as seed points for a non-hierarchical clustering procedure (namely, K-means). As a consequence, the two-step cluster procedure eliminates problems associated with random seed setting.
We use the Calinski and Harabasz (1974) pseudo-F index to appropriately define the number of clusters. Milligan and Cooper (1984) evaluate 30 stopping rules, signaling the Calinski–Harabasz index as one of the best. The number of clusters is confirmed by using the visual inspection of tree-plots (Ketchen et al., 1993; Miles et al., 1993). On average, the analyses identify five strategic groups during the period. Finally, analyses of variance (ANOVAs) were used to test whether average performance levels persistently differ among strategic groups. We analyze differences in three performance measures: ordinary profitability, exploitation profitability, and profitability before taxes. The results confirm that the groups differ in their average profitability in each period, providing further support for the classification. 2
Variables
Dependent variable
Our dependent variable is financial performance. We measure it through an accounting-based measure, return on assets (ROA), which is computed as the ratio of profitability before taxes over total assets. ROA has frequently been used as a measure of financial performance when analyzing the banking sector (Barnett et al., 1994; Gómez et al., 2016; Roberts and Amit, 2003).
Independent variables
Our main independent variable is Second-degree MMC. This variable measures multimarket contacts between the rivals of the focal firm and their competitors. In order to calculate it, we first need to obtain the variable First-degree MMC, which measures the multimarket contacts of each firm with its direct competitors. First-degree MMC is calculated as the average number of markets where a firm coincides with its rivals, as follows
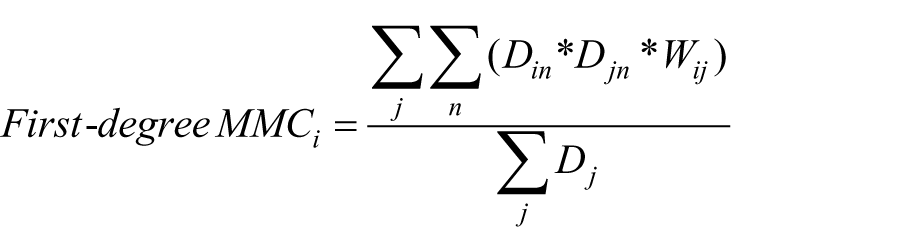
where j and n refer to a certain rival and geographical market, respectively; Din is a dummy variable that takes a value of 1 if firm i operates in market n, and 0 otherwise; and Djn is a dummy variable that takes a value of 1 if rival j operates in market n, and 0 otherwise. Dj is a dummy that takes a value of 1 for the rivals of firm i, that is, the firms that coincide in at least one market with firm i, and, finally, Wij is a weighting factor used to reflect that rivals are more important the larger the number of markets in which they coincide with the focal firm. We calculate Wij as follows

where the numerator reflects the number of markets in which firm i and firm j meet each other and the denominator is the number of markets in which firm i operates. Therefore, Wij reflects the percentage of markets of firm i where its rival j is present. The higher the value of Wij, the higher the competitive interdependence that firm i perceives from rival j.
It is important to note that we consider a firm as a rival only if it coincides with the focal firm in at least one geographical market. We define markets at the lowest level of disaggregation we can identify, the ZIP code. Each ZIP code identifies geographically proximate areas. Large towns have many codes, while a few small villages can be included in the same ZIP code. ZIP codes were initially established to organize postal services. Therefore, they identify geographic areas that are functionally proximate. Branches within a ZIP code present high cross-elasticity of demand and much lower (or null) cross-elasticity with branches in different ZIP codes. With this criterion, our sample covers up to 5901 different geographical markets.
The main theoretical variable, Second-degree MMC, is calculated as the sum of the First-degree MMC of each of the rivals of the focal firm, weighting each rival by the percentage of markets of the focal firm in which it is present. The variable is calculated as follows

where First-degree MMCj is the average number of markets in which direct rivals of the focal firm coincide with other firms. Again, we consider a firm as a direct rival only if it coincides with the focal firm in at least one geographical market. Wij is a weighting factor obtained as the percentage of markets of firm i where its rival j also operates. This variable concedes greater importance to rivals with whom the focal firm has a higher market overlap. The variable Second-degree MMC is introduced in its linear and quadratic forms to test hypothesis 1.
Hypothesis 2 states that multimarket competition spillovers generated by firms of the same strategic group are more intense than those coming from members of other groups. To test this hypothesis, we calculate two different variables. Second-degree MMC from rivals of the same strategic group is calculated as the variable Second-degree MMC, but only considering rivals that belong to the strategic group of the focal firm (on average, 34.3% of the rivals belong to the same strategic group). Second-degree MMC from rivals of a different strategic group captures the second-degree multimarket contacts of rivals that belong to a strategic group different from that of the focal firm. Again, we obtain this variable as the variable Second-degree MMC, but selecting only the rivals that belong to a different strategic group to the focal firm. Both variables are introduced in their linear and quadratic forms to test hypothesis 2.
Control variables
Our specification includes two controls at the market level. We include Credits, measured as the ratio between the aggregated credits of the provinces where the focal firm operates (in thousands of euros) and the population of these provinces. This variable proxies the demand for banking activities. Unemployment describes the unemployment rate in the provinces in which the bank operates. Note that both variables, credits and unemployment, are market controls at the provincial level, not at the ZIP code level. The lack of this information at the ZIP code level forces us to use the provincial level as a proxy.
We also include several firm-level controls. Inefficiency, measured as the ratio of exploitation costs over ordinary margin, and Risk, measured as the ratio of total credits over total assets, are specific variables of the banking sector (Carbó et al., 2003). We also control for Size, which is measured as the logarithm of total assets. In addition, given that, in the period analyzed, there were a number of mergers and acquisitions, our model includes the variables M&A and M&At+1. M&A is a dummy variable that takes the value 1 for firm–year observations involved in a merger or acquisition and 0 otherwise and M&At+1 is a dummy variable that takes the value 1 in the period after the merger or acquisition.
Our model also includes the variables First-degree MMC and Number of rivals. In accordance with the literature, First-degree MMC is included in quadratic form to capture a potential U-shaped effect (Fuentelsaz et al., 2014). We incorporate this variable into our model to control for the direct effect of multimarket competition dynamics on focal firm performance. Since most of the firms in our sample are multimarket firms (the average number of single-market firms in the period is 5.3), they are affected both by their direct multimarket contacts (First-degree MMC) and by the multimarket contacts of their direct rivals with other firms (Second-degree MMC). The variable Number of rivals captures the number of firms with which the focal firm competes in at least one geographical market. We also control for the financial performance of the focal firm in the previous year.
Finally, the model includes year dummies to control for contemporary shocks common to all the firms in the sector. All the variables are lagged one period to avoid simultaneity. Descriptive statistics and correlations between variables are shown in Table 1.
Descriptive statistics and correlations.
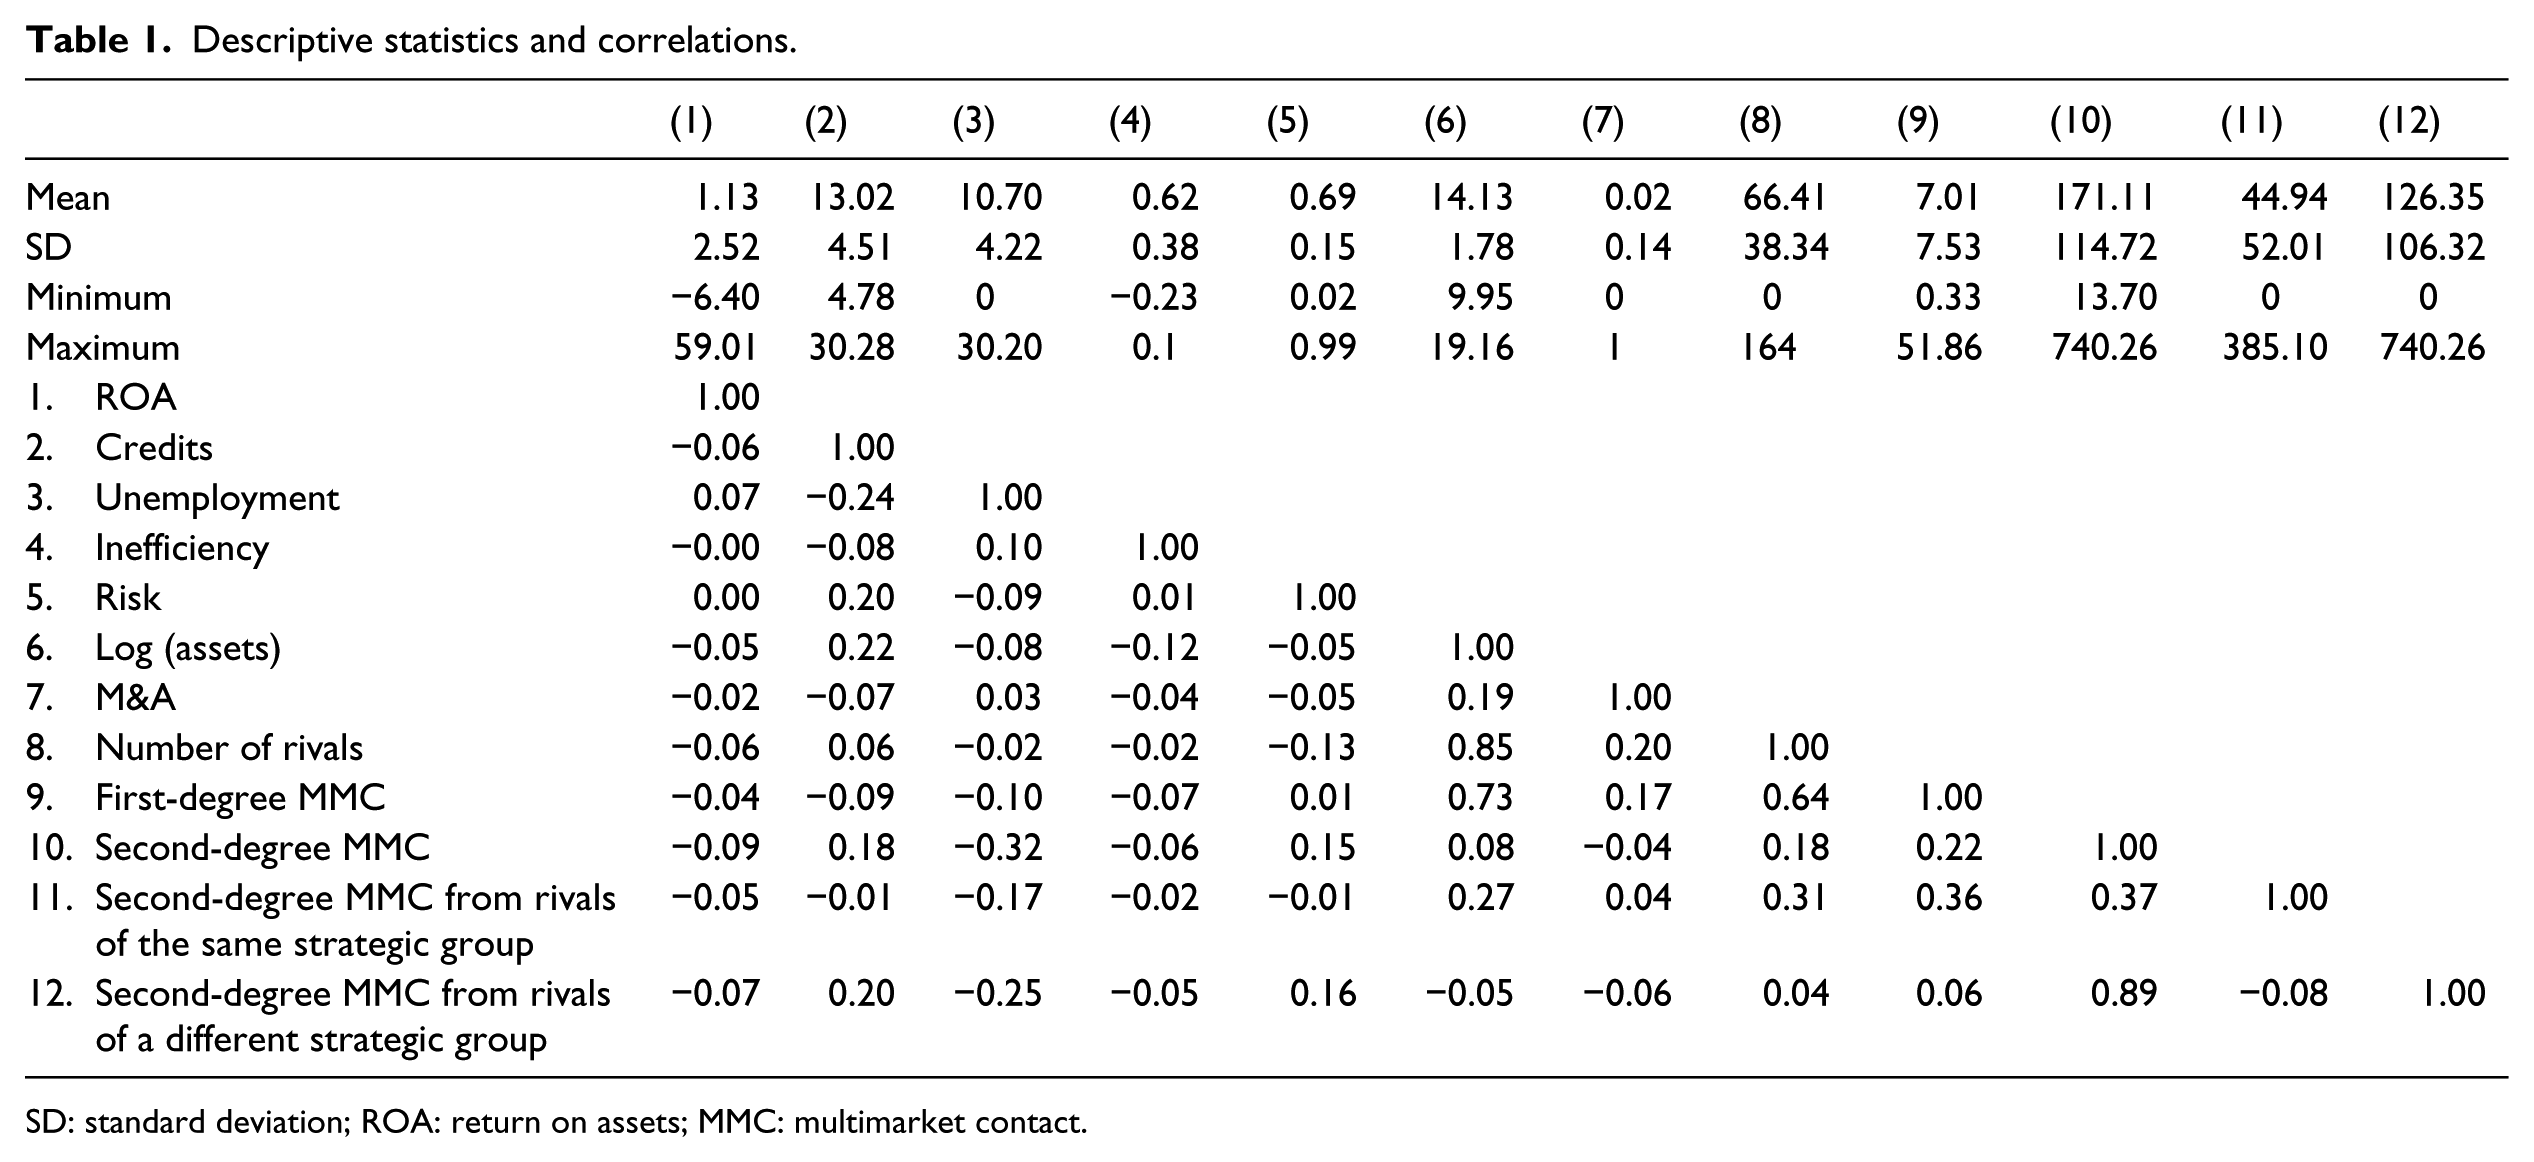
SD: standard deviation; ROA: return on assets; MMC: multimarket contact.
Model specification
To choose the appropriate specification, we run a number of tests. The Breusch–Pagan Lagrange Multiplier test rejects the null hypothesis that the variance of firm-level effects is zero, which is interpreted as evidence of individual effects (χ2 = 619.83 and p < 0.00 in the model that considers spillovers coming from all the rivals; χ2 = 660.22 and p < 0.00 in the model that differentiates the effect of multimarket spillovers according to strategic groups), and the Hausman test indicates the presence of fixed effects (χ2 = 56.41 and p = 0.00 in the model that takes into account multimarket spillovers of all the rivals; χ2 = 36.26 and p = 0.01 in the model that considers strategic groups). Consequently, we estimated a two-way fixed-effects model controlling for firm and year fixed effects.
An important concern in our sample is spatial correlation. The branches of some banks are spread all over Spain, but other banks have traditionally concentrated their activities in only a few regions. As a consequence, the latter may be subject to spatial correlation due to certain links with local institutions, local cultures, and differences in regulation or demographic features. In the presence of spatial correlation, ordinary least-squares (OLS) estimations are consistent, but the estimated standard errors may be biased. Driscoll and Kraay (1998) proposed a methodology based on the Newey and West (1987) estimator, which is robust to spatial correlation, as well as to hete-roskedasticity and serial correlation. Simulations have demonstrated that Driscoll and Kraay’s estimator performs significantly better than other standard error estimators in the presence of even moderate spatial correlation (Driscoll and Kraay, 1998; Hoechle, 2007). Therefore, in our estimations, we report Driscoll and Kraay (1998) standard errors.
Results
The results of our estimations are shown in Table 2. Column 1 includes the control variables of our model. In this first column, First-degree MMC is included only in linear form. The baseline model is globally significant, confirming the adequacy of our controls. First-degree MMC has no statistically significant effect on focal firm performance. Column 2 adds the squared effect of the variable First-degree MMC. In this estimation, First-degree MMC shows a U-shaped effect on firm performance. This result is consistent with the inverted U-shaped relationship between multimarket contact and rivalry found in previous research (Baum and Korn, 1999; Fuentelsaz and Gómez, 2006; Haveman and Nonnemaker, 2000).
The effect of multimarket competition spillovers on focal firm performance.
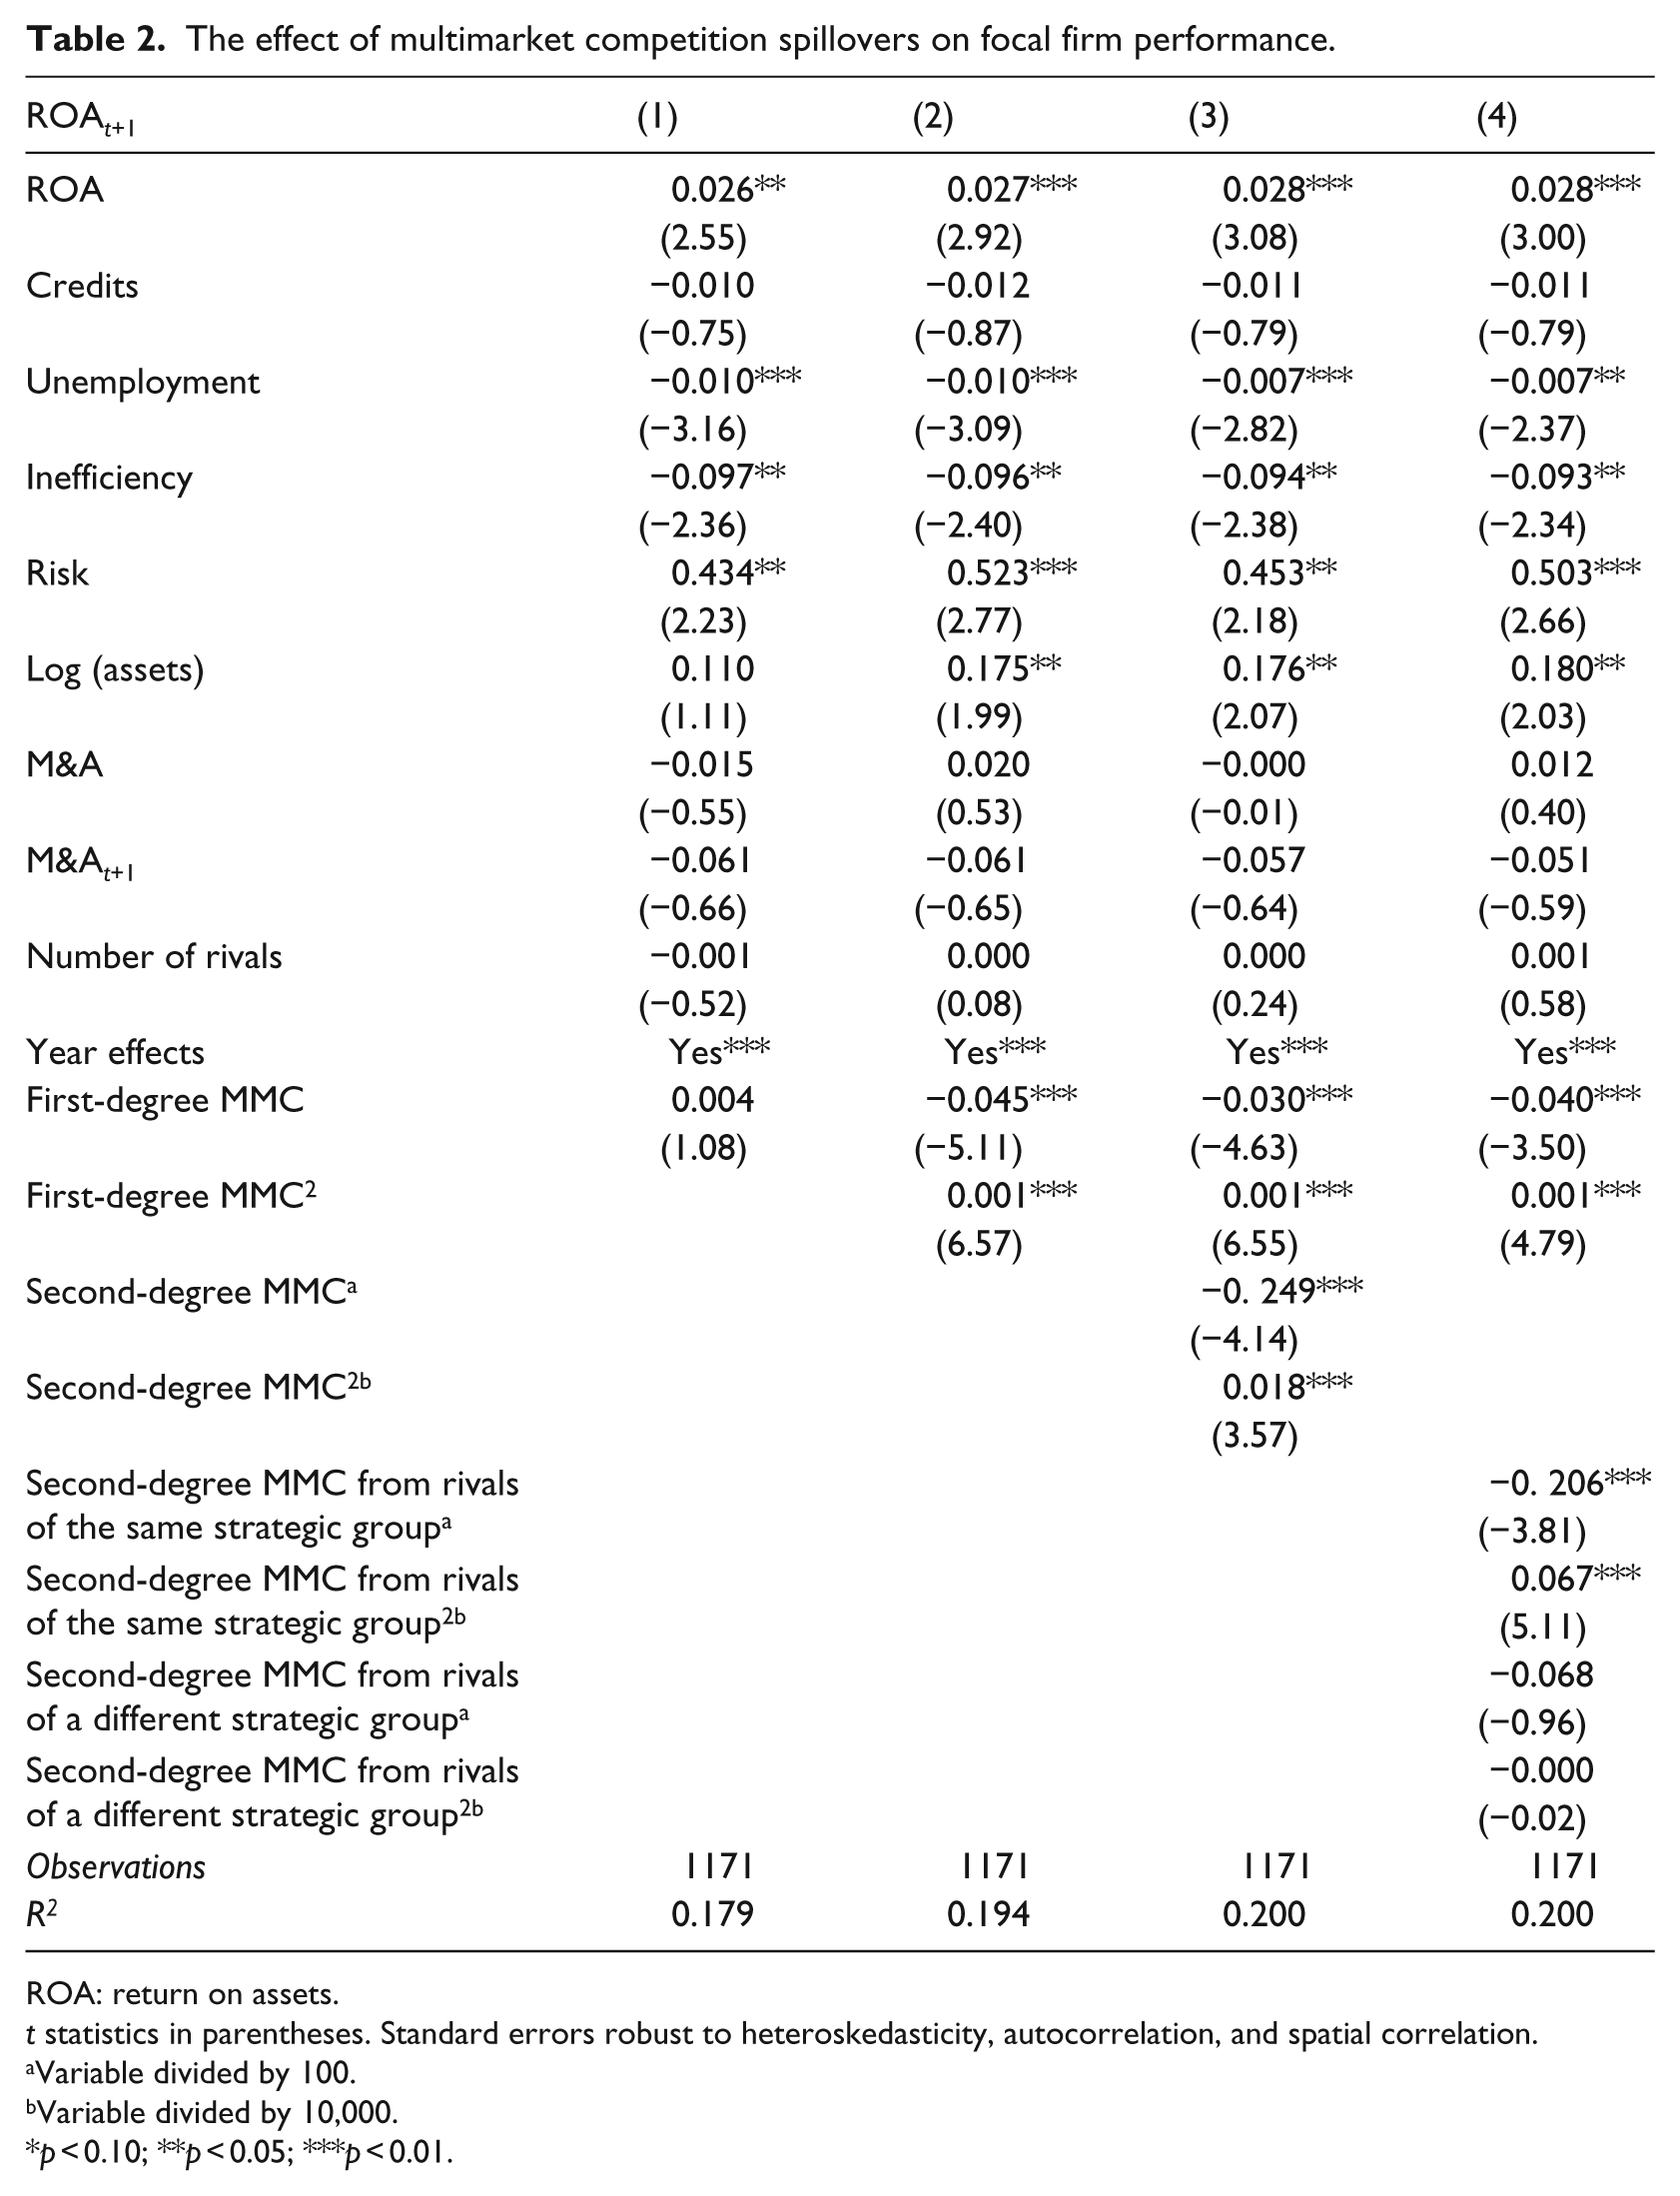
ROA: return on assets.
t statistics in parentheses. Standard errors robust to heteroskedasticity, autocorrelation, and spatial correlation.
Variable divided by 100.
Variable divided by 10,000.
p < 0.10; **p < 0.05; ***p < 0.01.
Following the indications of Haans et al. (2016) to test for a U-shaped effect, we check whether (1) the inflection point falls within the range of the variable First-degree MMC, and (2) the slope of the U shape is negative for low values of the variable and positive for high values. 3 The inflection point corresponds to the value 24.14, and the 95% confidence interval of the inflection point belongs to the range of the variable. The slope has the expected sign and is statistically significant at the maximum and minimum values of the variable. Therefore, the U-shaped relationship is statistically confirmed. The existence of multimarket contact dynamics is a necessary condition for multimarket competition spillovers to exist. If multimarket competition were not significant in this context, we could not expect multimarket interdependences to alter competitive behavior and competitive spillovers to exist. In columns 3 and 4, we test our hypotheses regarding multimarket competition spillovers.
Column 3 introduces the direct and squared effect of Second-degree MMC. Hypothesis 1 states that multimarket competition spillovers have a U-shaped effect on the performance of the focal firm. Column 3 shows that the parameter of the direct effect of Second-degree MMC is negative (β = −0.249; p < 0.01) and that the parameter of its squared effect is positive (β = 0.018; p < 0.01). These parameters are consistent with a U-shaped effect. The inflection point of the variable is reached at value 708.36, and the 95% confidence interval of the inflection point is contained in the range of the variable observed in the sample. The slope of the curve is negative and statistically significant at low values of the variable and positive and statistically significant at high values. Therefore, the U shape of the effect is statistically confirmed and hypothesis 1 is supported.
Hypothesis 2 states that multimarket competition spillovers should be more intense when they come from rivals of the same group than from rivals of a different group. To test hypothesis 2, in column 4 we distinguish between the competitive spillovers generated by rivals of the same group and those generated by rivals of different strategic groups. We include the variables Second-degree MMC from rivals of the same strategic group and Second-degree MMC from rivals of a different strategic group. To test the U-shaped effect, we include a direct and a quadratic effect. The variable Second-degree MMC from rivals of the same strategic group presents a negative direct effect (β = −0.206; p < 0.01) and a positive quadratic effect (β = 0.067; p < 0.01). The inflection point corresponds to the value 153.02 of the variable, with its 95% confidence interval contained in the range of the sample. The slope of the curve has the expected sign and is statistically significant at extreme values of the variable. These results lend statistical support for a U-shaped effect. In the case of Second-degree MMC from rivals of a different strategic group, the parameters are not statistically significant. Therefore, we find no evidence of competitive spillovers in the case of rivals from a different strategic group. 4
Our finding that only rivals of the same strategic group generate multimarket competition spillovers can be interpreted as evidence supporting hypothesis 2. However, we can formally test hypothesis 2 by comparing the slope of the curves that would correspond to the parameters obtained in the estimations. For hypothesis 2 to be supported, at low values of the variable, the negative slope should be greater (i.e. more negative) for Second-degree MMC from rivals of the same strategic group than for Second-degree MMC from rivals of a different strategic group. Conversely, at high values of these variables, the slope should be greater (i.e. more positive) for the variable Second-degree MMC from rivals of the same strategic group. The difference between the two slopes is significant and in the expected direction. Slopes are steeper for the spillovers generated by rivals of the same strategic group, which lends statistical support for hypothesis 2.
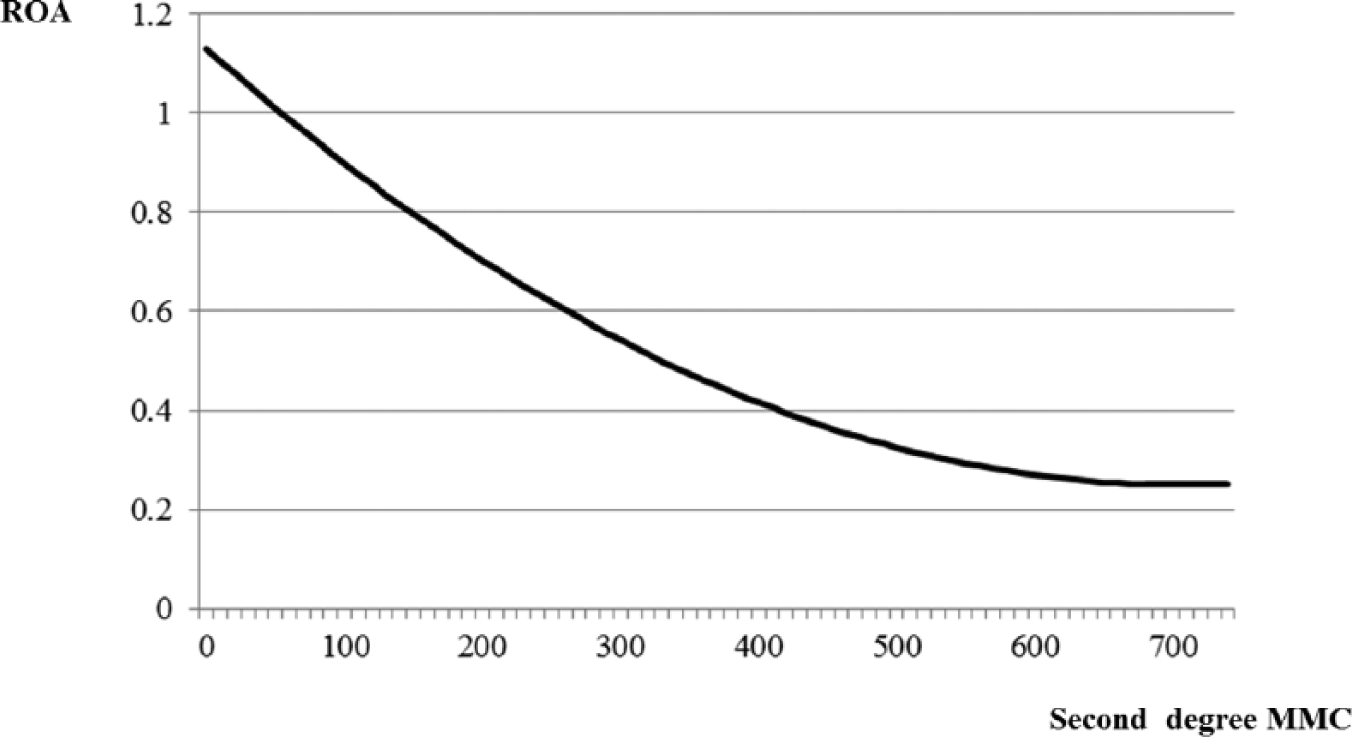
Figures 1 and 2 show the economic relevance of multimarket competition spillovers. The figures represent profitability for an average bank in the sample for different levels of multimarket competition spillovers. The horizontal axis represents Second-degree MMC. Figure 1 shows aggregate Second-degree MMC, that is, irrespective of the strategic group or rivals. At the mean value of Second-degree MMC, there is a negative effect of −0.375 percentage points. At the inflection point, which marks the most harmful spillover that we identify in the sample, there is a negative effect of −0.881 percentage points. These figures can be compared with the average profitability in the sample, which is of 1.130 percentage points. Consequently, multimarket competition spillovers can significantly damage the profitability of the firms in the sample. Another interesting feature of multimarket competition spillovers that can be seen in Figure 1 is that, despite the positive slope at the higher end of the distribution, the aggregate impact is still negative. Therefore, in the sample, no firm seems to benefit from the spillovers.
Second-degree MMC effect on firm performance.

Second-degree MMC from rivals of the same strategic group effect on firm performance.
Figure 2 focuses on multimarket competition spillovers arising from rivals of the same strategic group. For the mean value of Second-degree MMC from rivals of the same strategic group, there is a negative impact of −0.079 percentage points, and at the inflection point, the impact is of −0.157 percentage points. Interestingly, for the highest values of the variable, we find positive values. For values of Second-degree MMC from rivals of the same strategic group of 306 or above, the focal firm receives a positive impact from multimarket competition spillovers generated by rivals of the same strategic group, and at the highest value of the variable, we find an aggregate positive impact of 0.208 percentage points. Therefore, when distinguishing spillovers according to the strategic group of the rival, we find an economically relevant positive effect on firm performance.
Discussion
This research analyzes the existence of multimarket competition spillovers and the extent to which their intensity depends on the strategic group structure of the industry. Our findings show that multimarket competition dynamics among firms have an indirect impact on focal firm performance. In particular, we find that multimarket competition spillovers have a U-shaped influence on focal firm performance. Focal firms with low or high levels of second-degree multimarket contact perform better than those with intermediate levels. This research also shows how the sor-ting of firms into strategic groups influences the intensity of multimarket competition spillovers. We find that rivals belonging to the same strategic group as the focal firm generate significant multimarket spillovers. These multimarket spillovers have a U-shaped effect on performance. However, the second-degree multimarket contacts of rivals of different strategic groups have no significant effect on focal firm performance. Thus, our results show that similarity in the market positions of a focal firm and its rivals is a necessary requirement for the transference of multimar-ket competition spillovers.
Our results contribute to the reconciliation of conflicting empirical evidence about the indirect effects of multimarket competition. Several scholars have observed indirect effects of different sign (Ghemawat and Thomas, 2008; Hannan and Prager, 2004, 2009; and Haveman and Nonnemaker, 2000 vs Baum and Korn, 1999 and D’Aveni, 2002). We conciliate their conflicting findings by showing that multimarket competition spillovers have a U-shaped effect on firm performance, so multimarket competition spillovers may be beneficial or harmful depending on a focal firm’s second-degree multimarket contacts. Therefore, to appropriately understand multimarket competition spillovers, it is important to assess the part of the U-shaped relationship between multimarket contact and rivalry in which these rivals are located.
Another contribution of this research is related to the way in which strategic groups influence spillovers. Many scholars have advocated strategic groups as an important mechanism for understanding strategic behavior, competition, and differential firm performance in an industry (Hatten and Hatten, 1987; Porac et al., 1995; Porter, 1979). Our results show that strategic groups are also key elements to understand spillovers that come from multimarket competition and that multimarket competition spillovers are localized within strategic groups. We find that multimarket competition between firms has important consequences on the other firms that operate in the same markets using a similar strategic configuration (i.e. firms of the same strategic group). However, multimarket competition spillovers seem to be irrelevant for firms that develop other strategies (i.e. firms of a different strategic group).
Our results have important implications for managers. First, as firms may be indirectly affected by competition between their rivals and other firms, managers should attend not only to their own competitive relationships but also to the competitive relationships of their rivals. They should make an effort to put themselves in their rivals’ place and attempt to discern their competitive priorities (Tsai et al., 2011), especially in terms of multimarket contact. Our results show that firms need to pay attention not only to their own multimarket contact position but also to that of their rivals. This approach will help them to gain the maximum benefit from or to reduce the potential harm of multimarket competition spillovers. Second, managers should pay special attention to firms in the same strategic group. The observation of these rivals is useful to predict and take advantage of multimarket competition spillovers and to allow managers to evaluate different strategic alternatives and their performance (Fiegenbaum and Thomas, 1990; Porac et al., 1995). For instance, by locating in markets where similar rivals maintain high levels of multimarket contact with other firms, managers might indirectly benefit from their mutual forbearance agreements.
This article tests the indirect consequences of rivalry between firms. The field of competitive dynamics is mainly integrated by six research streams: competitive action and response, first-mover advantage, co-opetition, multimarket competition, strategic groups, and regional clusters (Ketchen et al., 2004). This article has integrated two of them, multimarket competition and strategic groups, to explore the impact of multimarket competition spillovers on firm performance. However, the study of competitive spillovers deserves further attention. Accordingly, future research could analyze the pattern of spillovers from the different research streams of the competitive dynamics field. For instance, scholars might increase our knowledge of competitive dynamics by considering how focal firms are affected by spillovers that derive from the exchange of specific competitive actions and responses (Chen and MacMillan, 1992; Chen et al., 1992; Grimm and Smith, 1997).
This research explores the extent to which strategic groups determine multimarket competition spillovers. As we have shown, only multimarket contact dynamics of firms with the same strategic configuration significantly affect firm performance. However, other factors may also be relevant to determine the indirect consequences of multimarket competition. For instance, the strategic relevance of markets for multimarket firms might condition the effect of multimarket competition spillovers. Multimarket firms tend to claim certain markets as their spheres of influence (Bernheim and Whinston, 1990; Edwards, 1955). These firms refrain from aggressive behavior within the spheres of influence of their multimarket rivals in exchange for similar treatment in their own spheres (Bernheim and Whinston, 1990; Gimeno, 1999). Consequently, multimarket competition spillovers could reduce the level of rivalry felt by any firm operating in the spheres of influence of the main industry participants, regardless of the level of multimarket contact that rivals maintain with other firms. Aggressive behavior, in contrast, may be redirected to secondary markets or markets with high potential that have not been claimed as spheres of influence by a dominant multimarket firm. Future research should explore how the strategic importance of certain markets determines the effect of multimarket competition spillovers.
Finally, it is important to highlight the fact that firms do not operate in isolation. Instead, competition between firms occurs in a complex network of market-engagement relationships in which firms and their rivals are embedded. In this network, firms cannot make strategic decisions as isolated entities because of the interdependent nature of competition. Although certain strategic decisions aim to compete against a particular rival, firms frequently cannot limit the scope and the consequences of their decisions. As a result, strategic decisions may affect not only the targeted rival but also other firms operating in the same markets. For this reason, managers should pay special attention to competitive interdependences when they take strategic decisions. In this regard, a key insight from this research is that we can obtain a richer understanding of the potential spillovers of competition among rivals if we explore to the specific mechanisms that generate these spillovers. A monolithic view, in which any form of competitive spillover is considered a simple and direct effect of overall industry rivalry, will obscure subtleties that may be critical for the appropriate design of firm strategy.
Footnotes
Acknowledgements
We gratefully acknowledge comments from Lucio Fuentelsaz, Juan Pablo Maícas and Elisabet Garrido. Previous versions of this paper were presented at the meetings of ACEDE 2013, Academy of Management 2013, and EURAM 2013. We thank participants for their comments. Finally, we thank three anonymous reviewers for helpful comments on the manuscript.
Declaration of conflicting interests
The author(s) declared no potential conflicts of interest with respect to the research, authorship, and/or publication of this article.
Funding
The author(s) disclosed receipt of the following financial support for the research, authorship, and/or publication of this article: We acknowledge financial support from the Spanish Ministry of Economy and Competitiveness and FEDER (projects ECON2011-22947 and ECO2014-53904-R), the Regional Government of Aragón and European Social Fund (project S09), and Universidad de Zaragoza (project JIUZ-2015-SOC-09).