



Abstract
In this essay, we discuss how tables can be used to ensure—and reassure about—trustworthiness in qualitative research. We posit that in qualitative research, tables help not only increase transparency about data collection, analysis, and findings, but also—and no less importantly—organize and analyze data effectively. We present some of the tables most frequently used by qualitative researchers, explain their uses, discuss how they enhance trustworthiness, and provide illustrative examples to inspire readers in their use of tables in their own research.
Keywords
Introduction
In qualitative research, tables serve many purposes throughout the lifecycle of a research project. They make it easy to navigate and sort large amounts of data in various ways, allowing researchers to examine them from multiple and diverse angles. They help researchers condense, bring order and make sense of data, and help them see what otherwise would be difficult—if not impossible—to see amid the hundreds, and even thousands of pages of unreduced, textual data, which constitute the basis of most qualitative studies. And finally, done well, tables help researchers communicate research findings and theoretical insights in a parsimonious, easy to understand and convincing way.
Despite their versatility and usefulness, however, tables are not without their critics. Some scholars view them as reductionist and accept them only as a necessary evil. They warn against the overuse of tables and the travesties that they may cause, including the force-fitting of data into categories and the eroding of the richness that is qualitative research’s main strength as compared with other research methods (Nadin and Cassell, 2004; Pratt et al., 2020a). The range of their different uses in qualitative research is also not widely understood, as many scholars tend to think of them primarily (and often only!) as communication devices, to be used as a “smart write-up strategy to enhance publication chances” (Jonsen et al., 2018: 48) without considering their other uses, notably for supporting data analysis and ensuring trustworthiness. We address these issues in turn.
First, many of the criticisms targeted at tables are not due to their characteristics as such but to their often being associated—erroneously in our view—with particular methodological approaches or ontological perspectives. For example, the popularity of the so-called Gioia method (Gioia et al., 2013), which encourages the use of particular types of tables, has led some to conflate the use of tables with this methodological approach. While the confusion is understandable, tables should not be viewed as a proprietary feature of any particular methodological or analytical approach. In fact, they are used by scholars in various traditions, including those who favor the case study method (Eisenhardt, 1989a) as well as those who do ethnography (Jarzabkowski et al., 2014).
Likewise, tables tend to be viewed as the preferred tool of scholars whose qualitative work reflects a realist ontology. Consequently, when editors and reviewers suggest the use of tables, this tends to be interpreted as pressure to conform to more positivist forms of qualitative research. Miles and Huberman (1994), who advocated an ample use of tables in qualitative research, maintained that “social phenomena exist not only in the mind but also in the objective world and that some lawful and reasonably stable relationships are to be found among them” (p. 4), which may partly explain this misconception. In our view, however, conflating the use of tables with a realist ontology or a positivistic orientation, is a mistake. Tables, in and of themselves, are ontologically and epistemologically neutral. They are merely tools in the hands of researchers who find them useful for accomplishing various research tasks, regardless of one’s research orientation or choice of method.
Second, tables must be viewed as more than just communication devices. While they are certainly useful for relaying information about research sites and methods, summarizing observations, and/or displaying data points, they are also useful as analytical devices to arrange data in a way that facilitates or permits comparisons, allowing researchers to detect similarities and differences and notice patterns, including co-occurrences, themes, and trends (Miles and Huberman, 1994: 93), activities which are essential for interpreting qualitative data. In our experience, many of the tables that eventually end up in our manuscripts are the polished and trimmed version of tables produced earlier on, which were developed to make sense of our data in the first place. In fact, it is not uncommon for us to start writing a paper only after having produced a set of tables that condense theoretical insights and reassure us about their grounding in the data. The act of building tables is thus central to our immersion in and understanding of the data.
Finally, and in keeping with a rising conversation around the trustworthiness of qualitative research (Lincoln and Guba, 1985; Pratt et al., 2020a; Reinhardt et al., 2018; Yin, 2003), we argue that tables are useful devices to help ensure—and reassure—readers about the trustworthiness of their research process and the robustness of the data backing the conclusions they draw. By trustworthiness, we mean “the degree to which the reader can assess whether the researchers have been honest in how the research has been carried out and reasonable in the conclusions they make” (Pratt et al., 2020a: 2). Prior work has proposed different criteria for trustworthiness in qualitative research, reflecting either a naturalistic (Lincoln and Guba, 1985) or positivistic (Yin, 2003) perspective. While these criteria differ in their language, there are many overlaps in their practical recommendations—both draw attention, for instance, to the importance of using multiple sources of evidence, gathering and providing rich contextual information, tracking and accounting for similarities and differences across cases, enabling the reconstruction of the researcher’s analytical moves, and keeping data well-organized and easily accessible (see Pratt et al., 2020a: 10–11 for a comparison). Tables, we argue, can help a researcher address all of these concerns and recommendations regardless of their research orientation or methodological preferences.
If we accept an understanding of social science as, in its essence, “a sense-making activity” (Astley, 1985: 498), and that sensemaking is essentially about bringing order into chaos (Weick, 1995), then—we argue—tables are useful because they help bring order into an otherwise vast and chaotic mass of data. If research is about finding and interpreting patterns (whether in events, actions, interpretations, narrative structures, etc.), then tables are useful because they enable us to connect cues (data points) in ways that help us assign meaning to our observations. If we accept the idea that “a theory tries to make sense out of the observable world by ordering the relationships by elements that constitute the theorist’s focus of attention in the real world” (Dubin, 1976: 26), then tables provide invaluable support to the theory building effort that is central to qualitative research.
In this article, we present an array of different table types and their possible uses (see Table 1) and explain how each type can contribute to ensuring the trustworthiness of any given qualitative research process. We posit that in qualitative research, tables typically serve three purposes: (1) they help organize and condense data, (2) they allow scholars to analyze data from various perspectives, and (3) they help display evidence and show findings in a way that is succinct and convincing to readers. Within any given study, tables can be used for only one, some or all these functions. The only limits to their use are the limits of any given scholar’s imagination. The classification we propose draws mainly on our knowledge of published qualitative studies and our familiarity with this tool; it did, however, benefit from a careful review of qualitative research published in top journals in the last 3 years, as we used tables from these articles to validate, extend, refine, and exemplify our classification.
Table types, variations, and examples.

Organizing
One of the most useful and important functions of tables is to help organize and manage the large amount of data that qualitative researchers typically collect (Camoes, 2016). To this end, large tables that we refer to as data inventories can be useful for compiling, in a tabular form, records of available data items (interviews, documents, images, videos, etc.), which can then be organized according to any number of useful criteria (such as time, people, roles, events, activities, issues, concepts—see Patton (2003: 439), for a more complete list). References or links to each item might occupy the left-hand column of a table, and each adjoining column might specify information about it: when it was collected, by whom, where, by case, by source (interviews, documents, field notes, etc.), by type (meeting minutes, news report, annual report, etc.), by type of actor (CEO, VP, manager, etc.), by time, and so on. 1
In case study research, for example, data inventories can increase the reliability of a study by documenting the content of a “case database” (Yin, 2003), to facilitate easy retrieval and use of these data during analysis, and ensure that all of the data required to address a research question or support certain conclusions are available. In this regard, their usefulness is not limited to case studies but extends to all qualitative studies that rely on a large, heterogeneous array of data sources. Data inventories can also be used to keep track of researcher-produced analytical decisions, memos (Saldana, 2016), contact summary forms (Miles et al., 2020: 122) and other forms of record-keeping activities that document the research process (i.e. the inquiry audit trail, Lincoln and Guba, 1985), all of which are necessary and important for ensuring transparency (Gephart, 2004; Pratt, 2008) and establishing trustworthiness in qualitative work (Lincoln and Guba, 1985).
When building a data inventory, Few (2012: 144) suggests identifying criteria that help group and segment data items into meaningful sections and subsections that are potentially useful for portioning data into manageable chunks for analysis. Such criteria would allow a researcher to easily locate and retrieve a subset of the data items collected to undertake a more focused analysis on, for example, a specific case (in a multiple case study), over a specific time period (for a longitudinal study), or a specific unit of analysis. Such inventories also make it easy to prioritize or rank data items (by time, or by any other criterion of significance to a study) or sequence them in the order in which the researcher wants to read or analyze them (later accounts first, smaller organizations before larger ones, interviews before archival material, etc.).
A well maintained data inventory, properly referenced and cross-indexed (Mason, 2002: 148) also simplifies the eventual construction of a data sources table (a table that itemizes all the data used in a specific study by type or source) or a data sources and use table (which, in addition to sources, specifies how each type of data was actually used in a study), both of which appear more and more frequently in the methods section of published qualitative work. These tables usually feature data sources by type (interviews, documentation, field notes, etc.) in the first column, and feature detailed descriptions, quantity of data collected for each type and how they were used (when including) in the adjoining columns. For typical examples, see Jarzabkowski et al. (2019: Table 1) or Howard-Grenville et al. (2013: Table 1).
Data sources tables, which are primarily used for display purposes, are used across a wide range of qualitative methods—including ethnographic studies—to account both transparently and succinctly, and also in sufficient detail for the content of a qualitative database. On occasion, such tables will also provide information about when data items were collected, or specify how the researcher’s role, status and responses progressed through multiple rounds of immersion in the field. By doing so, data sources tables increase trustworthiness in a study, by accounting for the “disciplined pursuit and analysis of data” (Locke and Golden-Biddle, 1997: 604), and help readers assess important sources of the credibility of data and data collection procedures, such as the extent of a researchers’ engagement in the field or their reliance on multiple sources (Lincoln and Guba, 1985; Yin, 2003).
When analyzing data, data sources and use tables can be particularly useful for ensuring that important parts of the database have not been overlooked. When a database includes interviews, for instance, it is not uncommon to rest one’s analysis primarily on the content of these interviews, while potentially rich and insightful archival material remains underutilized. By forcing a researcher to reflect on how they used their sources, this type of table helps address this potential problem. In doing so, the tables increase trustworthiness not only by providing transparency to the empirical grounding of one’s assertions but also by pushing the researcher to take full advantage of opportunities to triangulate their data across sources (Lincoln and Guba, 1985; Yin, 2003).
Beyond tracking and organizing data, tables can also be used to start the process of condensing and synthesizing raw data into a more manageable form and structuring them for further, more in-depth analysis, which we examine next. A table listing a sequence of events (event listings), for example, can be used to keep track of the chronology of events, decisions and actions of importance to a study (see Zietsma and Lawrence, 2010: Table 1). These tables typically will place a time indicator (years, months, days, etc.) in the first column, with descriptions of the events or activities being documented in the adjoining columns. Likewise, tabulated case summaries help researchers keep track of and ensure that they have collected consistent information across cases and units of analysis (organizations, projects, decisions, etc.), an essential first step before comparisons between cases can be made (see Bechky and Okhuysen, 2011: Table 1; Kaplan and Orlikowski, 2013: Table 1).
If transparency enhances trustworthiness by helping “scholars recognize circumstances that are roughly analogous to those in which earlier theories and concepts seemed to have explanatory value” (Pratt et al., 2020a: 6), then constructing event lists or case summaries forces researchers to accurately reconstruct events and event sequences, as well as establish and disclose facts and conditions that constitute the historical, organizational and/or social context within which observations were gathered. This is important to ensure that interpretations are mindful of contextual conditions and how they might have influenced observed patterns. Disclosing rich contextual information in this way is essential for assessing not only the trustworthiness of a study’s conclusions (i.e. was it appropriate to use (or not use) certain prior concepts in the analysis), but also their transferability to other settings (Lincoln and Guba, 1985). While this information can certainly be conveyed textually, tables help do so by presenting it in a concise, comprehensive, possibly comparative form without breaking up the main narrative.
Analyzing
As we mentioned in our introduction, tables do not serve only as communication devices. They are also analytical devices, well adapted to helping scholars navigate, get a handle on and make sense of their data, even if, ultimately, they are not included in the final version of a paper. When analytical tables are included (versions of which are condensed and trimmed for display purposes), they will usually be found in the findings section of a published paper.
If the point of data analysis is to “transform data into findings” (Patton, 2003: 432), then tables are a useful tool for undertaking such transformation. In our experience, this often occurs in the process of designing and developing different kinds of tables, in an iterative process of condensing and displaying the data, on the one hand, and drawing and verifying conclusions on the other (Miles et al., 2020: 8–9). In this process, many tables will be drawn and subsequently discarded, either because the data to complete them is not available or the table is not helpful for revealing anything new. It may take several iterations before a researcher sees something interesting or makes a revelatory insight. Tables allow researchers to play with their data—visually—in ways that reading through transcripts or documents, coding and writing memos do not, and as such are an important complement to these other approaches to analysis.
Tables are usually at their most useful once a certain corpus of data (which need not be particularly large) has been collected, sorted and organized, and some coding of the data, using grounded theory or other approaches has begun (it is important to note that the use of tables as an analytical technique is not attached to any particular coding approach). At this stage, working tables may help condense rich data from multiple sources into separate displays focused on subsets of evidence directly relevant to the research question. Doing this helps reveal gaps in the data, temporal inconsistencies, inconsistencies among sources, and other anomalies. It also allows for cross-checking to verify if certain types of evidence are present across informants or cases, and ultimately directs further data collection (see the Online Appendix for more detailed examples of how multiple analytical tables supported our analysis in Cloutier and Ravasi, 2020).
When used for analytical purposes, tables also make it possible to display data in a manner that relates them to something else (such as time, or roles, or context, or concepts) and, by doing so, to reveal some meaningful pattern or insight, which otherwise would have been invisible (Few, 2012: 11). Therefore, regardless of their type, tables must be designed in a way that facilitates or permits comparisons, detection of differences, and noting of various patterns, including co-occurrences, themes, and trends (Miles and Huberman, 1994: 93). It is these comparisons which are the most useful for making sense of a study’s observations.
In the following paragraphs, we present seven analytical table types: concept-evidence tables, coding schemes, cross-case analysis tables, co-occurrence tables, temporally ordered tables, typologically ordered tables, and theoretical summaries. These tables are representative of those we see most often in published qualitative management research, and which we ourselves have found useful in our own work. Their cells can contain data presented in a wide variety of forms, not only raw data (taken “as is” from the data corpus) in the form of direct quotes, excerpts from field notes, or pictures, but also processed data, in the form of evaluations or narrative summaries (e.g. see Table 2) or even symbols (+−, 0 1, tick mark, star, etc.; Glesne, 1999: 142) or numbers. Presenting evidence in different forms in the same table—for example, using symbols or images, instead of text excerpts—for example, may reveal patterns that a researcher may not have been able to notice otherwise.
Most common forms of evidence that can be put into table cells.

These seven types by no means exhaust the table design possibilities that exist. The variety of situations encountered by qualitative researchers is such that there is no single best way to structure tables. Different research questions, available data sources, number of cases (single vs multiple), and the nature of theoretical claims (variance vs process; see Mohr, 1982) may call for different types of tables. Sometimes, combining features from different archetypal tables may be useful—or even required—to illustrate one’s observations and support one’s arguments. Elaborate versions of concept-evidence tables, for instance, may be used not only to show empirical support for focal constructs, but also to highlight variation in the same constructs over time or compare different types of constructs, effectively turning these tables into temporally or typologically ordered tables, as we shall discuss later.
Concept-evidence tables list all the concepts that are gradually emerging from the analysis alongside the evidence that supports them. By concepts, we refer to the basic components that arise from data coding and which appear connected to a study’s emerging theoretical framework. Concepts may arise from systematic coding, as when using grounded theory (Charmaz, 2006; Locke, 2001), or from other analytical approaches (Boréus and Bergström, 2017; Feldman, 1995; Spradley, 1979, 1980). They can include practices, processes, perceptions, beliefs, and other attributes of individuals, groups, organizations, or environments. By evidence, we refer to the data that support these concepts.
The simplest way to structure these tables is to list concepts in the first column of a table, and then use the adjoining columns to display selected evidence. Evidence in these simple tables will often be in the form of direct quotes, but as we have mentioned before, it can also include excerpts from field notes, summaries of observations, graphs, or pictures. (for example, see Kreiner et al. (2015: Table 3) or Farny et al. (2019: Tables 2a, 2b, and 2c)). A useful variation on this format—see Sutton and Hargadon (1996: Table 1)—uses multiple columns to collect evidence of different types and/or from different sources (one type or source per column) for each concept. As triangulation of sources is considered important for the credibility of case analyses (Yin, 2003) as well as other forms of qualitative research (Lincoln and Guba, 1985; Patton, 2003), doing so may help researchers reassure themselves (and later their readers) that their emerging theoretical interpretations (i.e. concepts) rest on robust empirical evidence.
Concept-evidence tables support analysis by helping to structure the sorting and ordering of selected data (such as excerpts from interview transcripts or field notes, narrative summaries of observations, factual information from archival sources). In our own research, we will often do this by literally cutting and pasting fragments of text into Word tables, as we find that this process helps focus our attention on evidence directly relevant to the research question, and stimulates effortful processes of bracketing, comparing, and grouping data that effectively constitute important steps of the analytical process.
When coding, in particular, concept-evidence tables are useful to facilitate the “splitting” and “merging” of provisional codes (Grodal et al., 2020) by enabling a visual engagement with available evidence as fragments of text gradually populate working tables. In our experience, a cell gathering a disproportionate amount of quotes often indicates an opportunity to split a provisional code to produce a more fine-grained analysis. Cells gathering only scant evidence, in turn, invite us to consider merging multiple codes into more abstract concepts, or point to the need for further data collection to explore concepts that at the moment do not appear to be robustly supported by the data.
This being said, structured efforts at coding or tabulating evidence often do not so much produce theoretical insights as they help examine more systematically the intuitive insights that arise from researchers’ earlier exposure to their data (as they interviewed informants, read and coded archival documents and transcripts, observed interactions, etc.). These intuitive insights can be extremely valuable to grasp important patterns in the data. However, they can also, on occasion, be misleading, as researchers may unconsciously pay disproportionate attention to vivid evidence or the words of more eloquent or charismatic informants. Or they can involuntarily reflect preconceived assumptions, effectively leading a researcher to focus attention on evidence that seems to confirm prior, possibly unarticulated, expectations. An important use of concept-evidence tables is therefore to help researchers address these issues by forcing them to systematically track the extent to which each element of their emerging theoretical framework is really supported by available evidence.
When doing so, analytical work can also be supported by coding schemes—tables dedicated to keeping track of a study’s codes-in-use and their relevant descriptions, as they develop (see Goh and Pentland (2019): Table 2, for an example of a final, polished examples, used for communication purposes). Coding schemes not only provide clarity to criteria used to classify and interpret empirical observations, but also help set the stage for a rigorous in-depth analysis of the data, and they are usually expanded, revised and fine-tuned as analysis progresses. They increase confidence in the reliability (Yin, 2003) and dependability (Lincoln and Guba, 1985) of researchers’ conclusions by reassuring that the coding of evidence was based on clearly stipulated criteria, rather than loose or intuitive ones, and by establishing clear terms for an independent review of analytical procedures and assessment of available evidence.
Concept-evidence tables and coding schemes more generally increase trustworthiness in the quality of the analysis by reassuring readers that researchers made a conscious, systematic engagement with their data to establish solid empirical support for their emerging interpretations. 2 In addition, they expand the capacity to “show” (Golden-Biddle and Locke, 2007) illustrative evidence supporting one’s claims—often advocated as essential to build trustworthiness (Pratt et al., 2020a)—without burdening excessively the narration of one’s findings.
A similar function is performed by cross-case comparative tables, generally used in multiple case studies to highlight similarities or differences between cases by gathering and ordering evidence by concept and by case. In management research, cases often correspond to the unit of analysis of a study: organizations, teams, projects, or—albeit more rarely—individuals. This type of table operates by contrasting cases along one or more aspects, gathering data from multiple sources into a single display to facilitate comparison across cases, to highlight similarities or differences, triangulate across sources (to ascertain robustness), and/or identify possible patterns through the sorting and listing of cases along multiple criteria (to detect associations in constructs that vary by a degree). They can be used to support analyses aimed at producing variance theories (e.g. Eisenhardt, 1989a), process theories (e.g. Kaplan and Orlikowski, 2013), or a combination of both (e.g. Cloutier and Ravasi, 2020).
When used to account for variance across cases, for example, these tables will often list cases in the first column, their order reflecting variation in the construct to be explained (e.g. the “dependent” variable, such as high vs low velocity in decision-making in Eisenhardt (1989b: see Table 2). Evidence for this variation can then be included in the second column of the same table, or in a separate concept-evidence table. The adjoining columns can then be used to display evidence from one or more sources for a second construct, whose association with the first construct is being explored in the table. Used in this way, these tables increase trustworthiness in the generalizability of theoretical claims derived from cross-case comparisons by accounting for the “replication logic” that underlie these claims (Eisenhardt, 1989a; Yin, 2003).
Alternatively, cross-case comparative tables can also be used to explore similarities and differences across cases in how a process unfolds. In this variation, cases are listed in the first column, and evidence of a given construct at different points of time are provided in the adjoining columns. When used this way, cross-case comparative tables can help organize and compare cases along the same set of analytical categories (and by doing so, help spot gaps in these analyses). The analytical categories informing such comparative analyses can then be used as building blocks for the emerging process model. Used in this way, these tables help move cross-case analysis of empirical observations to a higher level of abstraction, by showing robust support for an overarching theoretical framework (reflecting similarities across cases) or by grouping cases (based on intra-group similarities and inter-group differences) to highlight patterns in how the focal process or processes vary.
A particular variant of cross-case comparative tables, which we refer to as co-occurrence tables, can be useful to examine whether and how (or, sometimes, how frequently) different features of cases tend to co-occur, by ordering them in a way that visually reveals patterns in the distribution of these features. Cells in these tables will often contain processed data, in the form of symbols, tick marks, frequency counts, or summary qualitative descriptions of observations (see, for instance, Grimes (2018): Table 2) because the primary purpose of these tables is to explore the distribution of certain features among cases. In this respect, these tables can be considered the visual equivalent of a correlation table for quantitative researchers.
Co-occurrence tables can be particularly useful when the number of cases is high (rendering more extensive display and manipulation of evidence in cells impractical) and the intent is not to search for differences between two “polar” groups of cases (as in Eisenhardt, 1989b), but rather to cluster cases based on similar properties or behaviors (dependent variables). The aim is to hopefully identify other properties that co-occur with (and can possibly explain) the focal ones by searching for similarities in the structural or temporal features of cases that tend to behave similarly. Co-occurrence tables, then, may be particularly useful at later stages in the analysis, after deeper immersion in the data has drawn attention to core constructs (e.g. key decisions, behaviors, structures, cognitions), to explore patterns in the manifestation of these constructs in one’s database. For example, McPherson and Sauder (2013: see Tables 2, 3, and 4) used this type of table in their study of negotiations in a drug court to track the number of times each type of actor invoked a particular institutional logic, and whether such invocations were successful or not (in changing the severity of sanctions the court imposed on defendants), again, by type of actor; doing this helped reveal patterns in who invoked what logics more or less successfully across cases.
What goes into the cells of a co-occurrence table need not be only numbers: in some cases, authors use check marks to signal whether a given property of a concept was observed across cases. Examples of this sort of use include Pache and Santos (2013: Table 6) and Compagni et al. (2015: Table 6). By doing so, co-occurrence tables increase trustworthiness in the analysis by transparently disclosing evidence for claims of systematic association among observations, notably when qualitative data are used to support variance theories.
Temporally ordered tables—which Miles and Huberman (1994) also refer to as or time-ordered tables—help track events or changes in a unit of analysis or a concept over time. By ordering data by time and sequence, they allow researchers to examine what happened when and what might have led to what (Miles and Huberman, 1994: 110), or compare changes in empirical observations over time. They are particularly useful, if not indispensable, to understand processes (Langley, 1999). Choosing what to document across rows or columns allows researchers to compare units of analysis (actors, organizations, activities, etc.) or concepts across time, to document whether they appear or not at different points in time, or whether and how they manifest any changes over time.
Temporally ordered tables can take many forms. An important and useful distinction to make between them is that they can be organized by “clock time” or “epochal time” (Mosakowski and Earley, 2000). Tables organized by clock time track changes in a unit of analysis or a concept as it unfolds over days, months, or years. These tables are particularly useful to identify temporal patterns, such as sequences, progressions, or cycles in the early stages of analysis, as they help order observations chronologically. They make it possible, for instance, to track the ebb and flow of activities over time, and to note periods of “dead” time when no activities have taken place, all of which could be significant from an analytical or theoretical standpoint. For an example of a temporally ordered table organized by clock time, see Michel (2011: Table 3).
Tables organized by epochal time, instead, organize observations around conceptually distinct phases that capture qualitative changes in focal concepts or their features. Transition points from one temporal block to the next are not marked by elapsed time but by criteria that reflects time as it is perceived by informants or the theoretical interests of the analyst. The early and tentative bracketing of time (Langley, 1999) that characterizes these tables often results from intuitive observations pointing to temporal variation in relevant constructs, which these tables help analyze more consciously and systematically. Epochal timetables are particularly useful for identifying the phases or stages of a process, and the changes in focal concepts that underpin that process. For an example of a temporally ordered table organized by epochal time, see Zietsma and Lawrence (2010: Table 2).
Each time block, whether on clock time or epochal time, could be as long or as short as the context and the researcher chooses, allowing for a more fine-grained, micro-analysis of activities, events, or states over time, or conversely, a longer-term, macro view of the same—the equivalent of zooming in or zooming out when examining time-related phenomena when studying processes (Cloutier and Langley, 2020). In our own study of identity trajectories, we used several temporally ordered tables to construct and validate the trajectories followed by the identities of four organizations over several decades (the Online Appendix offers a behind-the-scenes account of how we constructed and used these tables).
Whereas temporally ordered tables are useful to identify temporal patterns, typologically ordered tables are useful to compare different manifestations or properties of a concept (e.g. different types of process, practice, strategy, structure, belief) across a study’s whole database, to highlight similarities and differences in empirical observations. Their cells rarely contain evidence. If they do, it tends to be minimal and associated with a descriptive or theoretical labeling of observations that helps flesh out the similarities and differences between them. Typologically ordered tables have been used extensively, for instance, to present clearly and succinctly different institutional logics in play in a particular setting (e.g. see Pache and Santos, 2013: Table 3).
The identification of the relevant types to include in a table often follows a more holistic, intuitive engagement with one’s data that highlight possible patterns that a typologically ordered table helps examine more systematically. Sometimes, informants themselves point at variation in beliefs or practices, for example, that the use of these tables helps articulate typologically. Other times, the relevant types may emerge from a prior step in the analysis: in these cases, typologically ordered tables may help explore similarities and differences between properties other than those that initially led to the tentative grouping.
Typologically ordered tables, in this respect, support analytical efforts in at least two ways. First, these tables can be used to articulate typological differences by bringing together the outcome of prior comparative analyses. Typologically ordered tables, in this respect, may be used to connect different findings to reveal a bigger picture (i.e. the existence of typological patterns that help explain the observed variation in the data), and—when submitting a paper—may be coupled with concept-evidence tables or cross-case comparative tables to establish the empirical grounding of the claimed typological differences.
Alternatively, these tables can be used to support a more immersive engagement with the data—such as found in ethnographic research—without necessarily relying on prior systematic coding and table-making, but using a tabular form to structure the interpretation of typological patterns in a rich qualitative database. While researchers may intuitively grasp the presence of such patterns—or be alerted to them by informants—they may initially have only a fragmented understanding of the features that characterize each type. Typologically ordered tables, in this respect, can help researchers flesh out different types, by forcing them to articulate typological differences along a common set of features.
In term of trustworthiness, temporally ordered and typologically ordered tables perform similar functions in that, during the analysis, they both support the systematic tracking of empirical support for apparent patterns (temporal or typological). Later, they can be used to facilitate independent assessment of the extent to which claimed patterns are actually reflected in empirical evidence. While a similar function may indeed be performed by exemplification in the main text of an article, these types of table enable a concise summary of core observations, effectively bridging “theory narrative” and “data narrative” (Bansal and Corley, 2012).
Finally, but no less importantly, tables can be used to support the articulation of the fundamental elements of an emerging theoretical account. We refer to this type of table as a theoretical summary. The cells of this table do not contain reference to empirical observations, but rather to theoretical definitions and/or explanations. Theoretical summaries help researchers “think through” their interpretations, by adding depth to their understanding of the concepts that appear important to explain what is going on in a study, and how they are related. In this respect, they are particularly useful to support the “creative leap” (Klag and Langley, 2013) from empirical observation to theoretical explanation, especially when facing complex models that need to simultaneously illustrate and account for variation across units of analysis.
In principle, the structure of theoretical summaries can mirror the structure of any of the analytical tables we described previously—it simply replaces empirical content (evidence in raw or processed form) with theoretical content (labels and/or explanations). Theoretical summaries, in this respect, can help researchers theorize their findings, should they opt for an approach to qualitative research that invites them to distinguish empirical observations from what is often referred to as a “grounded model”. They do so by structuring and outlining the conceptual space (concepts, phases, conditions, etc.) that need to be accounted for by this theorization, thus helping ensure a thorough explanation of empirical observations (as cells are gradually filled with theoretical content). In fact, the content of this table can often be transferred and rearranged in the main text to form an initial draft of the section illustrating the emerging theoretical framework.
This type of table can be particularly useful to track and explain variation in how a process unfolds across different cases or under different conditions (a rare case of a theory that is simultaneously variance and process). In our own study of long-term patterns of identity change, we used a theoretical summary to support the integration of empirical observations across cases into an overall theoretical framework (Cloutier and Ravasi, 2020). By assigning rows to different elements of the process model and columns to different types of processes, we were able to use this table to simultaneously assist theorize about how different elements of the model worked together to explain the changes in the patterns we observed (process analysis) and how these elements differed across groups of cases, leading to different types of processes (cross-case analysis).
From an analytical perspective, concept-evidence, cross-case analysis, co-occurrence, temporally ordered, typologically ordered, and theoretical summary tables contribute to enhance trustworthiness by supporting more conscious mental processes aimed at uncovering and making sense of patterns in the data. They do so by helping researchers contrast and compare data (useful especially for variance-oriented theory), track progression and sequences (for process-oriented theory), reveal co-occurrence (variance theory), and gauge completeness of theorization. By ensuring the presence of robust evidence for each claimed pattern, these tables support the dependability and confirmability of emerging interpretations. In other words, they ensure that researchers can respond positively to the question: “Do I have the data to claim what I think I know about my setting?”
When producing tables geared for analysis, authors should keep track of the various decisions they made in association with a specific table (such as which criteria they used to condense data, classify observations) and describe in detail the theoretical reflections that the table stimulates. Such decisions and descriptions should be attached to each table, and in the case of complex and protracted analyses, there may be some benefit in keeping track of these decisions in a separate table, so as to facilitate the reproduction of the study’s “audit trail” which is an important way of ensuring reliability and confirmability of qualitative research findings (Lincoln and Guba, 1985).
Another good habit is to keep track of data sources when entering data into cells (e.g. who the informant was, which document is quoted, when field notes were taken). Copy and paste functions make it all too easy to quickly fill table cells without systematically making note of where an excerpt or quote came from. Retracing sources after the fact can quickly become a nightmare and compromise the integrity of the research process. In this regard, it helps to develop a coding system that allows researchers to identify sources easily without occupying too much space in a cell.
Finally, when using analytical tables to highlight patterns, it can be helpful to find creative ways—using symbols and other methods—to reduce large tables (especially those that contain all the evidence in support of a concept which can extend over dozens of pages) to a single page, even if it is a very big page that is posted on a wall (Miles and Huberman, 1994), because the distribution of a table over multiple pages may make it more difficult to discern patterns in its content.
Displaying
Once analysis is complete and researchers are confident that they have come to some interesting or meaningful insight, tables become useful to present findings in a clear, parsimonious, and convincing way. A well-designed table will not only synthesize evidence in support of an author’s claims, it will also allow readers to see—at a glance—the connections an author is trying to make between different concepts, observations, or pieces of evidence that he or she has identified as important.
The primary purpose of display tables then is to communicate a study’s findings to an unknowing, often skeptical, and possibly novice (at least, as far as the specific empirical context of a study is concerned) audience. Persuading this audience requires scholars to adapt analytical tables—which are often lengthy, dense, and quite detailed—in ways that preserve richness and comprehensiveness (from a data display perspective), while renders them aesthetically appealing (to the extent possible within editorial guidelines) and intuitively easy to understand. To achieve this, scholars need to think about how the human brain processes visual information (e.g. objects that are close together, similar or connected are almost always perceived as belonging to a group (see Cairo, 2012: 114)), and use the design tools at their disposal (white space, font sizes and types, borders, and color) to transform their possibly clunky analytical tables into appealing and convincing “snapshots” of their data (Few, 2012: 146–147).
Well-designed display tables help researchers concretely show how they got “from 3600 pages of field notes to their final conclusions” (Miles and Huberman, 1994: 2) and avoid the criticism—often directed at qualitative scholars—that they are merely cherry-picking quotes in support of their claims. Qualitative researchers have been repeatedly encouraged to “show” rather than “tell” readers about their data (Golden-Biddle and Locke, 2007; Pratt, 2009; Pratt et al., 2020b), and reviewers and editors often lament the lack of data in the manuscripts they assess (Pratt, 2008). Overwhelming readers with quotes and observational facts is not a solution, however, as doing so may drown out a compelling analysis (Pratt, 2008). Striking the right balance between “showing” and “telling” can therefore be tricky. While there are many ways researchers can do this, such as using vignettes, extensive excerpts, or detailed narratives (Reay et al., 2019), one of the most common ways is to use “power quotes” to support arguments in the main body of a text and to back these with supplementary “proof quotes” (Pratt, 2008) in a separate table.
Finally, while complex, multi-functional tables are occasionally seen in published work, in our view it is generally not a good idea to ask a display table to do too many things at once. Trying to include too much information in a single table—for instance, using the same table to display robust support for a set of constructs and at the same time show the co-occurrence of these constructs across multiple cases, or show multiple patterns at the same time—often results in complex, unwieldy, unreadable, or confusing tables. This problem can be avoided by drawing separate tables, with each of them performing only one function. While this may result in the proliferation of tables in a paper, at least, it makes it clear what the purpose of each table is, what type of information it intends to convey, and what patterns it intends to highlight. Conversely, trying to convey too much information within a single table may end up obscuring important patterns (for an example of such table, see Table 2 in the work of Rindova et al. (2011)). 3
In this respect, it may be worth spending some time, when writing a paper, reflecting on a “table plan”: what tables could I use to show empirical support for the concepts that constitute my emerging theoretical explanation for what I observed? What tables could I use to show support for the (temporal, typological, correlational, etc.) patterns that I observed? Could a table help me illustrate how I transitioned from empirical observations to theoretical arguments, or summarize more clearly the latter? Even if these tables never become part of the paper, reflecting on them may offer authors another opportunity to think through their interpretations before sending a paper out.
Conclusion
In the previous paragraphs, we discussed the three main uses of tables in qualitative research—organizing, analyzing, and displaying—and presented examples of different types of tables as an inspiration for scholars interested in adding tables to their qualitative methods toolbox. We have argued that tables are practical for organizing and keeping track of qualitative data; efficient for sorting data in a way that facilitates comparisons and the noticing of patterns; and effective at presenting findings in a clear and convincing way. It is no wonder then that Miles and Huberman’s (1994) central argument in the book that set the trend for the use of tables in qualitative research is: “you know what you display” (p. 11).
Figure 1 summarizes the different functions of tables as they might be used throughout the research process. In Table 3, we summarize the ways in which each type of table enhances trustworthiness in the research process itself—that is, confidence that the researcher has followed rigorous procedures to collect and analyze data (see Reinhardt et al., 2018) and presented them in an “honest” and transparent way (Pratt et al., 2020a)—and trustworthiness in a study’s conclusions—that is confidence that the researcher’s interpretations are “reasonable” (Pratt et al., 2020a), plausible, and grounded in robust empirical evidence.
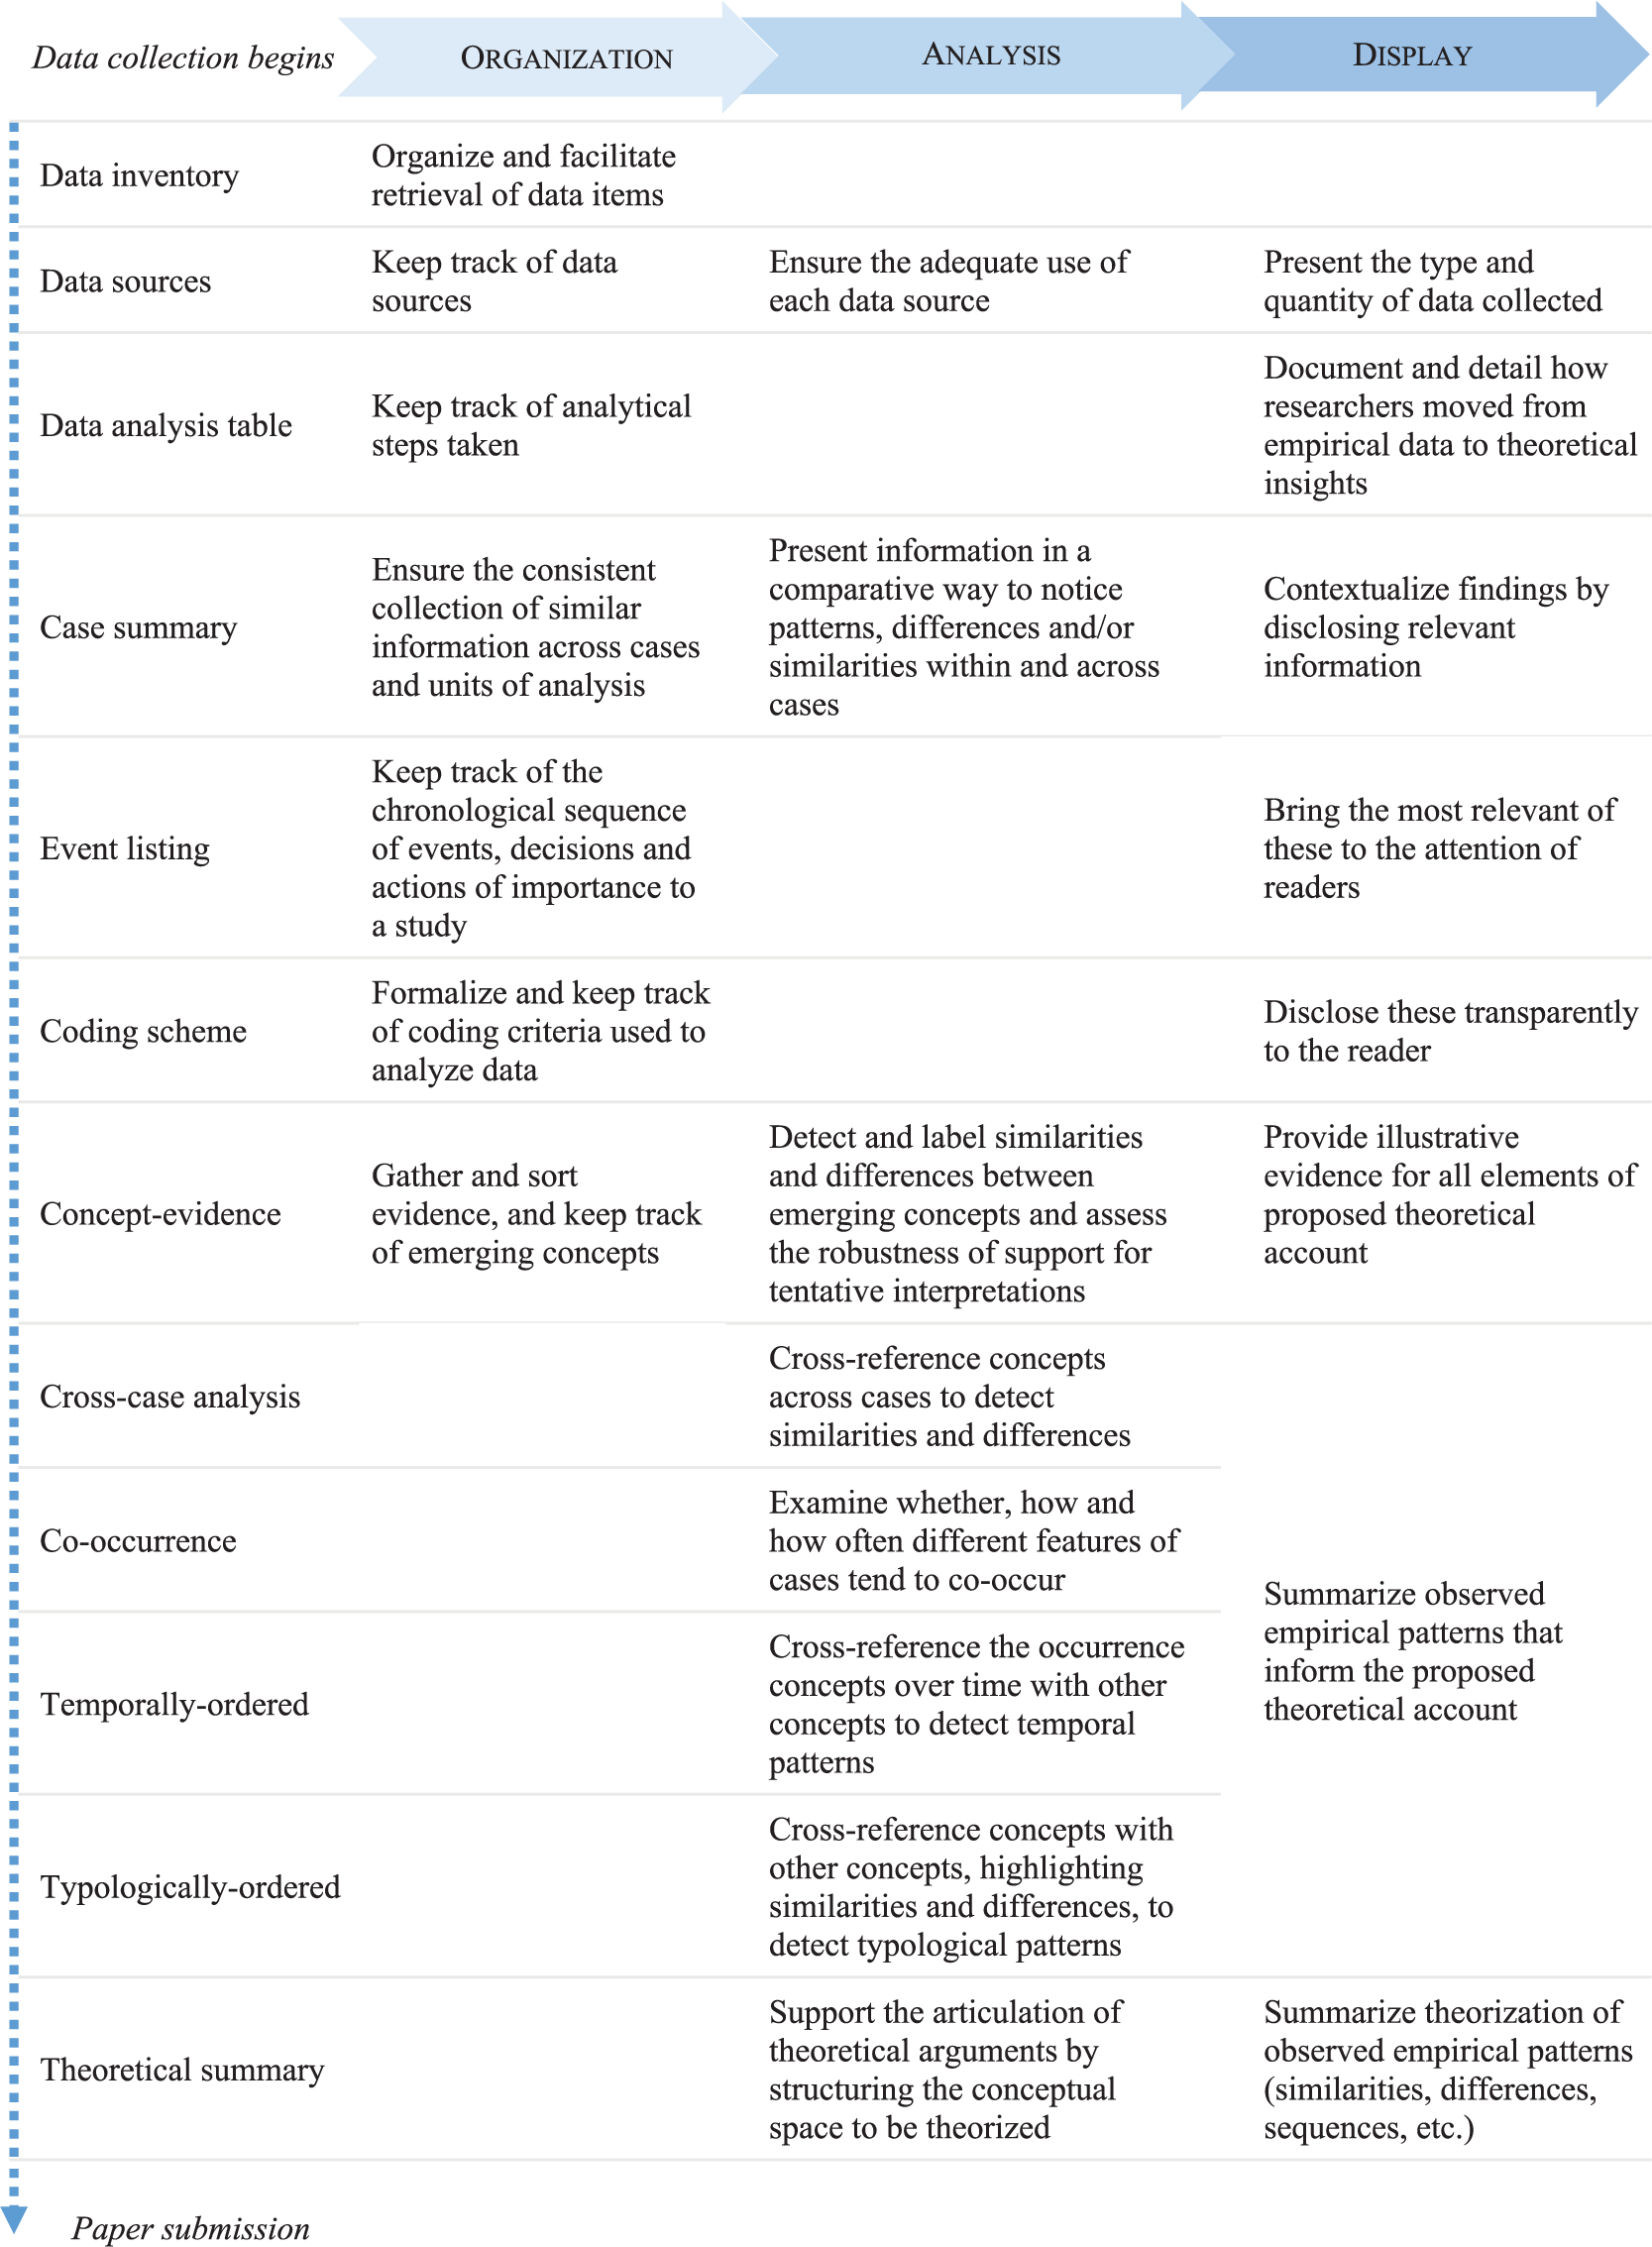
Table use over the course of a project.
Table types and trustworthiness: a summary.

In closing, we wish to leave readers with two additional thoughts. First, the generic table types presented here should be viewed as tools, not templates. The examples presented are not meant to illustrate a set of rules for how tables should be drawn, but rather to reflect the myriad ways that researchers have used tables in both published and unpublished work. Each table type should therefore be viewed as a blank canvas that individual researchers can populate as they see fit, with the examples provided serving only as inspiration for those less familiar with the wide range of ways in which tables can be used throughout the various stages of any qualitative research process.
Second, despite their versatility and various uses, authors must remember that tables are not meant to be stand-alone entities, they need to be referenced, narrated, and explained in the body of an article. Miles and Huberman (1994) refer to this as the “analytic text” that accompanies a table (p. 100). As such, tables should not be conceived as mere repositories of information—or quotes—to be included out of conformity to a presumed template. Tables offer a great opportunity to include, in a concise way, important information that might otherwise unnecessarily lengthen a paper, but that can be usefully referenced from the main text. For instance, concept-evidence tables can be referred to as additional supportive evidence or provide a more detailed illustration of observations summarized in main text. Cross-case tables can be referenced to point to similar patterns in other cases than those described more extensively in the main text. And event lists or temporally ordered tables can be referenced in place of lengthy descriptions of event sequences.
Tables should really be thought of as complementing—rather duplicating—the content of the main text. When using data source tables, for instance, the description of data collection can focus on the process, rather than the sources. Similarly, the inclusion of a coding scheme or a data analysis table may lighten up the description of data analysis. Theoretical summaries can be used to illustrate at a glance—and therefore help readers grasp—theoretical arguments presented in more detail over multiple pages. Indeed, we think of tables—or table-making—as complementary to theory development itself. As useful as they may be, tables per se cannot be a replacement for carefully and convincingly crafted arguments. Yet, by helping researchers engage more consciously and visually with their data as well as their emerging interpretations, tables may be crucial in the development of these arguments. After all, as E.M. Forster is supposed to have said: “How can I tell what I think till I see what I say?”
Supplemental Material
sj-pdf-1-soq-10.1177_1476127020979329 – Supplemental material for Using tables to enhance trustworthiness in qualitative research
Supplemental material, sj-pdf-1-soq-10.1177_1476127020979329 for Using tables to enhance trustworthiness in qualitative research by Charlotte Cloutier and Davide Ravasi in Strategic Organization
Footnotes
Declaration of conflicting interests
The author(s) declared no potential conflicts of interest with respect to the research, authorship, and/or publication of this article.
Funding
The author(s) received no financial support for the research, authorship, and/or publication of this article.

Supplemental material
Supplemental material for this article is available online.
Notes
Author biographies
References
Supplementary Material
Please find the following supplemental material available below.
For Open Access articles published under a Creative Commons License, all supplemental material carries the same license as the article it is associated with.
For non-Open Access articles published, all supplemental material carries a non-exclusive license, and permission requests for re-use of supplemental material or any part of supplemental material shall be sent directly to the copyright owner as specified in the copyright notice associated with the article.
