



Abstract
The high-temperature polymers like Acetal homopolymer (Delrin) currently have a wide variety of use. They are quite often utilized in traditional components to reduce weight, cost or meet a specific application requirement, and so on. Some of preferred uses of such polymers include aircraft interiors, wire insulation, wire couplings and fixtures, and so on, particularly at high-temperature applications. The machining process like drilling may affect the near net shape of the final product. This experimental study is done through modeling and optimization for identifying the suitable tool and optimum parameters for drilling of Delrin polymer under dry conditions to achieve high surface finish. The three levels of parameters such as spindle speed (N), feed rate (f), and tool point angle (Θ) are taken as control parameters of the response variable. Two different commercially available tool materials namely high-speed steel drill tool and solid carbide tool are accounted in experiments. L27 orthogonal array is initially taken for the experimentation in CNC turning center with horizontal drilling setup. Artificial neural network is employed to sample, train, and test the input parameters in order to lessen the experimental error and measurement error of response variables. Response surface models are developed and optimal parameters toward the surface quality of the hole are determined through the desirability function approach. It is found that the surface generated under dry mode with speed of 1026 r/min, feed of 0.1 mm/min, point angle of 118° recorded the surface roughness of 0.699 µm, which is considered to be the best for drilling Delrin material.
Keywords
Introduction
The high-temperature polymers are progressively used in various fields of engineering for weight reduction, corrosion resistance, and environmental properties. The Acetal (Delrin) is one of the engineering crystalline high-temperature thermoplastic homopolymer materials developed by DuPont. It is widely used in electrical components of aircraft, automotive applications, wire insulation for particularly high-temperature applications, wire couplings and fittings, electrical and electronic applications with higher service temperatures, monofilament for the production of woven products for filters, belting and meshes, and so on. The production components for these industrial applications require drilling operation. Drilling is the material removal process in which the multipoint drill bit is rotated and moved in transverse direction to the plane on which the hole is to be made. The size of the hole is dependent on the diameter of drill bit used. But the challenge in any machining process is to obtain the high surface finish without affecting the near net shape of the final product. The appropriate tool and control parameters are to be used in order to have drill hole with high surface finish. Moreover, the surface roughness is one of the affecting parameters of the fatigue life of the component. It is also considered as a vital parameter in the assembly of parts. Interestingly noticed that, machining of Delrin is difficult as it has low elastic modulus and hence it is considered to be a challenging research.
Vankanti and Ganta 1 investigated the influence of drilling parameters, namely, cutting speed, feed, point angle, and chisel edge width toward high-quality hole in glass fiber-reinforced polymer (GFRP). They used Taguchi L9 orthogonal array, analysis of variance (ANOVA) and reported that the feed rate is the most significant factor. Also observed that chisel edge and point angle influence the thrust force and hole quality, cutting speed influences torque, speed, and circularity of hole. Karnik et al. 2 applied full factorial and artificial neural network (ANN) for the analysis of delamination effect using the drilling parameters like spindle speed, feed rate, and point angle of K20 twist drill. They reported that the combination of high speed and low feed and appropriate point angle minimizes the delamination. Ogawa et al. 3 investigated the cutting mechanism and fabricated the drill tool on a printed wiring board for producing a small hole in GFRP. They examined the surface of drilled hole through scanning electron microscope (SEM) and measured surface roughness along the feed direction. They found from the experimental results that the major cutting edge of the drill has more impact than the chisel edge of the drill. Paulo Davim and Reis 4 studied a delamination of drilling of carbon fiber-reinforced plastic (CFRP) composites based on design of experiments (DOEs). They used ANOVA as well in order to find the suitable drilling parameters for the prediction of surface quality. They concluded that the helical flute K10 carbide drill promotes less damage on composite laminate than four-flute carbide K10. Palanikumar 5 assessed the factors like spindle speed and feed rate toward the low surface roughness, thrust force, and delamination factors of glass fiber-reinforced resin. They used L16 DOE and grey relational grade for simultaneous optimization and ANOVA as well to find most significant factors on the response variables. Latha and Senthilkumar 6 studied delamination study of drilling GFRP composites using fuzzy logic and reported the effect of machining parameters on delamination using 3-D surface plots; authors also reported that spindle speed shows only limited effect on delamination. Sardinas et al. 7 attempted to optimize productivity and surface quality of laminate composite material through genetic algorithm. Langella et al. 8 developed the mathematical models using experimentally measured coefficients to predict thrust force and torque during drilling of composite materials. They also reported a detailed analysis of the difficulties associated with the action of the chisel edge during drilling. Hocheng and Tsao 9 investigated different drill tools using Taguchi method and neural networks (NNs) toward the drilling of composite material and reported that the feed rate and spindle speed influence the surface roughness. Many researches have also been conducted in the past using above methodologies in relation to metals, metal matrix composites, and nanocomposites. 10 -24 Elango et al. 25 attempted to find the optimum control parameters for turning Delrin through TLBO algorithm. But the drilling characteristics of Delrin have not yet been addressed, which look to be a high requirement for industrial applications.
The aim of this research is to find the optimum conditions to obtain the minimum surface roughness during the drilling of Delrin. The experiments were conducted according to L27 matrix with high-speed steel (HSS) tool and carbide tool separately. As the surface finish was measured only at four different locations of the drill hole, the experimental data were used to train ANN to predict the optimum condition and response of the samples. Response surface model (RSM) was employed to derive the optimization functions related to experimentally measured data and ANN-predicted data. Further, desirability function (DF) was used to find the optimum condition parameters for obtaining lower surface roughness.
Experimental methods
Delrin of 25 mm diameter was the material chosen and CNC turning center with horizontal drilling setup of Fanuc Model C CNC machine was chosen for the experiment. Table 1 shows the thermal and mechanical properties of Delrin. The HSS of DIN338 standard and solid carbide (TiN coated) drill insert of DIN6537 standard were chosen for experiments. The reason for choosing different drill bit materials was to identify which drill bit is more suitable for drilling Delrin material. The other some existing standards for drill insert are DIN, ANSI, NAS, and ISO standard. The three levels of spindle speed (N = 100–2000 r/min), feed rate (f = 0.1–0.2 mm/min), and point angle (θ = 118°, 125°, and 135°) as recommended by the tool manufacturer were chosen to formulate L27 orthogonal array. The drill holes were done using 10 mm drill insert according to control parameters in L27 orthogonal array and the surface roughness (Ra) as a response variable of each drilled sample was instantaneously measured using Mitutoyo surf tester. No coolant was used in any experiment. Four trials were done for each sample and the mean of the measurements was considered in order to have the accuracy of the measurement. Figure 1 shows the drilled Delrin samples through HSS and carbide tool.

Drilled samples using (a) HSS tool and (b) carbide tool.
Properties of Delrin (from the supplier).

Artificial neural network
As the response variable is measured experimentally only at four different places for each sample, two-layered feed-forward back propagation ANN was used to predict the best response. Figure 2 illustrates two-layered feed-forward back propagation ANN used in MATLAB. The network contained one input layer, two hidden layers, and one output layer that are linked by neurons having weights and biases. The methodology of ANN applied is represented in Figure 3(a). The initial step of ANN model is to develop an experimental database that consists of set of input parameter (information of N, f, and θ) and targeted output (information of Ra-HSS tool and Ra-carbide tool) in order to have sufficient knowledge related to drilling process over the range of chosen parameters. Next step is to select preferred functions for training, learning, and performance. The 60% of experimentally measured data were used for training (experiment numbers 1–17), 25% of data were used for testing (experiment numbers 18–22), and 25% of experimental data were used for validation (experiment numbers 23–27).

Feed-forward ANN architecture for Ra predicted.

(a) Method of experimental work flow. (b) Network performances test with neurons.
The gradient descent back propagation with adaptive learning was selected as a training function (TRAINGDX), LEARNGDM was designated for learning function, and mean squared error (MSE) was chosen for the performance validation. In general, as large number of neurons in the hidden layer causes over fitting and smaller number of neurons causes under fitting, optimum number of neurons is to be selected in order to increase the network performance. The best performance is identified by the neurons resulting the minimum MSE. During the training, 2, 4, 6, 8, 10, and 12 neurons were applied in single layer and two-layer models and trial and error method was adopted in order to predict the performance. The MSE received from each trail was recorded to understand and chose the best number of neurons. Figure 3(b) shows the result of performance test with neurons. From the analysis, the best performance was recorded by two-layer model with 8 neurons (3-8-8-1) and hence further used.
The main goal of this model is to produce the best tested, trained, and validated set of output data based on minimum MSE and maximum regression prediction value (R) which is expected to be 1. This process was repeated for several times till the required goal is achieved. Finally, the best value was simulated for the selected sample and stored in a result database called Ra-predicted. Table 2 shows the parameters design summary for L27 orthogonal array. Table 3 shows experimental results and the predicted data through ANN.
Parameters deign summary for L27 array.

ANN: artificial neural network; HSS: high-speed steel.
Experimental results and ANN-predicted data.

ANN: artificial neural network; HSS: high-speed steel.
Response surface methodology
The RSM is an experimental modeling technique through which the relationship between control variables and responses are established. The general second-order RSM model is given by

where α0 is the free term of the regression equation, X1, X2,…Xn are variable terms, β1, β2,…βn are the linear coefficient terms, β11, β12,…βkk are the quadratic coefficient terms, and β12, β13,…βk−1 are the interacting coefficient terms.
The objective of using RSM in this research is to investigate the effect of spindle speed (N), feed rate (f), and tool point angle (θ) on surface roughness (Ra) during the drilling of Delrin. The response variable as the function of experimentally measured data can be written as

The response variable as the function of ANN-predicted data can be written as

where (Ra)m is the surface roughness (µm) from the experimentally measured data, (Ra)p the surface roughness (µm) from the ANN-predicted data, N the spindle speed (r/min), f the feed (mm/min), and θ the tool point angle (°).
The experimentally measured data and ANN-predicted data were separately applied in Design Expert tool to evaluate the regression models for HSS and carbide tools. As mean surface finish was calculated from the data of only four different locations, authors planned to develop RSM model from ANN-predicted data as well. The hypothesis of getting the model from ANN-predicted data was to achieve better response model. Two different models were arrived from experimentally measured data, representing HSS and carbide tool each. Similarly, two different models were arrived from ANN-predicted data, representing HSS and carbide tool each.
Analysis of variance
ANOVA is a statistical tool that determines how well the model fits the experimental data. The two-way ANOVA was done for model fit analysis. The model is considered adequate and parameters are significant on responses. When the value of p > 5%, the model is considered adequate and parameters are insignificant on response variables. The experimental data were input to a statistical tool called Design Expert and results were calculated as shown in Tables 4 and 5 for HSS and carbide tool, respectively. The percentage contribution of each machining parameter on the response variable was calculated in order to find the influence of each parameter on the drilled surface.
ANOVA results of experimentally measured data of holes made by HSS tool.

HSS: high-speed steel; ANOVA: analysis of variance; DF: desirability function; SS: sum of square; MS: mean square.
ANOVA results of experimentally measured data of holes made by carbide tool.

ANOVA: analysis of variance; DF: desirability function; SS: sum of square; MS: mean square.
Problem formulation and optimization using DF
The multi-objective optimization is to determine by factors of independent variables in the problem space for optimal and nearly optimal values of objectives. The desirable ranges in DF are from 0 to 1. The value 0 indicates the unacceptable configuration of selected objective and the value 1 represents ideal case. The combined objective is a geometric mean of all transformed responses


where di is the desirability of ith aimed output and n is the number of responses. The constraints as listed in Table 6 were used in Design Expert tool for a DF of minimization of surface roughness. The factors range and goal set for the optimization of minimum Ra is tabulated in Table 7.
Constrains for DF.

DF: desirability function.
Range of factors and objective set for optimization.

Results and discussions
Predicated data from ANN model
As the response variable was measured only at four different locations of the drill hole, the experimental data were used for the purpose of getting the best predicted Ra for both HSS and carbide tool. The input pattern was trained, tested, and validated with 1000 epochs, several times in order to improve the regression set. Table 8(a) and (b) shows the final weights and biases for the proposed network model (3-8-8-1) for both carbide and HSS tool, respectively. Figures 4 and 5 show the output of ANN model with respect to HSS and carbide tool, respectively. It is observed that the predicted (output) is more close to the experimental value (target) with the prediction coefficient R > 0.98 for all output. It confirms the good agreement between predicted Ra with measured Ra. The ANN-predicted data were further used for developing optimization functions.
Weights and biases of network for carbide tool.

Weights and biases of network for HSS tool.

HSS: high-speed steel.
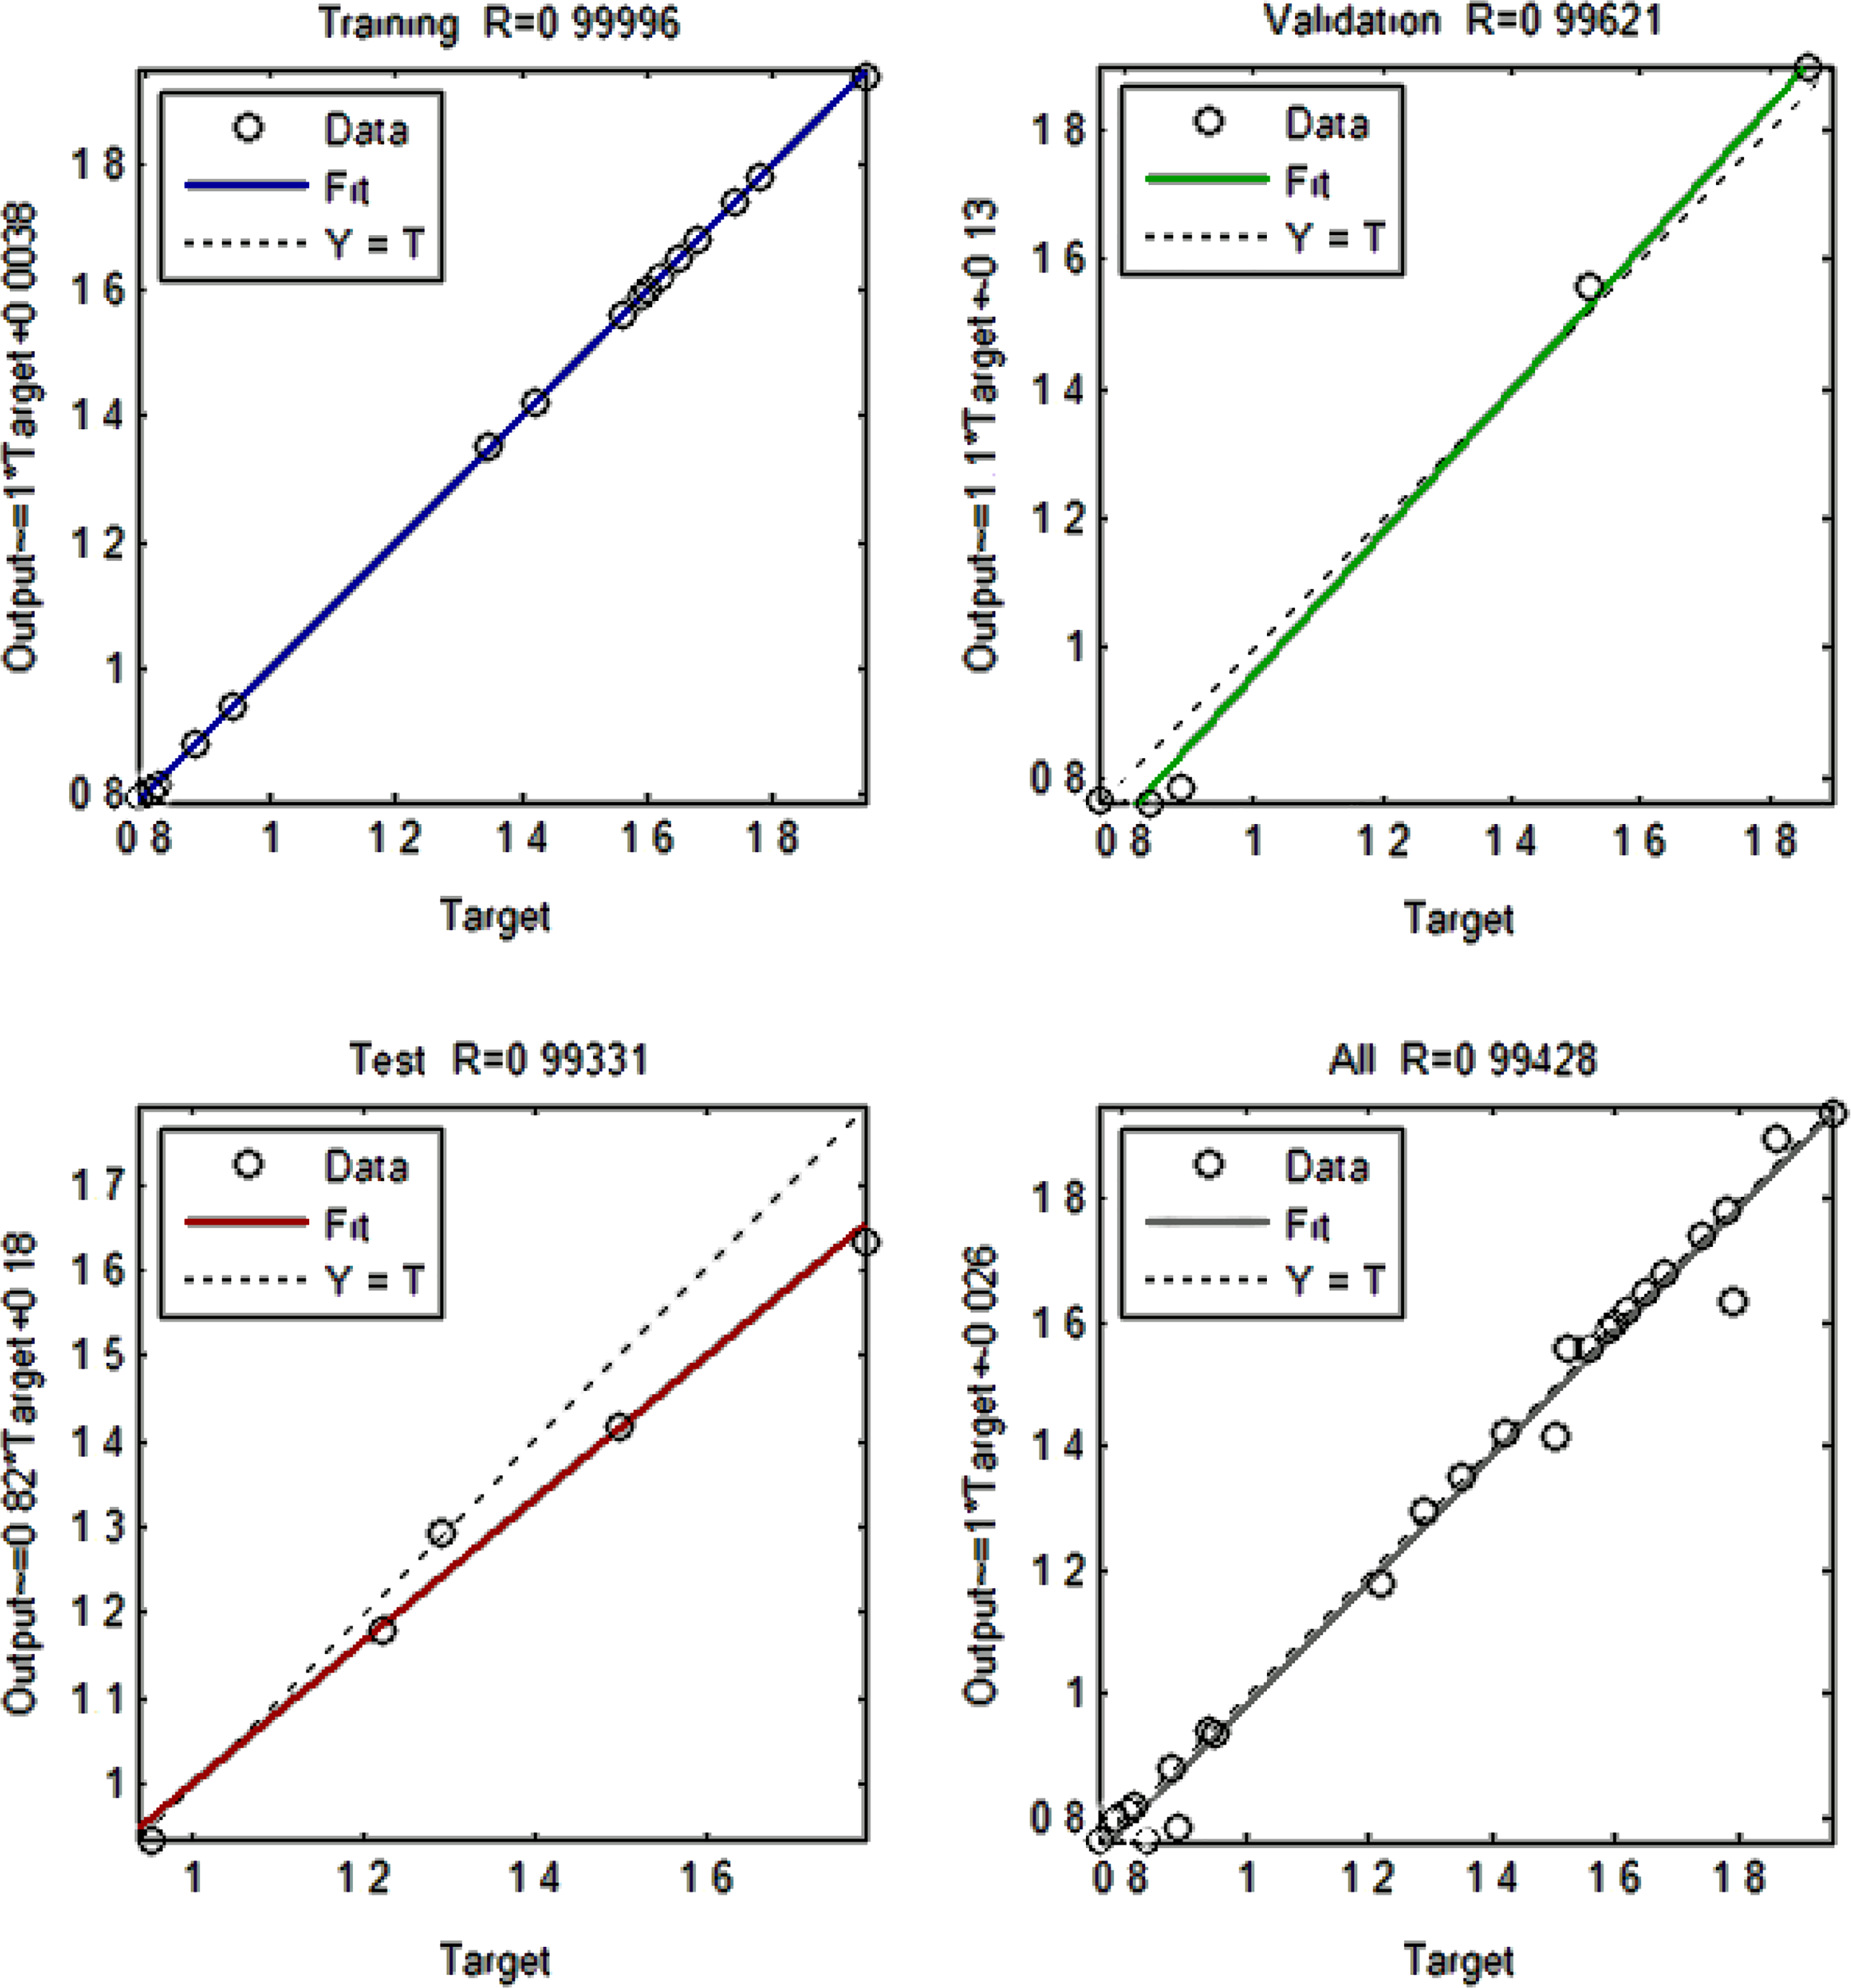
ANN-regression plot of the response in relation with HSS tool.

ANN-regression plot of the response in relation with carbide tool.
Regression models
The regression models from experimentally measured Ra and ANN-predicted Ra in terms of both HSS and carbide tools are
HSS tool—Measured

HSS tool—ANN predicted

Carbide tool—Measured

Carbide tool—ANN predicted

where N is the spindle speed (r/min), f the feed rate (mm/min), and Θ the point angle (°).
(Ra)1m and (Ra)2m are the models arrived from the experimentally measured data, whereas (Ra)1p and (Ra)2p are the models arrived from ANN-predicted data. These four models were further used for finding the optimum control parameters that give the minimum surface roughness.
Parameter contribution analysis from ANOVA
The contour plots showing the interaction between the control variables and the response variables for HSS and carbide tool are illustrated in Figure 6(a) to (c). They were rendered by keeping any one variable constant at central value and interacting with the remaining variables. The contour plots show the significance of drilling parameters on getting minimum Ra. Figure 6(a) shows the interaction effect of N and f on Ra with the hold variable θ. It is observed that the surface roughness increases with increase in N and f. When N increases, the low value of f results low Ra. When f is increased to higher without increasing N, the Ra value significantly increases. From the analysis, it is observed that the feed rate (f) is most influencing parameter for both tools for predicting low Ra. The tool approaches rapidly over the surface as the roughness becomes higher. Figure 6(b) indicates the interaction plots of N and θ on Ra, with the hold value of f. It is observed that the increase of N and θ leads Ra to increase. Figure 6(c) reveals the effect of f and θ with the hold value of N on Ra. When f and θ increases, the Ra becomes higher. It is observed that if θ is increased with lower value of f, Ra becomes very less. If f is increased further, the Ra also drastically increases.

The contour plots for measured Ra of HSS tool and carbide tool.
It is noticed from the Table 4 related to HSS tool that the terms N, f, θ, N × θ, f × θ, and f2 are found to be the significant terms and N2, θ2, and N × f are the insignificant parameters. The feed rate alone contributed maximum with 81.72% and all other terms contributed together less than 10%. It is observed from Table 5 related to carbide tool that model terms N, f, θ, f, N × θ are the significant and all other terms are insignificant for the response variable. The feed rate contributed 74.38% and all other terms contributed 25.62%. It is concluded from ANOVA study that the feed rate greatly influences the surface quality of drilling irrespective of the tool used.
Numerical optimization results from DF
The optimization was carried out using RSM models through DF approach. Figure 7(a) and (b) represents the ramp function graph for experimentally measured Ra of HSS tool and carbide tool, respectively. It is noticed that the minimization of Ra for HSS tool is as follows: N = 1430 r/min, f = 0.1 mm/min, and θ = 118°. The surface roughness Ra is found 0.78 µm with the desirability of 0.984 at the optimum machining parameters. The optimum parameters for carbide tool are N = 1356 r/min, f = 0.1 mm/min, and θ = 118°. These optimum parameters achieve the minimum Ra of 0.71 µm with the desirability of 0.986.

Ramp function chart for experimentally measured Ra—HSS and carbide tool.
Figure 8(a) and (b) illustrates the ramp function graph for ANN-predicted Ra of HSS and carbide drill tool, respectively.

Ramp function chart for ANN-predicted Ra—HSS and carbide tool.
From Figure 8(a), for HSS tool, Ra = 0.766 µm with the desirability of 1.000 is obtained at the optimum condition of N = 1287 r/min, f = 0.1 mm/min, and Θ =118°. From Figure 8(b), for carbide drill tool, Ra = 0.669 µm with a desirability 1.00 is obtained at the optimum parameters of N = 1026 r/min, f = 0.1 mm/min, and Θ = 118°. Table 9 shows the test result of carbide and HSS tool. From these results, it is understood that the optimum parameters evaluated from ANN-predicted data and carbide tool are the best to give the minimum surface roughness during drilling of Delrin. The validation experiments were further conducted and recorded in the Table 9 with these optimum parameters and observed that both predicted Ra from RSM models differs by less than 5%, irrespective of the tool used. It is considered to be a good agreement between RSM results and confirmation test results.
RSM-DF test results and confirmation test result for HSS and carbide tool.

RSM: response surface model; HSS: high-speed steel; DF: desirability function; ANN: artificial neural network.
SEM analysis
Both the samples drilled with optimum conditional parameters and normal conditional parameters (randomly selected) were examined through Scanning Electron Microscope model TESCANE VEGA3. Figures 9 and 10 show that the SEM image taken from drilled surface of Delrin polymer under the optimum setting conditions and normal setting conditions, respectively.

SEM images of drilled surface under optimum parameter settings. (a) Carbide ANN predicted (0.67 µm), (b) carbide measured (0.71 µm), (c) HSS ANN predicted (0.79 µm), and (d) HSS measured (0.81 µm). SEM: scanning electron microscopy.

SEM images of drilled surface under normal parameter settings. (a) Carbide tool (1.95 µm) and (b) HSS tool (1.87 µm).
Figure 9(a) and (b) shows the SEM images of holes done by carbide tool with N = 1026 r/min, f = 0.1 mm/min, and θ = 118° (conditions predicted by ANN model) and N = 1356 r/min, f = 0.1 mm/min, and θ = 118° (conditions predicted by experimentally measured data model). The surface roughness of these holes were 0.67 µm and 0.71 µm, respectively. It is observed that both images show the smooth surface with no or limited micro-pits and re-deposited work materials. Moreover, no damage on the surface like pull outs, tears, or laps were observed in both images. On comparing both images, Figure 9(b) shows a bit more micro-pits due to higher speed used during the drilling.
Figure 9(c) and (d) shows the SEM images of holes done by HSS tool with N = 1287 r/min, f = 0.1 mm/min, and θ = 118° (conditions predicted by ANN model) and N = 1430 r/min, f = 0.1 mm/min, and θ = 118° (conditions predicted by experimentally measured data model). The surface roughness of these holes were 0.79 µm and 0.81 µm, respectively. Though both SEM images show the smooth surfaces, they do have more micro-pits than holes made by carbide tool. The reason is, both holes were done at higher speed than the speed used by carbide tool in both cases. As the speed of the spindle is higher, the chance of having re-deposited work material is higher. These re-deposited material could cause the micro-pits or scratches over the drill surface.
Figures 10(a) and (b) illustrates the SEM images of drilled holes done by carbide and HSS tools with Ra = 1.95 µm and 1.87 µm, respectively, but with normal conditional parameters (randomly selected as surface condition N = 1000 r/min, f = 0.2 mm/min, and θ =135°). It is seen that the drilled surface is jagged, curvy with more pits and pull outs. Though both holes were done at lower speed, these kinds of rough and uneven surfaces are found due to the higher feed rate. The same was observed in ANOVA study as well, that feed rate is the most influencing parameter in drilling of Delrin material.
Conclusions
The aim of this research is to investigate the better tool among HSS and carbide tool and the optimum parameters for achieving the low surface roughness during drilling of high-temperature polymer, Delrin. L27 orthogonal array was developed with three levels of speed, feed, and tool point angle. The experiments were conducted under dry machining conditions on CNC machine with axial (horizontal) drilling setup based on planned experimental design with HSS tool and carbide tool. The measured surface roughness values were taken to the ANN model in order to minimize experimental error and measurement error. RSM models were rendered separately from both experimentally measured data and ANN-predicted data. Further DF was used to determine the optimum drilling condition to achieve the minimum surface roughness. From the modeling and optimization, the following points were arrived: The experimental data have the mean value of surface finish measured only in four different locations of the drill hole. The ANN is able to predict the response model by minimizing the experimental errors. The best surface roughness Ra = 0.669 µm was achieved when using carbide tool with N = 1026 r/min, f = 0.1 mm/min, and Θ = 118° for drilling. The feed rate (f) is the most influencing parameter in drilling irrespective of drill tool used. It is evidenced from ANOVA study and SEM examinations as well. The validation of the optimization was further done for all four RSM models. The model generated from ANN-predicted data of carbide tool differs only by 1.51%. Hence, the proposed drilling parameters with carbide tool can be used in industry for drilling of high-temperature polymer, Delrin.
Footnotes
Declaration of conflicting interests
The author(s) declared no potential conflicts of interest with respect to the research, authorship, and/or publication of this article.
Funding
The author(s) received no financial support for the research, authorship, and/or publication of this article.