



Abstract
This research suggests an algorithm to generate structural networks based on discreet elements for given locations of support points and point loads. Previous research attempted to achieve this by using a computational growth simulation of venation systems, which form the structure of leaves. However, such networks always start from a single point and therefore cannot be used to form arches or beams. In order to generate networks that are based on two or three support points, an algorithm has been developed that is inspired instead by angiogenesis, the process by which vascular systems develop. The algorithm is based on a spring system with a variable network graph that connects the support points and is pulled upwards and split sideways into multiple veins by a given set of load points. The algorithm has been used to grow architectural structures. Different networks have been tested using finite element analysis and compared with both venation and column-and-beam structures. The angiogenesis networks as well as the venation network are shown to perform well and may be suitable as architectural structural systems.
Introduction
The aim of this research is to generate structural networks based on given support points and point loads. An algorithm is proposed that develops those networks based on discreet structural members. The networks are grown or refined from an initial basic connection between the support points.
The algorithm is a further development of the author’s previous work of generating structural networks 1 by utilizing a variant of the venation algorithm as developed by the University of Calgary.2–4 The algorithm proposed here is inspired instead by the process of angiogenesis. It suggests the use of a spring system with a variable network graph so that additional structural members can be inserted into the network during its formation.
Venation
Venation in the leaves of plants forms both their structural and their circulatory system, 5 and venation development has been shown to relate to physical stress within the lamina. 6 The University of Calgary has developed an algorithm for its simulation which uses a set of seed points from which the venation network grows toward target points which are distributed in the lamina.2–4 The author’s previous work showed that the networks generated with this algorithm can perform well as structural systems. 1
However, a difficulty of using leaf and tree structures and other venation systems in load-bearing applications is their topologic behavior of always connecting back any cells or loads to a single support point, the petiole. Structural components that form connections between two support points, such as beams or arches, cannot be generated with the venation algorithm.
The previous work attempted to solve this by growing separate structures together from different support points. Those structures are still each supporting the loads from a single support point, but are in effect leaning against each other. According to the venation algorithm used, the actual connecting members between the separate segments always have the thinnest cross sections of the network. 1
In order to create structural networks that grow toward target points similar to venation systems, but which allow for the development of beams or arches, a network generation based on angiogenesis is proposed as an alternative.
Angiogenesis
Rather than just connecting back to one seed point, every point reached by the network needs to connect back to two seed points, and every member of the network becomes a connection between those two seed points. The growth of the network does not start from the seed points directly, but from an initial connection between the seed points, which then divides and splits up in order to reach the target points of the system and to develop into the network (Figure 1).
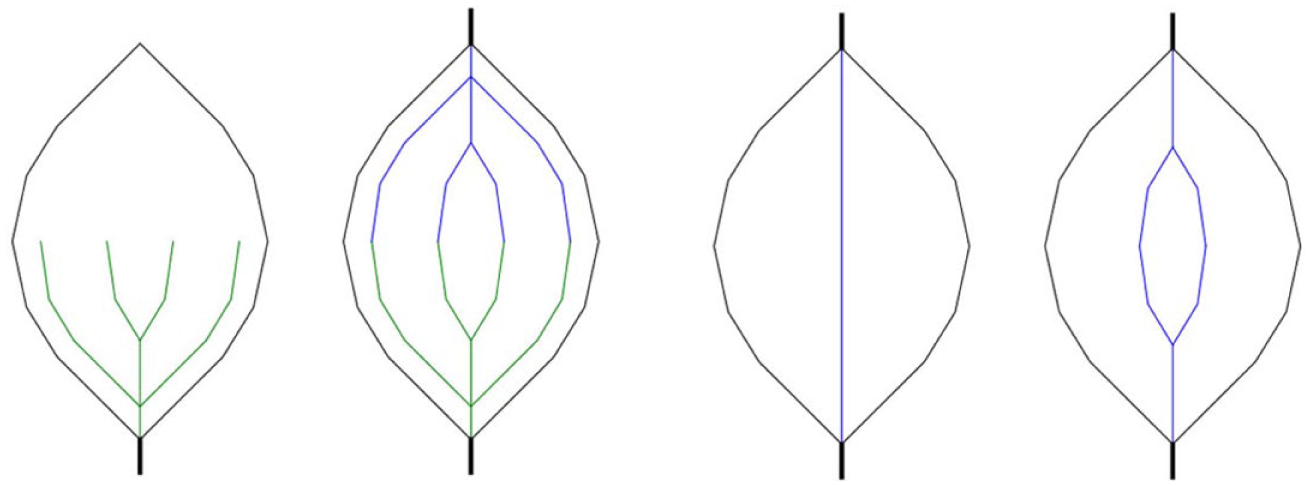
Angiogenesis network connecting two seed points instead of just one in a venation network. The network is developed through a division and refinement of one initial connection between the two seed points.
Angiogenesis, the process by which new blood vessels form from existing ones, differs from venation systems in that it grows from, and generates, unidirectional circulation systems. On the contrary, the circulation through leaf venation systems flows in both directions through the same veins, which contain both xylem cells to transport water toward the leaf cells and phloem cells to move sap away from them. Where venation systems develop from a single seed point, the petiole of the leaf, vascular systems have a start and an end point, the atria and ventricles of the heart. 7
Therefore, it is possible to use a growth simulation similar to angiogenesis in order to develop structural systems that connect multiple support points. In a vascular system, the vein network needs to reach the proximity of every biologic cell in order to provide it with circulation. This requirement can be replaced by the requirement to transfer loads from defined locations toward the support points. The load points used in the simulation correspond to the biologic cells of the vascular system that need to be reached from the support points. The load points as well as the support points are given and structural networks can be generated based on grown arch systems between the support points.
Angiogenesis occurs in two modes: sprouting angiogenesis, in which a new vein is formed by connecting two already existing veins, and intussusceptive angiogenesis, in which a single existing vein splits up into two parallel veins. The methodology presented in this article is based on intussusceptive angiogenesis. The initial formation of the first veins in an embryo is a separate process called vasculogenesis. 8
The intent for the simulations is to generate, between the support points, networks that are pulled upwards by the load points to form efficient structural support systems. The resulting networks are expected to create shell-like formations or may have similarities to the rib systems beneath Gothic domes.
It has not been attempted to develop an algorithm that realistically simulates the development of vascular systems as they occur in nature, rather the biological precedent of angiogenesis has been the driving concept for the development of venation systems into growing spring systems.
Related work
Different designers have used venation patterns for the design of products and architecture,9–11 using digital simulations similar to those developed by the University of Calgary.2–4
In parametric design, structural performance often drives the parameters of the relational model or algorithm.12,13 In structural engineering, the voxel-based evolutionary structural optimization (ESO) and bidirectional evolutionary structural optimization (BESO) algorithms have been developed in order to generate efficient structural systems;14,15 however, those are based on voxels and not on discreet structural members. Networks with discreet elements have been developed through genetic algorithms,16–19 which then require pre-defined setups or components.
A development of structural systems through growth simulations has been attempted with various algorithms20–24 or through an assemblage of physical components.25–27
The study of the growth of organisms on a cellular level is the field of developmental biology. 28 In the field of cancer research, the growth of angiogenesis and the factors influencing it are of special interest, as an inhibition of the angiogenesis has been shown to stop the growth of a tumor. Simulations of angiogenesis in this field are used for both research and visualization.29,30
Variable graph spring system
In the computational model, the vein network is abstracted into a set of points, the cells or nodes of the network, with connections between them that simulate small segments of the veins. Let those cells be called
Similar to the venation systems tested previously, 1 the simulation is calculated in three dimensions with the z-axis in the vertical direction. As the system is aimed at structurally supporting loads, the support points are placed at the bottom level and the load points are placed at a higher level, with gravity also acting in the z-direction.
During each iteration, the spring system is relaxed by a step and the positions of all cells are updated. The directionality and forces of every cell are re-evaluated. The cells are then tested for division to cause a splitting of the veins: The cell with the largest force acting on it is divided into two cells, and the parent and child cells are reconnected to the network with new spring connections.
Setup
Input
The inputs for the simulation are a set of seed points, the point supports of the final structure, and a set of target points, the load points that are to be reached by the network. Let the two support points be
In a first step, an initial beam line is identified by connecting the two seed points. This line is used to define the flow axis between
Cells are placed equidistantly along the initial beam line and connected with springs (Figure 2).

Initial setup with two support points.
Load points
Each load point identifies the cell closest to it and establishes a spring connection to this cell. The spring connections to the load points, the load-point springs, are treated differently from the spring connections between cells. The number of load-point springs is fixed and equal to the amount of load points, while the springs between cells proliferate when the network grows.
Flow directionality
As in a vascular system, a flow direction through the cells and their connections is defined, which is used to guide the division of the veins. This ensures that the cells and connections divide sideways in relation to the flow direction or flow axis and that the new veins follow the direction of the previous vein.
Every cell is placed on a connection between two support points. In the initial distribution, there is always one neighboring cell that is closer to
The flow axis is then described as the vector from neighbor

Flow axis and sideways direction at cell C are in black. The colored arrows indicate the spring connections toward the neighbors
In later iterations it is possible that more than one neighbor is tagged as leading in the direction of a certain support point. Let those neighbors be
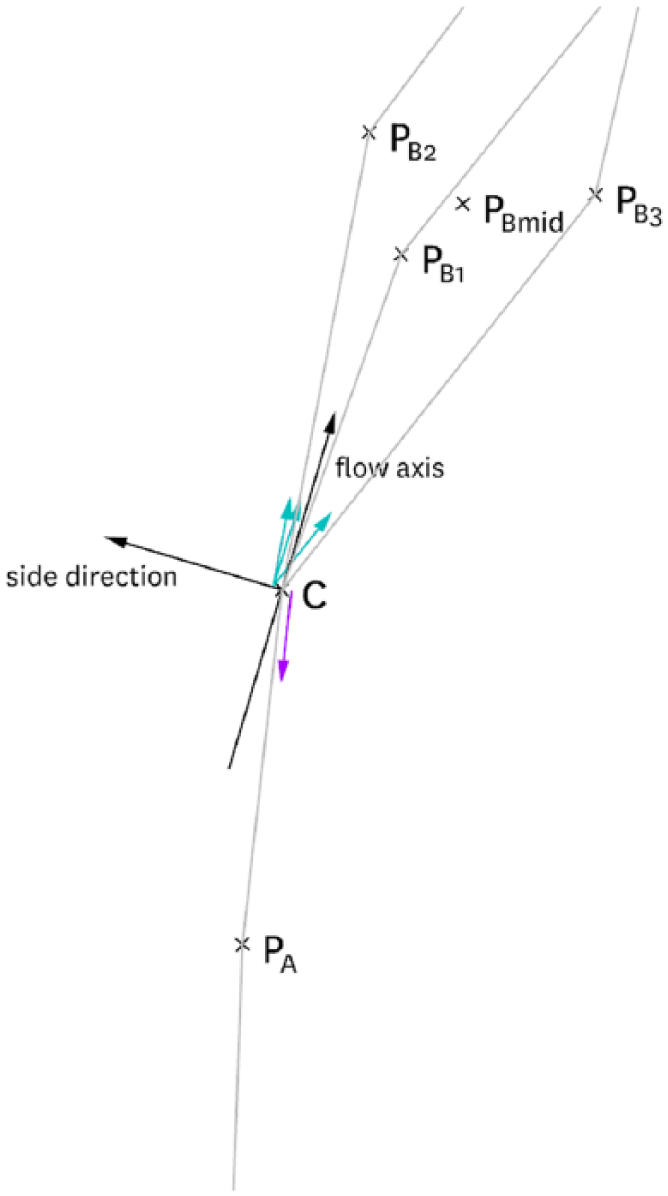
Flow axis for a cell C with multiple neighbors (
Every spring connection is now part of a link between the two support points and connects two cells. Of those two cells, the first will have the second tagged as connecting toward one support point, while the second cell will have the first cell tagged as connecting toward the other support point. In the diagrams, every spring connection will have two colored arrows pointing along its length in opposite directions, indicating in which direction each support point is located.
Iterative calculations
Relaxation
The spring system is relaxed by a step. All springs are calculated as having a rest length of 0. The stiffness of the load-point springs is calculated as being significantly lower than the stiffness of the springs between cells.
The movement of the cells is calculated as an acceleration–velocity system: in each iteration, the acting spring forces are added as vectors to the acceleration of a cell, the acceleration is added to the velocity of the cell, and the velocity is added to the position of the cell. All cells are calculated as having the same mass.
The forces acting on a cell are recalculated, as well as the main flow axis and the sideways direction at every cell.
Angiogenesis
Angiogenesis, the splitting of a vein, is triggered by the accumulation of forces acting on a cell, independent of their direction. The cell with the largest force acting on it will split. Neighboring cells are prevented from splitting, sometimes with a delay of several iterations, so that the system can readjust before the next division occurs.
When a cell splits, a new cell is inserted into the network. The dividing parent cell and its child cell are moved apart from each other in the sideways direction.
If there is only one cell
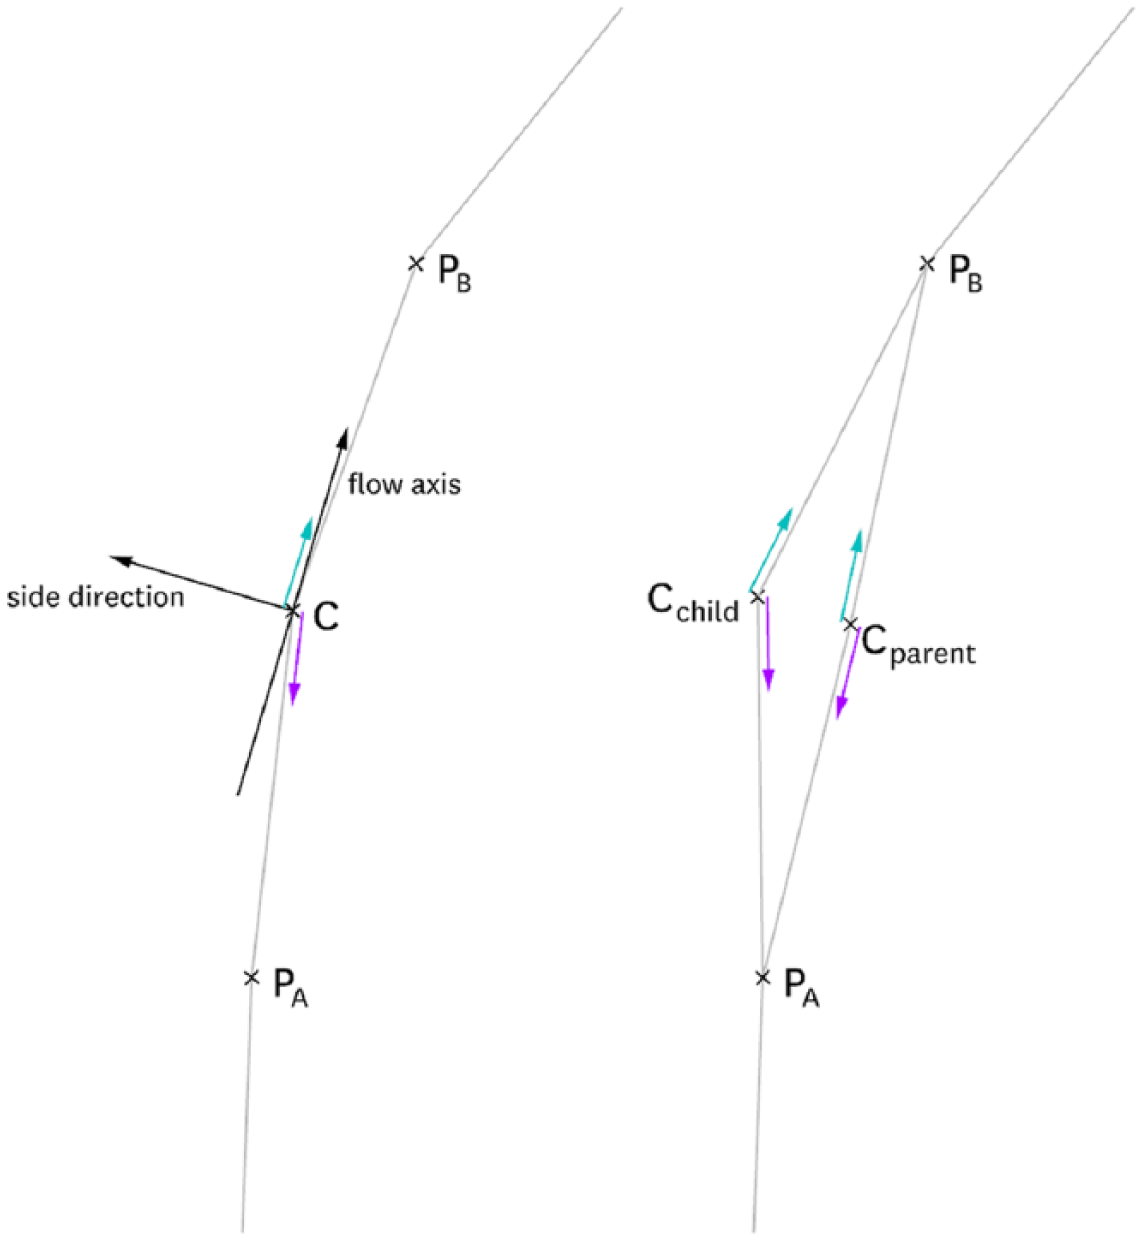
Cell with two connections, before and after division.

Cells with multiple connections in the
The load points which connect to the dividing cell are likewise distributed between the parent and child cells along the flow axis, so that both cells receive an equal number of load-point connections.
Cells can only divide if they are connected to two or more load points. Otherwise, a cell will lose all its connections to the load points, thereby losing any spring in the vertical direction. This will cause the cell to drop downwards and it will be unable to reconnect to other load points, as there are other cells higher up which are closer to any possible load point (Figure 7).

Development of the network during the simulation.
Reconnection of load points
A possible variant of the algorithm allows a reconnection of the load points at every iteration. If a cell other than the currently connected cell moves closer to the load point, the load point will change its connection to this cell. In order to guarantee a gradual adjustment, a load point may only reconnect to a cell if a neighbor of the load point is already connected to it. A cell must keep a minimum amount of load points connected to it in order to avoid losing all vertical springs.
Sets with multiple support points
The algorithm which connects two support points can also be applied to sets of multiple support points. In this case, the support points are triangulated in plan by means of a Delaunay triangulation and split up into separate systems which each have two seed points only. Any two connected support points are then calculated separately as an independently acting network (Figures 8–11).

A set of five support points is triangulated and subdivided into eight separate networks of two support points each.

Set of eight connected two-support-point systems: plan.
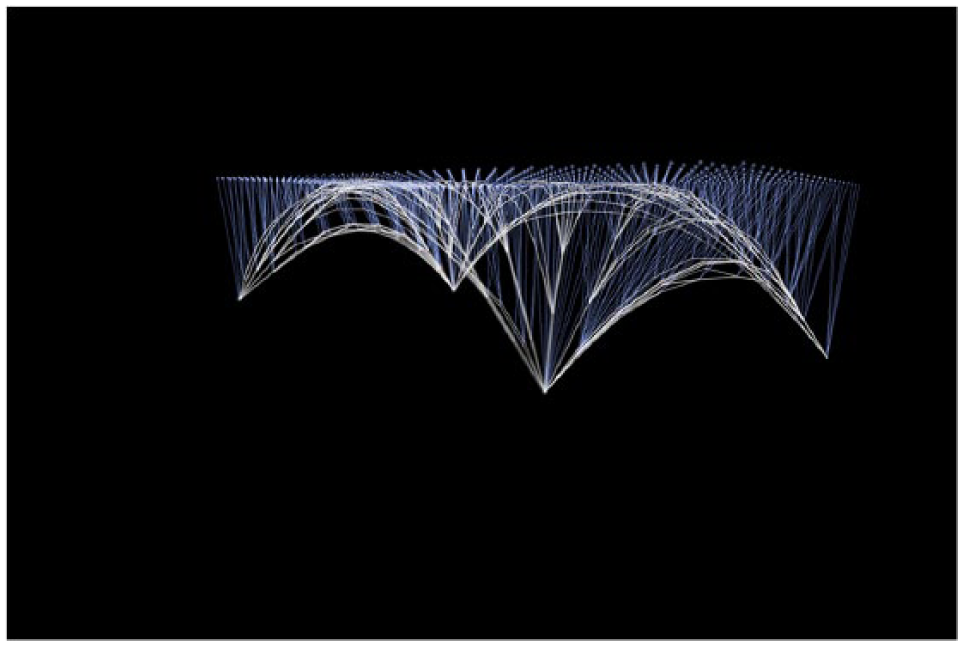
Set of eight connected two-support-point systems: side elevation.
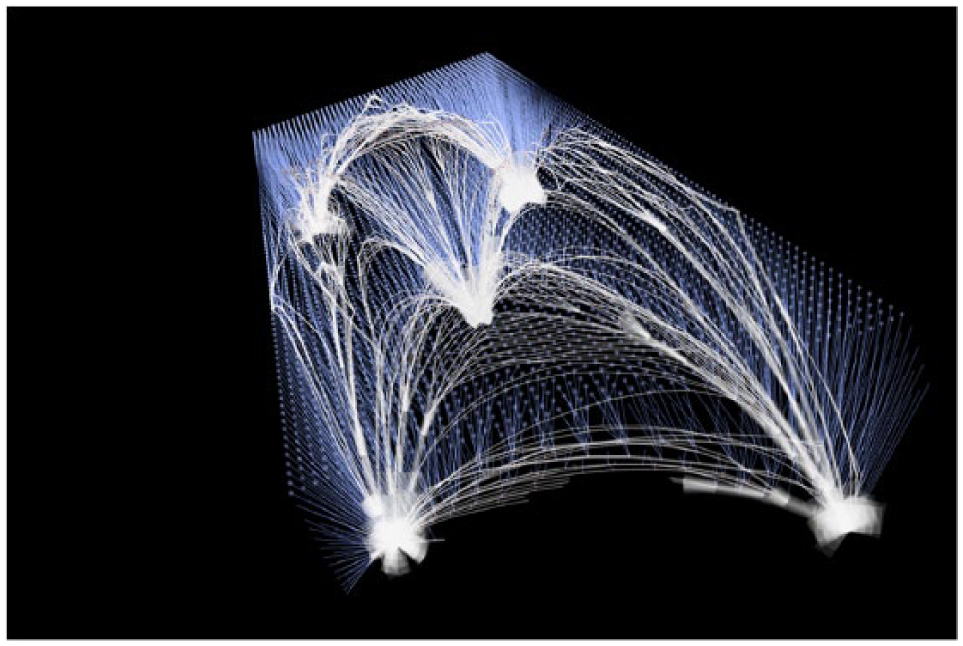
Set of eight connected two-support-point systems: perspective.
Connection to three support points
Lateral loads will cause bending moments at the supports of networks with only two support points. In order to avoid this, the network needs to have a minimum of three support points. It has been attempted to adjust the algorithm accordingly. Let the three support points be
The initial base connections are set by connecting the three support points to their midpoint and by dividing those lines as described above for two-support-point systems (Figure 12).

Initial setup with three support points.
Flow directionality
In the algorithm with two support points, every cell is placed on a path which leads from
The neighbors of each cell are tagged if they are positioned in the direction toward
In the algorithm with two support points, every connection is a link between those two support points, the two connected cells have tagged each other as connecting toward the opposite support point.
In the system with three support points, every spring connection is now a link between all three support points, and still connects two cells. Of those two cells, one cell will have the second cell tagged as connecting toward one support point, while the second cell will have the first cell tagged as connecting toward both of the other support points.
In the diagrams, every spring connection will therefore have three colored arrows pointing along its length, indicating in which direction each support point is placed. The connection toward
In order to identify the main flow axis at a cell, the angles between
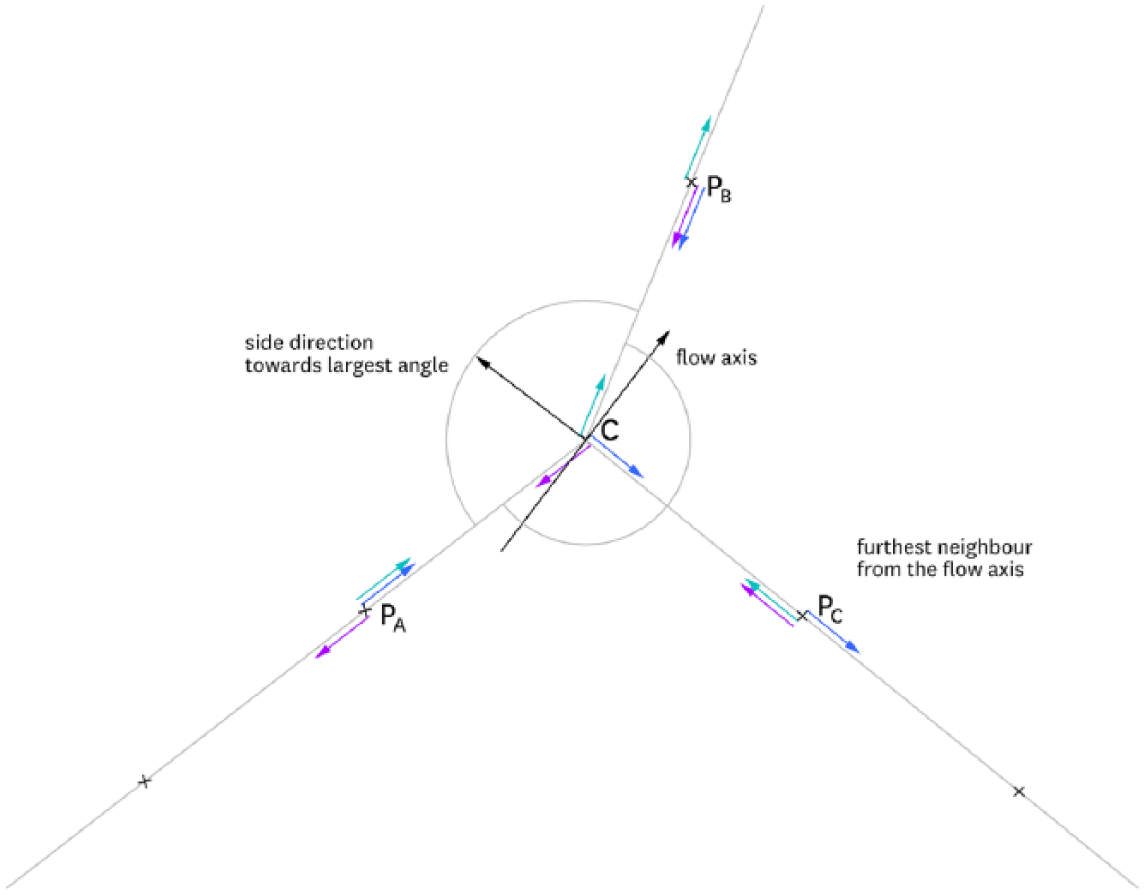
Flow axis for cells with neighbors in three directions. The largest angle between the connections defines the flow axis: at cell
Angiogenesis
During cell division, the parent and child cells are again set apart along the sideways axis, and the load points are divided along the flow axis between the cells as in the algorithm with two support points (Figure 16).
However, the neighboring cells need to be divided so that there are no diagonally crossing connections after the division. Therefore, the algorithm evaluates how the three directions are distributed between the cell’s neighbors and if there are any overlap neighbors which are part of more than one of the groups
The group of neighbors in one direction is identical to the group of neighbors in a second direction.
This situation is effectively the same as in the algorithm with two support points. Neighbors are positioned in one of the two directions. The neighbors are divided along the flow axis as in the two-support-point system (Figure 5).
There is no overlap between the groups of neighbors.
The neighbors in the two directions that define the flow axis are split between the parent and child cells along the flow axis. The sideways neighbors connect only to the parent cell. A new connection is created between the parent and the child cells (Figure 14).
There is a partial overlap between the groups of neighbors.
The neighbors in the two directions which define the flow axis are split between the parent and the child cells along the flow axis. Neighbors with overlap between those two directions are only assigned to the child cell. Neighbors with overlap between the sideways direction and one of the other directions are only assigned to the parent cell. The sideways neighbors connect only to the parent cell. A new connection is created between the parent and the child cells (Figure 15).
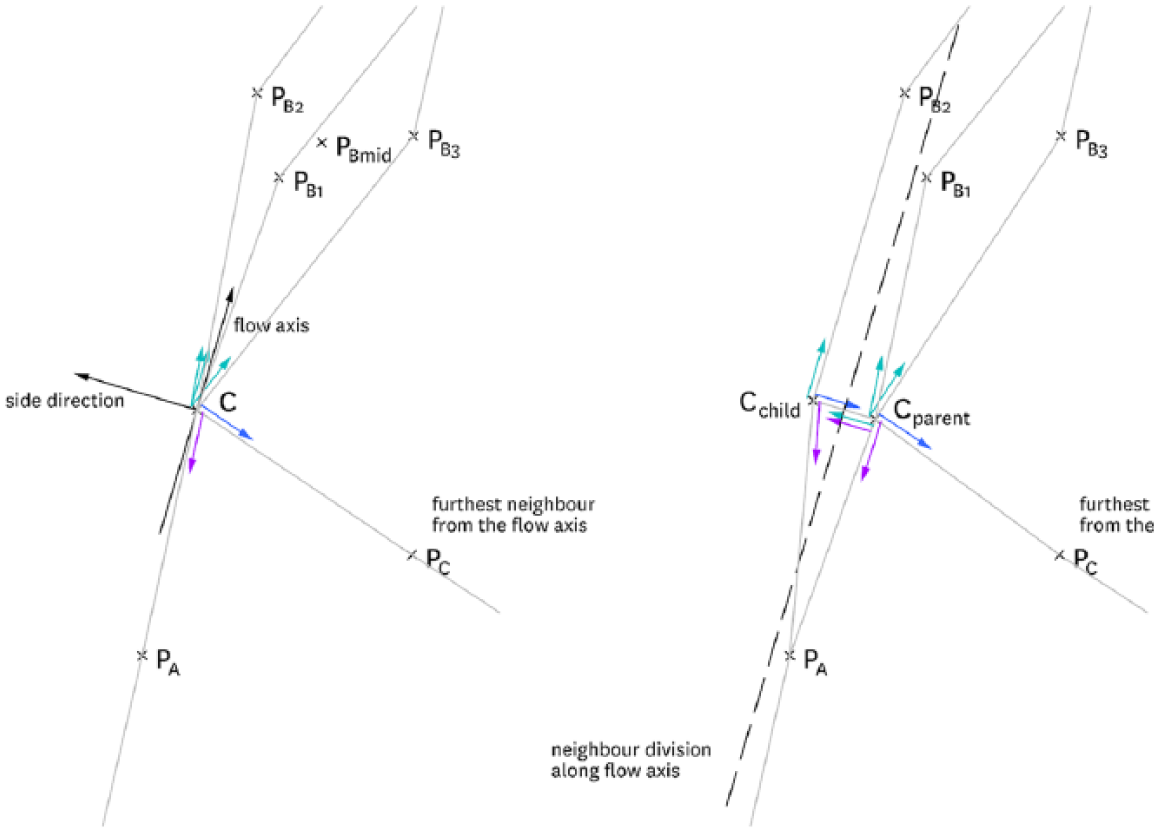
Cell with no overlap between neighbors, before and after division.
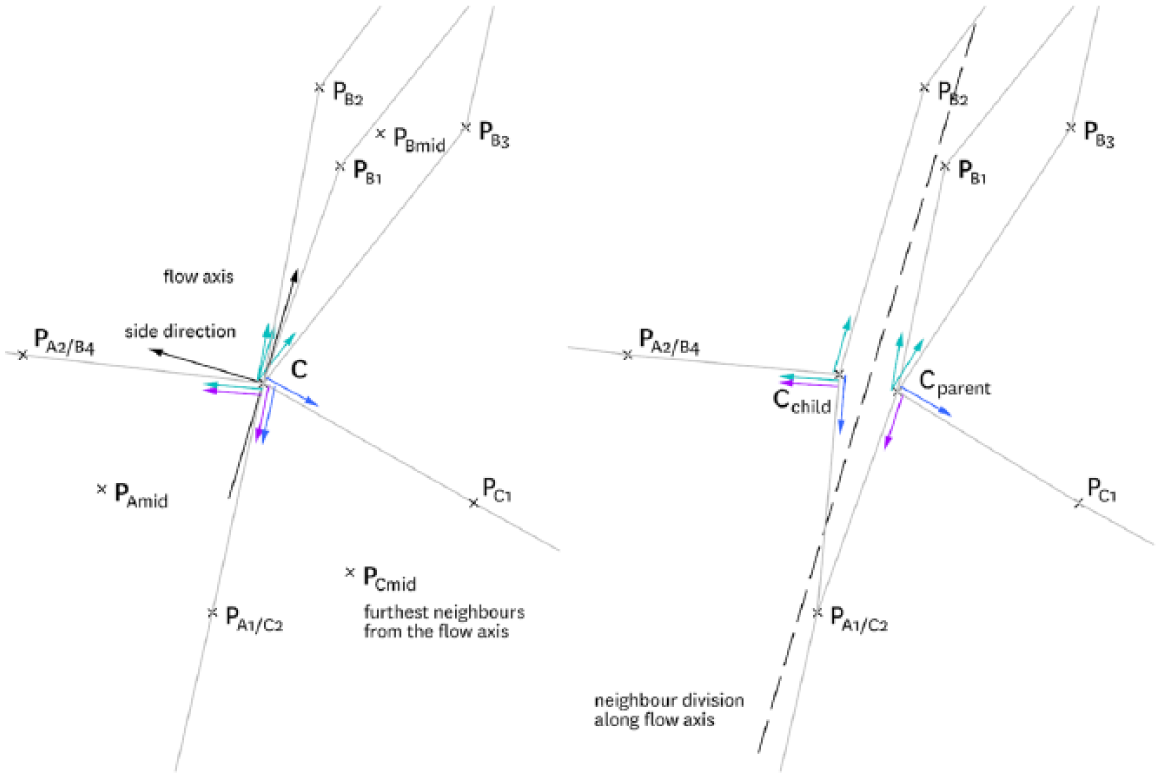
Cell with overlap between neighbors, before and after division.

Development of the network with three support points during the simulation.
The special behavior for situations with partial overlap was introduced as, otherwise, there is a possibility for cells to repeatedly divide and be pulled in the same direction, resulting in excess cell strings.
Finite element analysis
Analysis setup
The resulting models were tested using finite element analysis (FEA). An identical load case was defined to develop and test the structural networks: the load points to be supported are positioned in a grid within a horizontal right triangle with 10 m width and 15 m length, spaced at 250 mm. The loads are to be supported by three point supports in the corners of the triangle, positioned 5 m below the load points.
In order to simulate a slab instead of separate point loads, structural members were defined within the triangle between the load points. The FEA was tested with three different strengths/sizes of the structural members in the slab.
Three load cases were tested: a load of 1 kN/m2 in the x-direction, a load of 1 kN/m2 in the y-direction, and a load of 1 kN/m2 in the z-direction, all applied evenly at the load points in the triangle.
Steel was used as the material for the analysis. In order to compare the performance of the structural systems, the members were scaled so that each model, excluding the structure of the slab, had an identical mass of 10 t.
Network systems
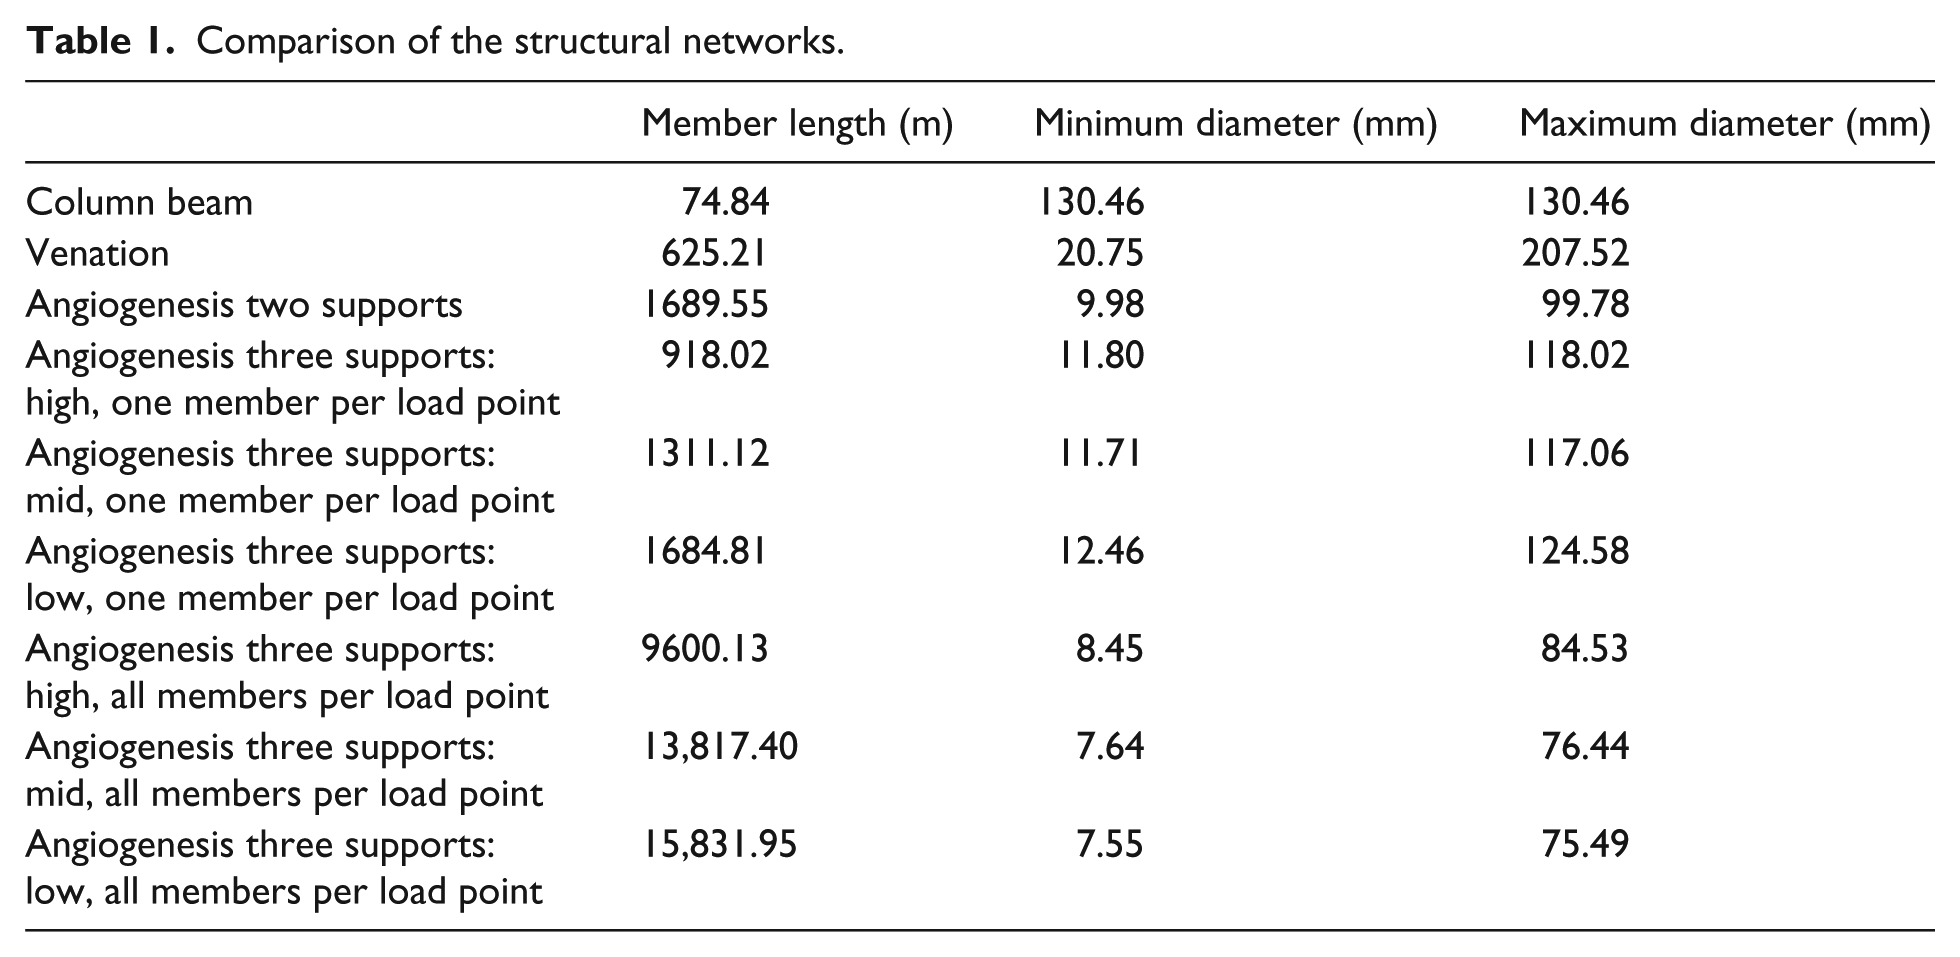
The following networks were tested as structural systems (Table 1):
A column and beam structure, with vertical columns above the three support points and three horizontal beams connecting the columns;
A reticulate venation system as described by Klemmt 1 (Figure 17);
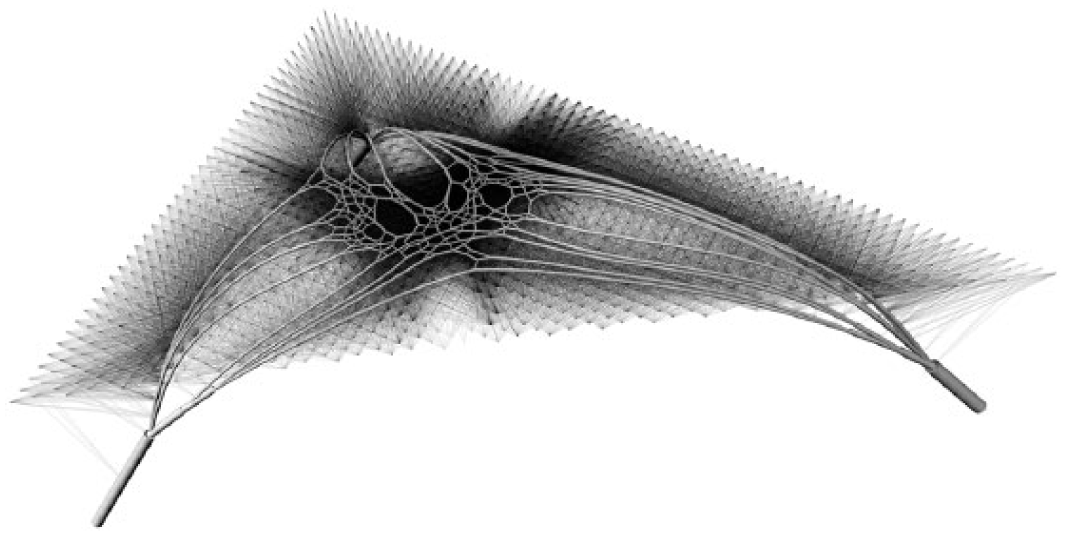
A two-support-point angiogenesis network, consisting of three systems which each form a connection between two of the three support points (Figure 18);
Variations of three-support-point angiogenesis networks (Figure 19).
Comparison of the structural networks.
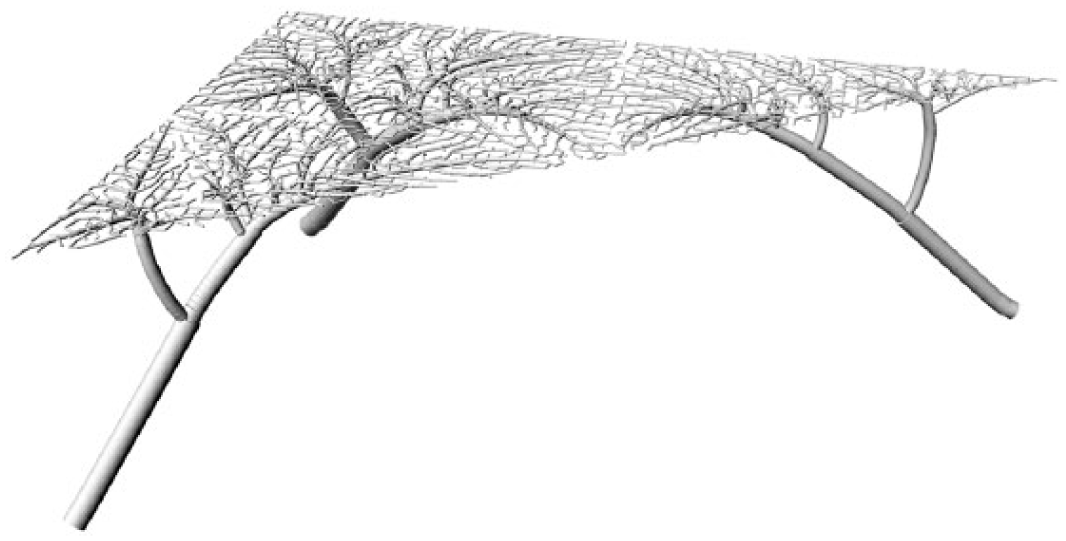
Venation system.

Two-support-point angiogenesis system.
Three-support-point angiogenesis system.
The variations tested were:
Three different heights of the main connecting arches (the arches are then connected by members along the load-point springs to the load points at the 5-m level); In the algorithm, the stiffness of the load-point springs relative to the springs between cells can be set. By increasing their stiffness, the network is being pulled closer toward the load points.
Every load-point spring of the simulation used as a structural member versus only one load-point spring per load point used as a structural member.
The connections of the networks were used as the structural members. In the venation model, different sizes of the members are defined by the number of load points that are supported by a member. 1 In the angiogenesis models, the springs are stretched further if a larger load is acting on them, so the length of a member was used to define its size. The load-point springs were treated equally as all having the smallest member size.
All networks form a similar arching overall geometry. However, in the mid- and low three-support-point angiogenesis models, the apex is positioned about 400 and 800 mm lower respectively.
Deflection results and evaluation
Between the different structural networks tested, the column-and-beam structure performs least well. Its greatest weakness is the central area of the slab which is only supported from the neighboring slab members and consequently deforms the most, especially with a low strength of the slab members (Tables 2–4).
Deflection with low slab strength.
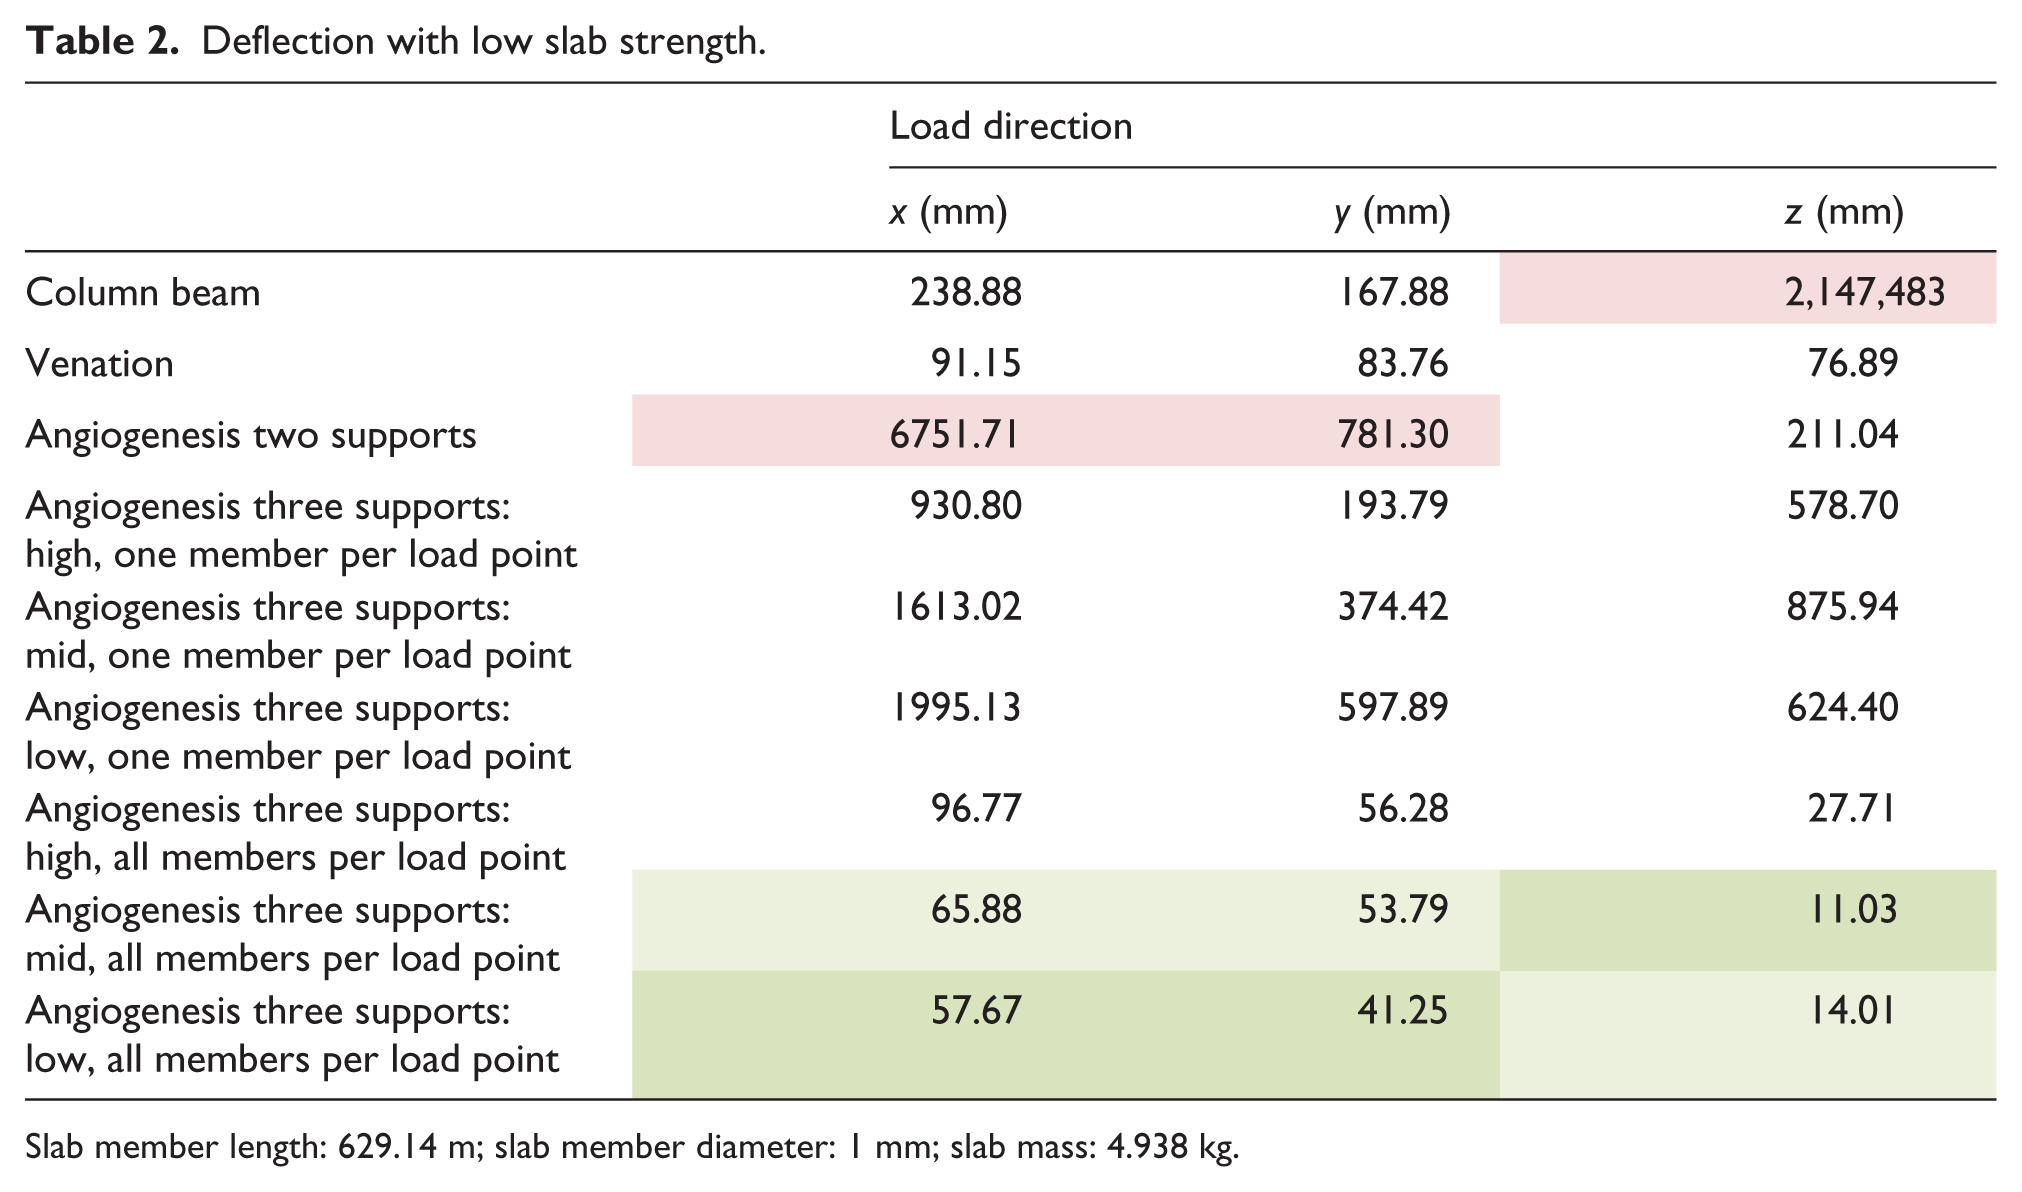
Slab member length: 629.14 m; slab member diameter: 1 mm; slab mass: 4.938 kg.
Deflection with medium slab strength.

Slab member length: 629.14 m; slab member diameter: 10 mm; slab mass: 493.877 kg.
Deflection with high slab strength.
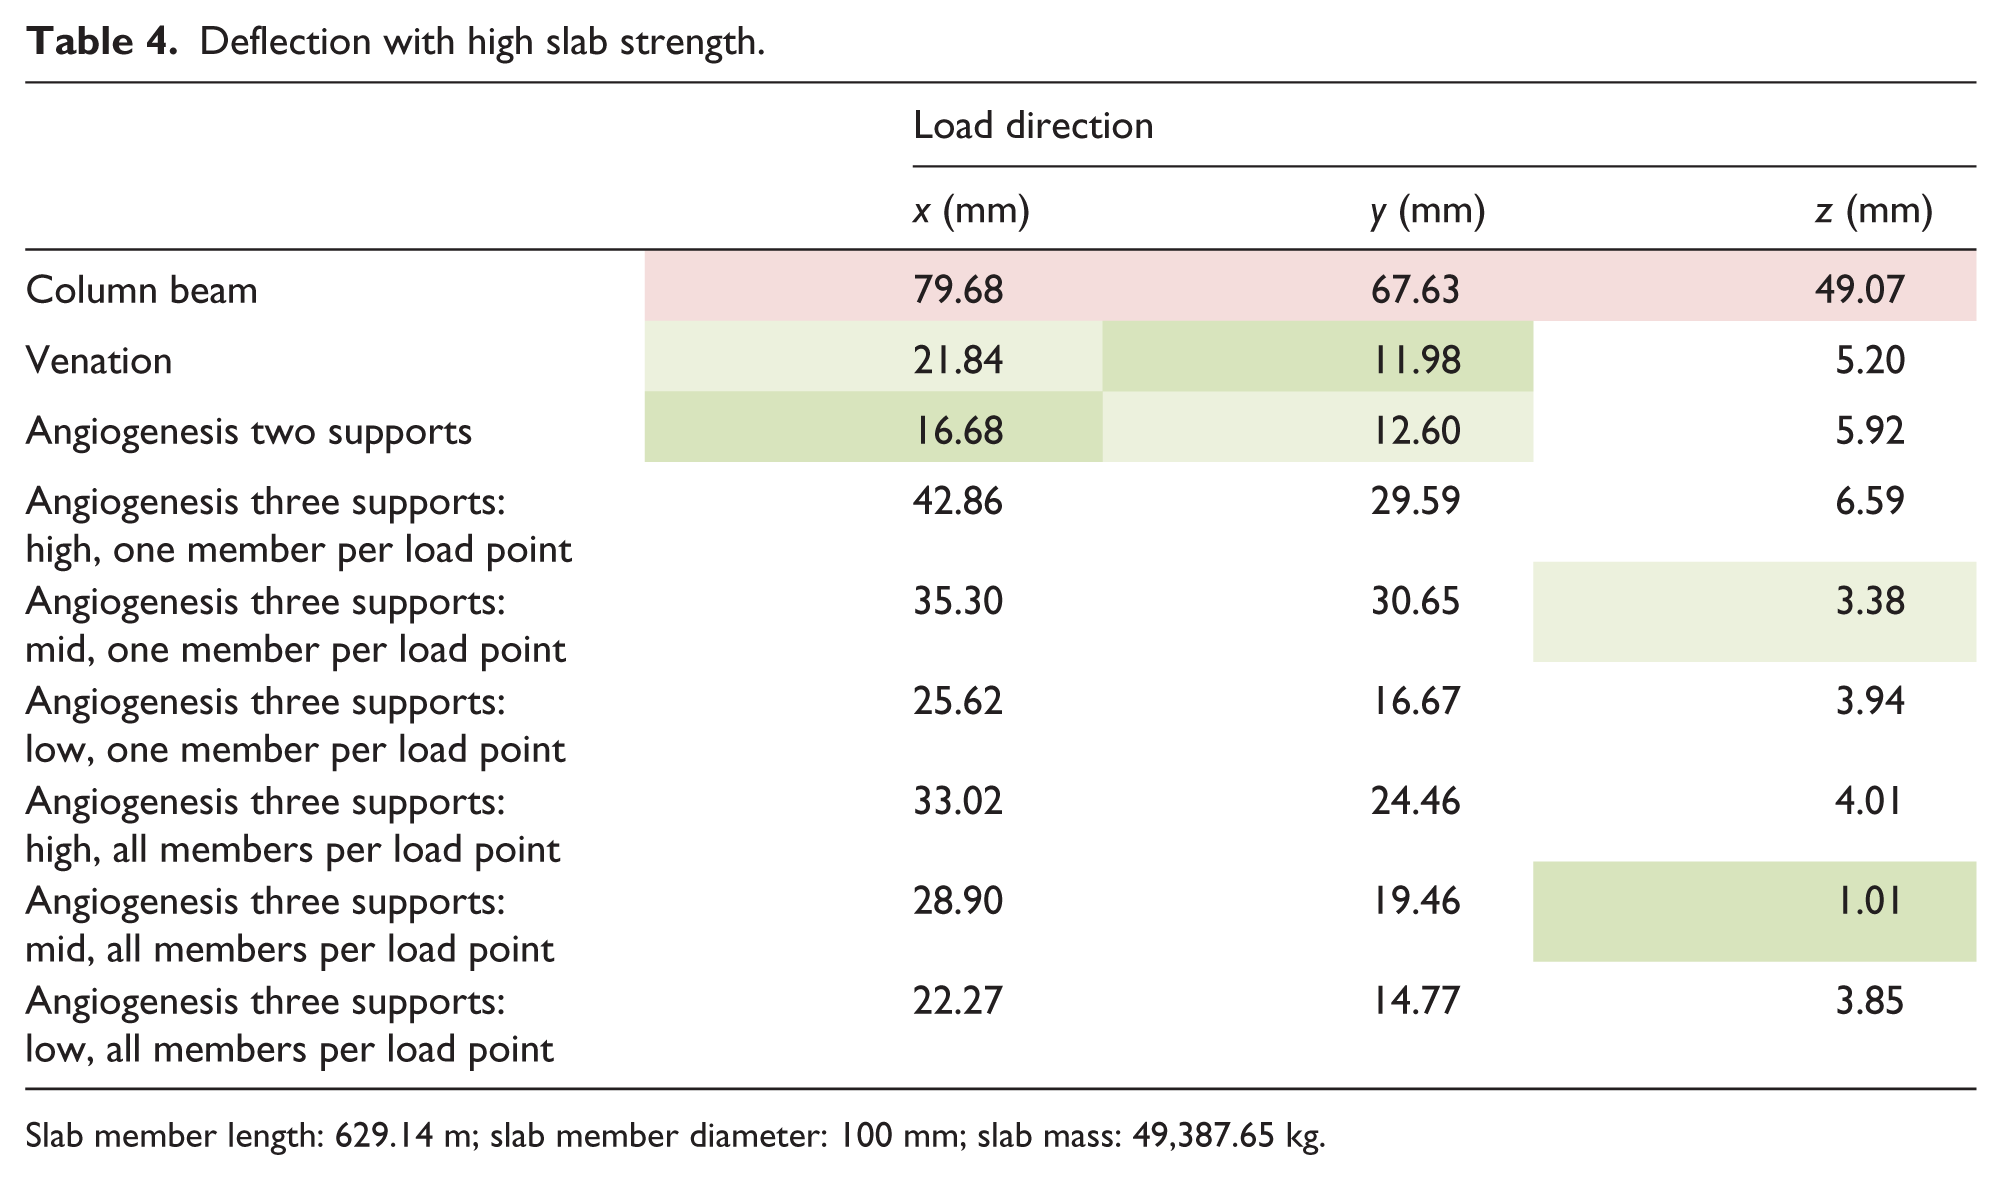
Slab member length: 629.14 m; slab member diameter: 100 mm; slab mass: 49,387.65 kg.
A similar behavior can be observed with the two-support-point angiogenesis model, where the central area of the slab is not very well supported. However, a high slab member strength can act against this, in which case this system performs very well especially for the lateral load cases.
All of the three-support-point angiogenesis structures perform well, especially those where all load-point springs have been used as structural members. This greatly increases the cumulative length of the network members and results in a morphology which could be described as a space frame below the slab.
Among the three-support-point angiogenesis structures with a single structural member to any point load, the structural performance increases if the slab strength is higher and the main members are positioned lower.
It was expected that the angiogenesis structures would perform better than the venation structure as the algorithm used to generate the venation systems does not have a logic based on load transfer. However, the venation structure also performs very well, especially considering that the overall cumulative length of the network is relatively small because of fewer structural members, meaning that it could be built with less effort during construction (Figure 20).

Deflection under loading in the z-direction. Columns show low, medium, and high slab strength. Rows show the nine structural systems which were compared. Magenta indicates the largest deflection within each model.
Conclusion and future work
The proposed algorithm can generate networks which develop from two or three seed points, similar to the way that a venation system develops from a single seed point. The algorithm has been used to generate networks that fulfill structural load-bearing functions. The tests using FEA have shown that the networks perform well as structural systems. However, the comparative structure based on a venation simulation performs similarly well, although the venation growth does not follow a structural logic.
If applied to construction, some of the three-support-point angiogenesis models have a large amount of individual members as indicated by their overall member length (Table 1). This will increase costs and may cause difficulties in their constructability.
The proposed algorithm utilizes the logic of a spring system to suggest the positioning of structural members. A constraint of the networks is that every cell needs to have at least one connection to a load point for it to not drop down and become non-load bearing. While a spring system simulates forces, it does not simulate the transfer of loads well and does not take bending moments into account. It is therefore proposed to develop a growth algorithm which is based on a more realistic calculation of structural forces and behaviors.
Variable graph spring systems, which are altering, adjusting, or extending their network graph during the relaxation simulation, are expected to satisfy a variety of other purposes and should be explored further. The proposed algorithm is based on a sideways division of cells, which resulted in arch and dome formations but did not yield functional results for multi-level arrangements of the load points. Different arrangements of support and load points and different rules of division are expected to result in other network typologies, which may be suitable for different structural or other applications.
It would also be of interest to explore further applications of the algorithm, for example as a tool to generate circulation systems, to propose programmatic relations and densities, or to develop architectural geometries, arrangements, and patterns.
Footnotes
Acknowledgements
This article was written by Christoph Klemmt as part of a doctorate under the supervision of Prof. Dr Klaus Bollinger at the University of Applied Arts Vienna.
Declaration of conflicting interests
The author(s) declared no potential conflicts of interest with respect to the research, authorship, and/or publication of this article.
Funding
The author(s) received no financial support for the research, authorship, and/or publication of this article