
Abstract
Artificial intelligence, and in particular machine learning, is a fast-emerging field. Research on artificial intelligence focuses mainly on image-, text- and voice-based applications, leading to breakthrough developments in self-driving cars, voice recognition algorithms and recommendation systems. In this article, we present the research of an alternative graph-based machine learning system that deals with three-dimensional space, which is more structured and combinatorial than images, text or voice. Specifically, we present a function-driven deep learning approach to generate conceptual design. We trained and used deep neural networks to evaluate existing designs encoded as graphs, extract significant building blocks as subgraphs and merge them into new compositions. Finally, we explored the application of generative adversarial networks to generate entirely new and unique designs.
The story goes that Philip II of Spain ran a competition for the design of a monastery in Madrid in the 16th century and hired Italian architect Giacomo Barozzi da Vignola to organize and facilitate the competition. In total, 22 architects responded to the challenge and submitted designs. However, Vignola did not rank the entries and select a winning scheme as planned. Instead, he composed a new design by collaging bits and pieces from competition entries he deemed strong. Vignola then presented his composition to the King, who was impressed and gave him the commission. 1 Of course, such a procedure would certainly break all kinds of ethical norms of today’s profession. What if, however, the most ideal solution lies in a collective design approach, that is, in composing high performing parts of separate design entries into a new whole? In this article, we present research on a deep neural network (DNN) or deep learning application that extracts design into essential building blocks – based on functional performance criteria – and recombines them into new designs.
Over the last 5 years, research in machine learning has exploded thanks to fast developments in deep learning. DNNs used on a wide range of practical applications, from voice recognition systems, such as Siri and Alexa, to self-driving cars, to online recommendation systems and pricing algorithms. These networks can be trained with large amounts of data and discover latent patterns and relationships that may not be apparent to humans looking at the data independently. They do not need to be programmed upfront but learn the rules directly from the data itself, which functions as the ‘training set’. 2 Most DNN research is in computer vision, in which DNNs are trained with vast numbers of images. For example, one can train a DNN to recognize dogs by showing it a training set of dog images. Once the system knows what an image of a dog entails (by means of a discovered internal representation), it will correctly predict and classify a dog in new images.
Using DNNs in spatial design is more complex. Architecture is shaped by a broad set of interdependent issues. In his treatise De architectura, written in 80 BC, Vitruvius wrote that any successful architecture should provide for function, beauty and structure. And, Walter Gropius in Scope of Total Architecture claimed that ‘good architecture should be a projection of life itself that implies an intimate knowledge of biological, social, technical and artistic problems’. 3 Architecture does not only deal with functional perfection but also need to respond to (im)material and contextual conditions. As Gropius says, architecture has to ‘satisfy the human soul’ and has to inevitably respond to aesthetic questions, structural efficiency and deal with contextual, ideological, socio-cultural, and economic constraints and opportunities.
In this article, however, we concentrated on function-driven conceptual design, in order to study the applicability of deep learning through an isolated but essential driver in architectural decision-making. Nonetheless, one could take DNNs to explore other much-needed questions dealing with the wider scope of architecture. For example, there could be hybrid DNNs, where one DNN could identify design vocabulary, shapes and so on, and work in tandem with another DNN to complement a functional layout. In other fields, artificial intelligence (AI)-driven style-transfer applications have been developed. For example, Alex Champandard’s work on Neural Doodles: Deep Convolutional Networks for Semantic Style Transfer turns rough scribbles into paintings by famous artists; Sony is working on a system that can turn any song into a new style or genre and Adobe is developing a photoshop for audio that converts a given text into any person’s voice expression. One could certainly speculate on style-transfer applications for architecture as well, where, for example, a ‘style’ of a well-known architect – discovered through neural networks – is applied to the layout developed by another DNN. Or, given there is available data, one may use DNNs to discern patterns that investigate the causality of ideology and culture to aesthetic choices, topology, urban development and so on. However, these and other such important questions were beyond the scope of this article.
In this study, we limited the set of functional targets to tangible performance criteria, such as the organization of spaces, their spatial attributes, or their connections to each other. However, the range of functions can be expanded to intangible criteria as well, such as sensory responses to architectural spaces, for example, feelings of comfort, pleasantness, boredom, fascination, amusement, surprise or spirituality. In fact, what delineates function in architecture is often not well-defined. For example, in the article Doshi’s Sacred in the Secular, the author criticized the announcement brief of the 2018 Pritzker Prize to Indian architect Balkrishna Vithaldas Doshi. He questioned the awarding committee’s description of Doshi’s architecture as ‘both functional and poetic’, which suggests that these two qualities are mutually exclusive: ‘… Isn’t architecture’s poetic content an essential functional element, if we wish our buildings to touch the soul? Is our sense of the spiritual seriously impaired if we cannot see the poetic as architecture’s primary function?’ 4 Indeed, one could expand on the definition of function and use DNNs to decipher latent patterns and relationships that correspond to intangible qualities of architecture. DNNs can be trained with any set of qualitative criteria, and these may vary for different building types, for example, houses, churches, mosques, libraries and hospitals. In this study, however, we limited research to conventional functional attributes of residential architecture, that is, the functional resolution of bedroom areas, bathroom spaces and other living quarters.
How does deep learning differ from more conventional design computing approaches? One important difference is that DNNs are not structured on rules or prior algorithms but learn patterns through the training process. This contrasts with earlier approaches of generative design. For example, in shape grammars, new designs can be composed by design rules that dictate what shapes can be formed by their repeated application on basic building blocks – if these building blocks and rules of assemblies are known and finite.5,6 For example, a discursive shape grammar has been shown to emulate Alvaro Siza’s style of architecture and generate variations of his Malagueira houses. 7 However, we approached generative design through deep learning, where building blocks or rules of how to put them together are not pre-determined. Instead, the DNN discovers them from the design data. If one has enough samples of Siza’s design collection, for instance, a DNN should potentially be able to learn latent or known rules that Siza may have intentionally or intuitively applied in his work.
DNNs loosely mimic the inner workings of human brains, and their setup contains (1) an input layer, (2) hidden layers (which process the data) and (3) an output layer that produces a result (Figure 1). The setup is reconfigurable, and one can iteratively manipulate the weights of neurons and improve the performance of DNNs over time. Through this training process, the DNN can learn gradually to output correct results, for example, accurately labelling the dog image. The rate of DNNs correctly identifying objects in images has surpassed that of human vision. 8 This is important, for example, in autonomous cars, where the instant discrimination of objects in real-time video feeds are essential to the success of steering cars safely on the road.
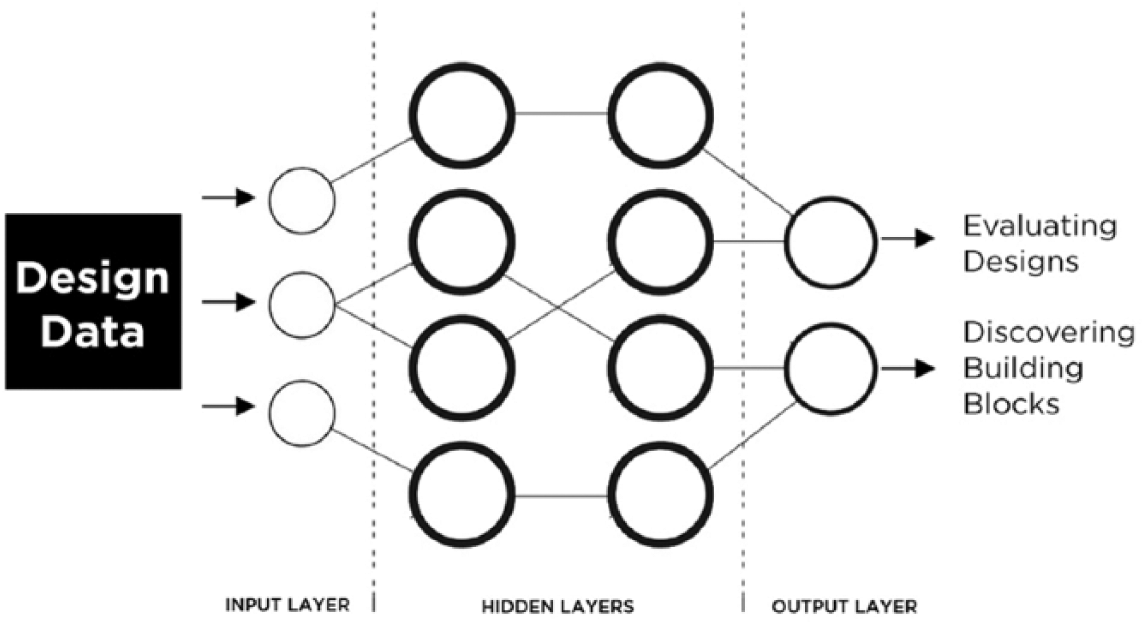
Abstract representation of deep neural networks (DNNs). Data are fed into the input layer, which is processed in the hidden layers (there can be any number of hidden layers), and a result is produced in the output layer.
DNNs are classified as supervised or unsupervised. Supervised DNNs are trained with labelled data, that is, data that contain information on type, attributes or scores. In contrast, unsupervised DNNs are fed with raw data without any added information about the characteristics of the data. In our research, we used both systems; for one study, we used labelled design data of various houses (represented as graphs with node and edge attributes) with functional scores and hence utilized a supervised DNN. In another study, we used labelled design data, but without the functional scores, which can be considered an unsupervised DNN.
The training set for our DNN consisted of graph representations of architectural designs, since this mode of representation can capture structured relationships between system components much better than continuous media formats, for example, images. Graphs are mathematical structures comprising nodes (denoting system components) and edges (denoting relationships between nodes), and they lend themselves to mathematical and algorithmic analysis at the level of system components. Graph theory has been used as a powerful representational and analytical tool in diverse fields such as social network analysis, transportation network analysis, biological network modelling and Internet engineering. In our study, node and edge attributes capture interesting physical characteristics of architectural design components, for example, area and volume. In contrast, graph attributes characterize the overall design functions, for example, liveability and sleepability. These are exposed to graph-based DNNs, which attempt to find patterns occurring in architectural design samples. Such an analysis is hard for pixel-based images, which do not carry any explicit semantics of architectural designs.
In this article, we illustrate how DNNs can evaluate and score designs on a given performance criteria and identify essential building blocks of design – represented as subgraphs. The DNN identifies subgraphs from design data that correlate strongly to various user-desired functions, and then, they are combined into new compositions. Determining which nodes to connect across subgraphs leverages node embedding methods such as node2vec 9 and its attributed variant. 10 These methods use DNNs to learn representations of nodes in graphs as points in dense Euclidean vector spaces. Various latent relationships between groups of nodes manifest themselves as proximity relationships between corresponding points in the target vector space. The latter thus provides interesting suggestions to the composition algorithm regarding which nodes in different building block subgraphs should be connected in the final design.
We also demonstrate how one can go beyond composing building blocks into new designs and instead use generative adversarial networks (GANs) to generate unique and original design variations. GANs have been proposed to generate new data samples from a specific domain that are very similar (but not identical) to our training set. A GAN consists of two interacting DNNs (discriminator and generator) that typically learn in tandem in an unsupervised manner by means of an adversarial game. Typical uses of GANs have been to generate unforeseen yet believable samples in continuous media such as images, text, speech or even videos. In this study, we showcase a less common application of GAN – we train it on an existing data set of architectural design graphs to generate new graphs that could be considered the basis for new variations.
Both our proposed methods to generate new designs have their own advantages. While the building block discovery method helps produce architectural designs that coherently combine good patterns in existing human-generated data to achieve multiple user-desired functions, the GAN-based method attempts to produce unforeseen architectural designs that may not have occurred to human architects.
Background
In architecture, a typical project goes through the following phases of development: conceptual or pre-design (PD), schematic design (SD), design development (DD), construction documents (CD), procurement (PR), construction administration (CA) – that is, the implementation of the project – and later on continues with operations (OP) in order to manage the building itself. Figure 2 depicts the well-known MacLeamy curve, where the time axis shows the design phases of a project and the y-axis shows the corresponding effort/effect value. Curve #2 shows the traditional design process and suggests that the majority of design activities occur at the CD stage. However, this phase is not cost-effective, as can be seen in curve #1, which shows the cost of changes in design over time. Therefore, the earlier the design is generated the better, because the cost of design changes increases dramatically in the later phases of the project. The widespread adoption of building information modelling (BIM) software in the profession is partly due to the claim that BIM moves the bulk of design activities to the earlier SD/DD phases (curve #3) and thereby reduces costs significantly. But what if we could move the hump in the figure even earlier, to the conceptual design phase of a project? Can machine learning help us to achieve this goal, or better, can it decrease the size of the hump altogether? While our concern is not cost per se, we aim to explore design solutions for the conceptual design phase.
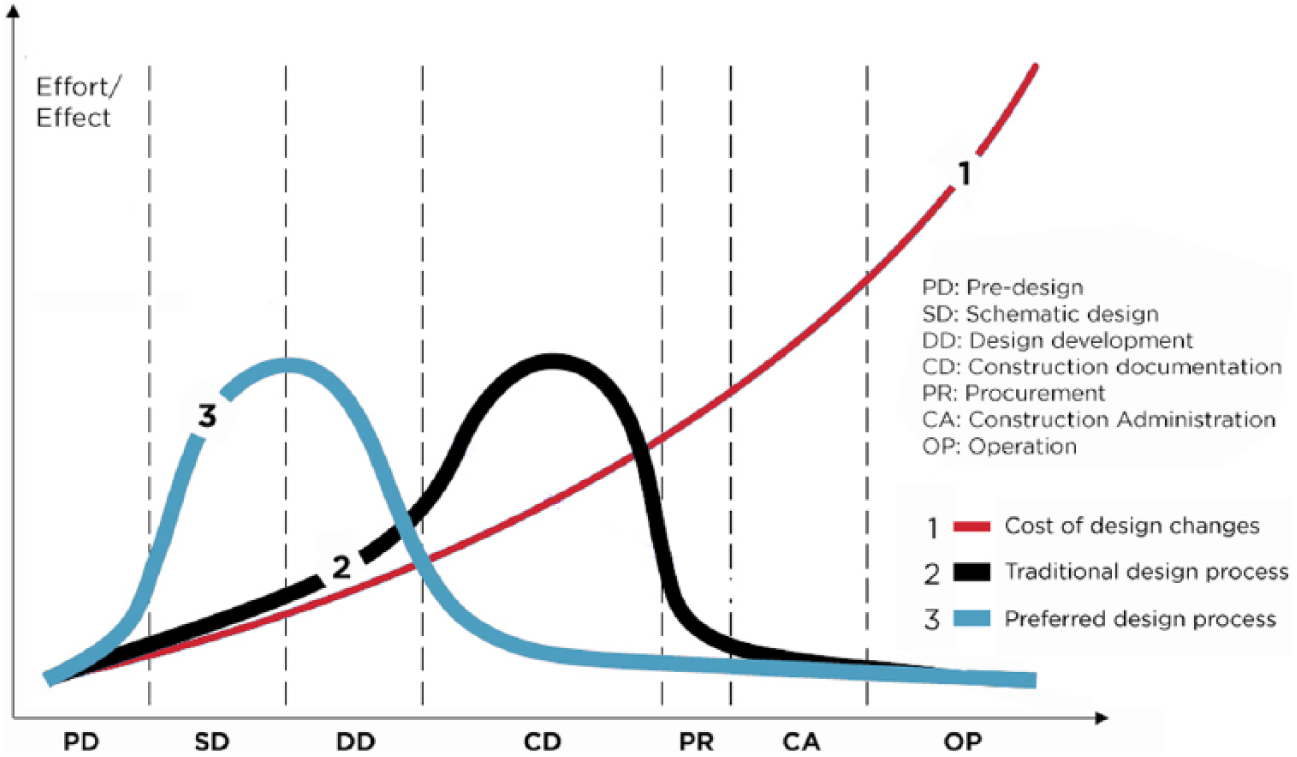
The MacLeamy curve shows the various building phases in chronological order on the x-axis, and the effort/effect values on the y-axis. Traditionally, the majority of design deliberations occur at the construction documents (CD) phase, seen in curve# 2, which is considered to be too late in the design process and not very cost-effective.
Unlike design, engineering challenges are usually resolved through convergent problem-solving, where various efforts are funnelled towards a single solution. The ‘logic of design’ is, however, based on divergent problem-solving. Architecture does not provide a single correct answer but entertains the possibility of multiple answers to the same spatial problem. In other words, there can be different solutions satisfying the same design problem. Therefore, for instance, competitions are a fitting method for design acquisition, because they offer multiple solutions to the problem. However, current-day computer-aided design (CAD) tools are built on principles of inductive and deductive reasoning that perform well for engineering problems. Yet, design is based on abductive reasoning, and therefore, these tools cannot effectively assist designers in the early stages of the design process. 11 Instead, they are better suited to respond to the later phases of the project, where the majority of design decisions are already made. 12 It is for this reason that, quite often, studio instructors encourage students to use freehand sketching at the beginning of their projects, which allows them to quickly generate multiple design ideas, without unnecessarily resolving them in CAD. However, the lack of viable computational resources for the early stages of design is an important gap in the project cycle that machine learning may help to resolve.
Methods and techniques
In this article, we present research on using deep learning for the conceptual design phase of the project. We explored two parallel paths for design generation: (1) DNNs for convolution and representation learning: we used a graph convolutional neural network, which discovered essential building blocks responding to certain functional performance criteria. These building blocks were afterwards merged into new designs using graph-theory methods and data about the proximity of nodes in latent vector embeddings – which we will describe in more detail. (2) GANs: DNNs are very effective at discovery and classification; however, they are not set up to generate new designs. That is, one cannot generate a new type of car, for example, an SUV, from a training set of sedans. Therefore, we explored GANs, a new version of DNNs, to expand beyond merging building blocks into new compositions. Our main objectives for this study were given as follows:
Discovering latent topological features that constitute essential building blocks of designs – by extracting structures, connectivities, behaviours and so on that are important to serve a particular target function;
Composing discovered building blocks into new designs that meet new user requirements;
Evaluating the feasibility of generated candidate solutions;
Exploring GANs for unique design variations.
Projecting architecture onto graphs
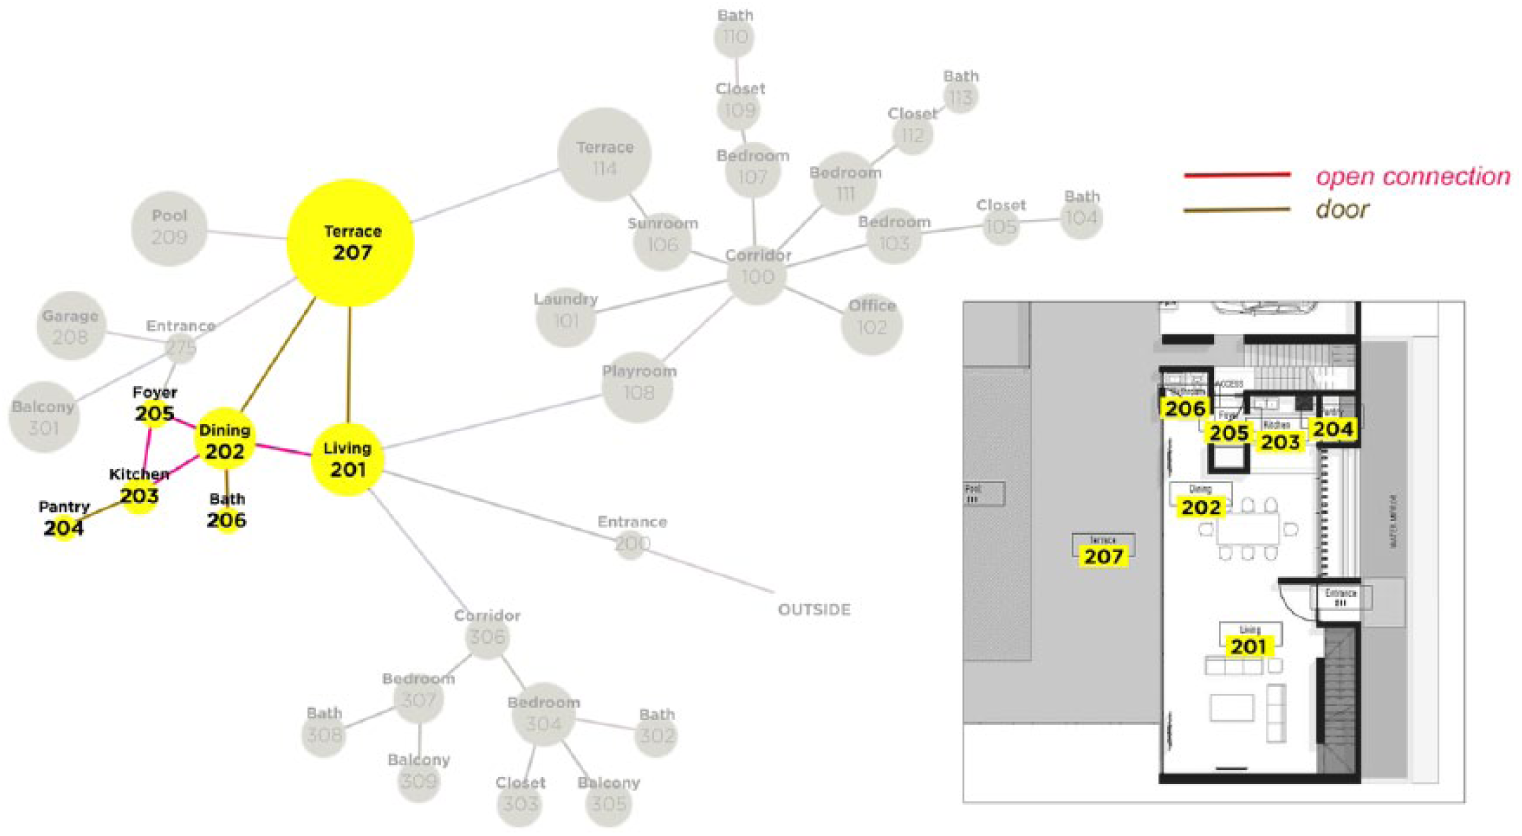
Architecture is conventionally represented through two-dimensional orthographic drawings, for example, plan drawings, sections and elevations. However, for this study, we used three-dimensional BIM models and translated the disposition of spaces in the various designs into attributed graphs (Figure 3):
Nodes in the graph represent rooms and have attributes such as type, area, volume and perimeter.
Edges in the graph represent the type of adjacencies between rooms – for example, door connection, open connection or vertical connection, such as stairs, ramps or elevators.
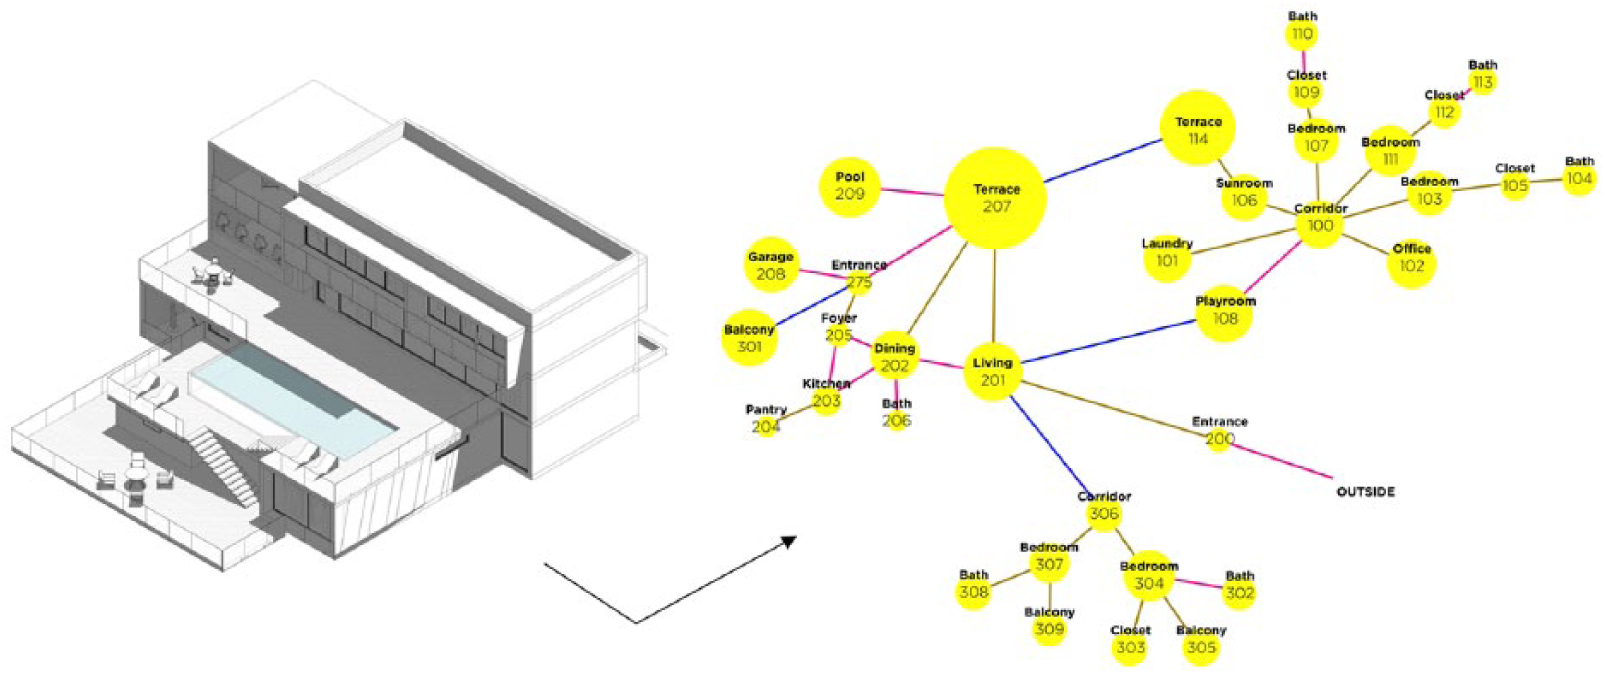
Attributed graph model for architectural design (House #8): (left) axonometric view of the house. (Right) Graph representation of the house. Nodes (yellow circles) denote rooms, and edges denote connections between rooms. Nodes have attributes such as type, area (indicated by size of the circle) and volume; and edges have attributes such as type: vertical (blue), open connection (pink) and door (beige). Numbers inside nodes are IDs and denote the floor levels.
While we restricted our attention to limited levels of detail, graph models have the capacity to represent more information, such as objects inside rooms, dining tables and lighting fixtures. To add such data to the graph, the room node would be connected to the dining table node by an edge that models the containment relationship. In addition to nodes and edges, we also added evaluation scores to the graph.
Evaluating the training set
We manually evaluated the training set on liveability, measuring the degree of comfort of living on a 1–100 scale, and also on sleepability, measuring how comfortable is the house for bedroom-related activities. Other functional scores could have been also added, for example, cookability – how comfortable is the house for dining-related activities – or sustainability – what is the carbon footprint of the house and so on. Any such data, if available, can be attached to graph representations. However, most evaluations are subjective scores given by humans, which may naturally vary. Also, there can be quite a big difference in how buildings are judged depending on the physical or cultural context of the building and on who the reviewers are, for example, home-owners and design professionals. The DNN can certainly be tailored potentially to respond to a particular user group, at a certain geography and cultural context. For example, it has been shown that neural networks can be trained with designer-specific fitness criteria to evaluate generated designs. 13 However, for this study, such variations in the evaluation process were beyond our scope of investigation.
Extracting essential building blocks
Once we generated the graphs for the training set, we surveyed research methods to extract essential subgraphs. We explored existing graph-mining applications, some of which have been successfully used in chemical compound mining. In these studies, essential building blocks corresponding to particular chemical properties, for example, water solubility, have been extracted. 14 Chemical compounds were represented as graphs, that is, nodes representing atoms and edges showing types of bonds. The discovered building blocks were then projected as subgraphs. In our case, the analogue to atoms and bonds was, respectively, various types of rooms with attributes and various types of connections among rooms; and the analogue to chemical compound properties was functional performance criteria, that is, target functions such as liveability and sleepability. By employing and training a supervised graph convolutional neural network, we discovered interesting building block subgraphs buried in the design samples whose presence is strongly correlated with high target functional scores.
The DNN architecture
Figure 4 illustrates the DNN architecture that was used to discover the building block subgraphs. Each layer of the DNN consists of neuron holding real-valued representations of attributes of nodes of the graph. In each layer, convolution is performed on the attributes of each node, for example, room, in the graph, by essentially summing the attribute values (type, area and volume) in its neighbourhood in the graph. The result is then multiplied by hidden weights corresponding to that layer and passed through a non-linear function before being multiplied by more hidden weights and then mapped to a probability distribution. The probabilities in each layer contribute to a latent representation vector of the attributes of the specific input graph, which in turn is correlated with the target function score via linear regression. For each increasing layer in the DNN, contributions from larger r-hop neighbourhoods of each node are accumulated and remembered within the ‘hidden weights’. The r-hop neighbourhood of a node u in the graph corresponds to the subgraph containing all nodes and edges that are within distance r from u. Thus, if subgraph patterns are found among nodes with certain types of attributes in an r-hop neighbourhood of a node and these patterns correlate strongly with a high target functional score, the DNN will remember them in the hidden weights of the rth layer after the training phase converges with a low value of root mean square error (RMSE). RMSE is the square root of the mean of squares of pairwise errors between the predicted and the actual function values of design samples and is computed over a batch of training samples. While there is no domain-independent guideline for what is considered a good error margin, we consider a normalized RMSE below 15% as indicative of good performance. Then, for a given r, we output subgraphs of radius r that have a high linear regression coefficient and a high activation score in the rth layer neurons in the DNN. These subgraphs are expected to correspond to building blocks of commensurate size that correlate strongly with high target functional scores. r ranges from 1 to R (the number of layers in the DNN), which is upper bounded by the radius of the sample graph with the largest radius.
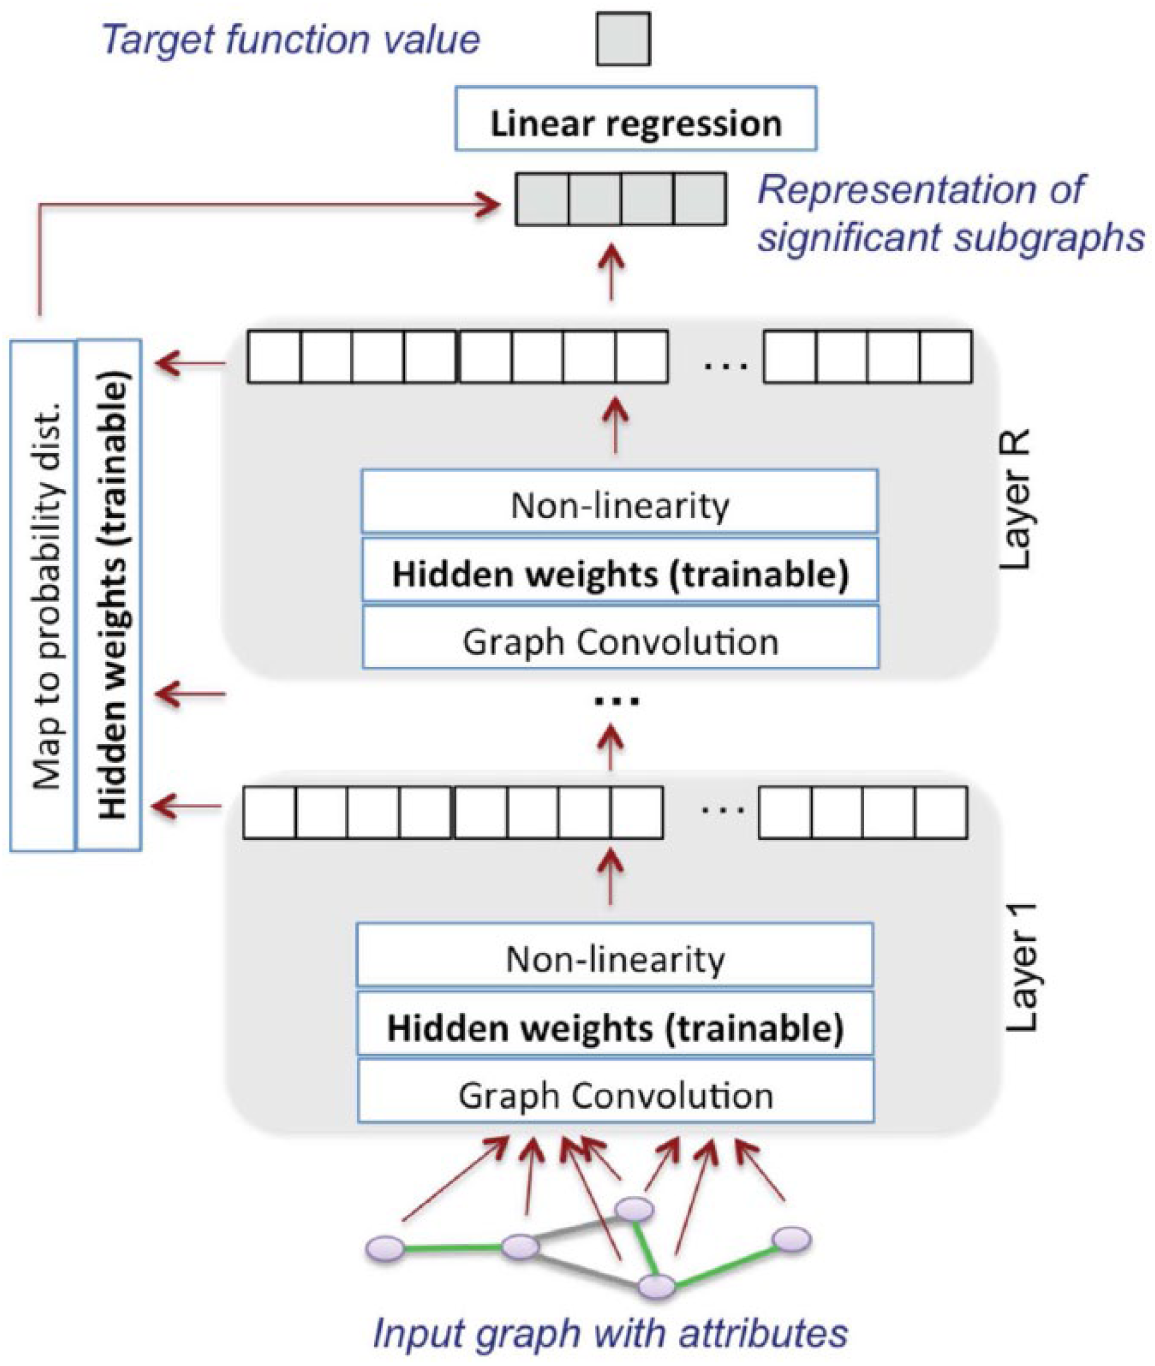
DNN architecture for discovering building block design subgraphs.
Merging building blocks into larger compositions
Once we identified essential building blocks, that is, subgraphs, the challenge was how to stitch them together into new compositions. We based our research on prior work that described how to merge graphs into larger assemblies. 15 However, these methods did not show how open-ended nodes in merged subgraphs may get connected. Thus, we developed techniques to close such open-ended nodes by adding new edges and further augment new designs with additional nodes. Furthermore, the question remained whether generated designs are acceptable solutions or not. Some compositions might work, but once put together into larger assemblies they might be unrealizable. Therefore, we looked into various mathematical groundworks that can filter unfit solutions out. Also, crowdsourcing, for example, Mechanical Turk, can eventually be used to have humans judge the validity of designs.
The workflow of the system
Figure 5 illustrates the outline of our neural network system: on top, design data are fed into the DNN (#1), which discovers latent structures, building blocks (#2); important components of designs are represented in higher dimensional vector space (#3). The building blocks are then merged into new compositions via the components’ vector representations, or domain-specific architectural rules (#4); GANs generate entirely new design variations (#5). All new designs went through a validation process, through which impossible designs are filtered out and valid solutions are identified (#6).
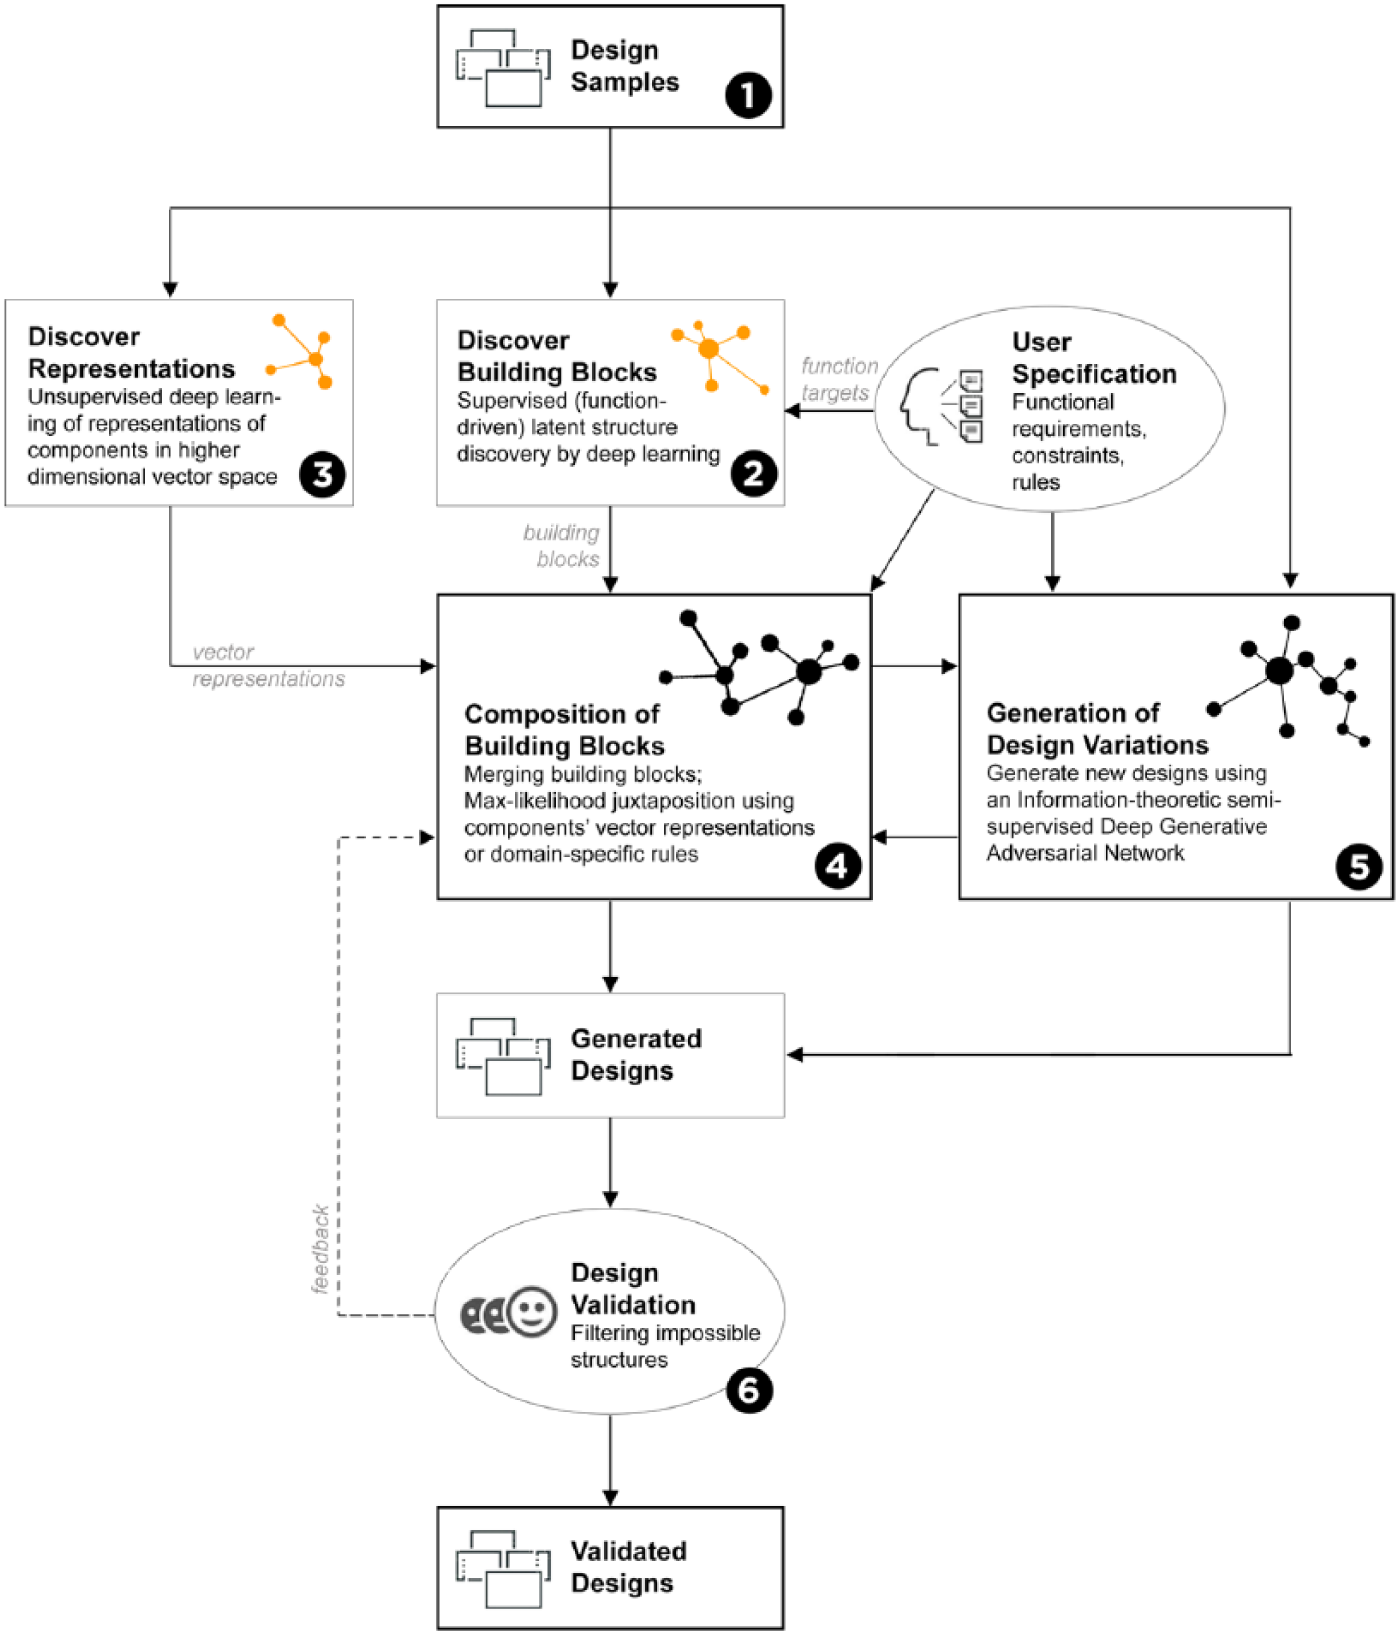
Scheme showing the outline of the deep learning research approach.
Case study: 15 × Homes
We selected 15 homes from a larger data set of design schemes from Arcbazar.com, an online competition platform for architectural design projects (Figure 6). At Arcbazar, project owners can launch design competitions for their architectural challenges. Over the years, the platform amassed thousands of home designs. For this study, we had access to this large design database. The homes we selected were in machine-readable BIM format, which we could automatically translate into graph form to use as input for the DNN. In the following section, we describe the data extraction method, followed by the steps taken to train the DNN. We then illustrate the performance of the DNN on design samples and give examples of significant building blocks that were discovered. Finally, we show how new designs can be assembled from these building blocks.
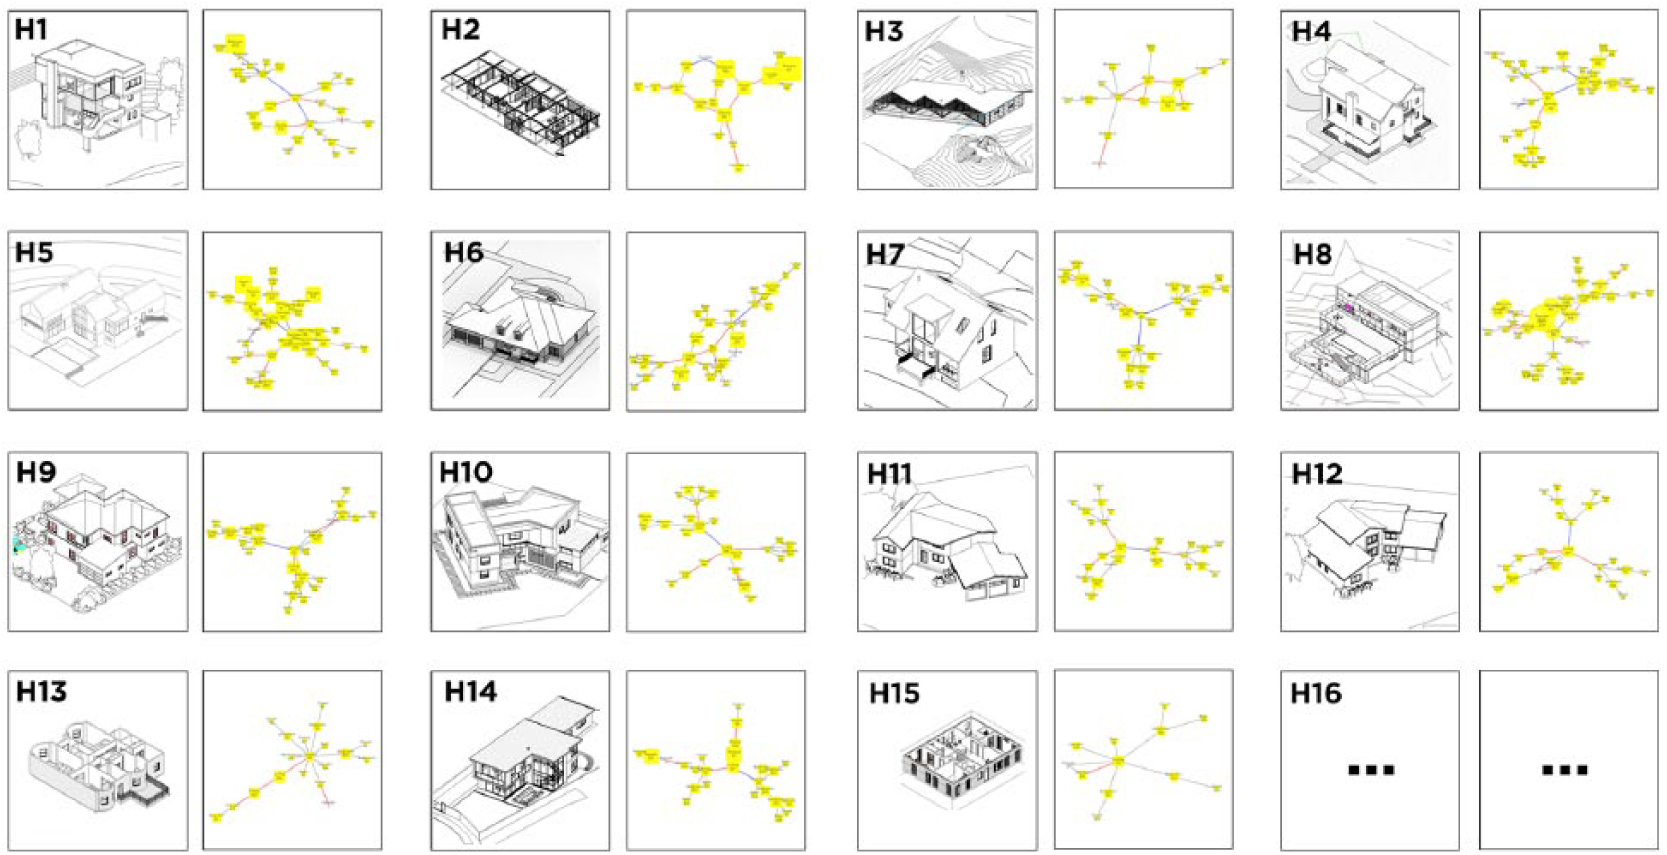
Image showing 15 home design samples used as the data set – in axonometric and graph view.
Extracting graph data from BIMs
The BIM models consist of annotated three-dimensional data on the houses, which we queried using the Autodesk Revit API. Each floor level is mathematically modelled as an attributed graph, where rooms are nodes and connections between rooms are edges. We built these graphs by collecting the set of rooms and by identifying the connections between them. Figure 7 shows a code snippet using the Python Revit API that was used to extract, for example, the ‘door’ relationship between rooms in a given BIM design sample. A Python code snippet that uses the NetworkX graph library 16 was then run through the output file to construct a graph representation – as the one seen in Figure 3. The room types are not always named using the same nomenclature (e.g. bathrooms are called ‘Bath’ in some designs and ‘Bathrooms’ in other designs). These were made uniform across the sample designs by semantic alignment of the nomenclature. Overall, we found 29 different types of rooms whose frequency counts are shown in Figure 8. Room types form part of the node attribute vector, along with room area and volume information. Room types such as ‘Outside’, ‘Entrance’ or ‘Corridor’ are typically not considered rooms, but we considered them as rooms since all spaces are rooms of one kind or another in this study. A connection between two rooms, shown as an edge, can be one of three types – door connection, open connection or vertical connection. Each design sample was annotated with two target functions – liveability and sleepability (Figure 9).
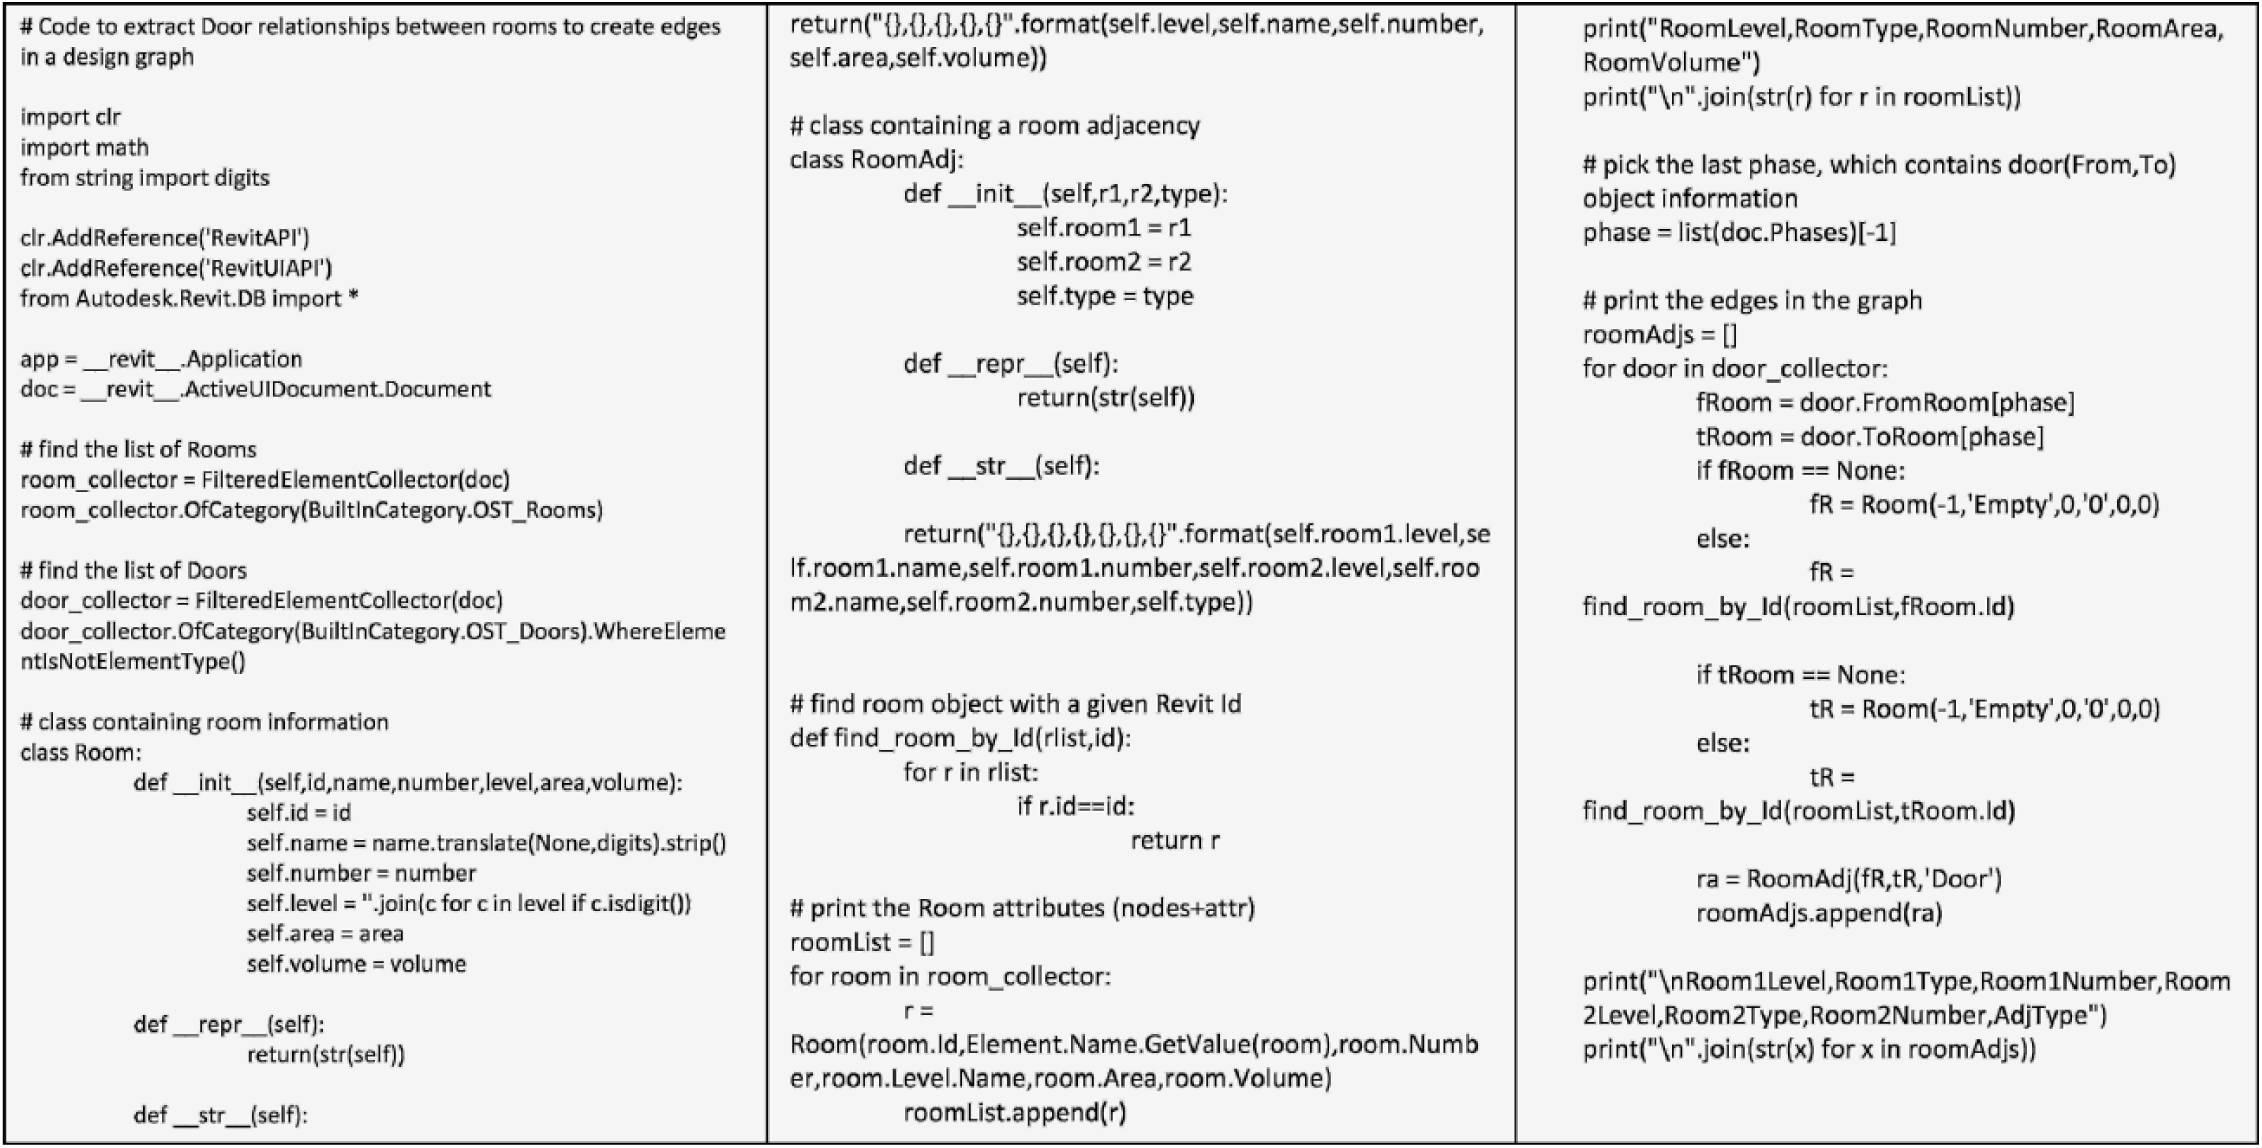
Sample Python code extracting BIM data through the Revit API.
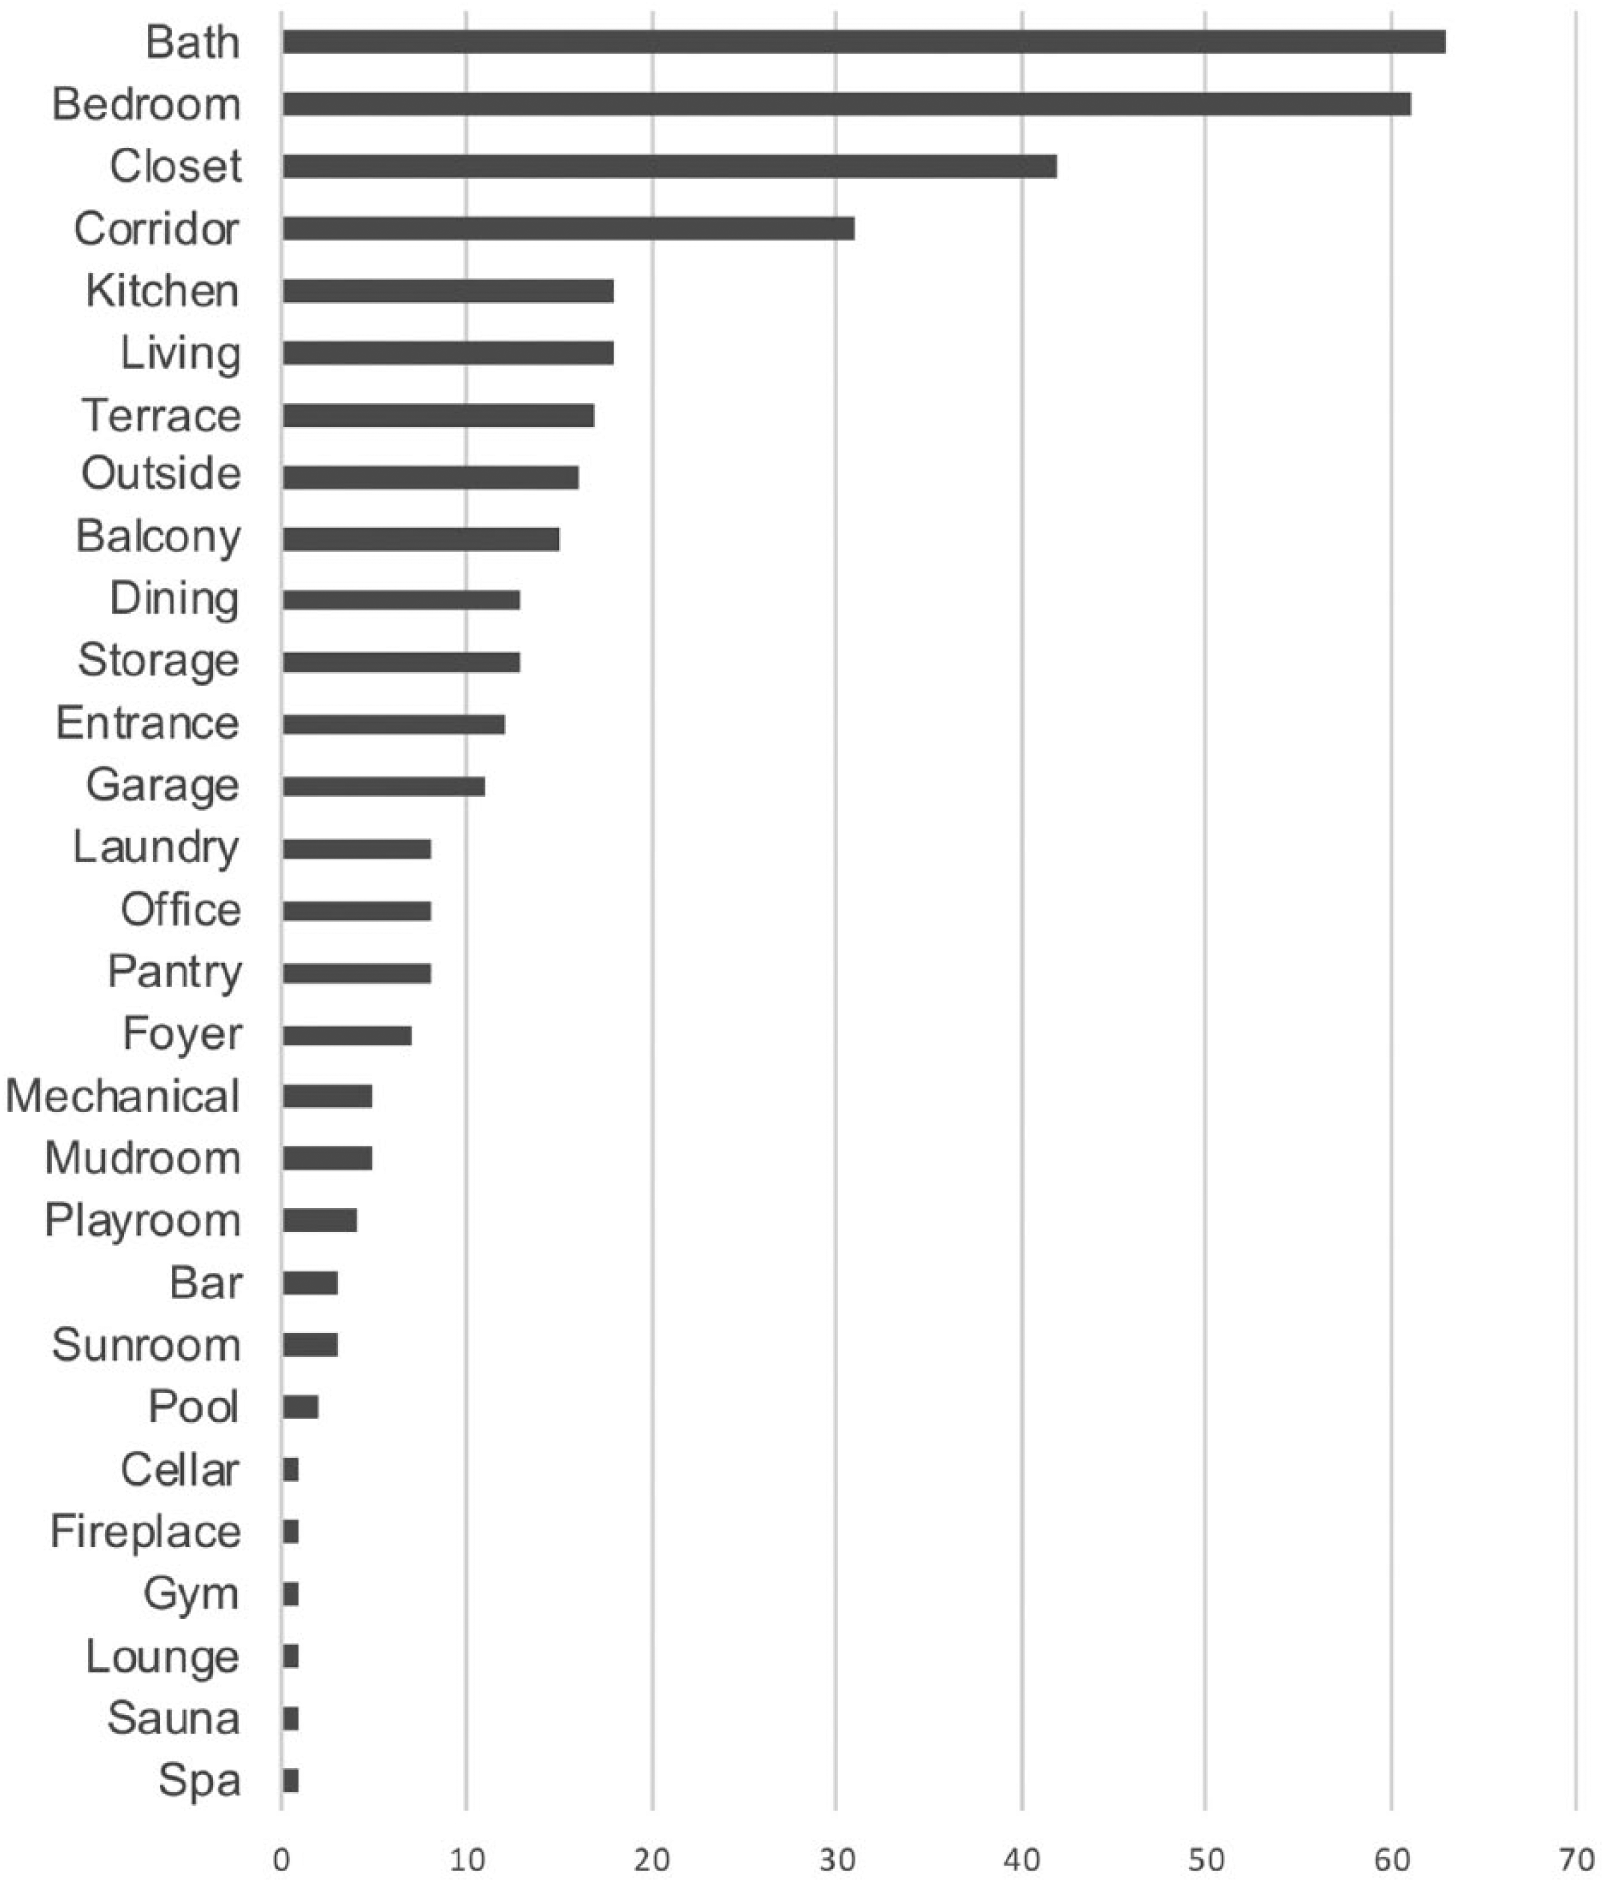
Bar chart showing frequency of room types in the design data.
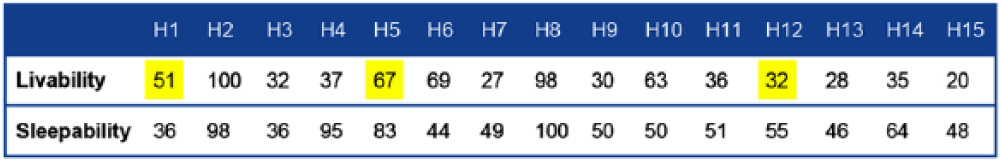
Subjective evaluation scores of 15 homes in the data set, based on liveability and sleepability function targets (H1 means Home #1 in the data set).
Training the DNN
We set the DNN with data and parameters tailored to the architectural design problem. We divided the set of 15 design samples to a set of 12 samples for training and cross-validation, and three samples for testing. Once the training was complete and the weights of the DNN were learnt, we conducted a regression test on the remaining three samples that the DNN had not encountered before. The trained DNN was able to predict the evaluation scores we initially gave with high accuracy. For the three test samples picked randomly from the set of 15 samples (H1, H12 and H5), the original liveability scores were 51, 32 and 67, which the DNN predicted as 51.2, 24.5 and 67.2. This yields a normalized RMSE of 12.4%. Notice that the original scores given were subjective evaluations on liveability.
Discovering significant subgraphs or patterns as design building blocks
Using the DNN architecture presented in Figure 4, we discovered some interesting building blocks that yield high performance in terms of liveability. After the DNN training converges, all the hidden weights and the final latent representation vector that have good regression performance with respect to the design samples’ liveability values are learnt. During this process, we keep track of the activation scores of various neurons at each layer r and the subgraphs of radius r that yielded those scores. We then return the highest performing building blocks, namely, the subgraphs that yielded high activation scores as well as high regression coefficients for one or more elements of the final latent representation vector. We concentrated on subgraphs with low radius (r ⩽ 2) since subgraphs with higher values of r typically end up covering the entire design graph, thus defeating the purpose of finding good building blocks of design. An example building block found was a subgraph induced by the following list of nodes: [‘2_Kitchen_82’, ‘2_Foyer_39’, ‘2_Pantry_26’, ‘2_Terrace_1951’, ‘2_Bath_26’, ‘2_Living_479’, ‘2_Dining_308’]. Here, ‘2_Kitchen_82’ denotes a kitchen with an area of 82 square feet on the second floor. The appearance of a large terrace ‘2_Terrace_1951’ adjacent to a huge living room ‘2_Living_479’ might have contributed highly to improved liveability of the design, in which this subgraph appears. Hence, this pattern could serve as a core building block if a user cares about liveability, for instance (Figure 10).
A subgraph, that is, building block, discovered by the DNN highlighted within the larger graph of a home.
Generating function-driven new compositions
Suppose a user asks the system to generate a conceptual design for a house with high liveability and sleepability, and a particular zoning envelope in which to fit the design. We would follow the steps below to achieve this goal:
Discover building blocks that respond to each functional performance criteria at a high score, that is, scores 80 and above (of 100), by training the DNN independently for each criteria; and, identify building blocks with high regression and activation scores. Figure 11 shows subgraphs responding well to the liveability and sleepability target functions. Note that the H5 subgraph perhaps has a high sleepability score since the bedroom is conveniently connected to the pool and the dining room through the terrace; in contrast, the H4 subgraph has a high sleepability score maybe for different reasons – it has a number of bedrooms with several nearby closets, storage and bathrooms. The H2 subgraph has a high liveability score maybe because a large living room is connected through a corridor to a large dining room and so on.
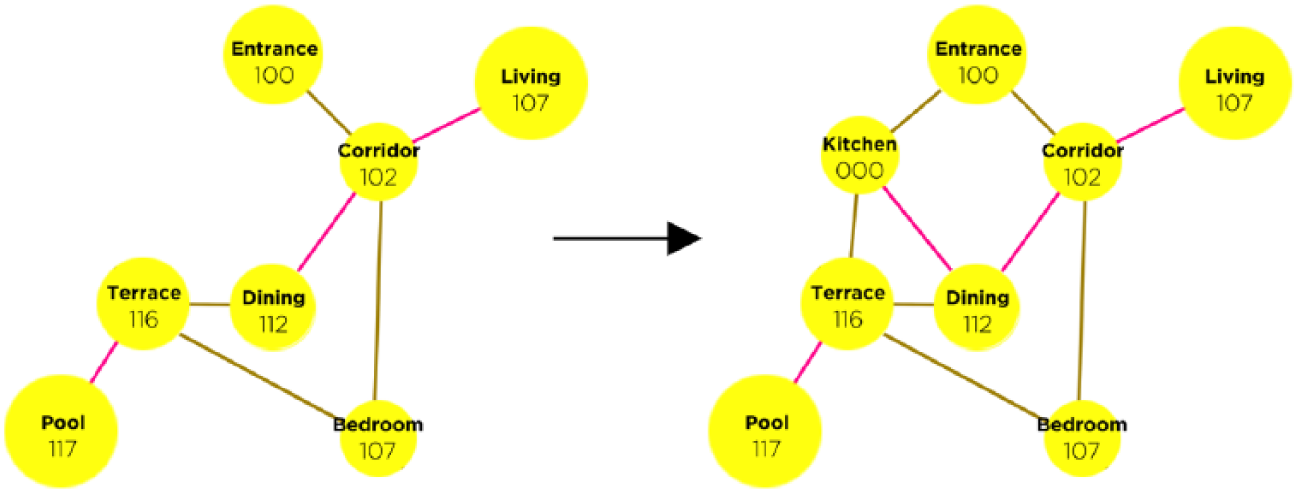
Compose these building blocks by merging them along nodes and edges with graph merging algorithms 15 (Figure 12).
Look up the types of nodes that are present in a typical house but are missing in the composition, for example, by sampling from a probability distribution or looking up complement nodes in the subgraph of the corresponding design sample. The DNN can learn and project nodes (rooms) onto a latent vector space based on their attributes as well as their proximities to other nearby rooms in design samples (Figure 13). The vector representation helps to understand latent relationships of nodes and their proximities among each other. This information helps us to identify rooms and connections between rooms that might be missing in new compositions and to elucidate how we can add them to the graph. The vector embedding was produced through merging the entire training set of design graphs into a single graph that was fed into the DNN, which created a multi-dimensional vector representation for each node. This representation is based on the type of the node, for example, kitchen and bathroom, and the relative proximity of the node to other nodes in the graph. As seen in Figure 13, nodes of identical type cluster together, and the latent embedding depicts the average proximity of room types in the training set. Interestingly, some clusters of nodes are closer to each other than to others, for example, the cluster of bedrooms are closer to clusters of closets, bathrooms, balconies, and so on, which seem to form a larger category, whereas the kitchen cluster is closer to the entrance or dining clusters. Notice also that clusters of living rooms, dining rooms and terraces are very close to each other and are almost overlapping at times; this is because most designs have these rooms adjacent to each other. The vector embedding graph in Figure 13 simply reveals such latent design rules. We used the vector embedding information to understand nodes and/or edges that we may need to add to compositions. For example, the
Validate each design by determining if it violates any geometric constraints, such as planarity constraints for two-dimensional and certain three-dimensional structures. 17 A subgraph itself might be feasible, but when put together into a larger assembly the composition might be unrealizable.
Generate two-dimensional orthographic drawings or three-dimensional massing models using an algorithm that juxtaposes adjacent rooms while adjusting the room shapes and obeying the areas and volumes. Figure 15 shows a plan drawing of the
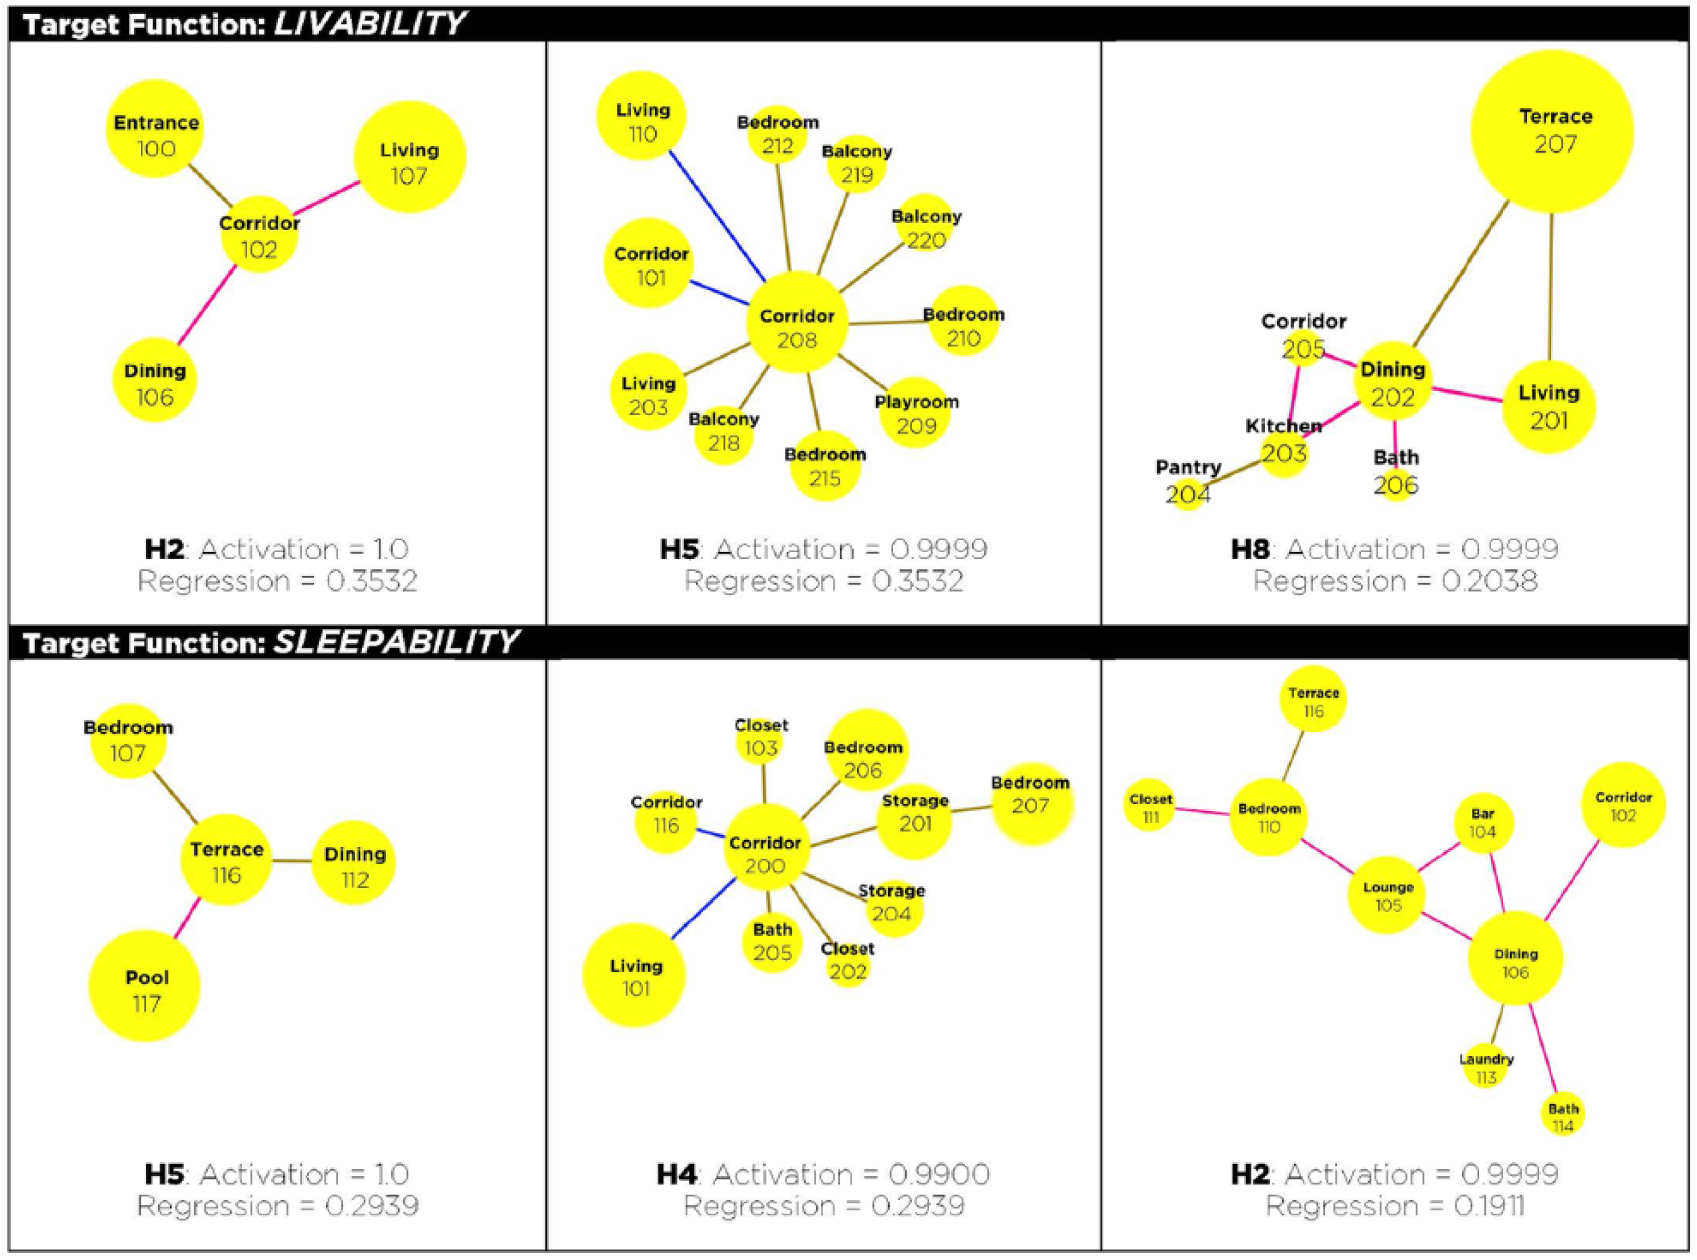
Building blocks discovered by the DNN. The top row indicates subgraphs that were discovered for liveability (homes H2, H5 and H8) and the bottom row for sleepability (homes H2, H4 and H5).
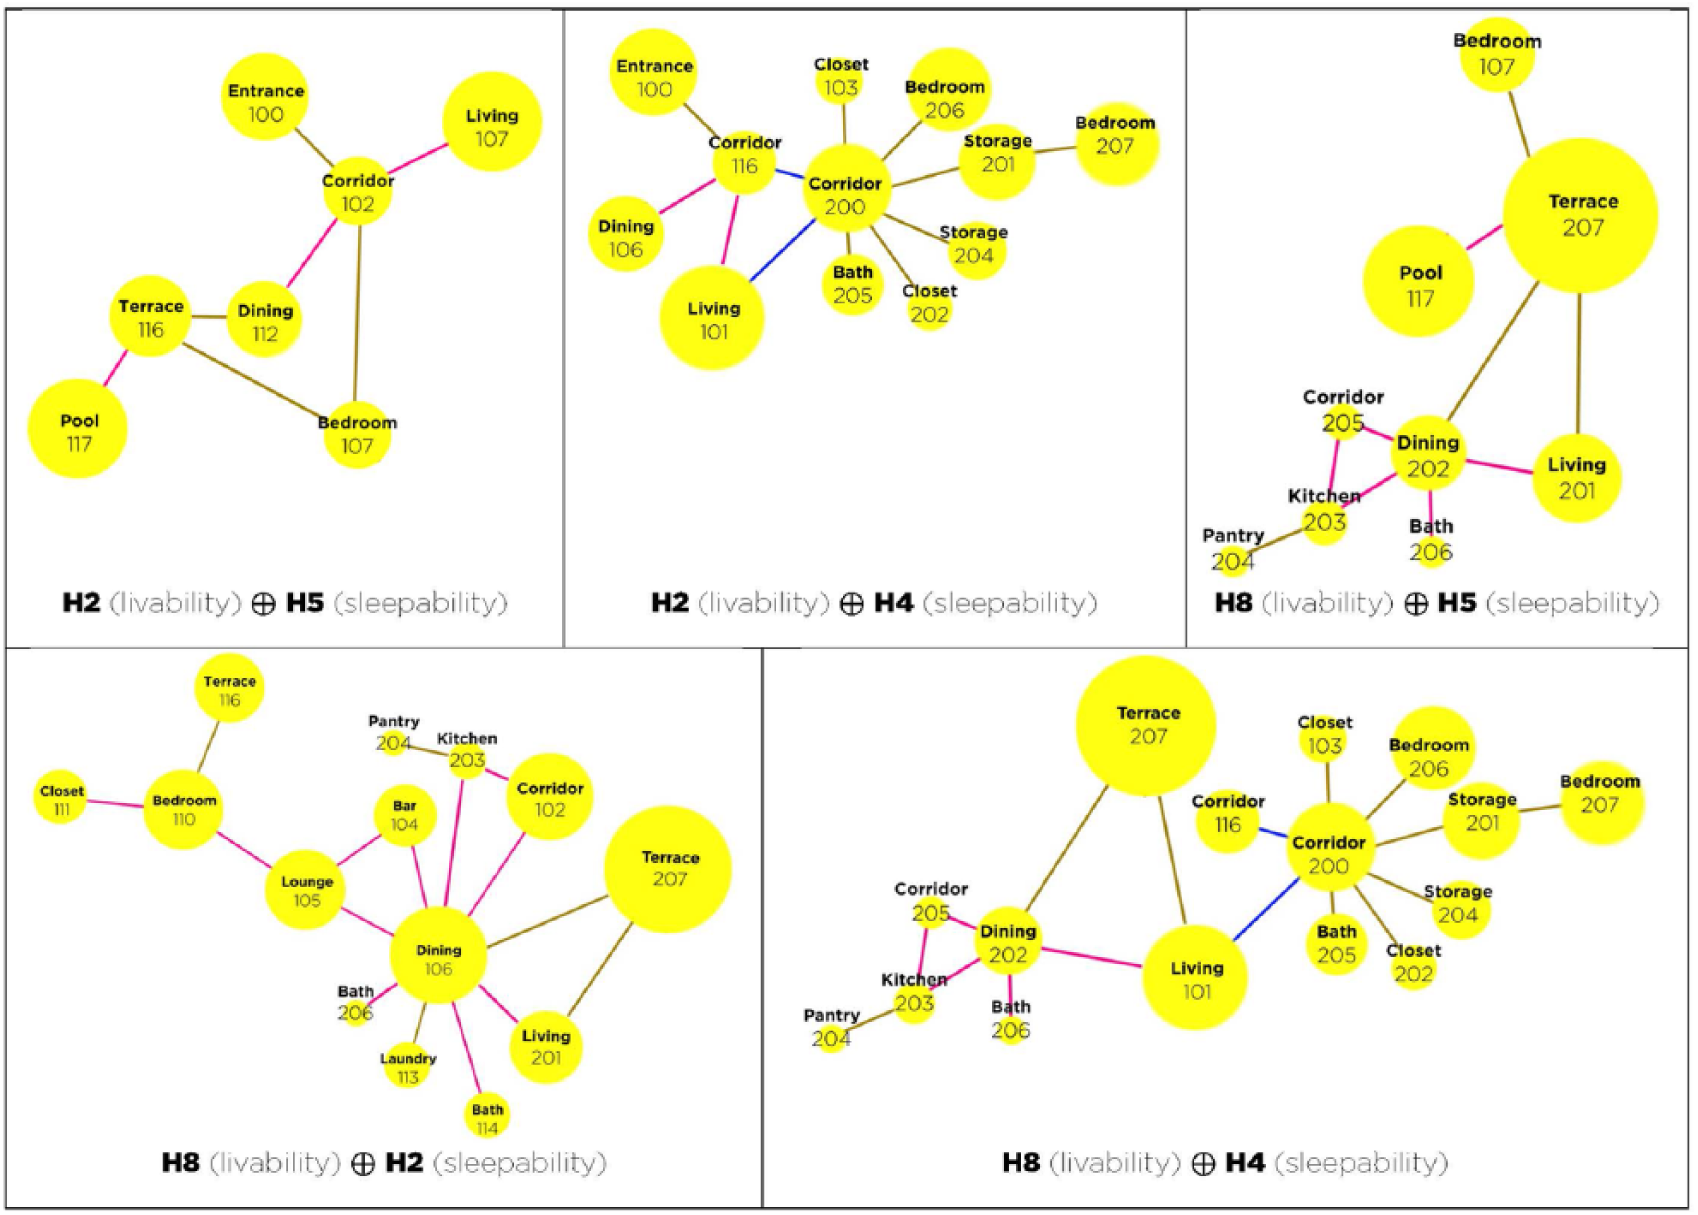
The composition of subgraphs into larger assemblies. Note that for H2 ⊕ H5, an additional (bedroom and corridor) edge was created, since that edge has a high likelihood of occurrence as per the vector embedding method, seen in Figure 13.
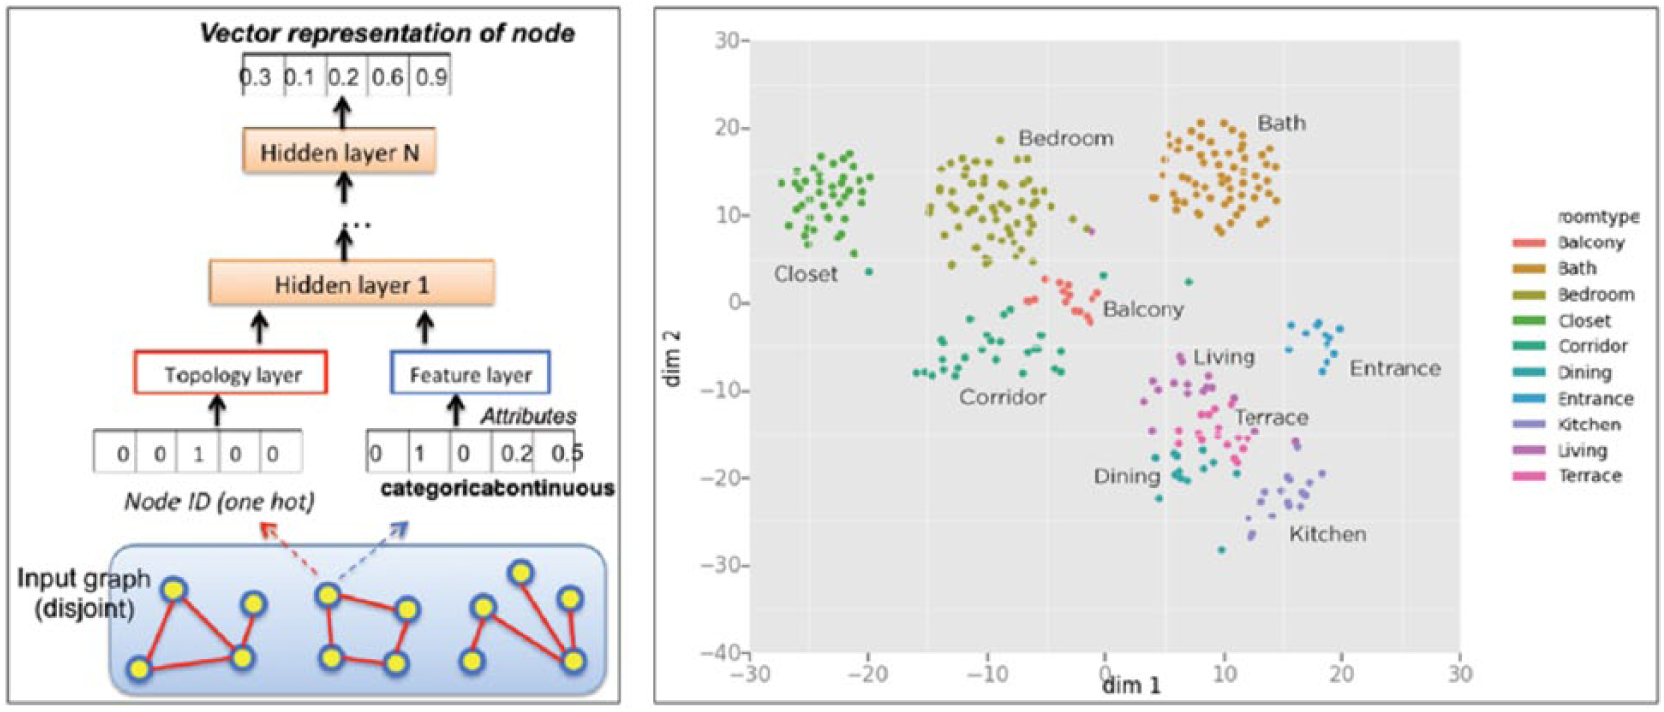
DNN-based representation learning of types of rooms in a latent vector space while obeying proximities of types of rooms in design samples.
Design H2 ⊕ H5 – showing addition of necessary auxiliary nodes to the composition, for example, kitchen node added and connected to the entrance, dining and terrace nodes based on vector embedding (as seen in Figure 13).
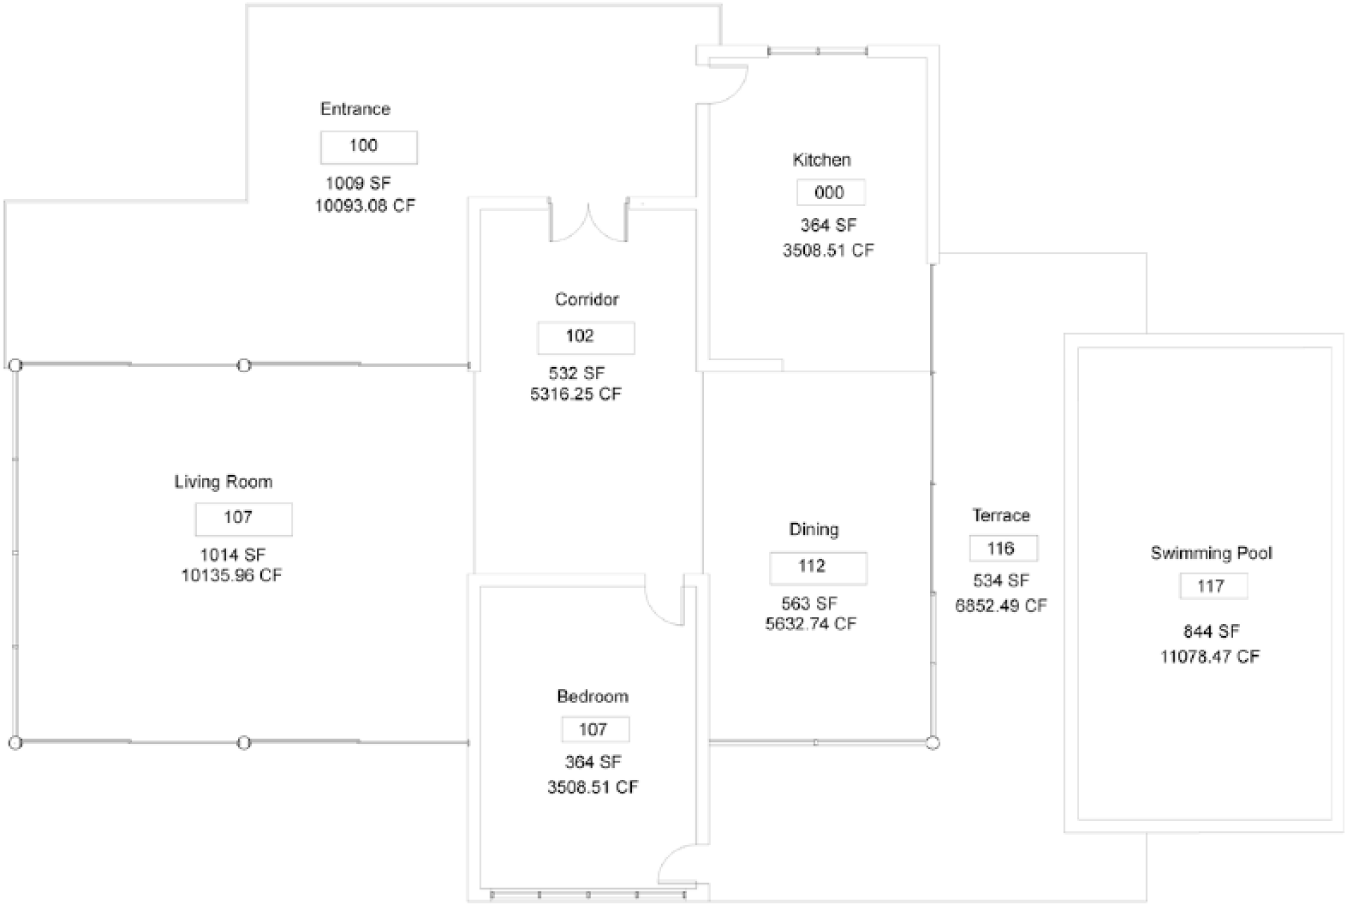
Two-dimensional plan drawing for H2 ⊕ H5 shown in Figure 14, with kitchen node added.
Generating design variations through GANs
GAN became popular in 2017. 18 Nvidia research, for instance, worked on generating new celebrity images through GANs that were trained on millions of real celebrity images. 19 GANs, in a nutshell, are built with two competing DNNs, a Discriminator and a Generator. In an image-generating GAN, the Generator takes as input a noise signal, for example, a random variate from the Gaussian distribution and generates an image that the Discriminator needs to pass as valid or invalid. For example, in Nvidia’s case, a newly generated celebrity image had to pass through the Discriminator as a valid celebrity. If this does not occur, the Discriminator passes information about the degree of fakeness of the generated image with respect to its model samples to the Generator, which simply recalibrates and generates new celebrity images until it passes the Discriminator test. At this point – referred to as the Nash Equilibrium of the game – the GAN is said to be trained and the Generator has the capacity to truthfully generate images that pass as real, for example, celebrity. One can compare this to a professor–student relationship in design studio: the student presents design work to the professor. The professor examines, critiques the design and points out shortcomings. The student then iterates on the design and presents it to the professor again. This loop of iterations continues until the professor passes the design as satisfactory. Ideally, at a certain maturity level, the student is then able to generate satisfactory designs without the help of the professor. Note that the Discriminator and Generator are trained hand-in-hand using information signals passed between the two DNNs, hence the training may take longer to converge than for the supervised and unsupervised DNNs encountered earlier in this article.
While GANs have been extensively used to generate images and other continuous media, their application on graphs has only been proposed recently, 20 specifically to learn probabilistic models for connectivity between nodes. We attempt to use GANs on architectural design graph samples to iteratively generate better graph samples that have not been seen thus far. The graphs generated by a properly trained GAN would obey probabilistic rules that are indicative of the structure of the design samples (these may be latent or commonly known), but they would likely not be the old graphs already seen among the training samples. This feature of GAN helps us generate creative new samples that do not violate traditional architectural principles encoded in the training set.
One of the shortcomings of GANs is that they do not provide tools other than the noise signal to control the generation process itself. Therefore, we leveraged a new version of GAN, called Information Theoretic GAN (InfoGAN) to generate design variations in a controlled manner. 21 InfoGAN works like a regular GAN, but it attempts to learn latent codes, which can be controlled to restrict the Generator to only generate variations of samples that correspond to the specified code. Figure 16 illustrates the neural network architecture that we used for training InfoGAN on attributed graph samples – instead of images to generate new graphs. Three coupled DNNs (denoted by D, G and Q) need to be trained simultaneously while sending outputs of G as inputs into D and Q. To minimize information theoretically motivated loss functions, the weights inside D, G and Q need to be learnt simultaneously instead of just training D on graph samples first. Unlike images that are subsampled or cropped to be of the same size before feeding into the DNN input layer, graphs need to be subsampled in a different manner. We ran fixed-length random walks starting at randomly chosen nodes in each graph and fed each sequence of nodes visited by the random walks to the DNN. A sufficiently large number of random walks on a graph can statistically express its essential structure. In these tests, we only considered room types and no other attributes and hence our random walks are essentially fixed-length sequence of room types. We observed that InfoGAN can generate interesting and unusual subgraphs that were typically not encountered in the training set (Figure 17). Thus, this approach can complement the previous approach of discovering and composing high-scoring subgraphs and can help architects expand their vision beyond standard rules of design – whether explicitly codified in design manuals 22 or learnt from experience.
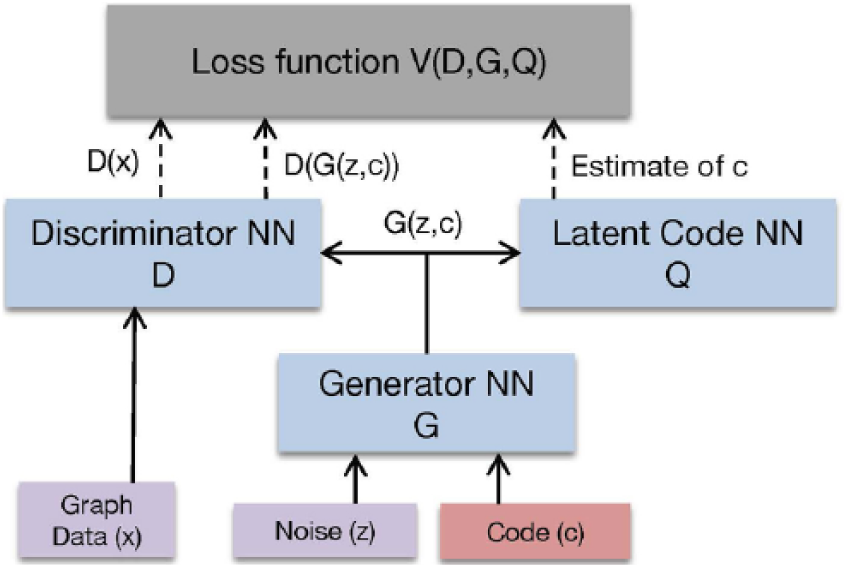
InfoGAN architecture – training three DNNs (D, G and Q) simultaneously.
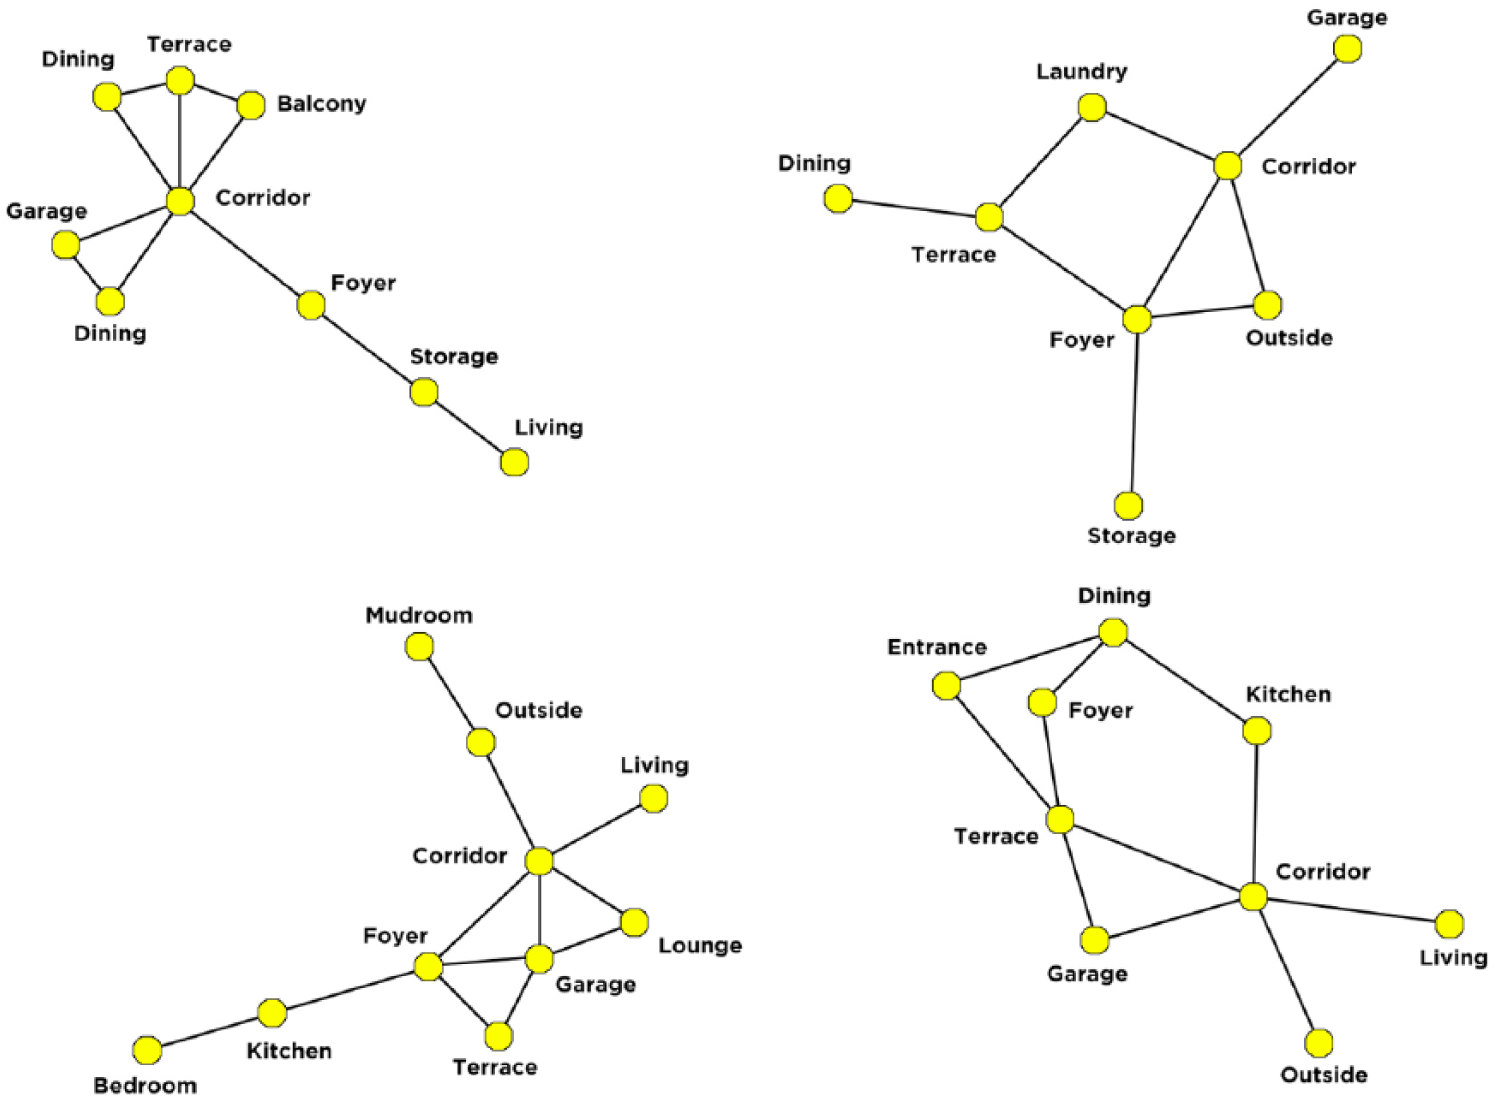
Subgraphs created through InfoGAN.
Note that these results do not illustrate how latent codes can be used to control the generated designs, as supported by InfoGAN. Conceivably, the latent codes in various designs may correspond to topological features of graphs such as their hub-and-spoke versus cyclic nature, or to configurations such as eat-in-kitchens that merge kitchen and dining rooms versus widely separated kitchen and dining areas. If the design samples contain both styles of configurations, InfoGAN will learn latent codes corresponding to each class. By fixing a certain code (say corresponding to hub-and-spoke configuration), we can generate a new sample which follows that style but is a variant design. Exploration of such issues is in progress.
Conclusion
Function has been always an important driver in architectural design, that is, the intent to generate form directly from purpose and utility. In 1896, Louis Sullivan stated that ‘form follows function’ and that the beauty of a building derives directly from the practical and effective composition of function and not from preconceived forms or references to built heritage. The assumption was that beauty would naturally derive from design once functional requirements are met – fitness for purpose equals beauty. In other words, there is no need to respond to aesthetic questions in design deliberations. In 1908, Adolf Loos even went so far as to ask for the total abandonment of decoration in his essay ‘Ornament and Crime’; and in 1947, Mies van der Rohe cemented the function-driven approach in his aphorism ‘less is more’, which still is the motto of many designers today.
Function-driven design engulfed Europe early in the 20th century, due to the lack of resources after the world wars, and the need to create a new and better built environment – quickly, and at large scale. However, over time it became a pejorative term that in the eyes of many people was just optimizing space and was unable to bring together the resources of narrative background and construction of personal identity to their inhabitants. It soon became synonymous with Soviet-style pre-fabricated housing blocks and cheap commercial buildings (aka Depression Modern). There was such a deep backlash that contemporary architect Peter Eisenman famously stated ‘I do not do function’. 23 However, with the advent of machine learning systems, and as seen in our deep learning approach, form indeed can literally follow function. Function here, however, does not necessarily mean only the traditionally quantifiable, such as adjacencies, circulation and programme disposition, but can also mean the more latent utility of designed spaces, the poetic and uplifting side of architecture, which we now have a tool to decipher and integrate into our design thinking and deliberations.
In this article, we presented a DNN approach using graphs to generate conceptual designs. We showed that our system can evaluate and score designs, decompose them into essential building blocks and recombine them into novel compositions. We also showed a GAN method to generate new designs not seen in the training set. While DNNs are used mainly for image and natural language processing applications, graph discovery, composition and generation applications have not been widely investigated. Using multiple types of deep learning tools, we showed how to discover interesting building blocks in design data, how to merge them in a mathematically principled manner to yield new compositions and how to generate interesting design variations using GANs. To perform the above tasks, we investigated various functional performance criteria, that is, target functions, both for composing discovered building blocks and for generating unique designs. Our preliminary results are promising and serve as an initial validation for using graph-processing DNNs to generate novel conceptual designs. However, there were also some limitations and constraints we faced during this research:
Design scope. Architecture is a complex field and one has to consider it in its totality. There are not only functional considerations but also aesthetical and structural ones, which are shaped by contextual and environmental circumstances, for example, ideology, culture, economy and climate, which were beyond the scope of this article, but certainly need to be addressed in future research.
Design data. We worked with 15 design samples that were in machine-readable BIM format, and which we were able to process using the Revit API. While using Revit is becoming the norm in the profession, tens of thousands of older design samples at our disposal were expressed in conventional graphic form and could not be easily labelled and converted to graphs. We are currently exploring some recently developed image processing techniques to automatically convert orthographic drawings into graphs. If that step is successful, we will be able to evaluate the regression performance of our DNN learning method on thousands of test samples – which can be categorized parametrically, that is, by varying parameters that govern size, type and complexity of design. Although the limited number of BIM models did not impede us to develop the DNN and GAN architectures, more samples would have helped us to further verify and consolidate the results.
Evaluation of generated designs. We have not dealt with quantitative evaluation of new compositions generated by either combining discovered building blocks or using GAN. The most foolproof way of evaluating these would be by a panel of experts or using crowdsourcing platforms. As we scale up our system, we will consider evaluating the efficacy of AI-generated designs.
In addition, we want to point out that there are alternative methods to graph representations, such as non-manifold topology, 24 which would be a generalization of our graph-based representation to a representation that is more fine-grained, thereby allowing us to represent, for example, walls, corridors and enclosed spaces, by topological objects such as faces, shells and cells, respectively. However, a DNN-aided data-driven approach would require developing neural network techniques that are capable of working with topological data. Since the graph-based technique captures higher-level structural information, the non-manifold topology representation could possibly be used in conjunction with graph representation to model relationships at various deeper levels. We believe this work could lead towards such future research.
Machine learning is an exciting field of investigation that not only has the potential to fill the gap of computational resources for the conceptual design phases of architectural projects but also the capacity to address the wider needs of the profession in design analysis and development.
Footnotes
Acknowledgements
Any opinions, findings and conclusions or recommendations expressed in this material are those of the author(s) and do not necessarily reflect the views of the DARPA.
Declaration of conflicting interests
The author(s) declared no potential conflicts of interest with respect to the research, authorship and/or publication of this article.
Funding
The author(s) disclosed receipt of the following financial support for the research, authorship, and/or publication of this article: This research was supported by Defense Advanced Research Project Agency (DARPA) under contract number HR001118C0039. This document does not contain technology or technical data controlled under either the U.S. International Traffic in Arms Regulations or the U.S. Export Administration Regulations.