



Abstract
The research examines how social and cultural properties can be utilised as an alternative planning scheme to improve urban morphology and enhance the overall experience of individuals within the city. The aim is for these socio-cultural properties to be translated into quantitative data sets that define the morphological characteristics of the urban tissue. Through the use of evolutionary optimisation methods, the process of urban growth is simulated through a series of individuals that adapt and optimise for multiple design criteria. The experiment presented quantifies the social and cultural properties of a superblock within the city of Kyoto to generate an urban tissue that is susceptible to future growth.
Keywords
Introduction
Social and cultural elements of urban tissues play a significant role in the development and overall quality of the urban fabric. As these elements are often identified as experiences within a city, they form strong relationships between the city and its inhabitants. Wendt 1 discusses that the successful ideas on the planning of ‘city life’ generally originate from ‘close observation’ rather than the approach of ‘master plans’. A common issue that most urban models face are growth and adaptability, a challenge that has plagued the top-down modernist approach to planning applied throughout the 20th century, in which when faced with rapid environmental changes, urban form struggles to cope. Michael Weinstock 2 states that cities ‘grew until they were delicately poised close to their critical threshold’; whereas historical cities grew in response to changes in the environment, that is, towards this critical threshhold, the relationship between the modern city and its critical threshhold is a far less symbiotic one.
The city of Kyoto, an evolved city that shows a strong sense of culture, presents an urban model that has been able to adapt and grow over multiple generations. A primary cultural trait of Kyoto is its use of the alleyway, it is commonly used in western cultures as the back of house or a thoroughfare between buildings, but for the Japanese culture (in fact, similarly to other eastern cultures) it is their interpretation of open/public space. It is often crowded with communal activities in close proximity to one another and utilised as their pedestrian shortcuts. The alleyway has existed among generations of urban planning within Kyoto and thus it is a crucial socio-cultural element that defines the urban fabric. The paper’s structure introduces the socio-cultural traits of Kyoto’s urban fabric, develops the design problem in which an evolutionary algorithm is used to optimise for various design objectives, analyses the evolutionary simulation’s results and selects the final urban solution set, concluding with a growth proposal for the developed urban superblock.
Culture and the city
Culture and its impact on urban form
Socio-cultural aspects of a city represent sources of resilience that enable economic growth, social development and help address critical challenges such as adaptability, urban growth and climatic changes. 3 Various researchers (Weinstock, 4 Batty 5 and Marshall 6 ) believe that the fundamental problems of modern urban planning lay in the idea that a city can be planned comprehensively. This approach of a generic city, top-down in its development and centralised in its structure, struggles to resolve the dynamic and complex issues driving urban landscapes. Jane Jacobs gave an insight into why and how cities decay and regenerate without the need of centralised planning mechanisms, primarily through a coupling of social and cultural elements of a city. 7 Thus, shifting the paradigm to a culture-oriented approach through well-integrated urban open spaces, giving rise to communal and socially driven activities. Therefore, the relationships between culture and urban morphology are part of a system of agreements, adjustments and interactions that constitute socio-cultural attributes and in return, shape its urban forms. 8 As such, the quantification of socio-cultural characteristics is not the objective of the presented research, rather it is the analysis of the impact of socio-cultural traits on the evolution of urban form, and the emergence of specific morphological characteristics that are a result of this relationship.
‘Narrowness’ and its impact on culture
In East Asian cities, and in the context of the case study examined in this paper, Kyoto; the concept of public space is ingrained within an intricate network of alleyways, housing several layers of urban activities. 9 Gehl states that the ‘relationship between distance and intensity, closeness and warmth, in various contact situations has an important parallel in the prevalent perception of architectural dimensions’. 10 Understanding the precise measurements of street networks can often dictate the primary and long-term use of the urban streetscape. In Kyoto, the Roji, a term used to define narrow alleyways that have persisted across many generations, are wide enough to comfortably fit only one pedestrian to walk through. Although this may be inadequate in some cultures, in Japan, the quality of open space is driven by the ‘repeated experience of bumping into people. . .to help people feel connected to other people and places’. 11 Therefore, the width of the urban streetscape, and its consequent impact on proximity and population density, determined how space was organised. Imai 12 describes the Japanese alleyway as a ‘semi-private realm, which was a place for collective activities around small shrines, local shops and bathhouses’. By controlling the quantitative aspects of width in an alleyway, it can ultimately determine the behaviour of pedestrians using the space.
Movement and social behaviours
On a macro scale, alleyways (specifically in Kyoto) serve as an intricate secondary network, connecting the urban landscape through a framework of cross navigational paths, therefore the relationship and distribution of alleyways holds a significant impact on the overall walkability of a city. When examining their quantitative properties, an alleyway network can be examined as a collection of segments and intersections, properties that share a numeric relationship where incremental changes can impact the overall quality of its system. The navigational behaviour of a user can be dictated by the system’s length of segments, number of segments or the number of intersections. Hillier et al. 13 often describes this behaviour as natural movement, a ‘global property of a configuration in that it responds to configurational parameters which relate each spatial element to every other element in a system’. Thus, the importance of a parameter such as an intersection can play a large role in the success of pedestrian movement within a network. This is further discussed by Özbil, Yesiltepe and Argin 14 where they state that for ‘distances between origins and destinations, connectivity characterises the directness of travel between households, shops and places of employment, and the number of alternative route choices within the street network’. Therefore, in addition to providing multiple different starts to route choices, minimising the distances of travel, or more specifically the length of each segment, also largely affects the overall quality of a route.
Evolutionary methods
One of the critical aspects of multi-objective evolutionary algorithms (MOEAs) is achieving optimality of the solution-set while simultaneously maintaining its diversity. The significance of this is heightened when the variation of the solution-set reflects phenotypic diversity within the population, primarily in cases where the geometric attributes of the generated solutions are the required result. Although this is significant within design, it is even more so within an urban scale, as the process allows for the simultaneous output of geometrically unique morphologies from a single simulation, in which the solutions share similar attributes on a global scale, but differ considerably on the local scale. The work of Balling et al., 15 Makki et al., 16 Koenig, 17 Navarro, 18 Showkatbakhsh 19 and others in the field have demonstrated the above, in which the application of MOEAs are used as the primary approach to solve complex design problems, both in gaining a better understanding of their formulation, as well as achieving results that are driven by quantitatively measurable data sets. Where these studies have thoroughly examined the application of population based evolutionary algorithms to generate urban form, there remains the challenge of selecting viable urban solutions based on the morphological representation of the data outputted by the evolutionary simulation, in which the data set is optimised to allow for the data-driven and comparative visual analysis and selection of the outputted solution set. Additionally, where previous studies utilised the data outputted by the evolutionary simulation to facilitate selection of viable urban solutions, the presented research puts forward a methodology to utilise this data to introduce a growth proposal for the development of the selected urban solution. Through examining two city blocks in Kyoto, the research applies these methods of evolutionary optimisation and predictive analysis to generate insight into the development and growth of socio-culturally driven urban morphologies.
Kyoto, Japan
Japanese cities are characterised by both modern and traditional qualities in which robust social networks and ingrained cultural influences have determined the urban fabric. These characteristics are introduced through two urban planning methods known as ‘Machizukuri’ - community planning, which is a small scale, bottom-up approach that focuses on community and social interaction within the neighbourhood and ‘Toshikeikaku’ - urban planning, a comprehensive approach to the overall city that primarily focuses on top-down, urban planning strategies. 20 One of the most notable precedents is Kyoto, it merges between historical and modern urban forms; where commercial areas and shopping districts often disperse along main streets; public spaces, pedestrian walkways and high rises are surrounded by traditional neighbourhoods, which are often coupled with small gardens and an intricate network of narrow alleyways. This narrow and irregular secondary street network houses multiple communal activities, bridging the gap between public and private areas as well as pedestrians and vehicular traffic, and is referred to as the neighbourhood’s ‘living room’. 9 These hidden walkways have proven to be the most crucial elements of Kyoto’s urban culture, redefining the perception of common open spaces and public courtyards. 9
Shijo-Karasuma superblock
The presented research examines a major superblock in Kyoto; Shijo-Karasuma. More precisely, two street city blocks, Uradaeymacho and Tamakuracho. Uradaeymacho is located on the edge of the superblock and is surrounded by two main roads and two inner one-way streets facing the superblock’s outer perimeter. When examining Uradaeymacho, the distances between buildings dictate the function of open space; widths below 0.5 m serve as ducts and building services, car parks occupy spaces with widths of ⁓6 m, while pedestrian alleyways vary between 1 m and 3 m (Figure 1).
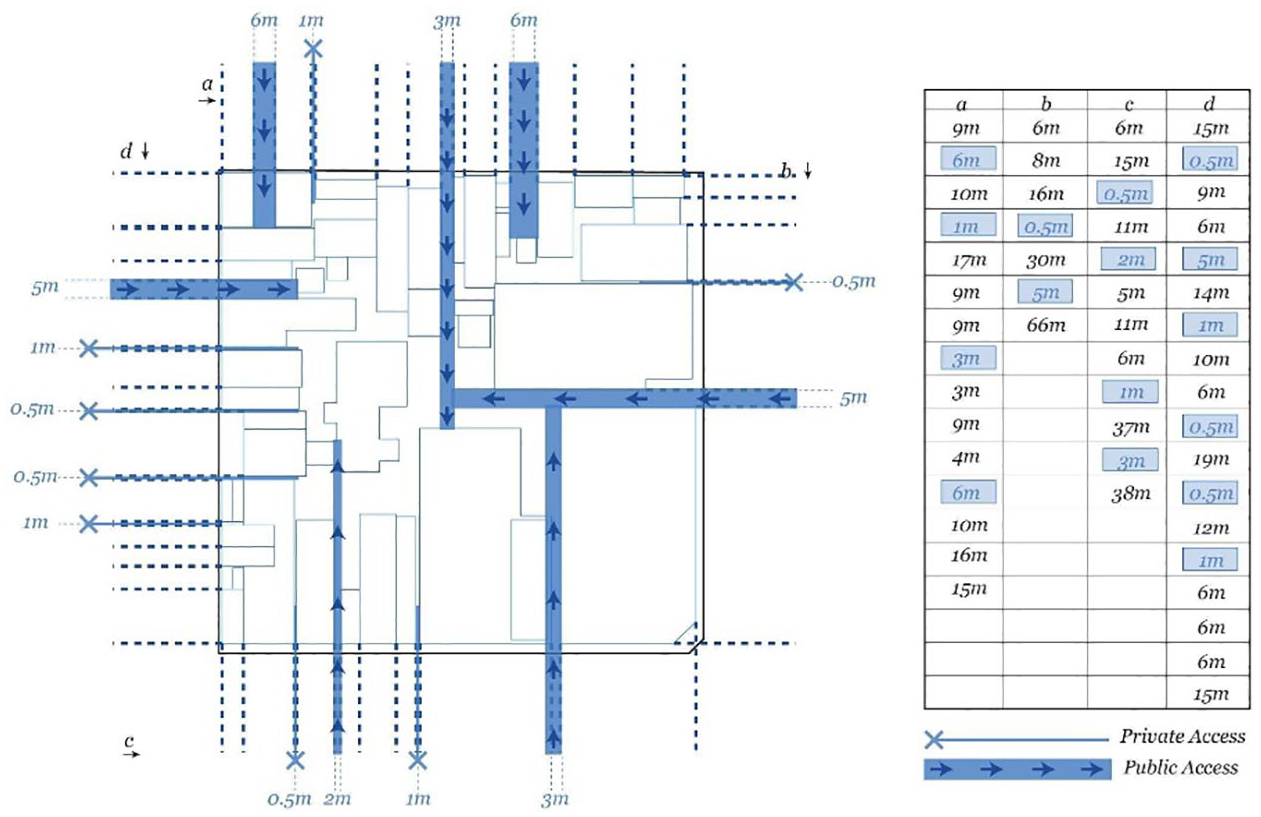
Uradaeymacho’s building widths and alleyway widths – Blue highlighting accessible alleyways.
On the other hand, Tamakuracho is located within the superblock and is surrounded by four one-way streets and houses 64 buildings. The block mainly consists of buildings recessed on the ground floor, thus providing larger pedestrian footpaths and alleyways, allowing access to the inner parts of the block. Within the two city blocks, there is a mixture of three different programs – commercial, mixed-use and residential. However, depending on the orientation of each block, the number of buildings allocated for each program varies. In the Uradaeymacho, there are more commercial buildings compared to mixed-use and residential. Whereas in Tamakuracho, there are 33 residential buildings; including houses and residential towers, 15 mixed-use buildings and only two commercial buildings.
Shijo-Karasuma existing urban condition
As described in previous chapters, the socio-cultural attributes ingrained within Kyoto’s urbanscape are based primarily on the day to day interaction between the inhabitants of the superblock. In this context, the locale for these interactions is key to address, which in the case of Kyoto’s urban fabric, takes place in the Roji (narrow alleyways) that form the foundation and framework for the city’s landscape. As such, the goal of the presented experiment aims to increase (and make more efficient) the locale in which these interactions take place by understanding the geometric attributes of the alleyway, and optimise for the characteristics that increase the opportunity for user interaction, as well as ensure that the environmental conditions imposed by the surrounding context are not neglected, rather play a vital role in the developed superblock.
Despite the presence of an existing alleyway network in Shijo-Karasuma and its significant role in Kyoto’s urbanscape, there is a lack of connectivity and human interaction. The alleyway networks often have inadequate solar levels due to surrounding commercial and residential towers. There is also an absence of well-integrated public courtyards and connectivity between blocks; through the analysis of the alleyway network, these paths abruptly end at the face of a building with a lack of navigational direction. Rather than re-generating a complete new urban tissue for Kyoto, the experiment aims to generate an urban superblock that increases alleyway connectivity within each block while maintaining the original grid of Kyoto and its urban density. Additionally, the research allocates building heights to their respective areas to maximise solar exposure reaching ground level as well for the emergence of well-integrated courtyards in relation to the alley network, thus establishing greater block-to-block relationships. As such, five key goals are established to guide the experiment towards the effective formulation of the design problem (Figure 2).
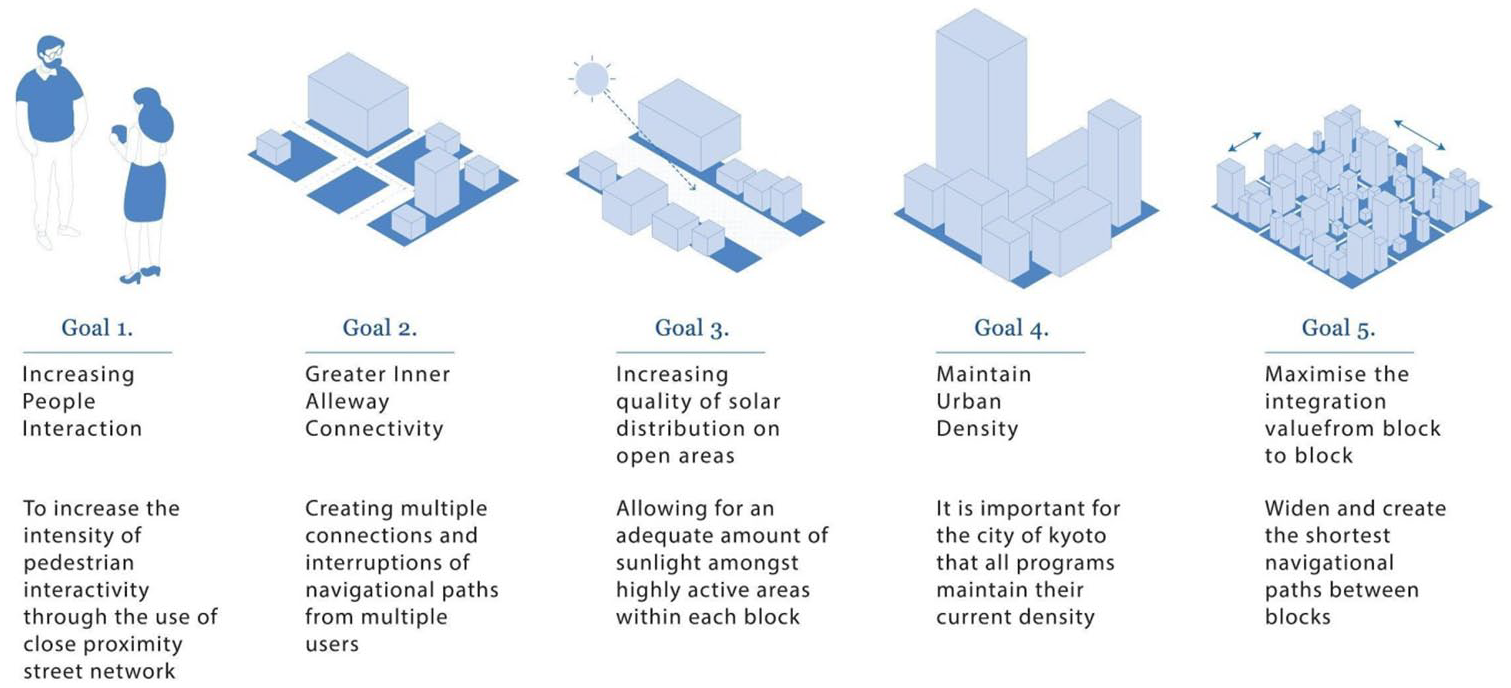
The experiment’s design goals.
Experiment setup
Evolutionary matrix
The experiment is primarily conducted using the Plugin Wallacei, 21 an evolutionary and analytic engine for Grasshopper3D. The success of the evolutionary simulation is contingent on the efficient relationship between the genes, the body plan (i.e. the phenotype’s morphology) and the fitness objectives (see Makki et al. 22 for a list of terms and definitions). These are outlined below.
Fitness Criteria 1 improves the overall quality of sun exposure on ground level; the ground surface of the superblock is divided into a 2 m point grid and vectors define Kyoto’s summer solstice hours from 10 am o 4 pm. If a point receives more than four vectors, this means that the point is receiving more than 4 h of sunlight. The aim is to achieve as many areas which receive four or more hours of sunlight. Fitness Criteria 2 maximises the number of alleyway intersections, this is calculated by measuring the number of nodes within the network that have three or more segments connecting to it (Figure 3). In doing so, the number of cross navigational paths is increased and the overall quality of alleyway connectivity is improved. Fitness Criteria 3 minimises the number of turns on the paths that are created through calculating the shortest walk (using the Shortest Walk Grasshopper Plugin 23 ). By decreasing the number of segments leading to each courtyard, walkability to a courtyard is improved as well as the connectivity between and within each block. Fitness Criteria 4 minimises the variation in total floor space area of different height categories. Building heights have been established through a direct correlation with the segment length within the network (taller buildings designated to shorter segments and smaller buildings designated to longer segments), the assumption is that the paths that are being optimised for Fitness Criteria 3 will be allocated with smaller buildings and thus help optimise Fitness Criteria 1 by increasing the sun hours on the shortest paths.

Calculation of fitness criteria for implementation in the Wallacei Plugin.
The effectiveness of the fitness criteria above is achieved through a well-defined variable set (i.e. genes), which if established methodically, play a significant role in the success of the simulation. These genes define the phenotypic attributes of the urban block and allow for the mutability of the morphological characteristics that define the urban tissue (Figure 4).
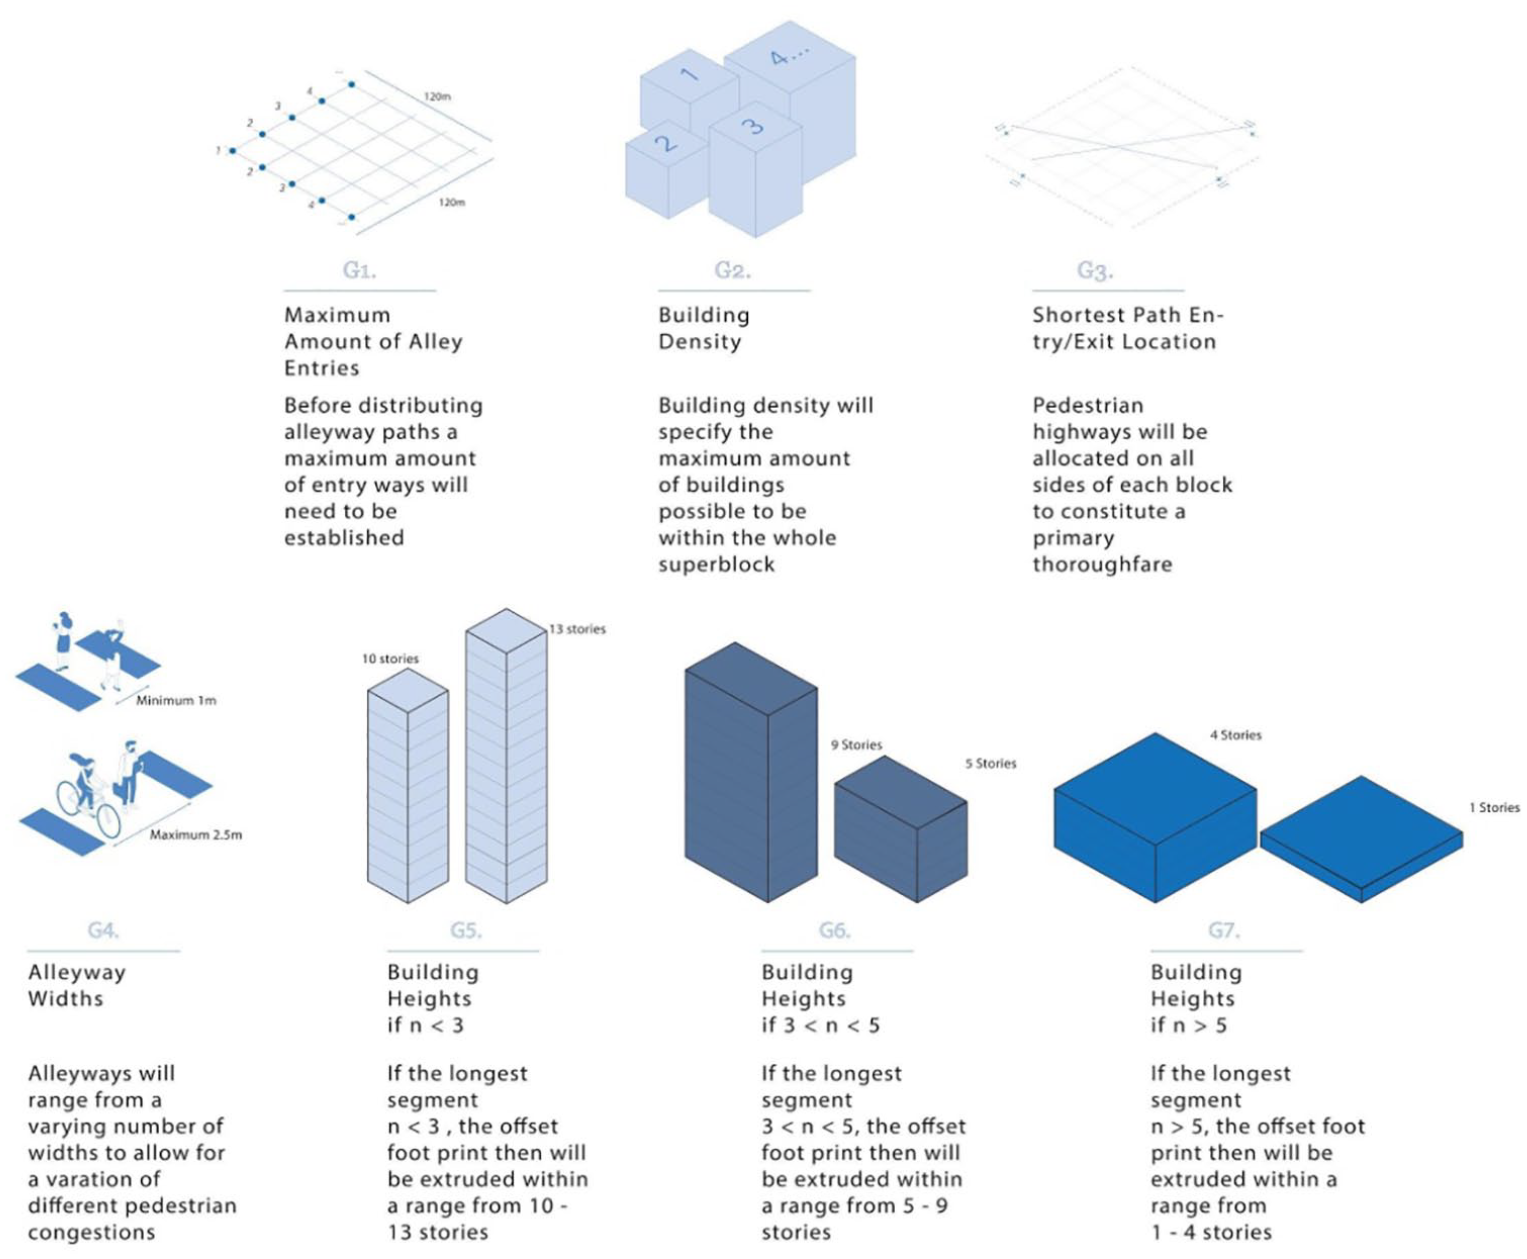
The genes that define the superblock.
Constructing the primitive phenotype
The primitive phenotype is a four-block superblock constructed through a 2 × 2 grid to maintain Kyoto’s grid structure. Each block carries a grid size of 120 × 120 m and is divided into 20 segments on each side; this represents the maximum number of entryways that each side of the block can potentially house. By gathering the centred point of each grid cell, each point is cross referenced with a set of scattered points allocated by a list of differing X, Y values. The closest point is calculated between the two sets and each grid point is allocated a point from the set of scattered points. Grid points that share the same closest point will merge their existing square cells into a combined shape (Figure 5).

Defining the network.
An entry point is defined by the intersecting segments surrounding the border of the network. The shortest walk is then calculated between each entry point from one side of the block to another to locate the two routes with the shortest distance (Figure 6). Where these two shortest walk routes intersect, a public space is allowed to emerge as this is believed to be the area with the most cross navigational paths. The block’s network is then offset with a distance between 1 and 3 m, and the shortest walks within blocks are offset at 4 m to accommodate greater pedestrian flow. This method is also applied for the shortest walk between the emergent public spaces of each block to establish greater relationships throughout the superblock; this route is offset at 5 m, the widest alleyway within the superblock, to accommodate larger public and commercial activities (Figure 6).

The definition of alleyways and courtyard.
The primitive phenotype is constructed to cull geometry with two perimeter segments under 5 m as the outlines associated with these geometries are unsuitable to house buildings; however, this allows for the emergence of multiple open-spaces that could potentially house smaller communal and street activities (Figure 7). The allocation of building heights is defined through analysing a building lot’s longest edge (n), if n is less than 3 segments, the offset footprint will be extruded within a range from 10 to 13 stories; if the longest edge of a building lot is 3 < n < 5, the building will range from 5 to 9 stories. Finally, if n > 5, the buildings are allocated 1 to 4 stories (Figure 8).
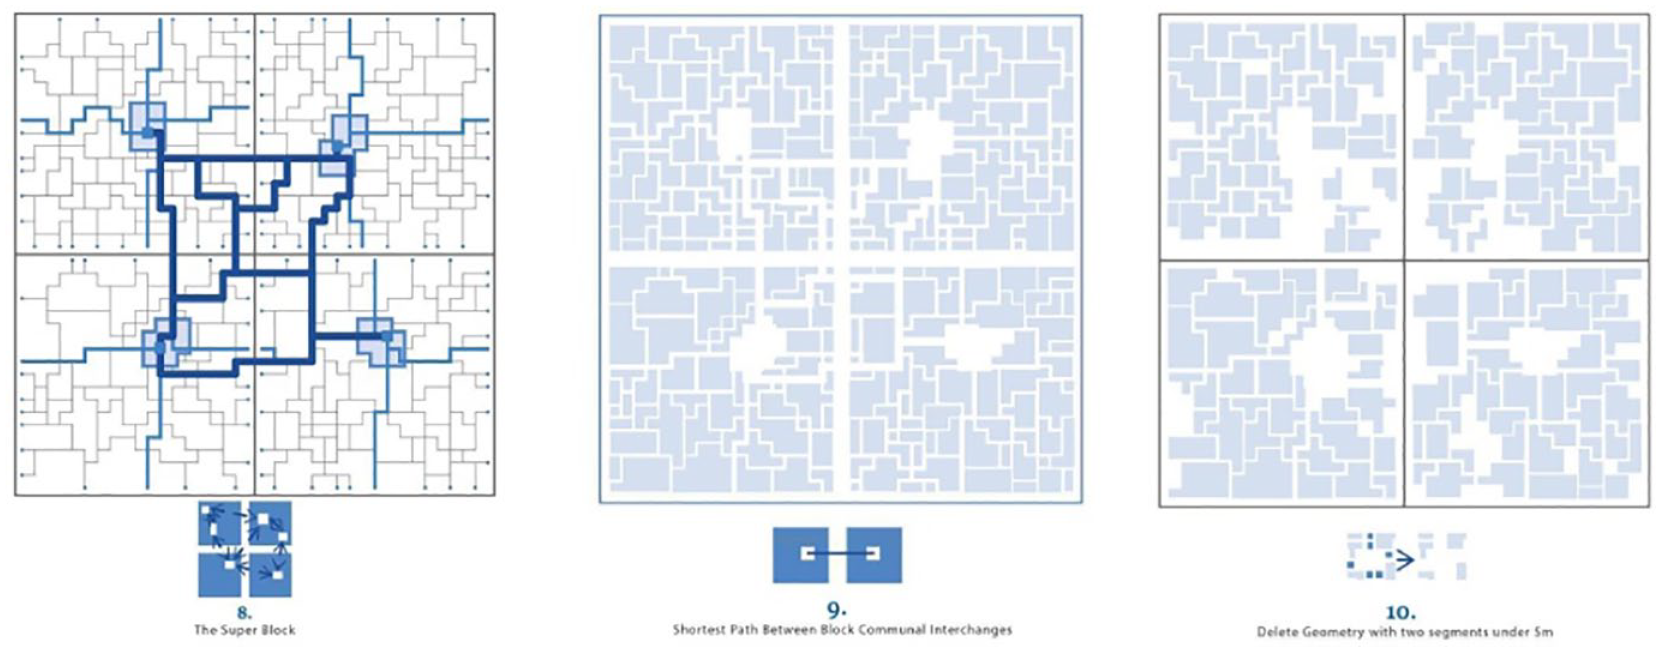
The definition of the superblock’s alleyway network and courtyards.
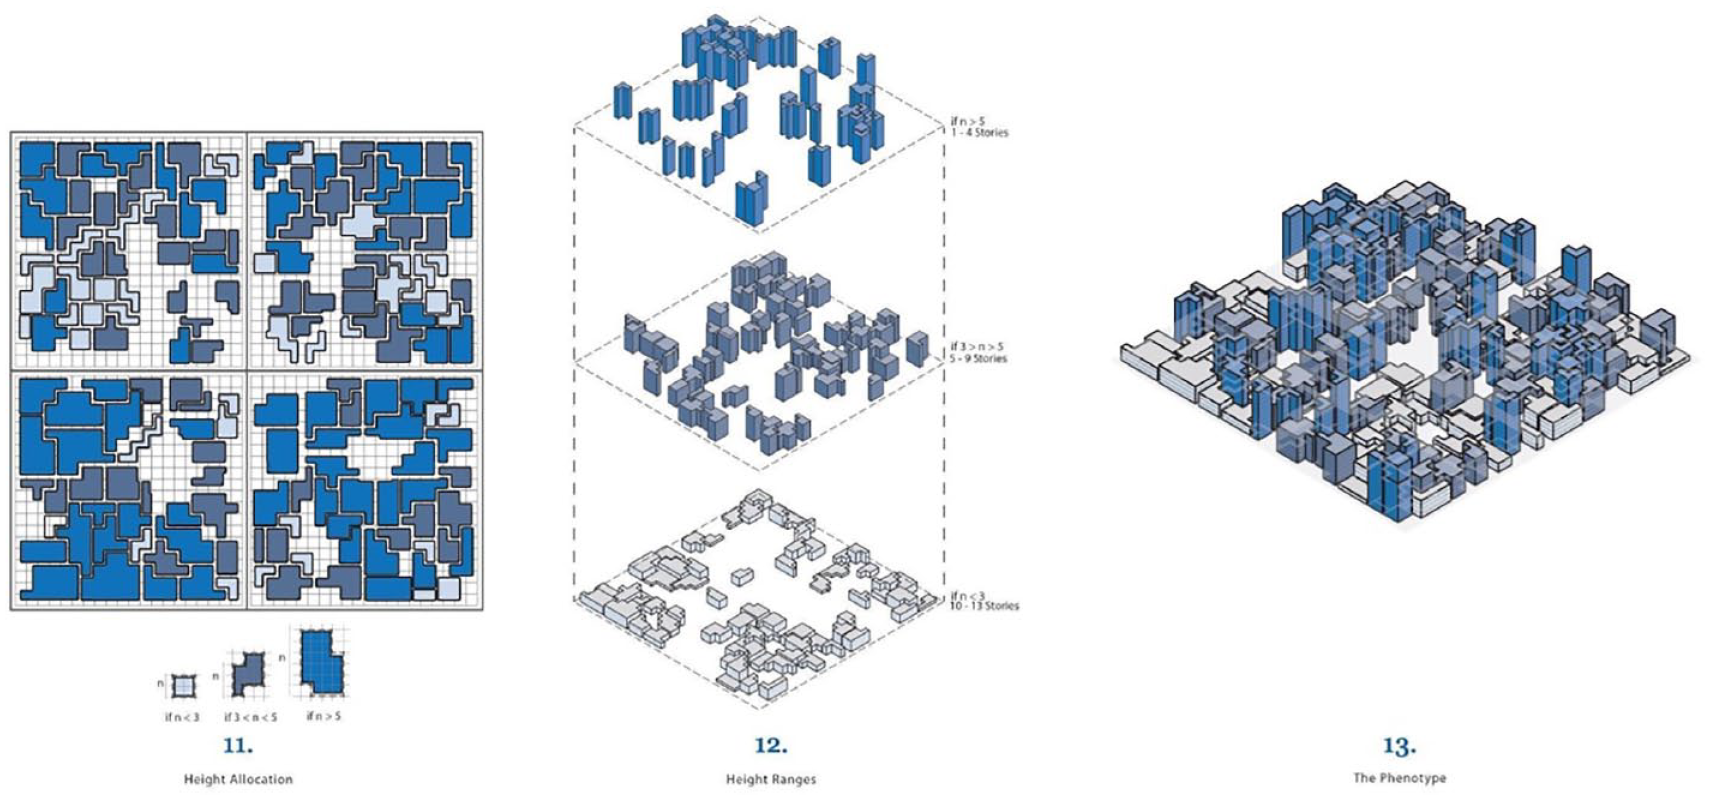
The allocation of three height categories based on the superblock’s network.
Simulation settings
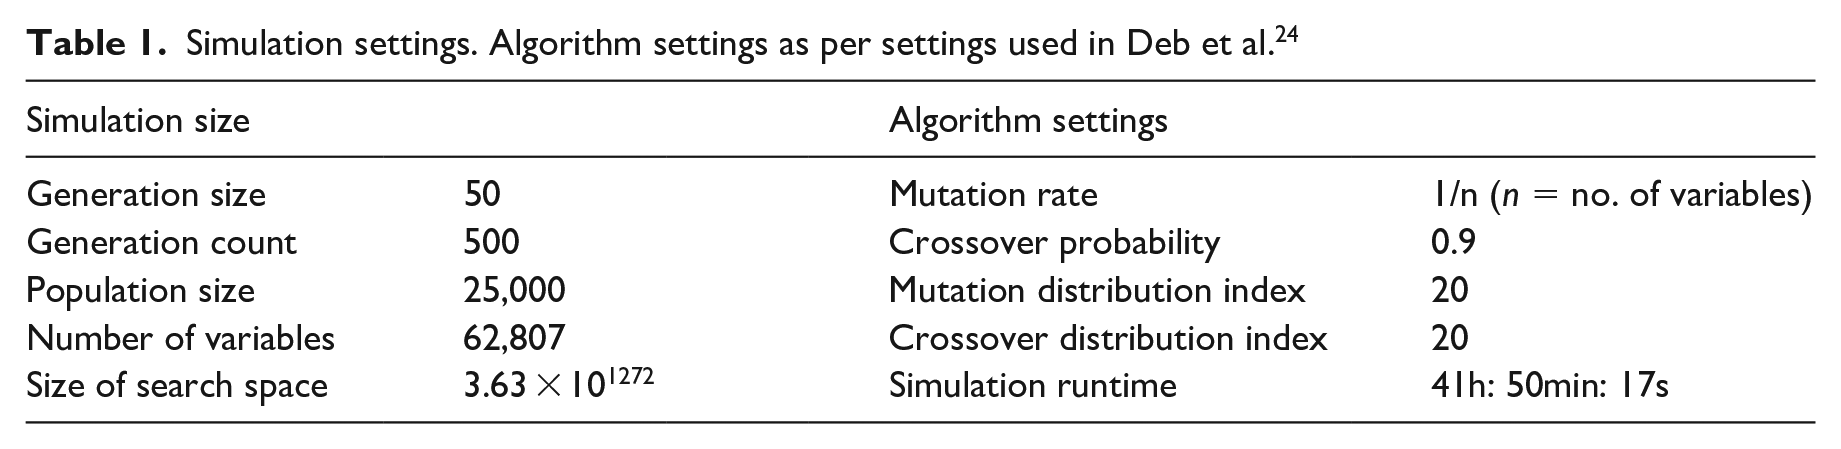
The following settings have been applied to the evolutionary simulation (refer to Table 1). The simulation was run on a PC with the following specifications: AMD Ryzen Threadripper 1950 × 3.4 GHZ processor with 32.0 GB of RAM.
Simulation settings. Algorithm settings as per settings used in Deb et al. 24
Simulation results
The output of 25,000 solutions dictates the necessity for the statistical analysis of the population set, in which emergent patterns in the outputted data plays an active role in both understanding the simulation run, as well as refining the population for selection.
Through the multiple analytic methods provided in Wallacei, the results from the simulation were examined to better understand the algorithm’s output. In the first instance, utilising the parallel coordinate plot identifies the conflict between objectives, where the fitness values for each solution in the population is compared across multiple axes (Figure 9). The analysis acquired from this graph can be directly compared with the repeated fitness values graph (Figure 9) and the mean value trend line (Figure 10(c)). The results show increased convergence towards the later stages of the simulation.

Parallel coordinate plot visualising the repeated value for each fitness criteria throughout the simulation. The width of the line indicates the number of times a fitness value has been repeated, and the location of the line on the y-axis indicates how close the fitness value is to optima (the lower the closer).

Standard deviation graph (a), Fitness value graph (b) and mean value trend (c) line to visualise variation and optimisation
Through analysing the mean fitness value across the generations, a significant improvement in mean fitness (Figure 10(c)) is observed at the ~100th generation; however, towards the latest generations in the simulation, a stabilisation in the mean value is observed. This is further highlighted when examining the repeated fitness values graph (Figure 10(b)), where the first three objectives show a significant number of repeated fitness values close to optimal fitness. The occurrence of this is less so in the fourth objective, in which there is no clear pattern of fitness values being repeated close to the optima (even though an analysis of the mean fitness value presents a stabilised mean in the latest generations); this is further confirmed when comparing the repeated fitness values to the Standard Deviation (SD) charts (Figure 10(a)), in which the first three objectives present lower SD values in later generations (i.e. greater convergence), while the fourth objective presents higher SD values in later generations (i.e. less convergence); however, the fourth objective continues to present increasing mean fitness values, thus implying that given longer simulation runtimes, convergence is probable. The above highlights the significance and necessity of analysing the data outputted by the evolutionary simulation using multiple analytic methods and not a singular method. In doing so, a clearer and more detailed understanding is achieved of the simulation’s results, in which false positives are detected and nullified. Additionally, when examining fitness objective 3, the values that are being explored range from 110 to 414 turns, this is an example where the simulation was able to explore a large range of values; establishing a higher rate of variation within the morphological characteristics this objective is optimising for.
Through the analysis conducted, it was demonstrated that the later generations were the most viable for selection; therefore, the last generation (generation 499) was chosen (being the latest generation to optimise, as well as showing the fittest mean values) and its pareto front solutions were selected, (i.e. the solutions that have ‘no other solutions in the search space (that) are superior to them when all objectives are considered’ 25 ). The 26 pareto front solutions were further examined through a comparative analysis of their fitness values using the diamond fitness chart (Figure 11). As the objectives are in conflict, a solution that optimised for all objectives did not exist. Therefore, the pareto front solutions were analysed to prioritise for fitness objectives 1 and 2 as the original superblock of Kyoto deeply lacked adequate sun hours on ground floor as well as a high number of intersections. However, Fitness objectives 3 was optimising for the minimum number of turns on the shortest path between and within blocks, the values that can be seen in the mean value trend line signify this objective is optimising relatively well as it was able to reach values that are almost half the worst value of the objective and thus the pareto front solutions are already showing relatively fit values in comparison to the original Kyoto superblock (Figure 10(b)). Fitness objective 4’s aim was to maintain the Kyoto block density and thus it was placed as a last priority as (in the context of this research) the walkability of the urban tissue was of higher importance. Despite this, an equidistant diamond chart would be optimal but following the selection process of the individuals, they were selected based on the priority of each objective relative to the overall design goal. As such, individuals 31, 39 and 45 were chosen for further analysis.

26 Pareto front solutions of the last generation, Diamond charts representative of all four fitness objectives. The closer the diamond to the centre of the chart the fitter the solution.
Phenotypic analysis
Despite the numeric analysis of the evolved population demonstrating a successful evolutionary simulation, and in turn, an efficient optimisation of the urban tissue; further urban analysis of the morphological characteristics of the fittest individuals is essential to better understand the selected solutions’ morphological characteristics. To achieve this, these solutions were evaluated through additional analytic criteria that are independent from the fitness objectives of the evolutionary simulation, yet related to the overall aims of the research.
Network analysis
Due to the significance of the urban network, the three chosen solutions were analysed further using Space Syntax 26 (through the grasshopper plugin Decoding Spaces 27 ), utilising multiple network analysis methods developed by Hillier and Hanson. 26 The methods applied are frequently used to measure the overall quality of a network and is well known for its ‘aggregate measurement, quantitative validation, and societal-spatial structures’. 28 Through utilising the Betweenness measure, which calculates ‘how likely a space is to be chosen as part of a route between spaces’, 26 the nodes and segments within the superblock are analysed where every possible route within the network is calculated (using Dijkstra’s 29 shortest path algorithm) between every node within the network. Betweenness values represent the number of times a segment was used when calculating the shortest path to every node within the network, a segment represents the users path between two navigational turns (nodes). For example a segment with a betweenness value of eight would represent that this segment was used in eight separate shortest paths within the network (Figure 12). Upon analysis of the three solutions, the distribution of betweenness values throughout each solution’s network is significantly different; the aim was to find an individual that shared an even distribution as an ideal network strives on a balance of highly ‘active’ areas and ‘quieter’ areas, to form districts or clusters of commercial, residential and mixed use neighbourhoods that blend on the basis of natural movement as ‘choice (betweenness) often identifies the natural boundaries of areas’. 30 The networks are bound within a 2 × 2 grid and measured only with betweenness values as it is easier to identify on a local scale the finer details such as the morphological patterns and the cultural structures that construct these programmatic districts. 30 The potential expansion of this network to a 4 × 4 or 6 × 6 (or larger) would benefit from utilising the metric of integration, which measures the depth of a network and is even more often impactful on a larger scale as it can identify the city centres and the overall structure these local spaces communicate on. 30
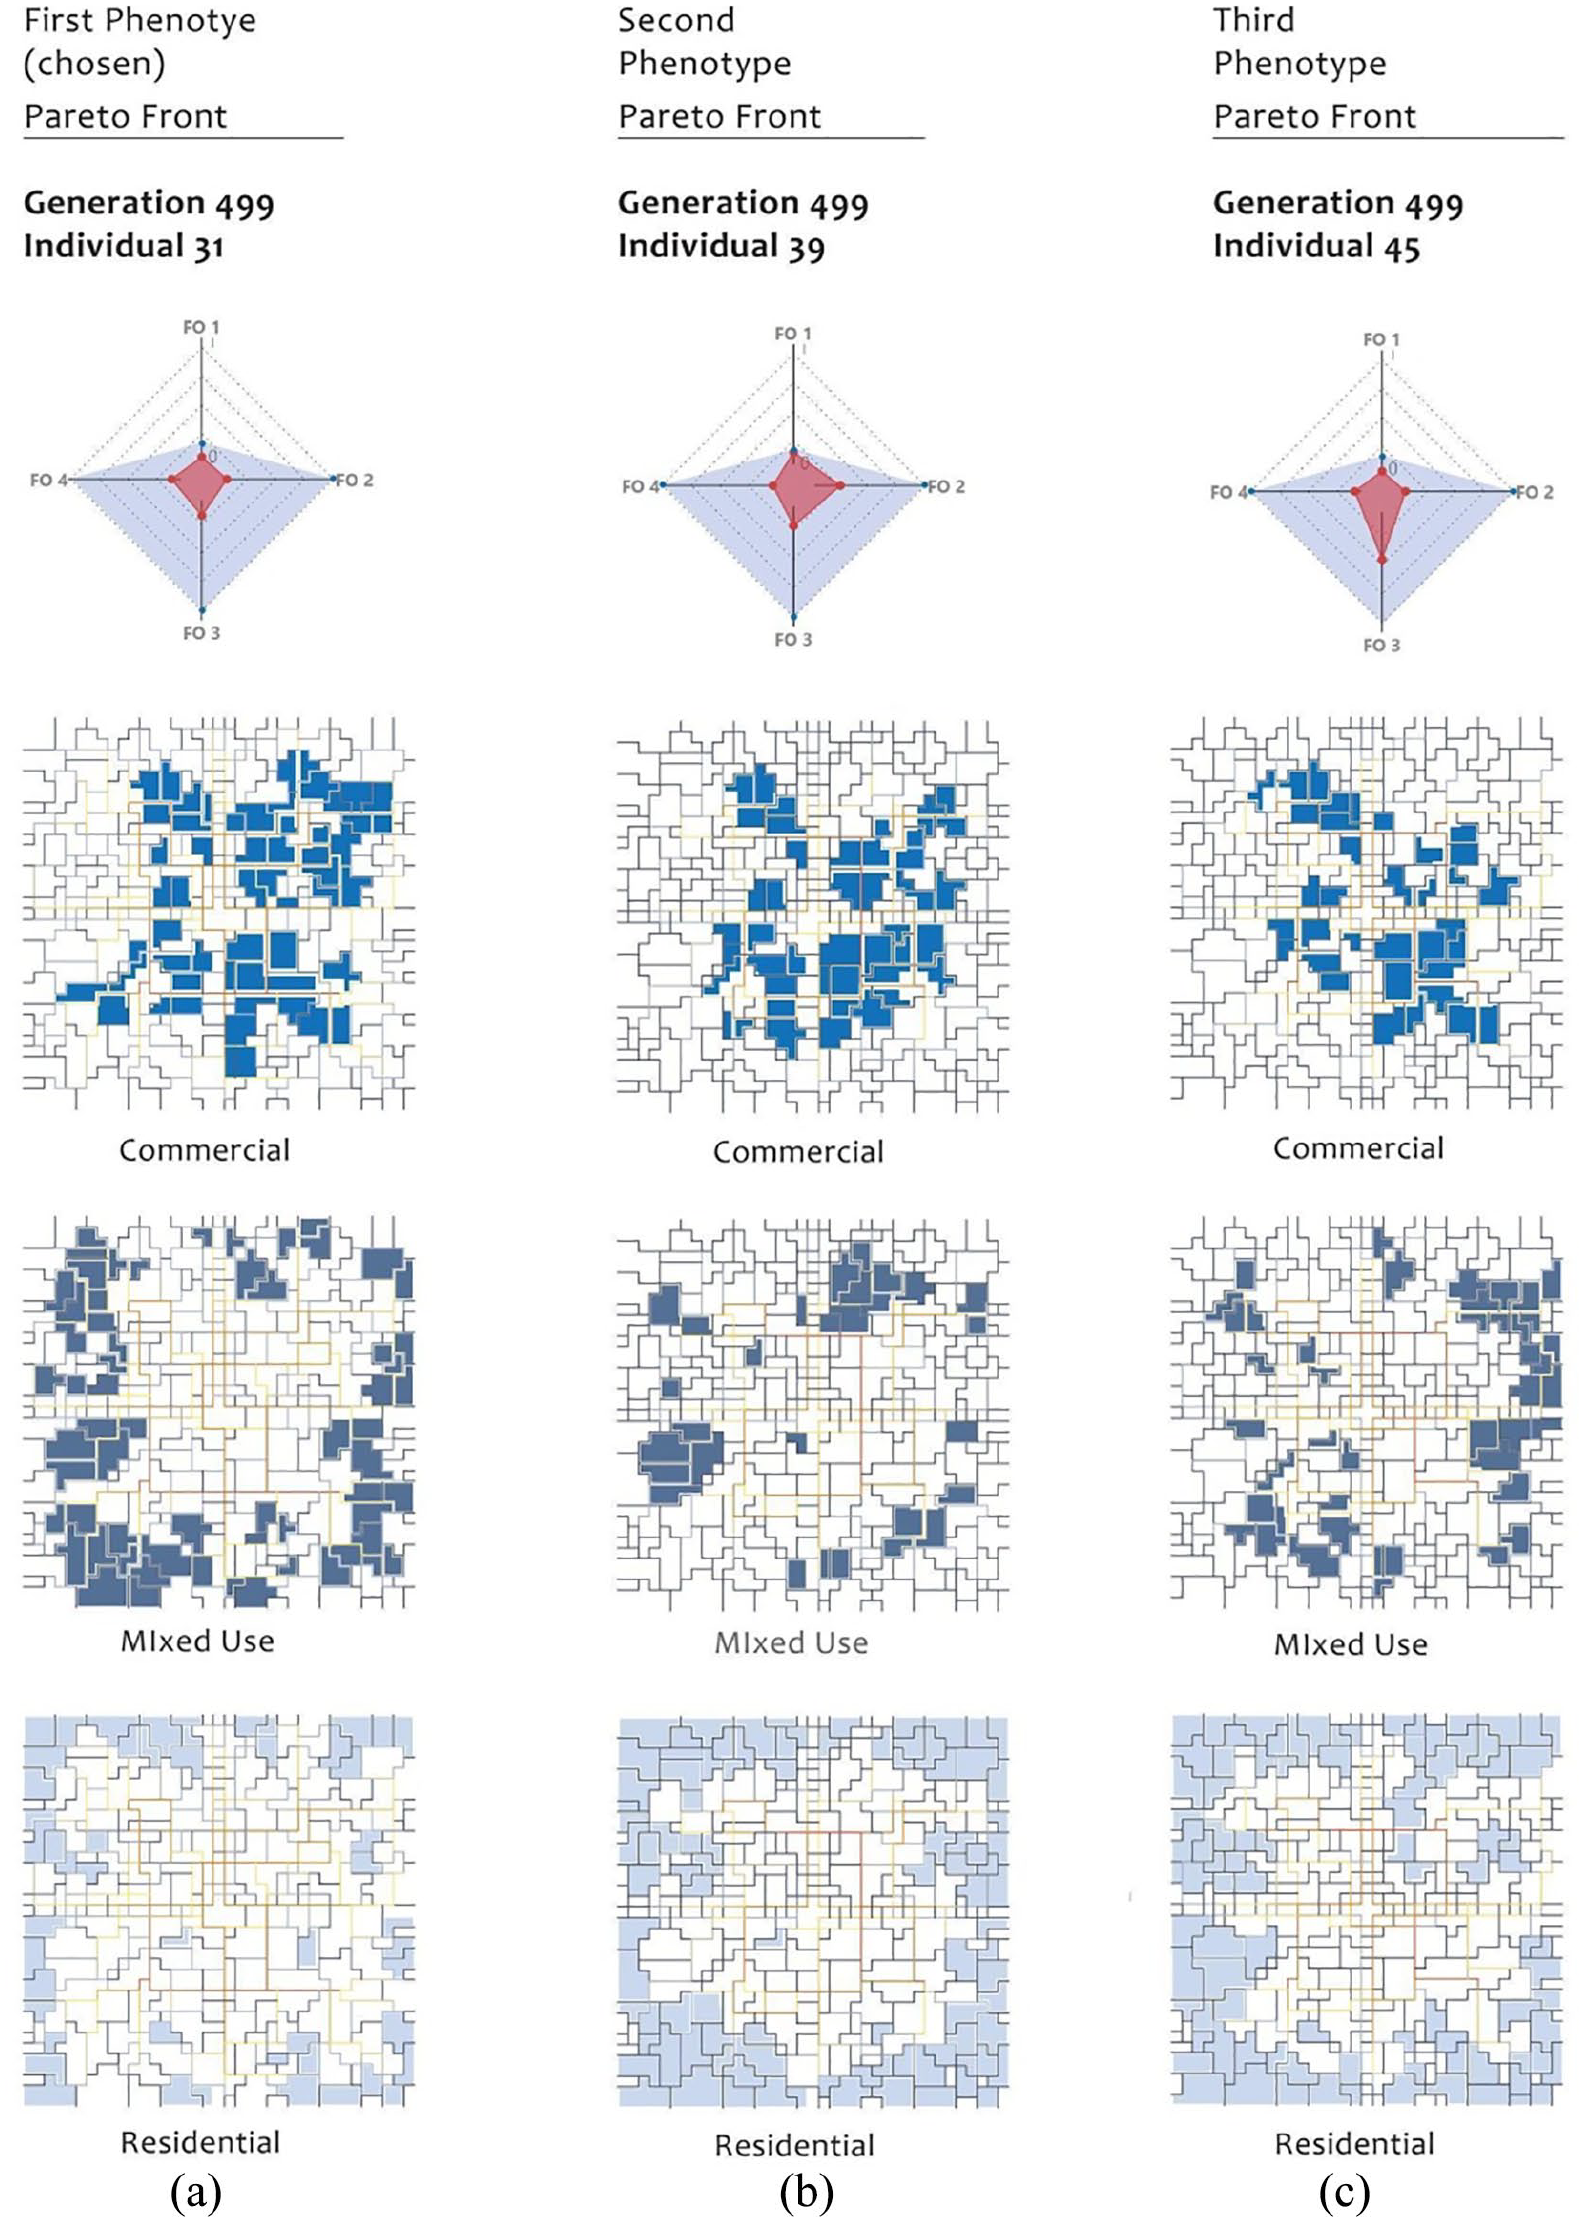
Distribution of program based on betweenness values across three chosen individuals. Red, yellow and blue present high, medium and low betweenness values (respectively).
These measurements can be further taken to ‘identify which pathways in a settlement make themselves most readily accessible to other pathways and thereby integrate the locality with the wider surroundings’. 28 Thus, by assigning commercial programs to buildings adjacent to paths with high betweenness values, mixed use to medium and residential to lower values, this begins to establish that highly active streets belong with high public activities and low active streets belong with more privatised activities. Individual 31 (Figure 12(a)) can be seen as the most evenly distributed in terms of betweenness and program whereas the other individuals highly dominate in residential. What is evident across all individuals is high betweenness tends to gather within the centre of the urban tissue and decrease towards the perimeter; therefore, through applying the above relationship of betweenness values and program distribution; commercial is centralised, mixed use is pocketed in-between and residential surrounds the perimeter. Individual 31 provided a successful organised structure for the distribution of private and public programs, it was able to maintain high betweenness values along paths with less turns (longer and straighter paths) and accommodate those paths with commercially low-rise buildings. It built a basis for an organised relationship between urban morphology and its social structure, allowing for a balanced distribution of programs through a more defined logical approach.
Repeated morphological characteristics
Through overlaying the morphologies of all three solutions, a formal analysis identifies the unique characteristics and repeated growth patterns between the different superblocks; highlighting the repetition of specific morphological characteristics while others presenting constant variation (Figure 13). The shape of the building footprints plays a crucial role in dictating both the number of intersections and turns on the shortest paths. By deconstructing the overlaid morphology into building lots, intersections and shortest paths, the subsequent emerging behaviour between the unique and repeated growth patterns across the chosen individuals becomes more evident (Figure 13).

Overlaid three individuals to establish repeated and unique patterns. Dark blue – shapes repeated throughout all three individuals, light blue – shapes varying across all individuals; dark dots – repeated intersections; white dots – unique intersections; red lines – repeated segments on the shortest path; blue lines – unique segments in the shortest part.
Through examining areas in the overlaid solutions with a significant number of repeated characteristics; building lots that are parallel to the shortest path evolved fewer segments and longer sides, presumably to reduce the number of turns to optimise for Fitness criteria 3. On the other hand, repeated intersections that have persisted across the different solutions are often located along the perimeter of the blocks (Figure 14).

Analysis of repeated and unique patterns in three different characteristics of the superblocks. (a) Intersections. (b) Shortest paths within blocks. (c) Shortest paths between blocks.
Solar analysis
Using the same method of identifying unique and repeated behaviours across the three solutions, urban characteristics of the superblocks are further examined through solar analysis. Using Ladybug, 31 the desirable sunlight hours on the overall network and courtyards are calculated. The analysis shows the number of sunlight hours for each individual during the winter solstice. While comparing Individual 31 to Individual 39, Individual 39 received a significant amount of sunlight across all courtyards and its overall ground plane (Figure 15(b)). Individual 31 and 45 received relatively the same amount of sunlight.

Sunlight hour analysis conducted on three individuals. (a) Gen. 499, Ind. 31, (b) Gen. 499, Ind. 39, (c) Gen. 499, Ind. 45.
Height distribution
Using the same method of overlaying the individuals, two distinct colours (dark blue and light blue) are used to identify unique and repeated characteristics. Dark blue shapes are repeated across all individuals and have minimal variance in heights. For example, height changes from 1 to 2, 4 to 6 or 10 to 13 stories (Figure 16). Whereas, light blue shapes are continually changing in shape and drastically changing in height. For example, a cluster of light blue buildings located in the north western corner of every superblock varies in height from 1 to 12 stories. Groups of light blue shapes are generally identified through a larger range (Figure 16), however the most repeated heights across all three individuals range from 5 to 7 stories. This observation leads to the assumption that light blue geometries have less impact on maximising the sunlight hours on ground level compared to dark blue geometries.

Overlaid three individuals to establish the unique and repeated clusters and analyse the relationship between buildings shapes and heights.
Selected solution
Through a comparative analysis of the three individuals, the initial selection process aimed to choose the individual with the most repeated characteristics. These characteristics being the number of morphological intersections shared between the three individuals, the shape of the building footprint and the consistent height; as it is believed that the algorithm is favouring these characteristics to optimise for its fitness objectives. However, the decision to acknowledge the programmatic distribution emerging through the betweenness analysis of the network proved vital as it addressed the designation of privatised and public life at street level. Despite Individual 31 not having the most repeated characteristics, the overlaid analysis revealed how the change in morphological characteristics across the individuals could help improve the values of fitness objectives. It was selected as it was the most balanced in terms of segregation and integration, it showed an even distribution of commercial, mixed use and residential and with the knowledge acquired on how to improve fitness objectives, Individual 31 showed a promising structure that is often difficult to establish in future stages.
Analysing the network
The selected solution is further analysed according to the following criteria. First, a three-turn radius to each courtyard from a building is calculated to understand the relationship between buildings and courtyards. Ninety percent of buildings within the superblock are located within this radius. These buildings are less than 60 m to a courtyard as well as within a 1-min walking time (Figure 17(a)). All residential buildings (Figure 17(b)) are in a five-turn radius of a commercial building within a total distance of 100 m and less than a 2 min walk. Additionally, analysis is conducted on how integrated and centralised each courtyard is to all the buildings within the superblock on a three-turn radius (Figure 17(a)). This identifies courtyard 3 and 4 as the most integrated as all of the buildings within the superblock have access to the courtyard within three turns (Figure 17(c)).
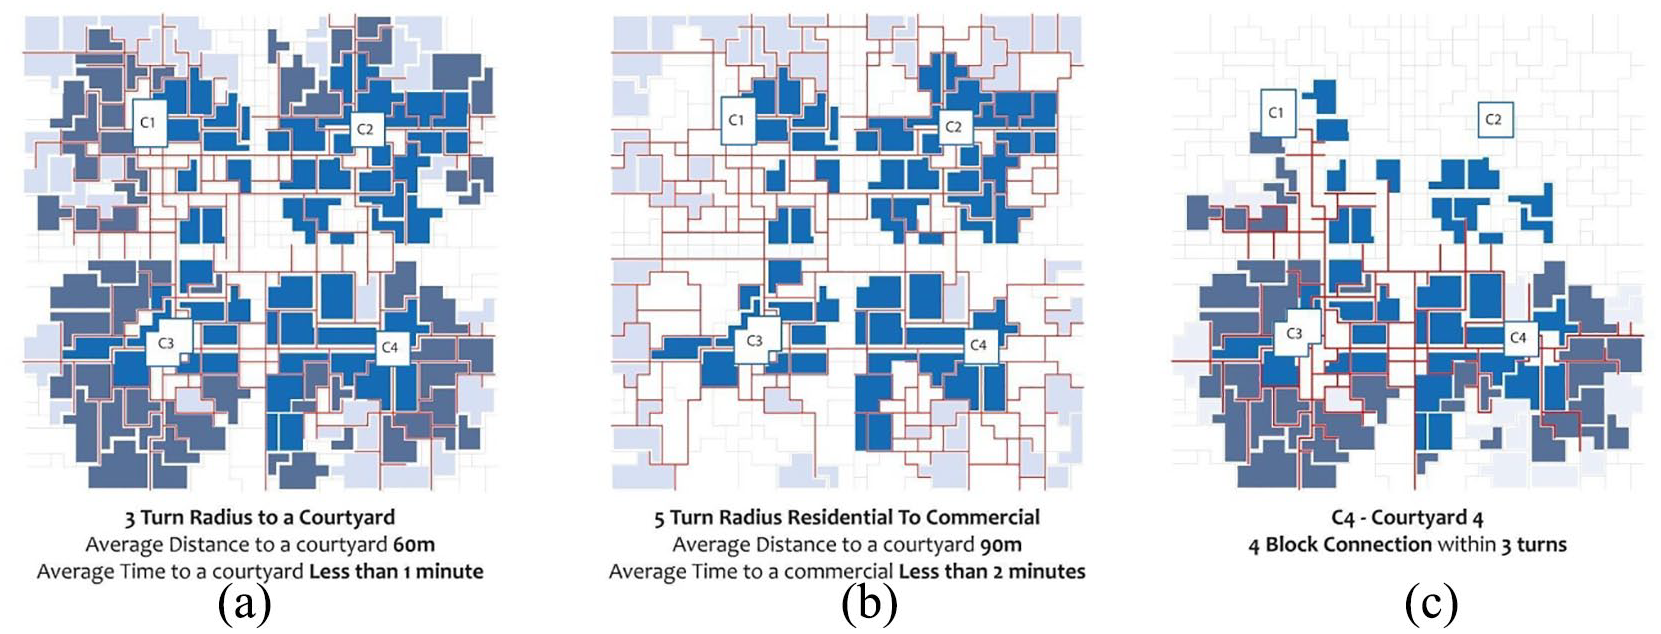
Calculating the overall quality of the superblock’s walkability based on 3-turn radius (a) 5-turn radius (b) and four block connection within 3-turns (c).
Multiple sections through the superblock (Figure 18) identify the betweenness value of the shortest paths in relation to its courtyards. Courtyard 3 (Figure 18) increases ‘betweenness’ as it moves towards courtyard 4, whilst maintaining an uninterrupted visual connection. Courtyard 4 also has smaller buildings surrounding it compared to courtyard 2, which is surrounded by taller buildings. The same behaviour occurs for courtyard 1 and its relation to courtyard 4 (Figure 18).

Relationship of betweenness value of the shortest paths to the courtyards.
Analysing programmatic distribution
Through an analysis of the shortest path network, programmatic groups are formed and begin to identify the location of certain commercial, mixed use and residential groups as well as their relationship to the shortest path. Half of the programmatic groups contain three or more programs expressing a well distributed allocation of programmatic density. However, when separating the superblock by its programs, a complex allocation of these groups emerge. Commercial gathered in the centre of the superblock, mixed-use buildings surrounded the commercial perimeter and the residential scattered the edge of the superblock (Figure 19). This pattern is in direct correlation with the betweenness values established on the network. The simulation revealed an organisational structure that was not planned for in the experiment’s setup.

Programmatic cluster by shortest path (a) and programmatic cluster by one program (b).
Analysing Visual Connectivity
As expected, due to the high betweenness value progressing from courtyards 4 to 1 and 3, this subsequently resulted in an unobstructed visual path (Figure 20). Furthermore, when applying the same view analysis method from buildings to its adjacent open space; two interesting patterns have emerged. Taller residential buildings located on the perimeter of a block have view access to smaller and privatised courtyards; and a larger space tends to emerge around the main courtyard of the block to expand its view corridor for perimeter buildings on all blocks.

View analysis from one courtyard to another as well as from the buildings to the courtyards.
Analysing solar gain
The simulation favours courtyard 1 to acquire the most amount of sunlight compared to the other courtyards; 5 hours on an average day. Courtyard 4 received between 3 and 4 h of sunlight. Finally, Courtyards 2 and 3 are the least favourable as they received less than 2 h of sunlight. Courtyards 1 and 4 received the most sunlight hours as a majority of the taller buildings were located along the northern edge of the superblock; while smaller buildings clustered in the centre to maximise solar gain along the shortest paths leading to courtyards (Figure 21).

Solar analysis on courtyards and buildings envelope.
The conducted urban analysis identified the dependent relationship of the network to its overall morphology. The social and cultural traits of the alleyway generated an efficient network that met the original design goals, through the increase of visual connectivity within blocks, the walkability of the tissue as well as the coverage of desirable sun hours on ground level. It gave rise to new morphological characteristics that numerically proved to increase the quality of the street level of the urban tissue. As the stages of urban growth are quite difficult and hard to predict, a strong foundation can significantly help maintain and improve the qualities within the urban tissue. Thus, as Individual 31 is able to establish strong urban qualities, it holds a robust starting point to an urban growth proposal.
Growth proposal
One of the key challenges for planning urban tissues is establishing a proposal for how the urban fabric will develop and grow, and the consequent impact of this growth on existing elements within the urban tissue. Therefore, through using the growth patterns identified in previous sections, a proposal is presented for the adaptation of the urban fabric to morphological changes instigated through the tissue’s growth and development. Decisions made to create morphological changes to an urban tissue, due to environmental changes or climatic impacts are common in all urban growth scenarios. Understanding how a morphological change can impact an established fitness objective can help maintain and often improve the quality of the urban tissue over time. Sectors were established through the use of betweenness values of the network, where an ‘inner’ area (with high betweenness values) and an ‘outer’ area (with low betweenness values) of buildings is established (Figure 22). When the change of a building’s morphology occurred in one sector, another building would need to directly correspond to this change in order to maintain or improve the numeric value of the fitness objectives.

Variational exchange occurring on Individual 31, representing which buildings change when a proposed change occurs.
This is demonstrated in Figure 23(a) where the subdivision of one building in the ‘outer’ area is initiated to increase the number of intersections. This subdivision must also divide the building into two buildings with two separate height categories, 1–4 and 10–13 in this instance, in response, another change must then occur in the inner sector by increasing the height of a 5–9 storey building to minimise the variation of total floor space area between different height categories. By comparing the values of the result of this scenario, it is clear that based on Individual 31’s fitness values, the change that occurred was able to improve the values of three or more objectives. Although all objectives are unable to optimise, by understanding conflict between these objectives allows the user to understand how physical changes and planning decisions are affecting these values. Through the growth of an urban tissue, over time some objectives can be more or less favoured than others, by understanding how the conflict occurs between them allows the urban tissue to be susceptible to the environmental changes that may occur during its lifetime. Thus, through identifying how morphological variation occurs based on the optimisation of fitness values, the urban tissue presented becomes a basis to an overall growth planning scheme.
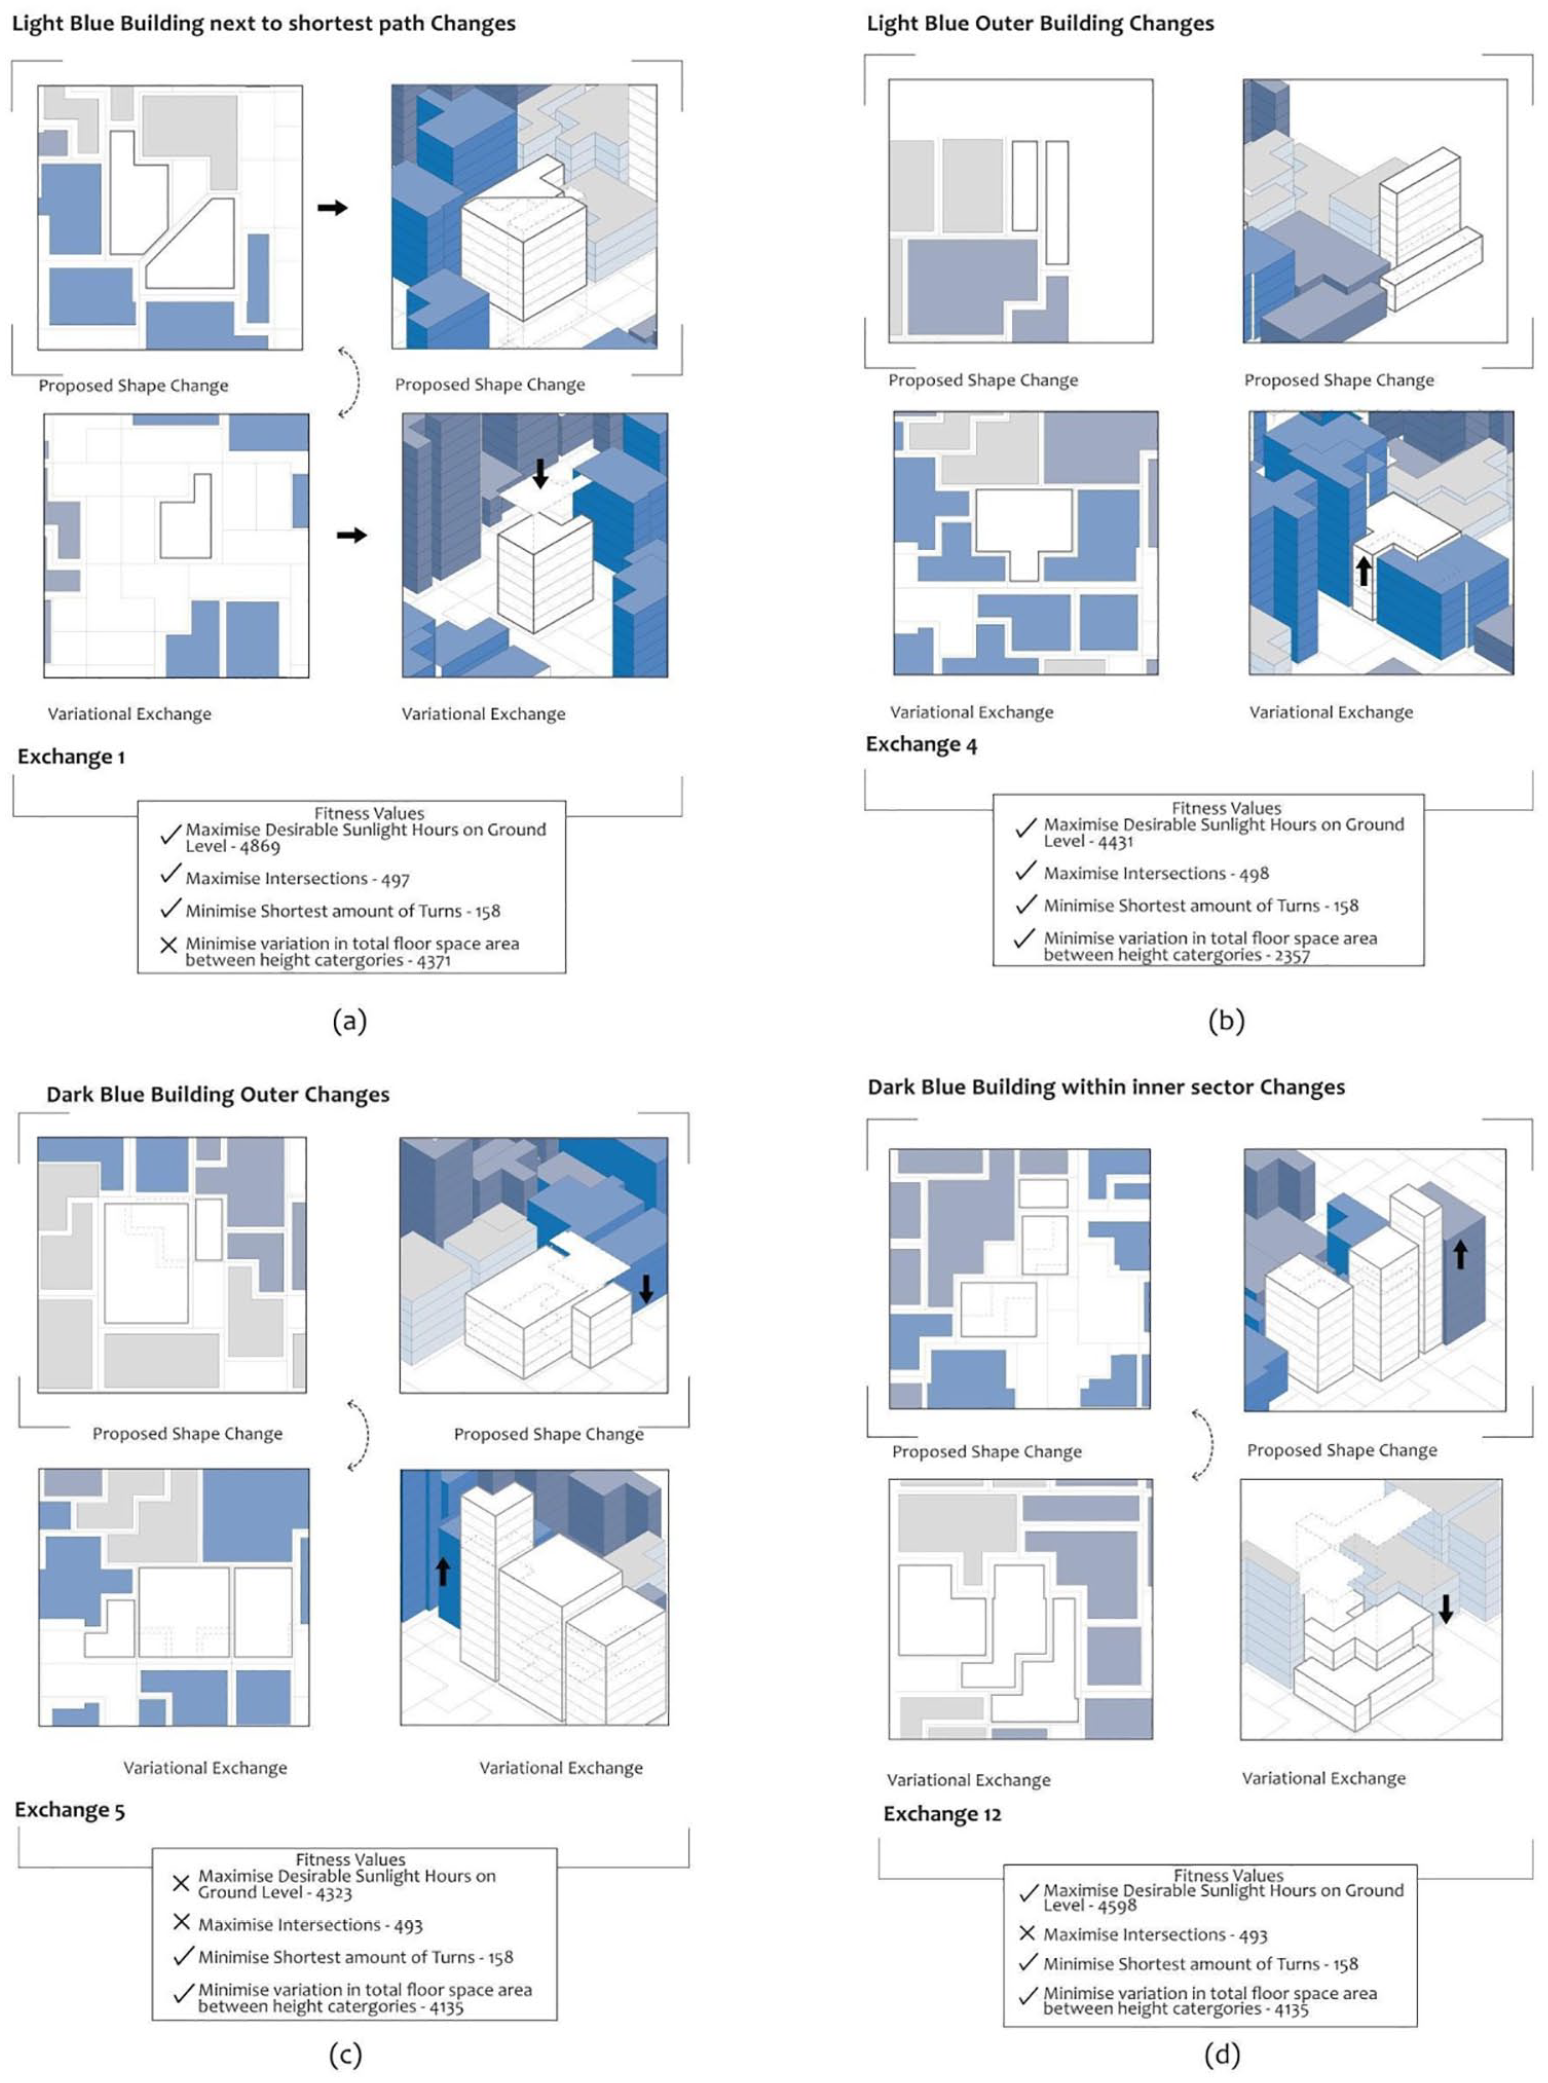
Fitness values changing through morphological change within the superblock, representing the increase and decrease of all criteria. (a) Outer sector changes for dark blue buildings. (b) Inner sector changes for dark blue buildings. (c) Exchanges for light blue buildings that are on the shortest paths. (d) Exchanges for light blue buildings located in the outer sector.
By applying multiple variational exchanges to Individual 31, a new individual is created through the guidelines of growth established above. The individual (Figure 24) was able to achieve an improvement in fitness objective 1 and 2 and maintain the same value for objective 3; however objective 4 was significantly impacted. Despite not being able to improve across all objectives from Individual 31, the individual improved across all aspects in comparison to the original Kyoto Superblock. The newly generated individual can be seen as a progression from Individual 31, this is not to say that this is the final form of the urban tissue but a glimpse into the flexibility and adaptability of the growth scheme.

Growth model, Individual 31 with the applications of variational exchange and diamond fitness charts representing the growth proposal, the original Shijo Karasuma superblock and the previously selected solutions (highlighted with a dark blue outline).
Conclusion
The presented research examined the impact of socio-cultural traits, driven primarily by the understanding and formulation of the Roji (narrow alleyway), on the development of urban form. Through a thorough analysis of Kyoto’s streetscape, and a primary focus on networks and open space, various tools and methods were utilised for the implementation of evolutionary processes as a design model for evolving a population of solutions that aimed at achieving optimised variation. Utilising a 2 × 2 superblock, the ‘alleyway’ and its relationship to open space, population density, program distribution, solar gain and connectivity (both physical as well as visual) supported the formulation of the design problem to focus on these relationships, and allowed for the simulation to optimise for the impact of these relationships on the morphological characteristics of the urban landscape. Through a sequential analytic process, the simulation’s results presented a solution set of urban superblocks that demonstrated emergent patterns that were unbeknown at the start of the research. Key urban relationships pertaining to courtyard location, programmatic distribution, height variation and block relationships persisted in the evolved solutions, while other characteristics were allowed to vary and change at a higher rate by the simulation.
Additionally, although the presented research uses Kyoto as a case study, the underlying methods driving the logic behind the experiment’s setup, analysis and selection are applicable in varying design problems. Localised modifications to the method are inevitable, however the primary workflow presented in Figure 25 is transferable to design problems requiring global optimisation coupled with local variation. The chart highlights the manual, semi-automated and completely automated tasks that were conducted in the experiment.

Workflow of the presented research highlighting the relationship between manual, semi-automated and automated tasks.
The role of socio-cultural traits within the design of an urban tissue displayed the importance of urban growth and what constitutes this progression. It reveals that it is able to exist and maintain itself across numerous previous generations of city growth, that it is a key quality that can be used to face issues of adaptability and progression. Due to how it can be displayed through multiple different variations of morphological characteristics, it is a quality that can consistently regenerate numerous possibilities. This allows for the process to be broken down to understand variation and adaptability within the urban fabric, identifying morphological characteristics that are persisting over generations as well as characteristics that are in constant flux. In doing so, revealing growth within the tissue that allows for a planning scheme that guides users to an approach that is more robust to both internal and external change.
The task of quantifying urban characteristics that are ingrained within a society’s culture, ones that have evolved over time, and proposing urban solutions to help reinforce or improve these traits requires further research, in which its application in other locales that address more obscure socio-cultural characteristics would further strengthen the methods developed herein. Where the numeric construction of the alleyway was the key driver to quantifying the social and cultural traits that formulate the basis of the overall morphology, and although the presented experiments demonstrate an improvement to the existing urban superblock based on the constructed fitness criteria – the quantification of socio-cultural traits remains a complex and challenging issue, one that is driven by a multitude of parameters that define urban form. In the presented research, the alleyway played a significant role in the socio-cultural development of Kyoto; however, the challenge of quantifying other socio-cultural traits persists, and so a limitation of the presented work is that further research is required to address other parameters that contribute to socio-cultural expression of the urban context.
Footnotes
Declaration of conflicting interests
The author(s) declared no potential conflicts of interest with respect to the research, authorship, and/or publication of this article.
Funding
The author(s) received no financial support for the research, authorship, and/or publication of this article.
