
Abstract
Registering, documenting, updating, revitalizing, expanding, and renovating old urban buildings require proper documentation. The adoption of 3D survey techniques is essential to grant efficiency and agility to such purposes. This article discusses a multi-approach integration of Light Detection and Ranging (LiDAR) data collected by aerial and terrestrial platforms, meant for the 3D modeling of a building at Level of Detail 3. The selected building presents challenging elements for modeling, such as blocks with different heights and indented facades. It is located on the campus of the Federal University of Paraná (UFPR) in Curitiba, Brazil, on a site with irregular terrain and surrounded by trees, what made the terrestrial laser scanning process difficult. For its three-dimensional reconstruction, data from an Aerial Laser Scanning system were integrated with data from a Terrestrial Laser Scanner (TLS). Based on the 3D modeling, an as-is Building Information Modeling model of the building’s exterior was created. To validate the results, measurements of the building were obtained by means of an Electronic Distance Measurement (EDM) device and they were then compared with measurements extracted from the point cloud-based BIM model. The results demonstrate that there was a correspondence between the EDM and the LiDAR-derived measures, attaining a satisfactory statistical agreement. The article focuses on the accuracy of LiDAR models for the cadastral update of buildings, providing information for decision making in documentation projects and construction interventions. The main contribution of this work consists in a multi-approach workflow for delivering an effective and precise solution for accomplishing an as-is BIM documentation, highlighting advantages, drawbacks, and the potential of this set of methods for integrating multi-source LiDAR point clouds.
Introduction
Throughout their life cycle, buildings undergo several modifications, such as renovations and extensions. It is clear, therefore, the need to document all of its history in order to adapt the changes and updates with the registration in public agencies, for example. In addition, in many cases, old buildings do not have proper documentation, many not even of their initial design and construction. 1 In the current economic context, obtaining reliable and effective information is crucial for any sector. In civil construction, this is no different, as incorrect interpretations or delays mean increased costs and deferments in completing the works. 2 In recent years, technological advances in capturing reality together with the development of modeling software provide effective gains for construction management. In this scenario, Building Information Modeling (BIM) acts as a source of information, storing relevant data, and contributing to the building inventory.3-6 A BIM product created from an existing building is called as-is BIM and is considered a reverse engineering process, where the building project is reconstructed from real data. 7
Creating or updating a BIM requires capturing three-dimensional data with rich details about the building. Traditional methods can be used, but these can be incredibly time-consuming and expensive, as they depend on field teams to perform measurements of roof and facade elements, such as walls, beams, doors, windows, openings, and setbacks, among others.1,8-10 On the other hand, automatic techniques for obtaining data by remote sensing can be employed with the use of devices capable of obtaining three-dimensional information about the building in a timely and accurate manner. The use of a three-dimensional point cloud by means of laser scanning enables the 3D representation of buildings, allowing BIM models to be updated or created in the as-is BIM mode, representing the state of the art in building modeling. 11
Three-dimensional reconstruction using laser data can generate realistic models, being used to model buildings,12-16 including documenting historic buildings,17-22 and also in collaborative applications, such as Cloud-BIM. 23 On the other hand, several works expand the use of three-dimensional point clouds to include detecting changes in the building’s BIM documentation through automatic comparisons with the point cloud. 1 Aiming to overcome the lack of reliable documentation, Laefer and Truong-Hong 24 propose a method to automatically identify structural steel elements from terrestrial laser scans to be incorporated into BIM models. Suchocki and Blaszczak-Bak 25 use terrestrial laser scanning data to identify and evaluate cracks and cavities in walls and structural elements to generate accurate diagnoses for necessary interventions in buildings. Nowak et al. 26 present a diagnosis of the degradation of the walls of a building through TLS, making it possible to identify the verticality of degraded walls, including the situation of the floor. In turn, Gámez Bohórquez et al. 27 present a method for retrieving 3D building contours, meant to support facade renovation projects, relying on a workflow based on parametric modeling for point cloud slicing.
In order to standardize the modeling and documentation of constructions, the U.S. General Services Administration (GSA) 28 defined four levels of detail (LoDs). In this context, LoD1 includes the two-dimensional location of the construction, LoD2 adds roofs and walls, forming a three-dimensional block, in LoD3 all facade elements are added, such as doors and windows, including roof details and, finally, LoD4 addresses the internal modeling of buildings. 29 Greater levels of detail are achieved by integrating data from different acquisition platforms. 30 One of the technologies available to obtain three-dimensional point clouds is Light Detection and Ranging (LiDAR), which can be coupled to different platforms. Its terrestrial system, called Terrestrial Laser Scanning (TLS), has an excellent ability to obtain facade and interior points, but when it comes to roofs this characteristic is no longer evident. 31 Thus, data from an Aerial Laser Scanning (ALS) system can be combined with TLS data to reconstruct from roofs to interior details of buildings, achieving the highest possible level of detail.
Several works address the challenges of integrating LiDAR data in order to achieve the richness of details at LoD3 and LoD4. Kedzierski and Fryskowska 32 presented a wavelet-based method to integrate ALS and TLS point clouds and concluded that to generate a complete 3D model of a building with a high level of detail, it is crucial to perform a successful integration of these data. Ruiz et al. 33 reported the fusion of roof photogrammetric data and facade TLS data for the 3D modeling of a faculty building, and the authors realized that despite missing facade data due to the TLS beam occlusion, it was possible to accomplish a satisfactory 3D model at LoD 3.
The integration of roof, facade, and interior laser data to develop complete BIM projects was presented by Mohammed, 30 who acknowledged the importance of multi-source data fusion and realized that there is no unique type of LiDAR data able to provide all the input information for a BIM, particularly for large scale BIM projects. Paiva et al. 34 demonstrated the effectiveness of 3D modeling of historic buildings by proposing a new integrated point cloud segmentation approach, combining Hierarchical Watershed Transform and Curvature Analysis by region growth. Kedzierski and Fryskowska 35 analyzed different methods (manual, semiautomatic, and automatic) for the integration of ALS and TLS data, evaluating the accuracy obtained for the purpose of buildings 3D modeling. In their turn, Abdullah et al. 36 described an integration of ALS and TLS data with semiautomatic registration, meant to produce a LoD3 building modeling.
Data registration is an important step in data integration. In the present work, the Iterative Closest Point (ICP) algorithm 37 was used. It is one of the most popular algorithms and is widely presented in the literature. It iteratively combines the transformation of data sets through point matching and error minimization. The algorithm has limitations related to distance, rotation, and data overlap. 38 The simplest solution is to initially establish corresponding points in both sets of data and then apply the algorithm. With the goal to tackle the limitations of traditional algorithms, such as ICP, several researchers developed specific automatic methods for point clouds integration, generating successful results.31,39,40
Assessing the accuracy of 3D point cloud models and point-cloud-derived BIM models has been a concern of several works in the literature. The use of a laser distance meter for assessing the accuracy of 3D models has been reported in different applications, such as determining vertical clearances, 41 identifying structural damages in constructions, 42 heritage assets modeling,43-45 and building documentation for adaptive reuse projects. 46
In most of these works, the 3D point clouds were analyzed independently, for instance, when comparing the measures obtained by a laser meter and a fixed TLS model as in References,41,42 or when individually comparing BIM models derived from point clouds obtained from a fixed and a mobile TLS, 43 or from a fixed TLS and a UAV photogrammetric sensor,44,45 or even from a fixed TLS and a portable structured light scanner. 46 In some cases, 3D models of indoor environments using structured light scanners were not only validated but also constructed with a laser meter. 47 In other cases, a laser meter was used for the construction of a 3D model with respect to the thicknesses of interior walls in particular. 48 A couple of works have used a laser meter to validate BIM models resulting from the integration of fixed TLS and photogrammetric point clouds.44,48 Differently from such works reported in the literature, we have carried out validations for a BIM model derived from the integration of airborne and terrestrial LiDAR sensors relying on in situ data acquired with a laser meter.
Thus, in this article, an assessment of the quality of the 3D modeling of a building through the integration of ALS and TLS data is presented. The main objective is to promote BIM modeling, demonstrating the accuracy and efficiency of generating 3D models of buildings at LoD3. The case study is a four-story building on the campus of the Federal University of Paraná (UFPR), located in the city of Curitiba, the capital of the southern state of Paraná-PR, Brazil. The choice of technology and data integration technique was based on the number of architectural details of the building, the accuracy of the collected data, the effort for data acquisition and processing as well as the accessibility to the building under study. Considering the obtained results, an evaluation of the data and its acquisition in terms of scale, complexity, and reach of the sensing systems is presented, serving as a basis for the building modeling. Finally, this work provides a multi-approach workflow for delivering an effective and precise solution for accomplishing an as-in BIM documentation, highlighting advantages, drawbacks, and the potential of this set of methods for integrating multi-source LiDAR point clouds.
Materials and methods
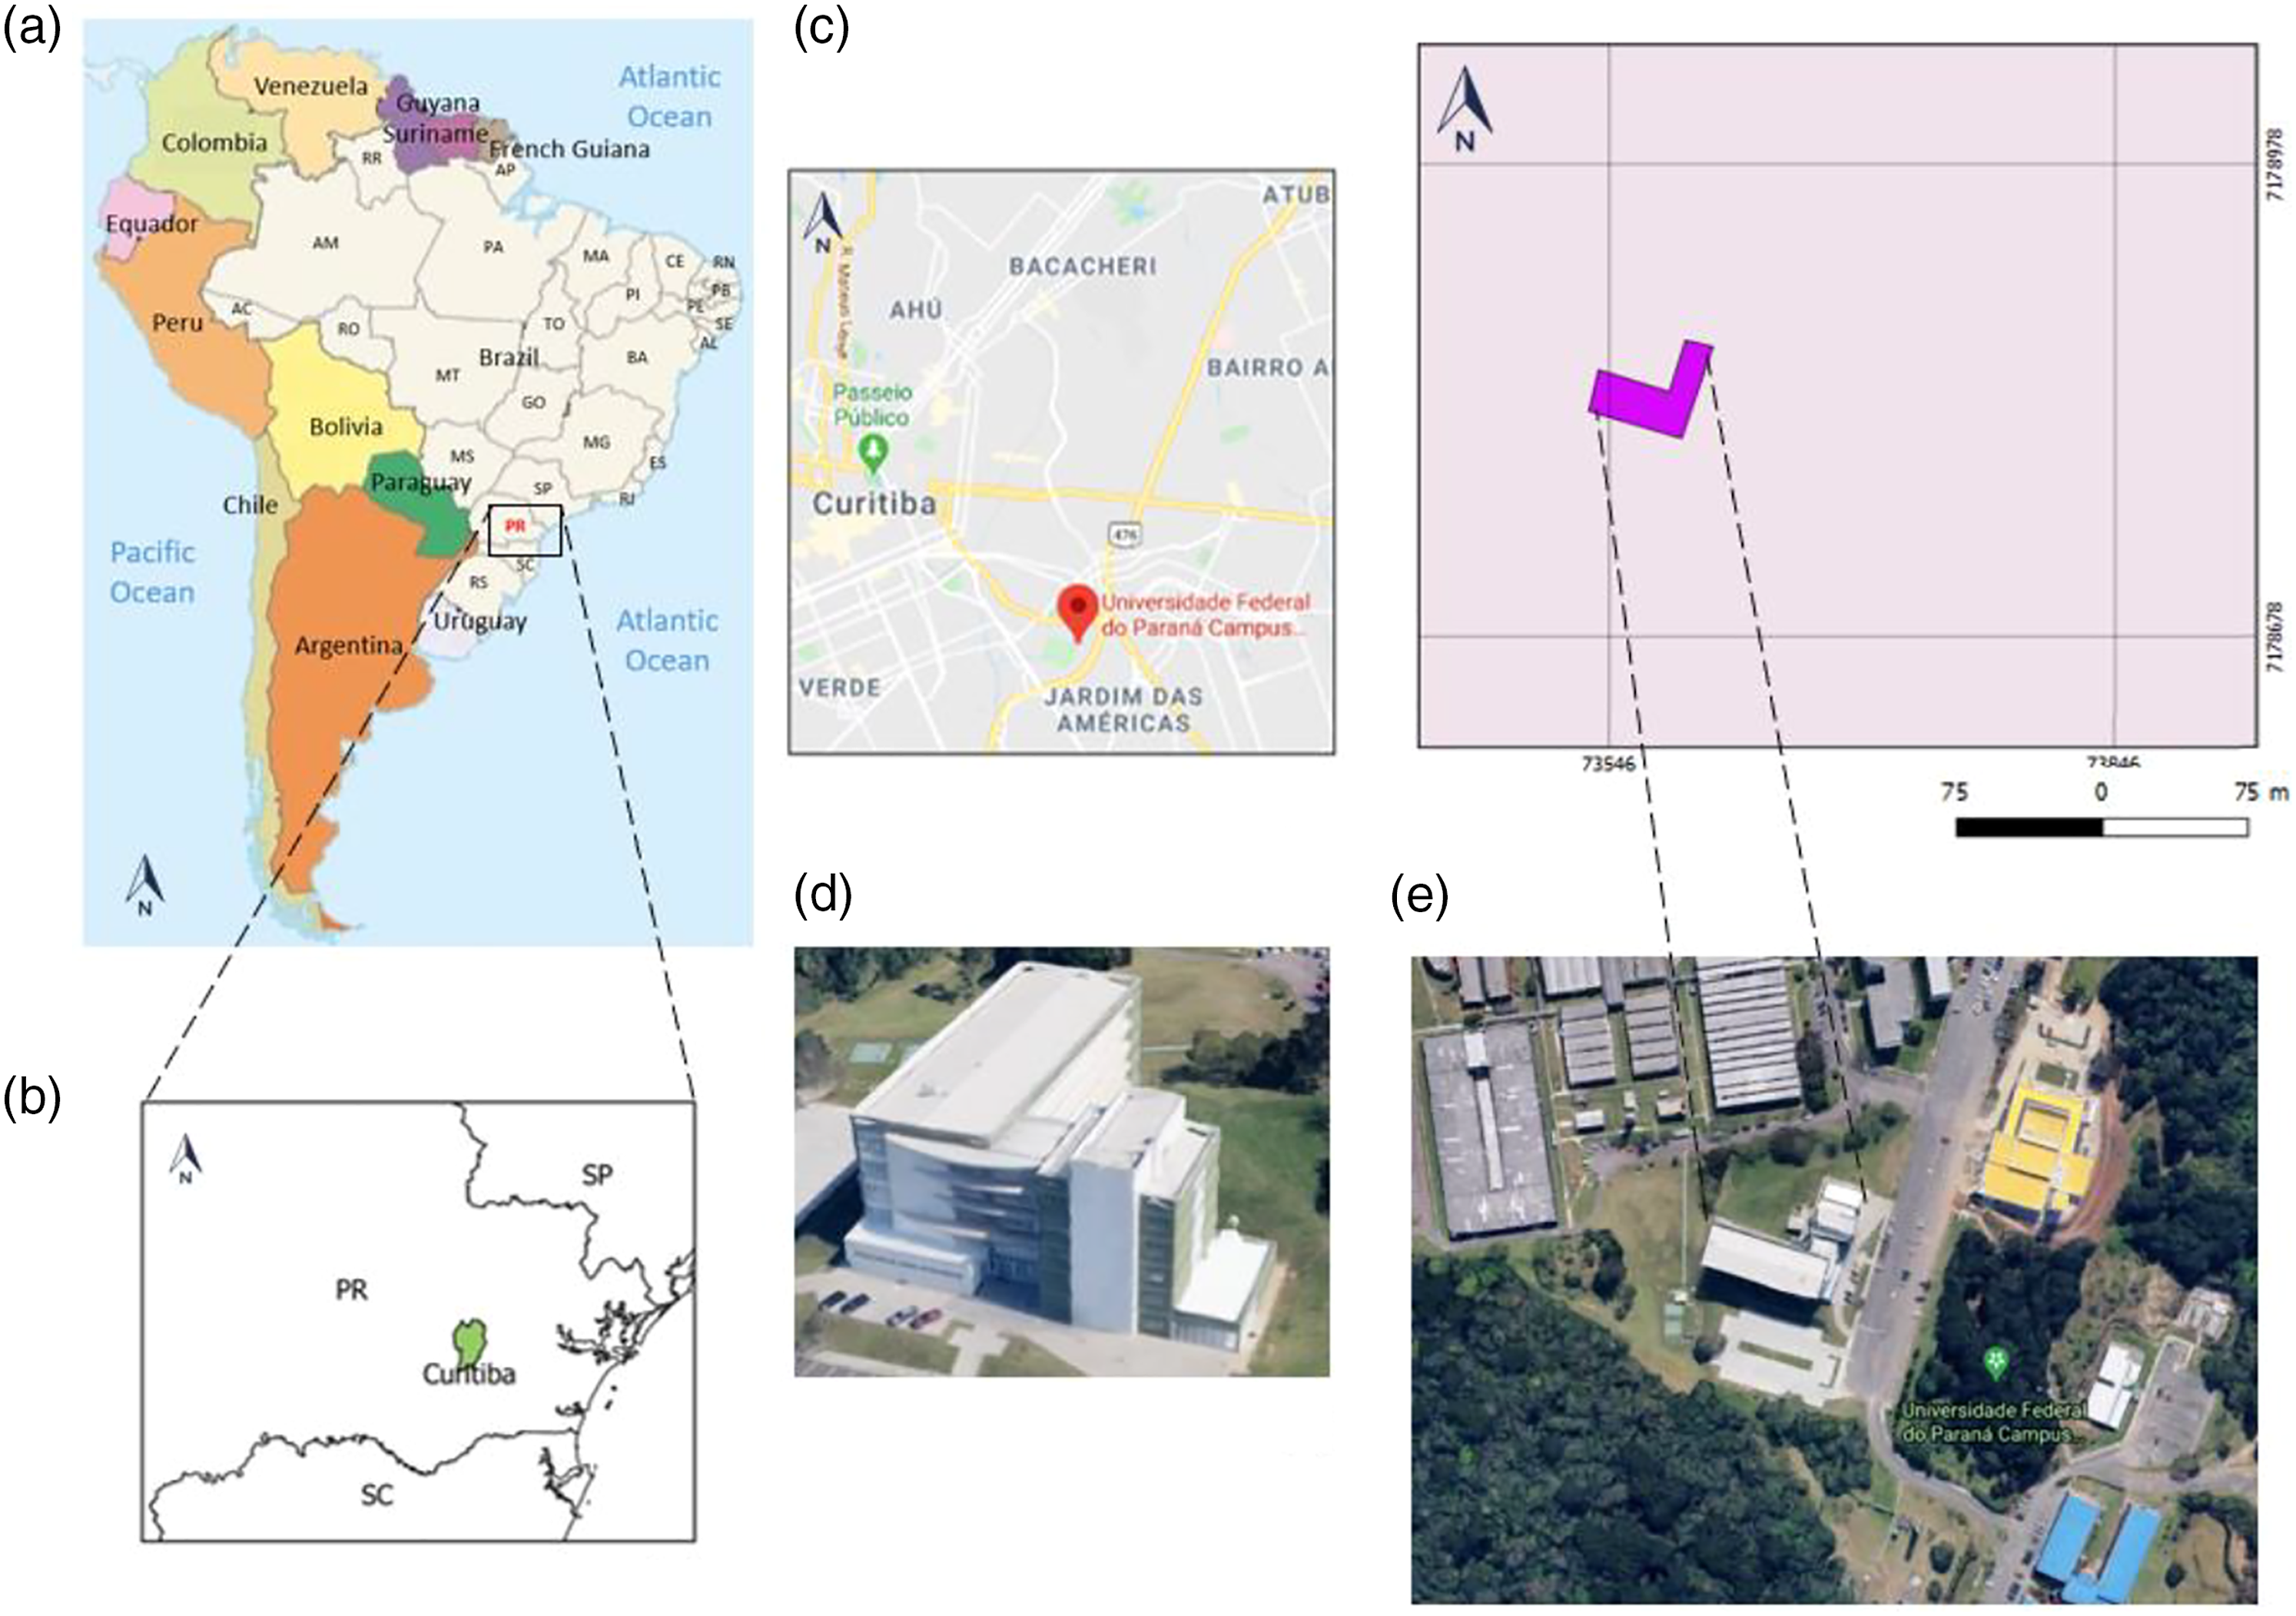
The building modeled in this work (Figure 1), located on the UFPR campus in Curitiba city, shelters the Departments of Nursing and Occupational Therapy, and is named only as the Occupational Therapy Building. Location of the Occupational Therapy Building: (a) Brazil and Paraná state-PR. (b) Municipality of Curitiba within Paraná state. (c) UFPR campus in Curitiba. (d) Aerial view of the Occupational Therapy Building. (e) Google Earth image indicating the building location. Source: Google Maps,
49
Google Earth-Maps,
50
IBGE.
51
The rectilinear architectural style characterizes the building, although its main and lateral facades contain advanced rounded slabs as decoration elements, which also act as eaves that delineate the stores. The glazed areas are the highlight of the dominant facade, in which it is possible to observe its central tower, in addition to the ground floors that are extensions of its main area (Figure 2). The building was chosen because it has challenging elements for remote-sensing techniques. Its height, size, diverse faces, and L-shape require the use of refined strategies for its complete modeling. Additionally, the external elements around the building such as trees, the backside single-story attached construction, and the uneven terrain hindered some surveys with the TLS equipment, due to the difficulty in assembling the platform tripod. On the other hand, the difference in heights of the several roof components and the advanced slabs, together with the trees, caused obstruction to the laser beam in some upward scannings. Occupational Therapy Building external view from the main and southwest facades.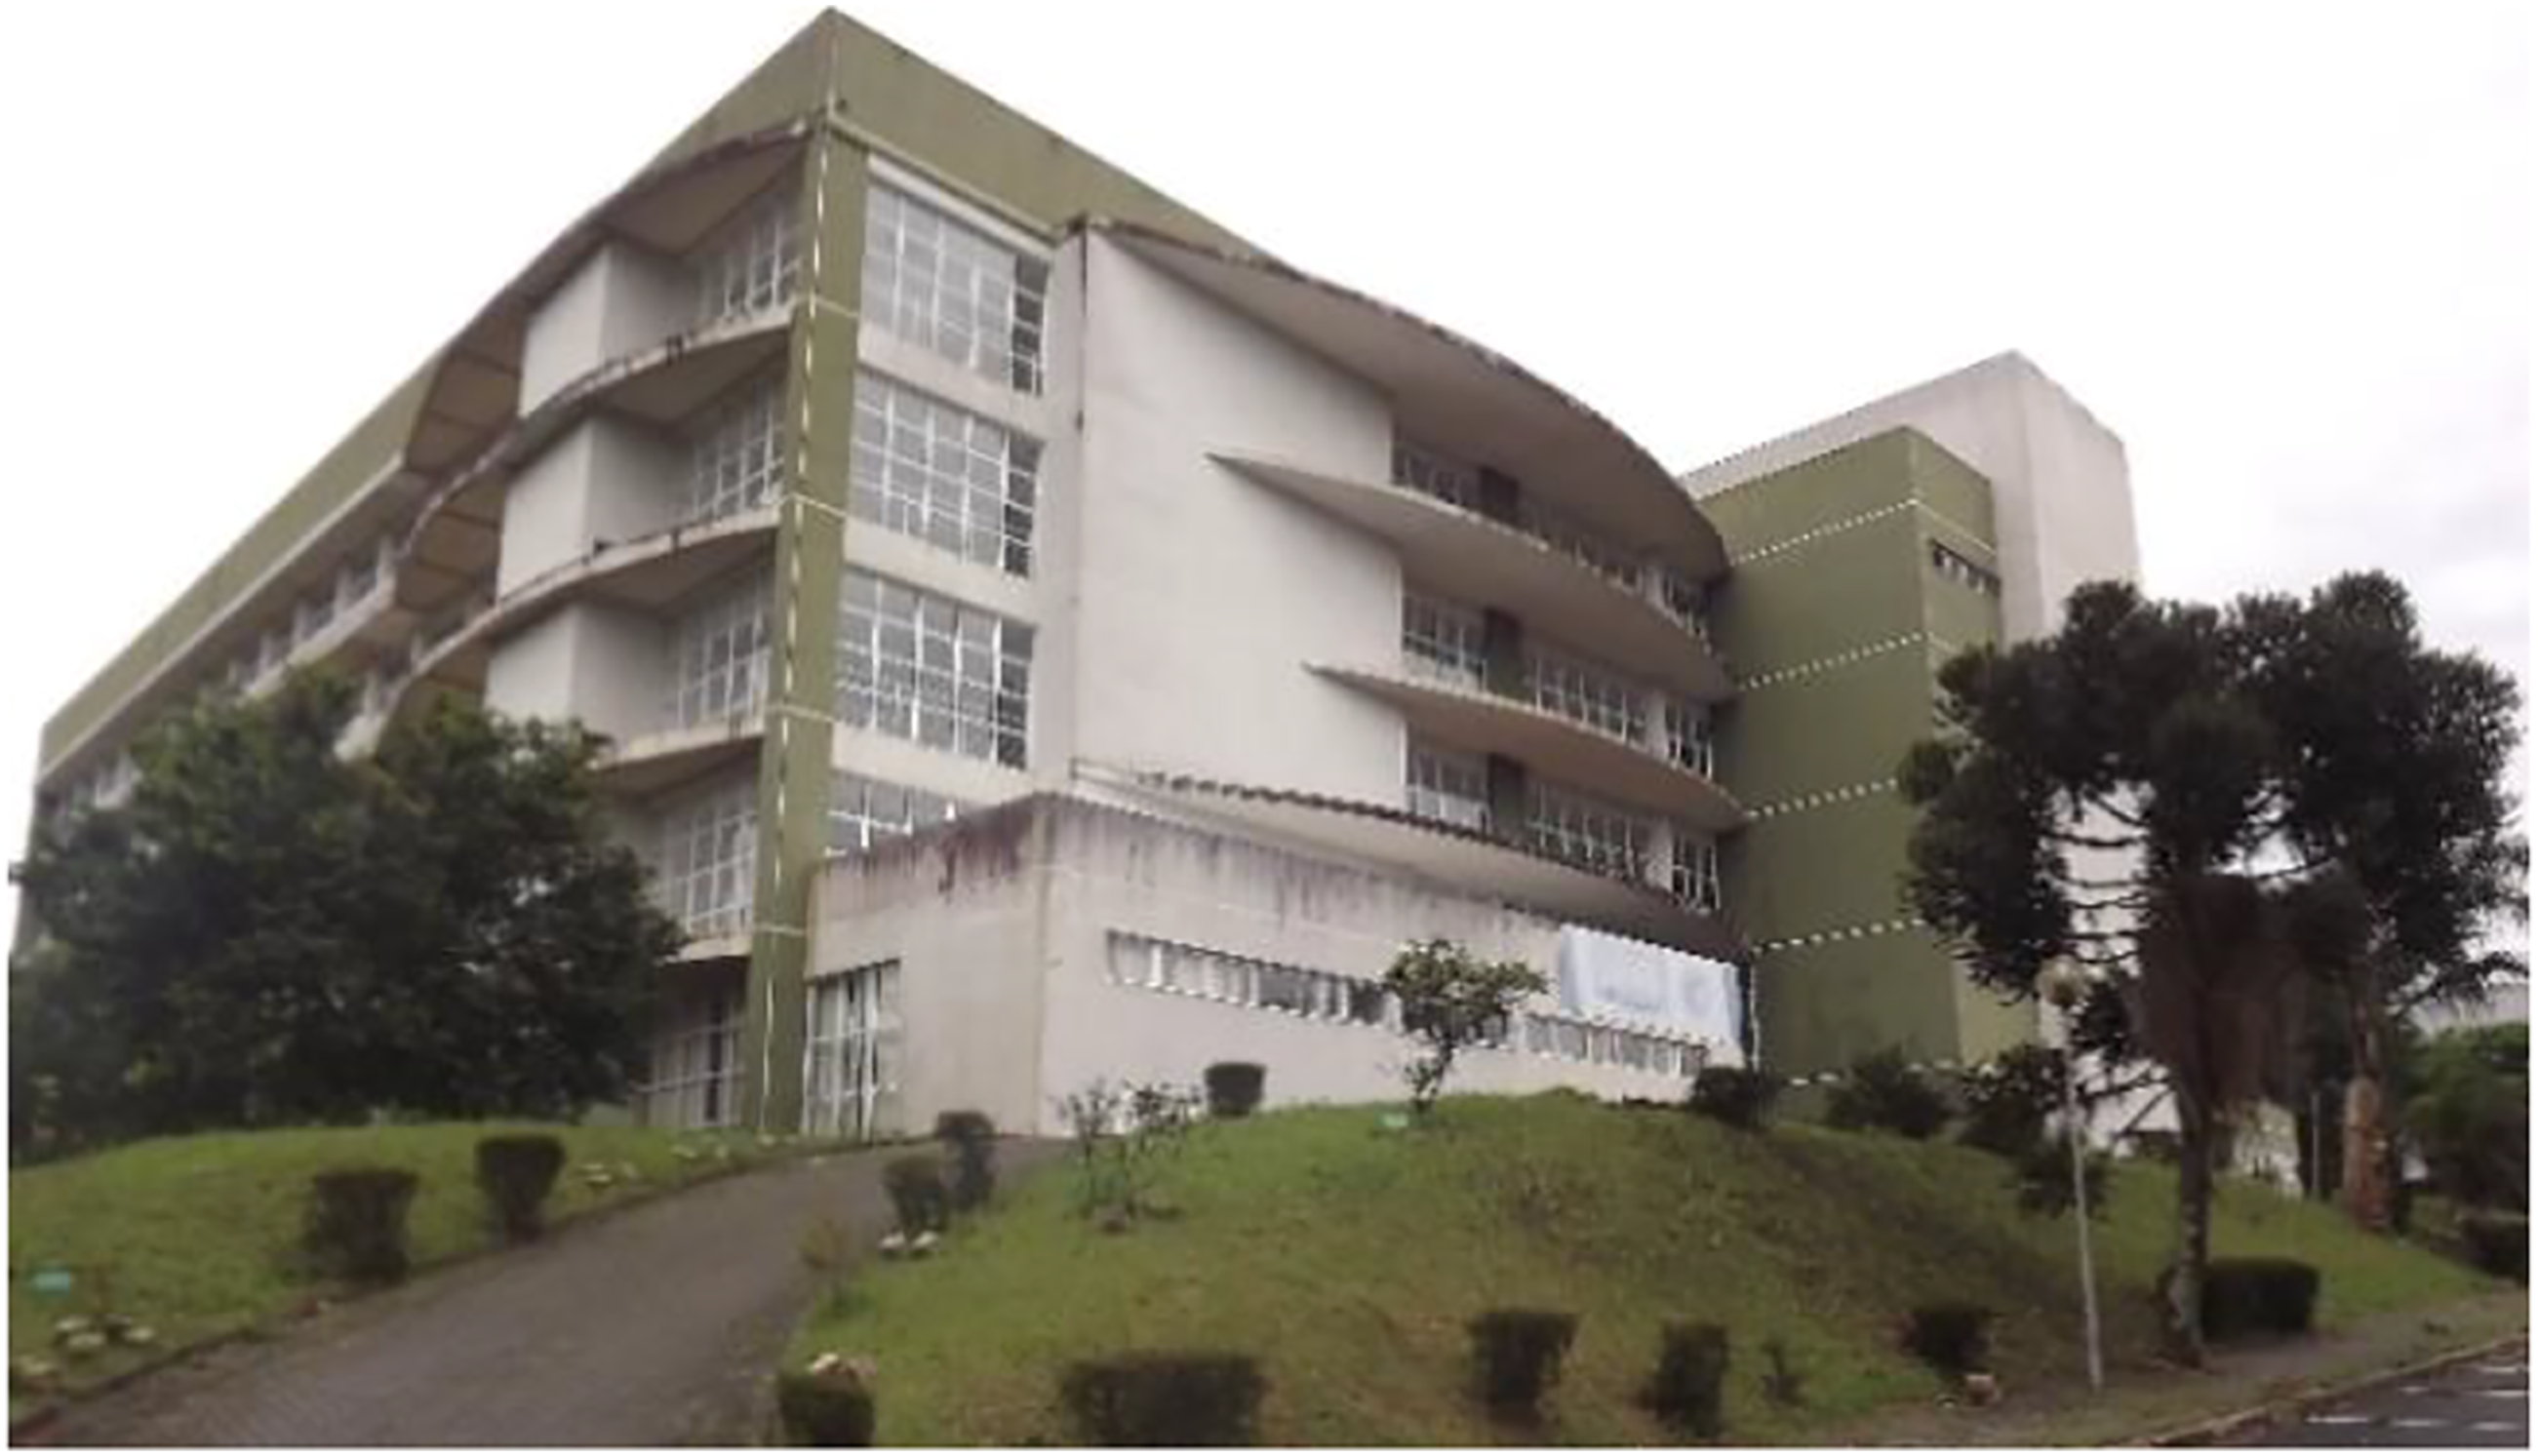
A significant volume of data was generated, requiring computational efforts for an appropriate processing. Considering all the imposed challenges, the modeling of this building was able to promote an effective evaluation of the laser scanning technique under real conditions of field survey and data processing in the laboratory. Furthermore, the generated point cloud model was the basis for the as-is BIM, making it possible to assess the quality of this documentation approach, discussing the advantages and drawbacks of such technology.
Figure 3 shows the diagram of the performed work. Firstly, aerial and terrestrial laser scanning surveys were executed on different dates. Next, the raw data were pre-processed to extract the building’s point clouds. Considering that these data derive from two distinct platforms, it was necessary to register the data to ensure proper integration. From the integrated point cloud, the as-is BIM model was created. Finally, the quality of the results was evaluated. Methodological block diagram.
Data processing was performed on an Intel® Core™ i7-8750H @ 2.20 GHZ laptop with 24 GB of RAM memory and dedicated NVIDIA® GeForce® GTX 1050TI graphics card with 4 GB of memory. The procedures were manually, semiautomatically, and automatically executed. The manual modality includes the insertion and manipulation of data to generate the result, and this modality was used for the as-is BIM stage. In the semiautomatic mode, processing involves those actions where the operator interacts with the selection, cropping, and marking tools among others, being employed for the data integration step. The automatic mode, in its turn, only requires data entry into the software and the selection of the desired function for processing, which was used for the ALS data processing.
Laser scanner
LiDAR technology consists in emitting a laser pulse with a high repetition frequency from a platform towards the target. Thus, it is possible to estimate the emission distances calculating the pulses return time. ALS comprises a laser sensor, an Inertial Navigation System (INS), and a Global Positioning System (GPS) receiver. ALS data provide points with positional accuracy corresponding to surfaces and objects found on the terrain. On the other hand, TLS operates in a static mode, mounted on a tripod, offering a high potential for 3D mapping. The operating principle of TLS consists of a highly collimated laser beam that scans the target in a regular pattern at a predefined solid angle, measuring the return time of the laser signal. 52
ALS data were made available by the Institute of Technology for Development (LACTEC). The sensor used was an Optech ALTM Pegasus HD 500 on board a bimotor manned aircraft. The settings for data collection were approximately 25° scan angle, 300 kHz profiling frequency, and 23 Hz scan frequency. 53 In order to extract the building roof, the ALS cloud was processed on the LASTools open-source platform using the lasground, lasheight, and lasclassify tools. 54
The lasground tool uses the Progressive Triangulated Irregular Network (PTIN) algorithm. Based on the methodology proposed by Axelsson, 55 PTIN divides the LiDAR dataset into small blocks, applying the following steps: (i) selection of the lowest points in each block in order to start the filtering procedure; (ii) construction of a Triangulated Irregular Network (TIN) using the selected points; (iii) densification of TIN by adding an imaginary point to the point cloud, and (iv) progressively thickening of TIN until all points are classified either as terrain or object.
The lasheight tool calculates the height of each above-ground point. It triangulates the ground points into a TIN and calculates the elevation of each point with respect to this TIN. The resulting heights are scaled with a factor of 10.0, quantized into an unsigned interval between 0 and 255, and stored in the “user data” field of each point. Next, the lasclassify tool scans the point cloud, identifying points that are at least 2 m above the ground. These points are associated with roofs and arboreal vegetation and will be segmented into sets of points belonging to homogeneous structures (regions). By comparing the heights of such points, the algorithm then identifies flat regions, which relate to roofs, and rough regions, which normally correspond to trees. 54
TLS data were obtained using the FARO® FOCUS 3D 120 platform. It is a portable laser scanner that performs measurements in a quick, simple, and accurate way. It offers linear accuracies of ±4 mm and angular accuracy of ±0.009°, 300° vertical and 360° horizontal field of view with a 97 Hz scan speed, capable of capturing objects in a range of 0.6 m–120 m. As it is phase-based, it is characterized by a high measurement speed, at a maximum of 976,000 pps. 56
To obtain data from all the building facades, 21 scanning stations were needed (Figure 4). The uneven terrain and the presence of several trees around the building were extra challenges for finding an appropriate positioning for the platform as well as ensuring the overlap between the scans, necessary for the data processing step. To allow the registration of point clouds from each scan, five chessboards and five flat spheres were used as artificial targets (with heights ranging from 0.5 to 1.5 m), which were carefully distributed to be repeatedly covered by two or more scans and without occlusions to ensure high precision during the data acquisition process.57-59 Scanning positions during data acquisition.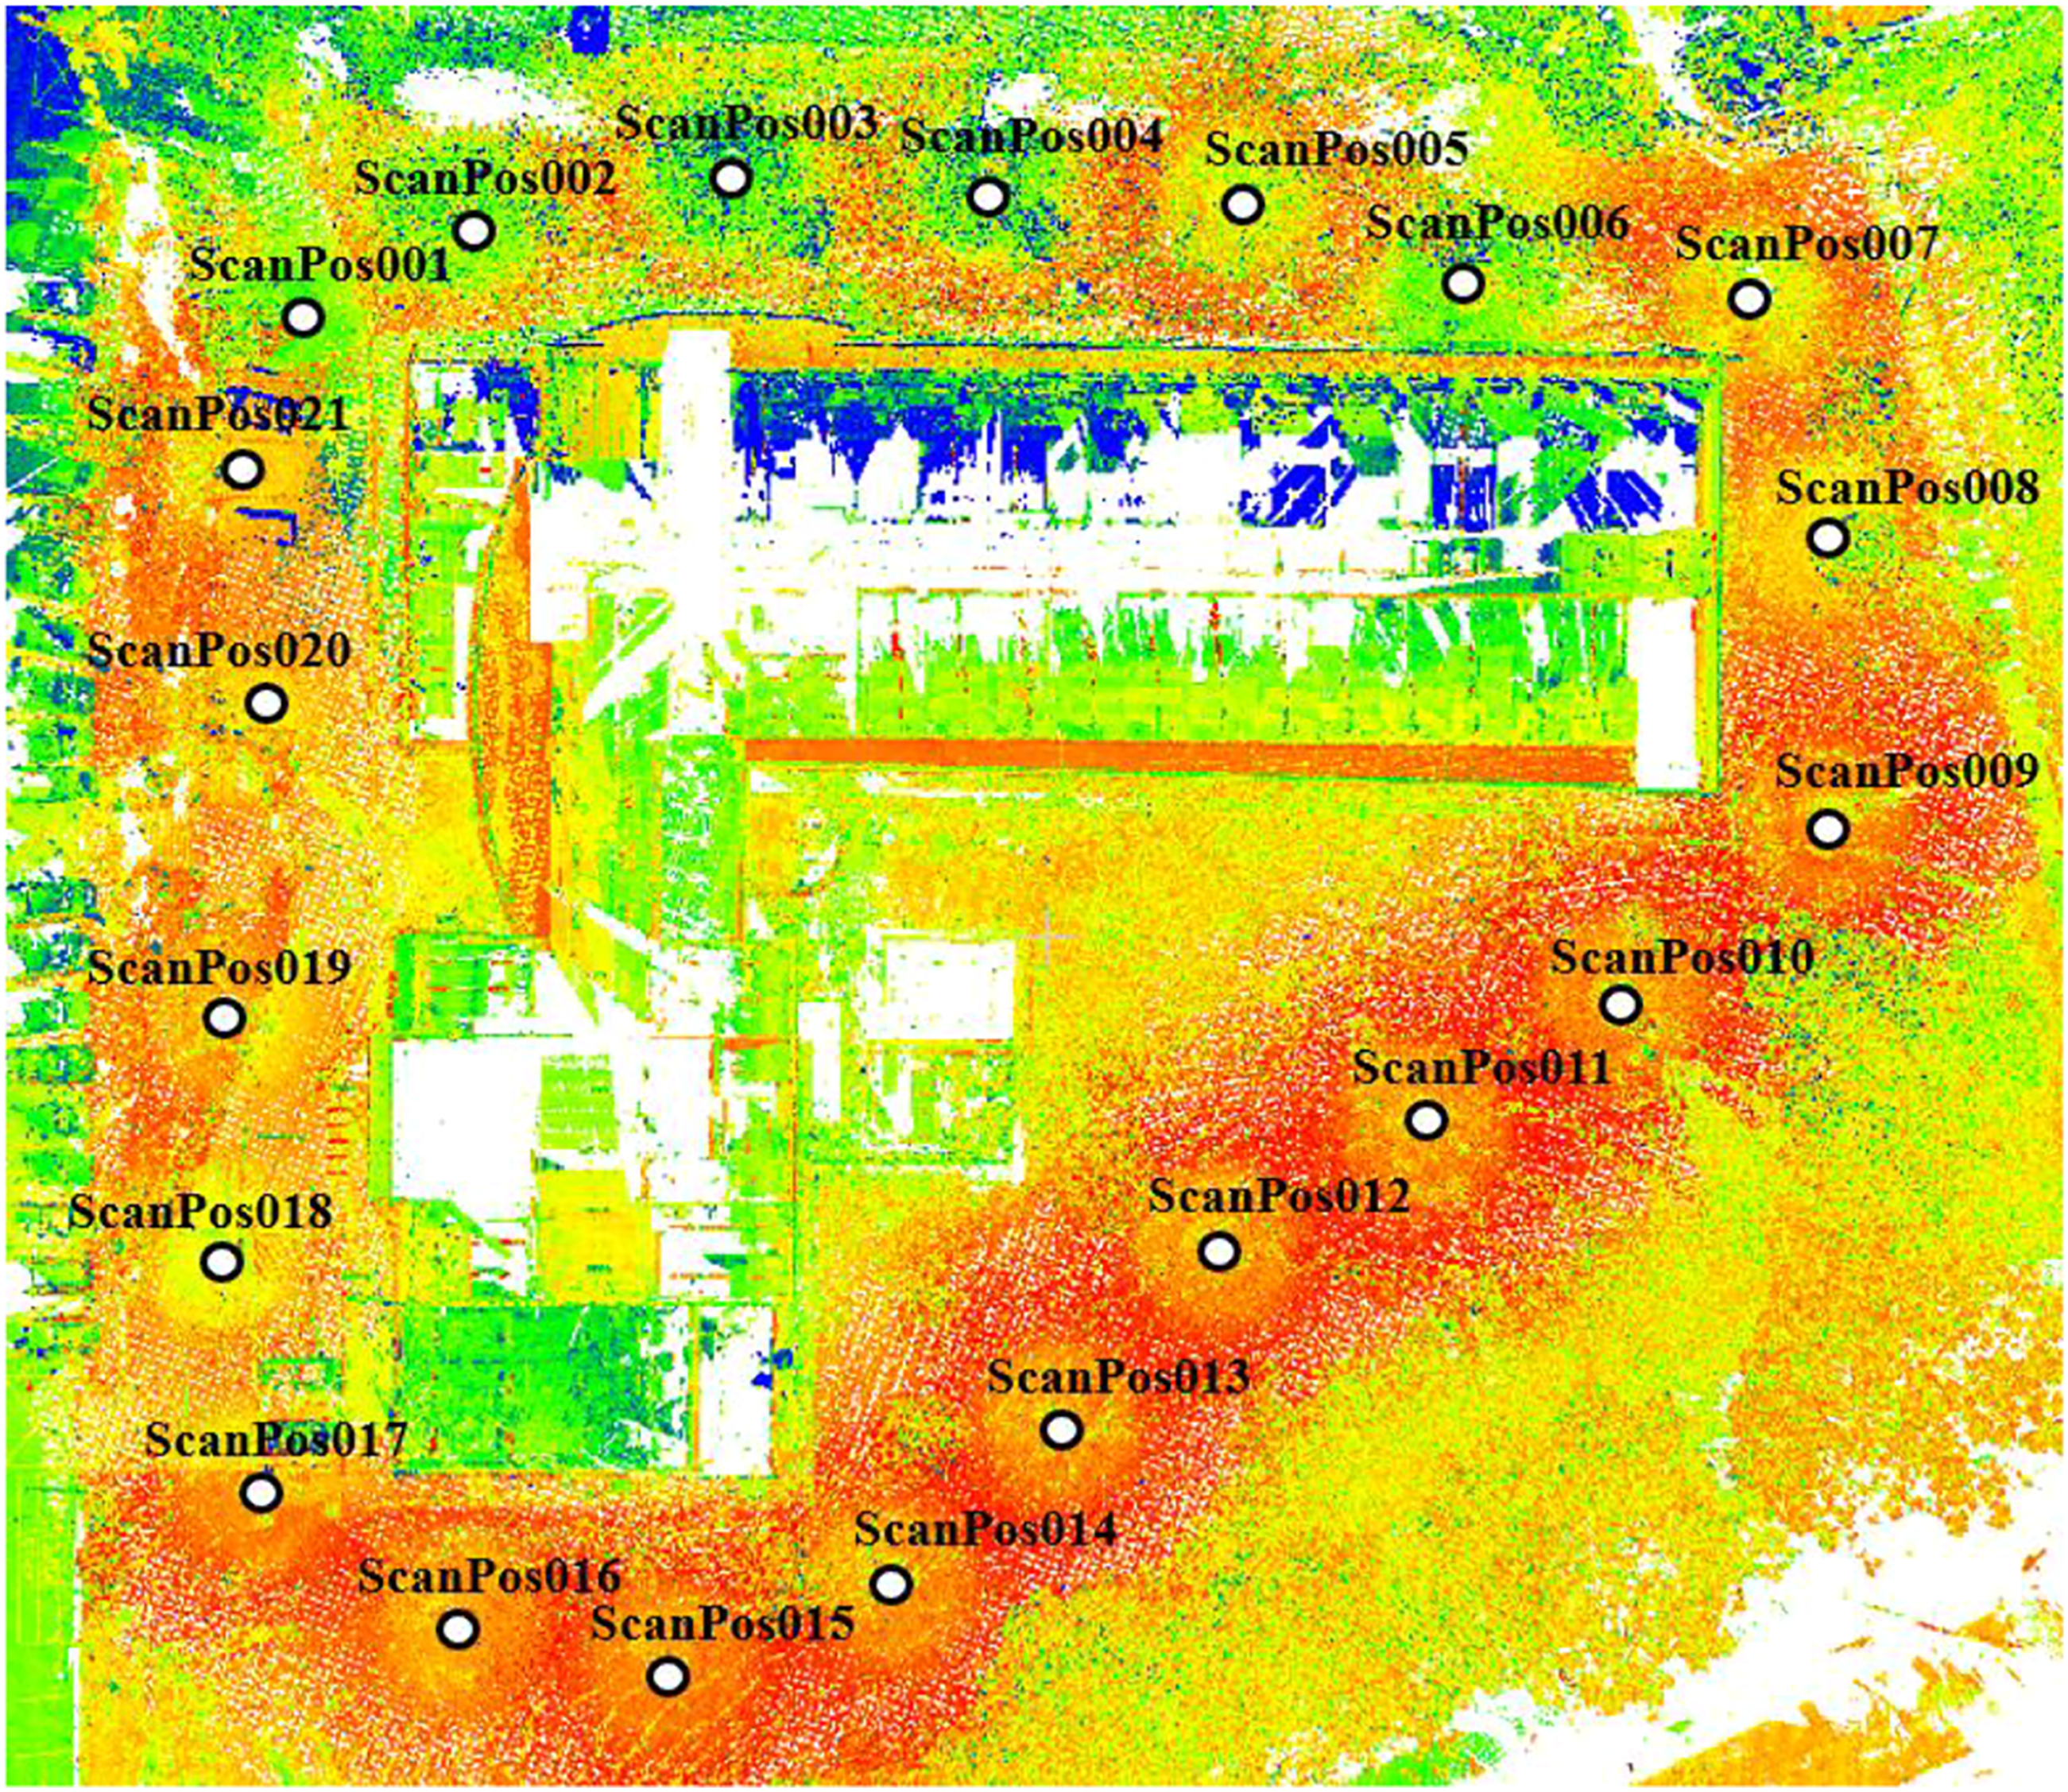
According to Lachat et al.,
60
the processing of TLS data and the construction of a single 3D point cloud consists in the application of a three-dimensional similarity transformation, which is also called a 3D conformal coordinate transformation. This transformation is applied to the 3D coordinates of one or several point clouds in order to transform them into a reference coordinate system. Depending on the presence of a single scale factor observed in all scanning directions, a similarity transformation model containing six or seven input parameters is used. The remaining parameters are the three rotation angles (x, y, and z) and a three-component translation vector. Thus, considering a point i observed from two systems A and B, the general formulation for such a transformation is:

Data integration
Integration allows one to gather data from different sources, so as to obtain better results and overcome limitations of each platform. Through ALS it is possible to obtain data from roofs, but not always from facades, something that can be complemented by TLS, and vice versa. In this way, it is possible to integrate them, providing complementarity in areas not properly represented, due, for instance, to surveys limitations of technical, environmental, or natural order. Therefore, data integration allows a complete and highly accurate three-dimensional modeling of targets of interest, such as buildings.31,36
The integration process basically consists in registering and combining point clouds. In the present work, this procedure was performed using the ICP method, developed by Besl and Mckay.
37
The method uses a two-step iterative process: (a) identification of nearby points and (b) rigid transformation. The ICP uses Horn’s method
61
to find the relationships between two coordinate systems from pairs of corresponding points. In this method, the origin of the coordinate system for each point cloud is transferred to its centroid. The realization of this displacement allows the method to be carried out in two steps, the first of which is the calculation of rotations using quaternions, followed by the calculation of the translation. According to Bradley and Sandifer,
62
quaternion (q) refers to an extension of the set of complex numbers. A quaternion is the quotient of two lines in three-dimensional space or, equivalently, the quotient of two vectors. Quaternions are generally represented according to equation (2).

ICP applies Horn’s method iteratively on pairs of pseudo conjugate points. Converging requires good initial alignment and a high percentage of overlap between point clouds. A point cloud is considered as a reference (b), and the rotation and translation parameters are calculated at each iteration, being applied to the target cloud (a). The algorithm processing steps are: 1. 2. 3. 4.
If the criterion is not met, the process is repeated from Step 2, after applying the parameters calculated in Step 3. Otherwise, the algorithm terminates its execution.

Geospatial 3D urban representation
The modeling of urban data, especially buildings, follows specific patterns for visualization purposes, and considers geometric, semantic, and topological aspects. 29 Geospatial technologies, such as LiDAR, own the ability to represent objects realistically and accurately, maintaining their essential aspects, and hence, are used in the context of BIM for the 3D reconstruction of buildings.
In order to standardize file formats and quantify the detail levels of a virtual 3D urban model, the Open Geospatial Consortium (OGC) created the CityGML (Geography Markup Language) standard for establishing entities, attributes, and relationships in 3D urban models. In this context, within the City class, with regard to building modeling, the specified standard is the LoD in which each object has a specific 3D representation. 32 In a CityGML dataset, the same object can be simultaneously represented in different LoDs, which makes it possible to analyze and visualize the same object in different degrees of resolution. Furthermore, two datasets containing the same object in different LoDs can be combined and integrated. 63
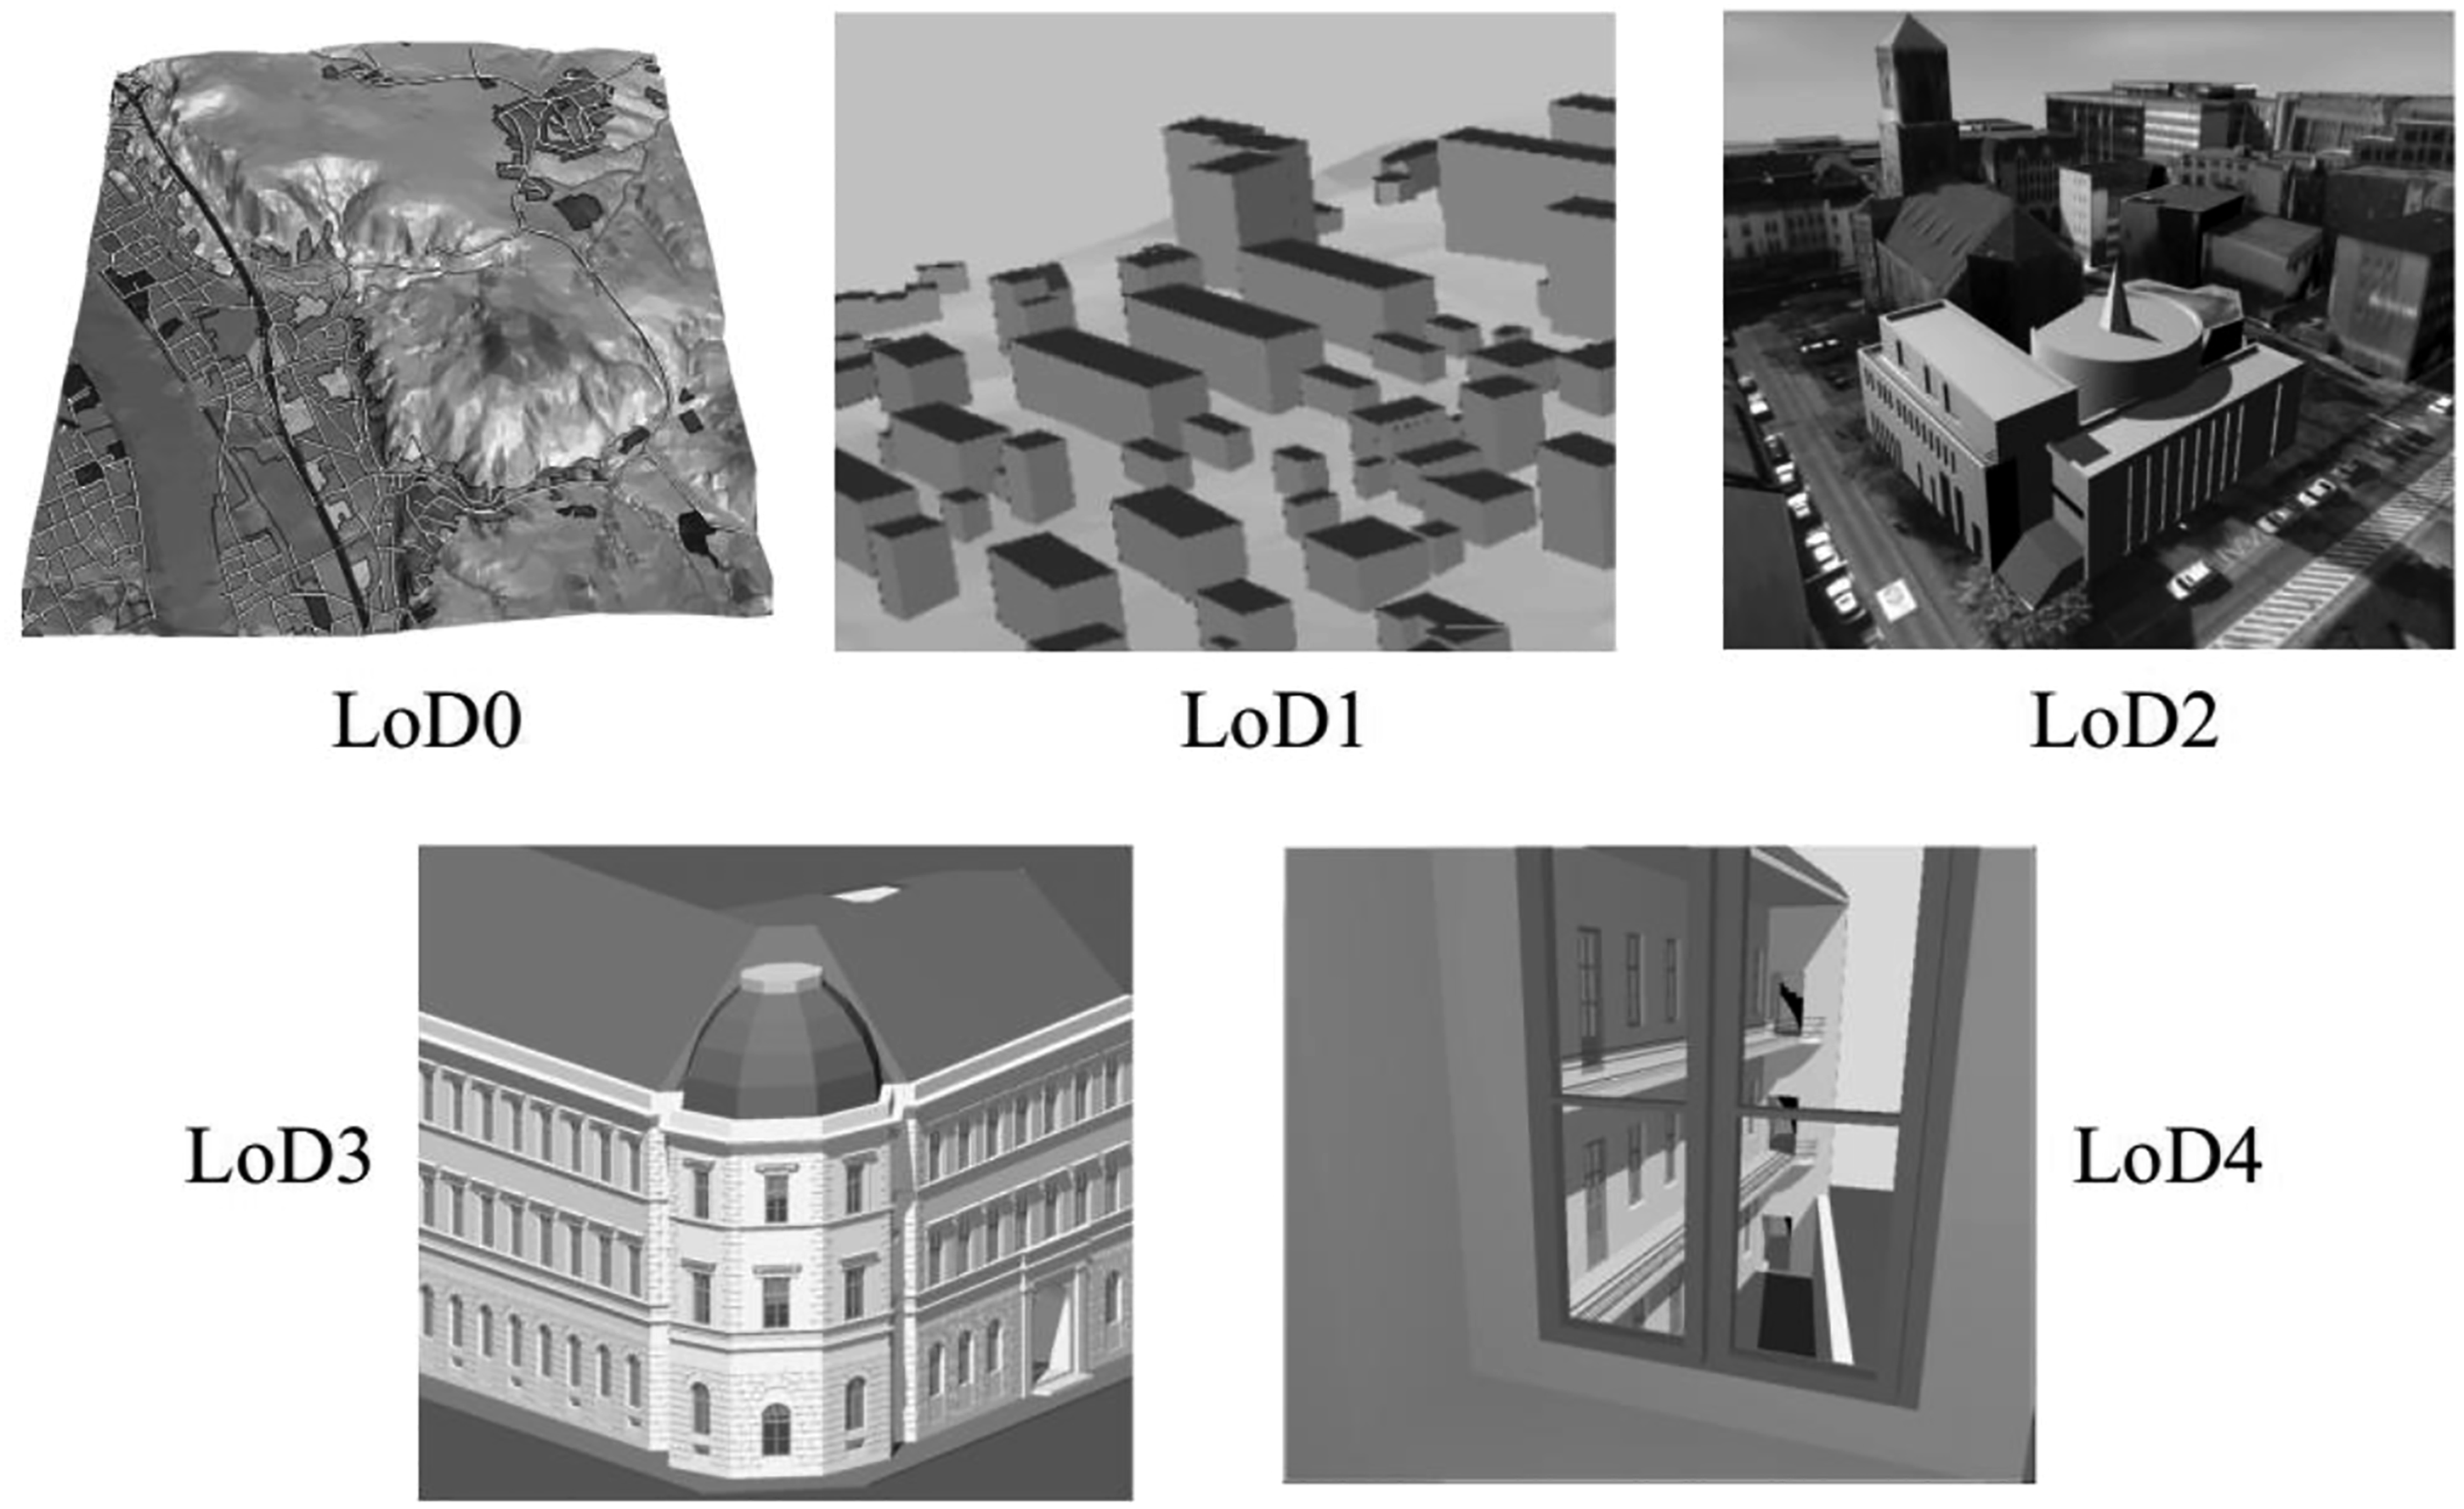
The CityGML comprises five LoDs (Figure 5), which are very similar to the ones established by the U.S. GSA and formerly explained. LoD0 is the coarsest level, being essentially a two-dimensional Digital Terrain Model, serving as the basis for an aerial image or a map. LoD1 is known as a block model, with no roof structure or texture. A building in LoD2 has different roof structures and textures. In LoD3 high resolution textures can be mapped, and this level represents architectural models with detailed structures of walls and roofs, balconies, spans, and projections. Furthermore, detailed vegetation and transport infrastructure are components of a LoD3 model. Finally, LoD4 completes a LoD3 model by adding internal structures such as rooms, internal doors, stairs, and furniture.
63
Five LoDs as defined by CityGML. Source.
63
LoDs are used as an information base in construction projects. In this context, they can be inserted in BIM models, collaborating with the virtualization, modeling, and management of activities inherent to the design/construction of engineering works. BIM models become much closer to the real work with the virtualization of elements, easing the identification of possible inconsistencies—design errors and overlays. One of the recurrent errors of infrastructure demands, such as adaptation works, renovations, or new projects, is to rely on outdated or incomplete information. One of the solutions for this is the use of BIM technology based on a 3D point cloud, called as-is BIM. As-is models have been used to nominate the survey of the current state of a building, executed with a laser scan and carried out long after its construction. 64
The as-is BIM of the Occupational Therapy Building was performed using Autodesk® Revit 2021 software,
65
which has optimized tools for modeling based on three-dimensional point clouds. The procedure was entirely based on the point cloud, which was imported into Revit. The project levels were then created, and defined by the floors, platbands, and water tank (Figure 6). Then, the modeling was executed level by level, and it started with the ground floor, the largest of them. The delimitation of walls, beams, doors, windows, and windowpanes was determined and located by means of the point cloud. In this procedure, missing areas in the point cloud were not modeled, leading to gaps in the resulting model. Creating levels in Revit.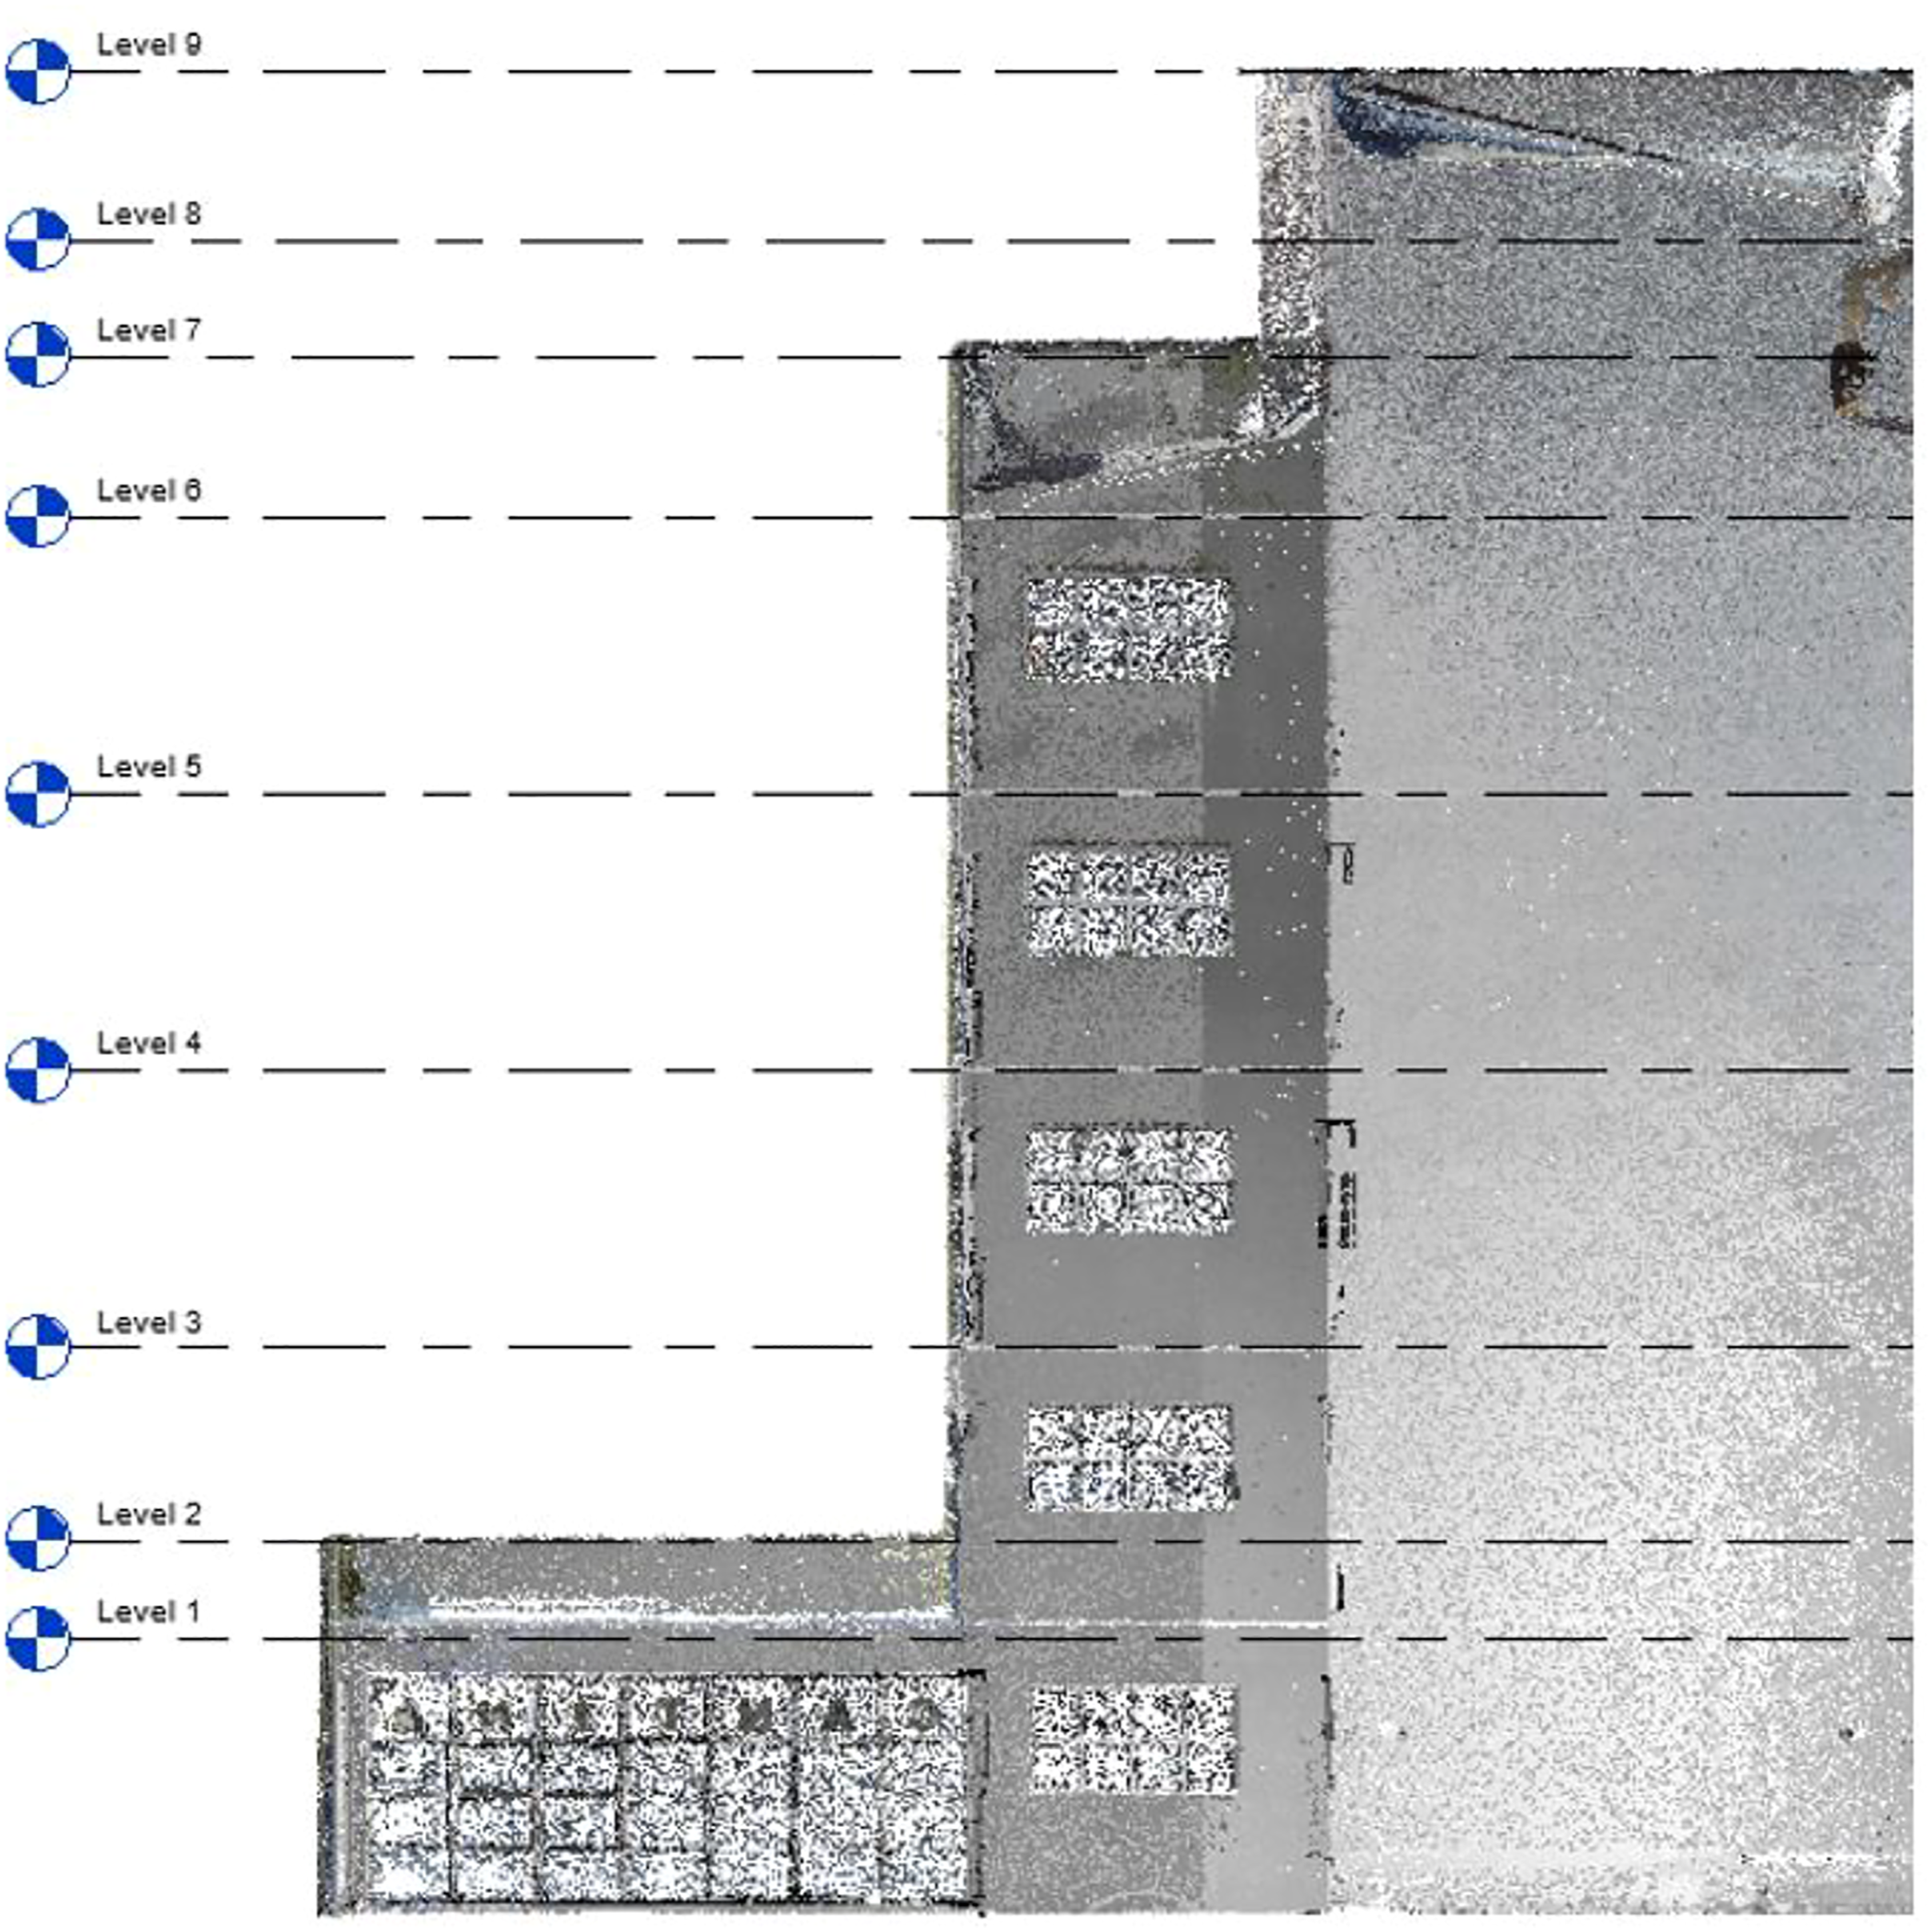
Evaluation of results
Accuracy assessment of the point cloud
The accuracy was evaluated by comparing the field measurements, executed by means of an Electronic Distance Measurement (EDM) device, with those presented by the LiDAR point cloud model. Measurements were taken of various elements of the building using a Leica DISTO™ Classic laser distance meter (Figure 7(a)). An alternative highly accurate option to a laser meter would be a total station, but as reported by,
41
there are no significant statistical differences between a laser meter and a total station for extracting measurements in civil infrastructure. The accuracy of the LEICA laser meter was verified through calibrations conducted at the Mechanical Metrology Laboratory belonging to the Integration and Testing Laboratory (LIT) of the National Institute for Space Research (INPE). Verification was performed on several calibration ranges. In the range of 500 mm to 2000 mm, a collection of scale bars from the Brunson coordinate measuring system was used. Above this range, up to 50,000 mm, a comparison of predefined distances was carried out using a conventional tape measure at LIT. The adopted method was based on dimensional calibration procedures. Five series of measurements were realized at each calibration point, with the average value being informed. In the first three series, the repeatability of the laser distance meter was analyzed. The setup was reassembled by changing the zero point (reference), and two more series were accomplished to analyze the reproducibility of the laser distance meter (Figure 7(b)). Leica DISTO classic laser distance meter: (a) Being used to take measurements in the studied building and (b) together with a scale bar in one of the calibration tests at the Mechanical Metrology Laboratory.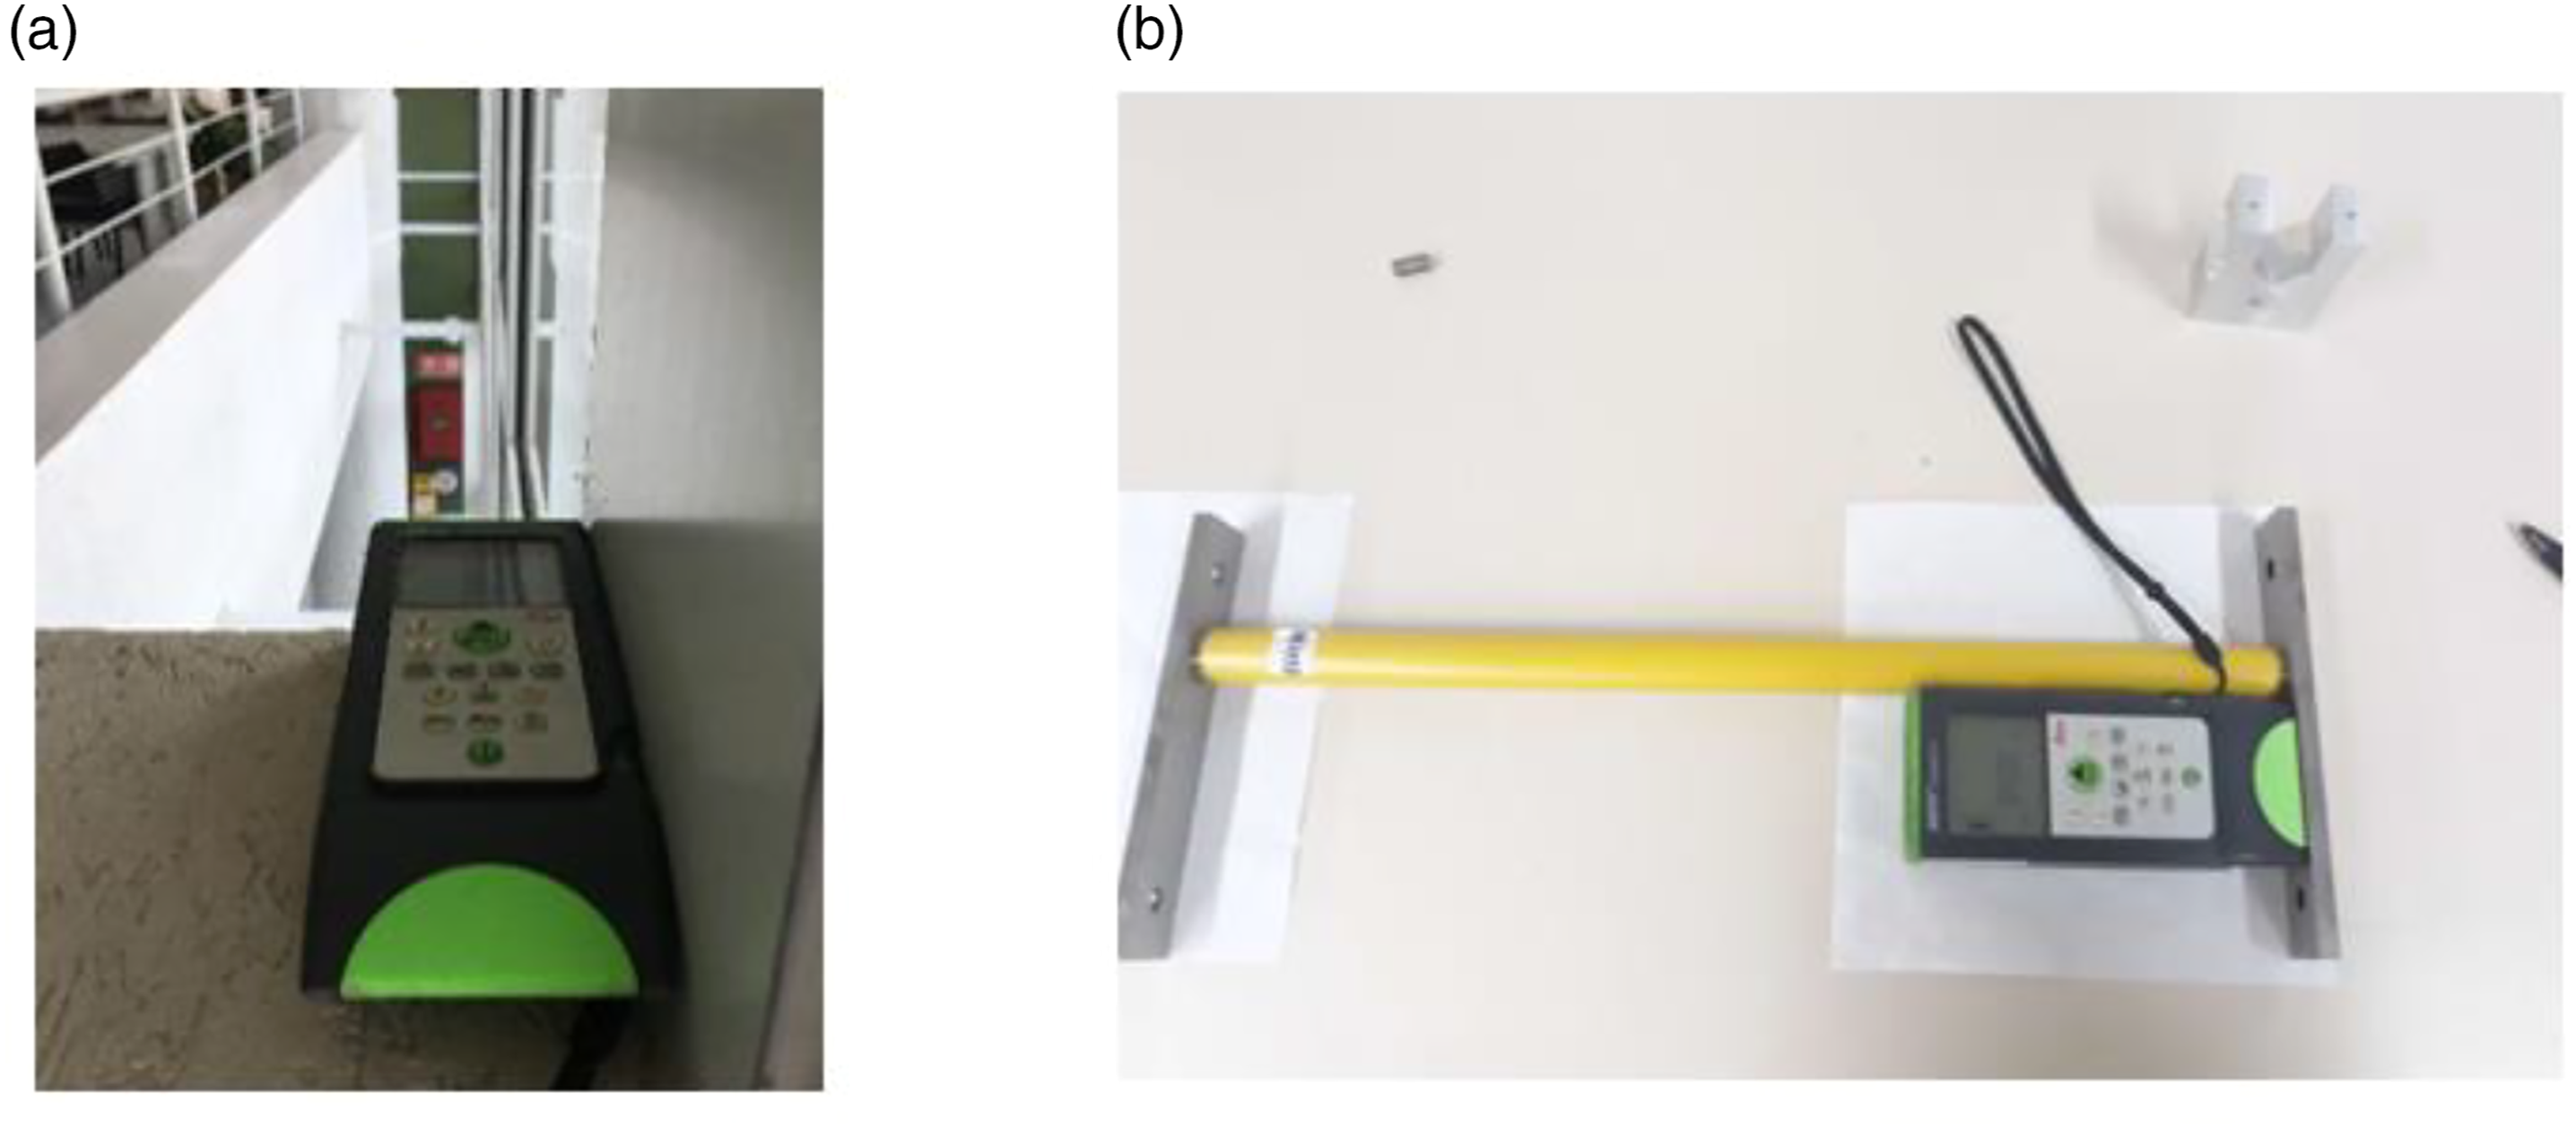
Obtaining the building’s geometric information required a significant number of measurements. Initially, a plan was conceived to identify possible candidate areas for field measurements in the point cloud, and this procedure was executed in Cloud Compare. Facade elements that were well represented in the point cloud were prioritized, so that their dimensions could be verified with the Point Picking tool. In addition, areas that presented different length ranges were selected to be able to represent the building’s geometry (Figure 8). Representative elements of the facade were bathroom and living room windows, windowpanes, and walls of various sizes. To better represent the geometry of the building, the widths and heights of these elements were measured at various points on the facades. Detail of the elements selected for measurement. (a) Bathroom window. (b) Room window. (c) Wall. (d) Windowpane.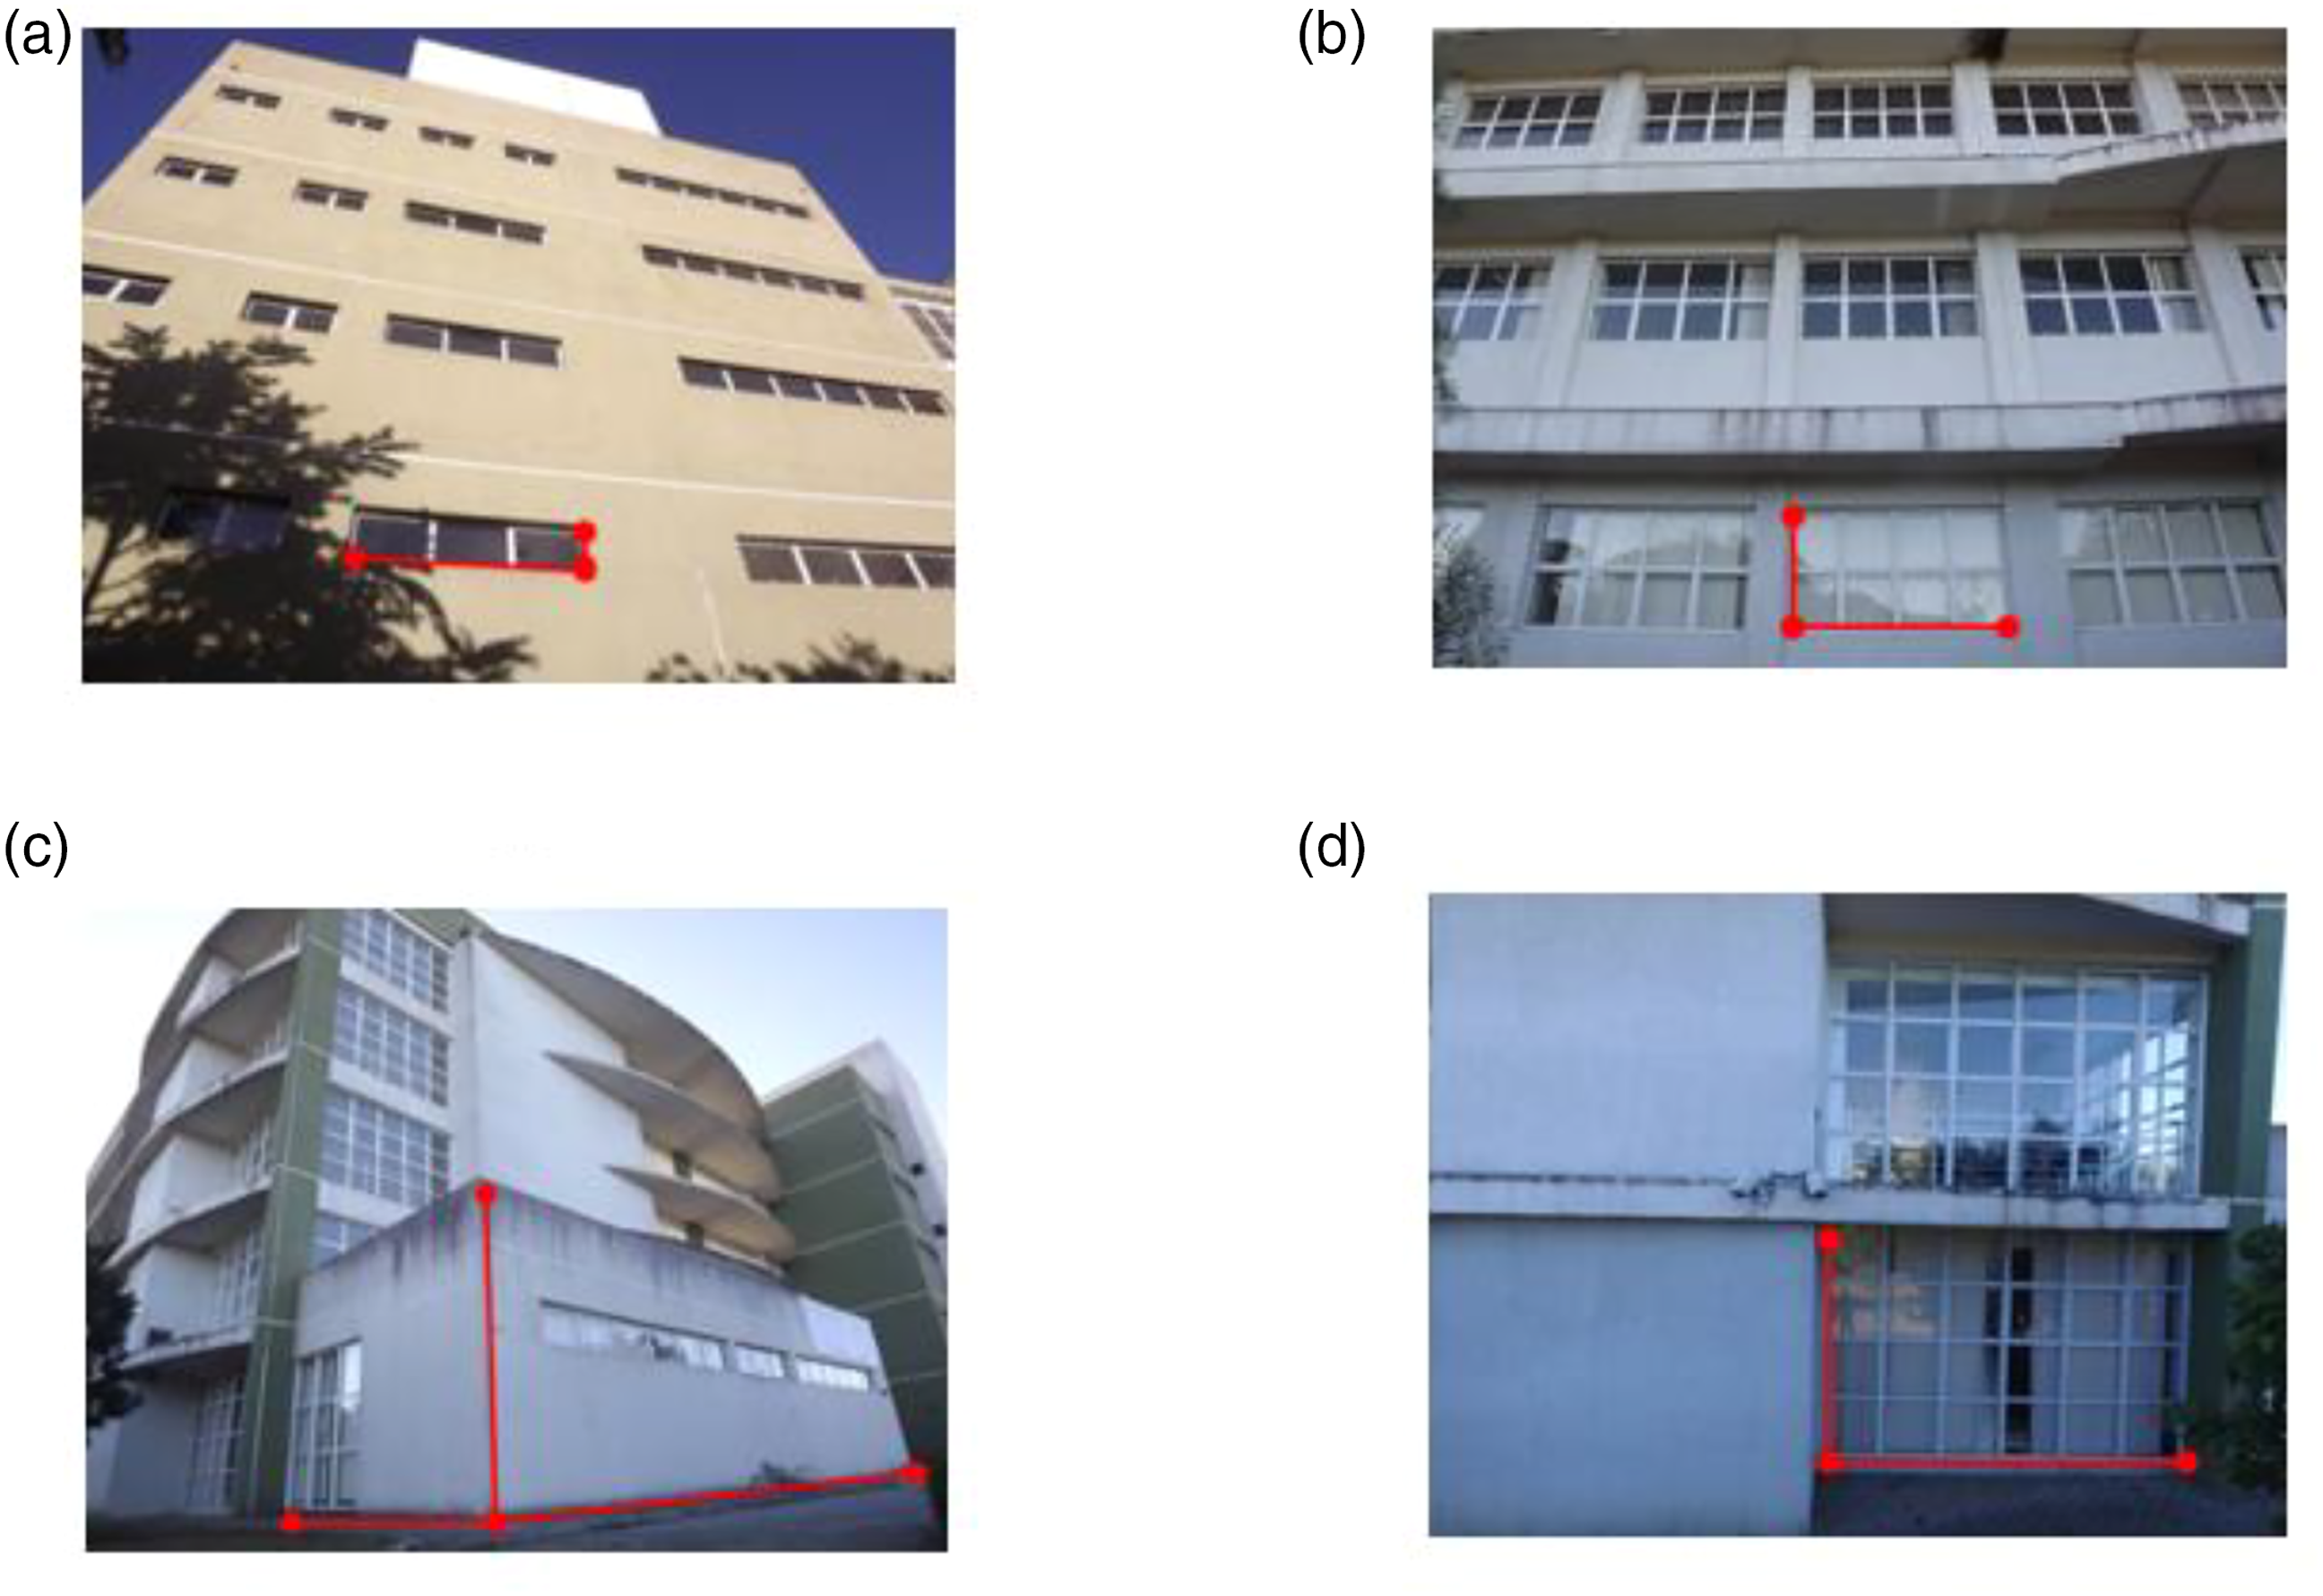
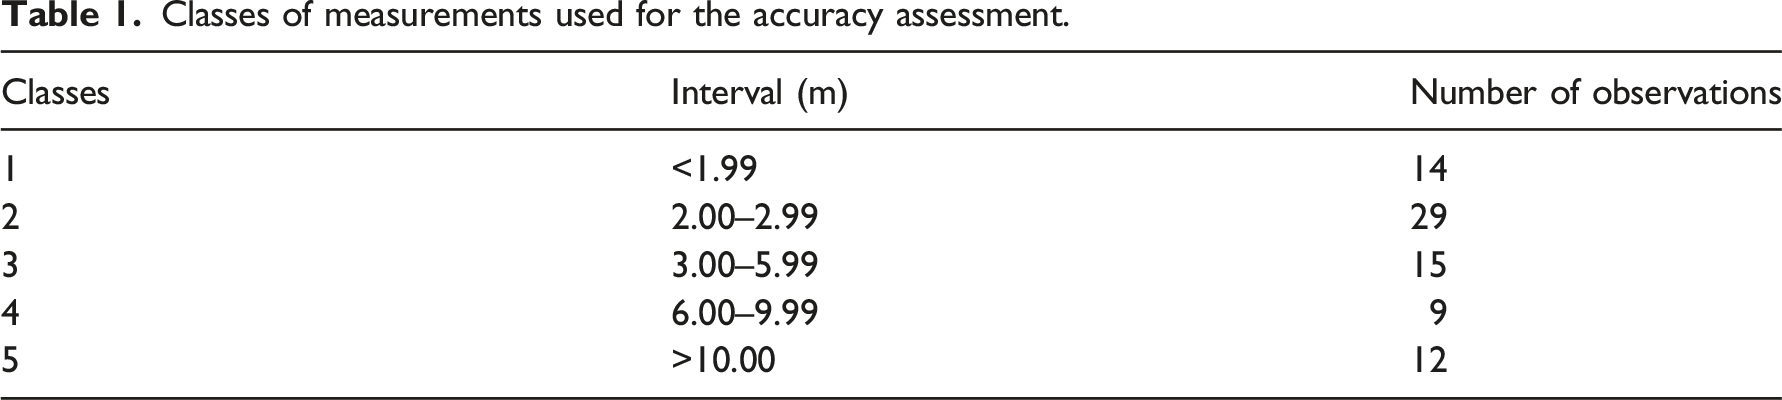
Classes of measurements used for the accuracy assessment.
The accuracy verification procedures were based on reference data.
1
The dimensions obtained by EDM, which were regarded as ground truth, were then used to verify the corresponding dimensions extracted from the ALS-TLS integrated model. First, the absolute error was calculated, which corresponds to the modulus of the difference between the EDM-based measure and the corresponding one obtained from the model. The percentage relative errors were then reckoned from equation (4).69,70
To analyze the variation of the dimensions observed in the models in relation to the EDM dimensions, the Root of the Mean Squared Error (RMSE) was calculated. This analysis is considered a standard measure of estimated accuracy in models, capable of indicating the magnitude of the error, and thus, indicating the fitness of the data. The RMSE was considered as the accuracy of the model
71
and is calculated according to equation (5).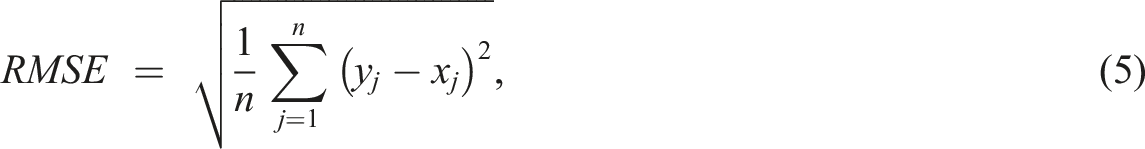
The agreement analysis between the EDM dimensions and the point cloud model was verified through simple linear correlation. This concept of descriptive statistics aims at measuring the degree of relationship between two variables by describing it through a regression equation. The mathematical equation describes the relationship between the independent EDM dimensions and the dependent dimensions of the model. The degree of linear relationship between variables is measured by Pearson’s coefficient of determination, known as R2. This coefficient represents the proportion of the variation in the dependent variable that is explained by the variation in the independent variable. R2 is commonly used to determine if the model fits the data well. Its value ranges from 0 to 1 and the higher the value, the better the model’s fit. 72
Deviation analysis
The accuracy of the as-is BIM modeling was evaluated by analyzing deviations from the LiDAR point cloud model. For this task, the Cloud-to-Cloud (C2C) method is the most commonly used. This method calculates the nearest neighbor distance between the reference cloud or mesh and the compared cloud. For each point in the compared cloud, its nearest neighbor in the reference is searched, and its Euclidean distance is calculated. 73
To find a better approximation of the actual distance to the reference surface, a local surface model is introduced. The objective is to locally model the surface of the reference cloud, fitting a mathematical primitive at the closest point and at several of its neighbors. The effectiveness of the local surface model is statistically dependent on sampling the points and on how appropriate the local surface approximation is. 74
According to Jafari,
75
the C2C algorithm implements the Hausdorff distance, which calculates the distances between the correspondence points. The Hausdorff distance from set A to set B is given according to equation (6). a = points of the set A; b = points of set B;
Results
Data integration
Photos of different faces of the Occupational Therapy Building and its LiDAR-derived 3D models.

In Figure 9, it is possible to observe the complete modeling, being presented on the southeast, northeast, northwest, and southwest faces. There is a reduction of points in the lower parts of the facade on the southwest face. The southeast face, on the other hand, has a lack of points in the lower and upper portions of the facade. And it became clear that the roof details were not modeled. Occupational Therapy Building represented with LiDAR point clouds. (a) Southeast face. (b) Northeast face. (c) Northwest face. (d) Southwest face.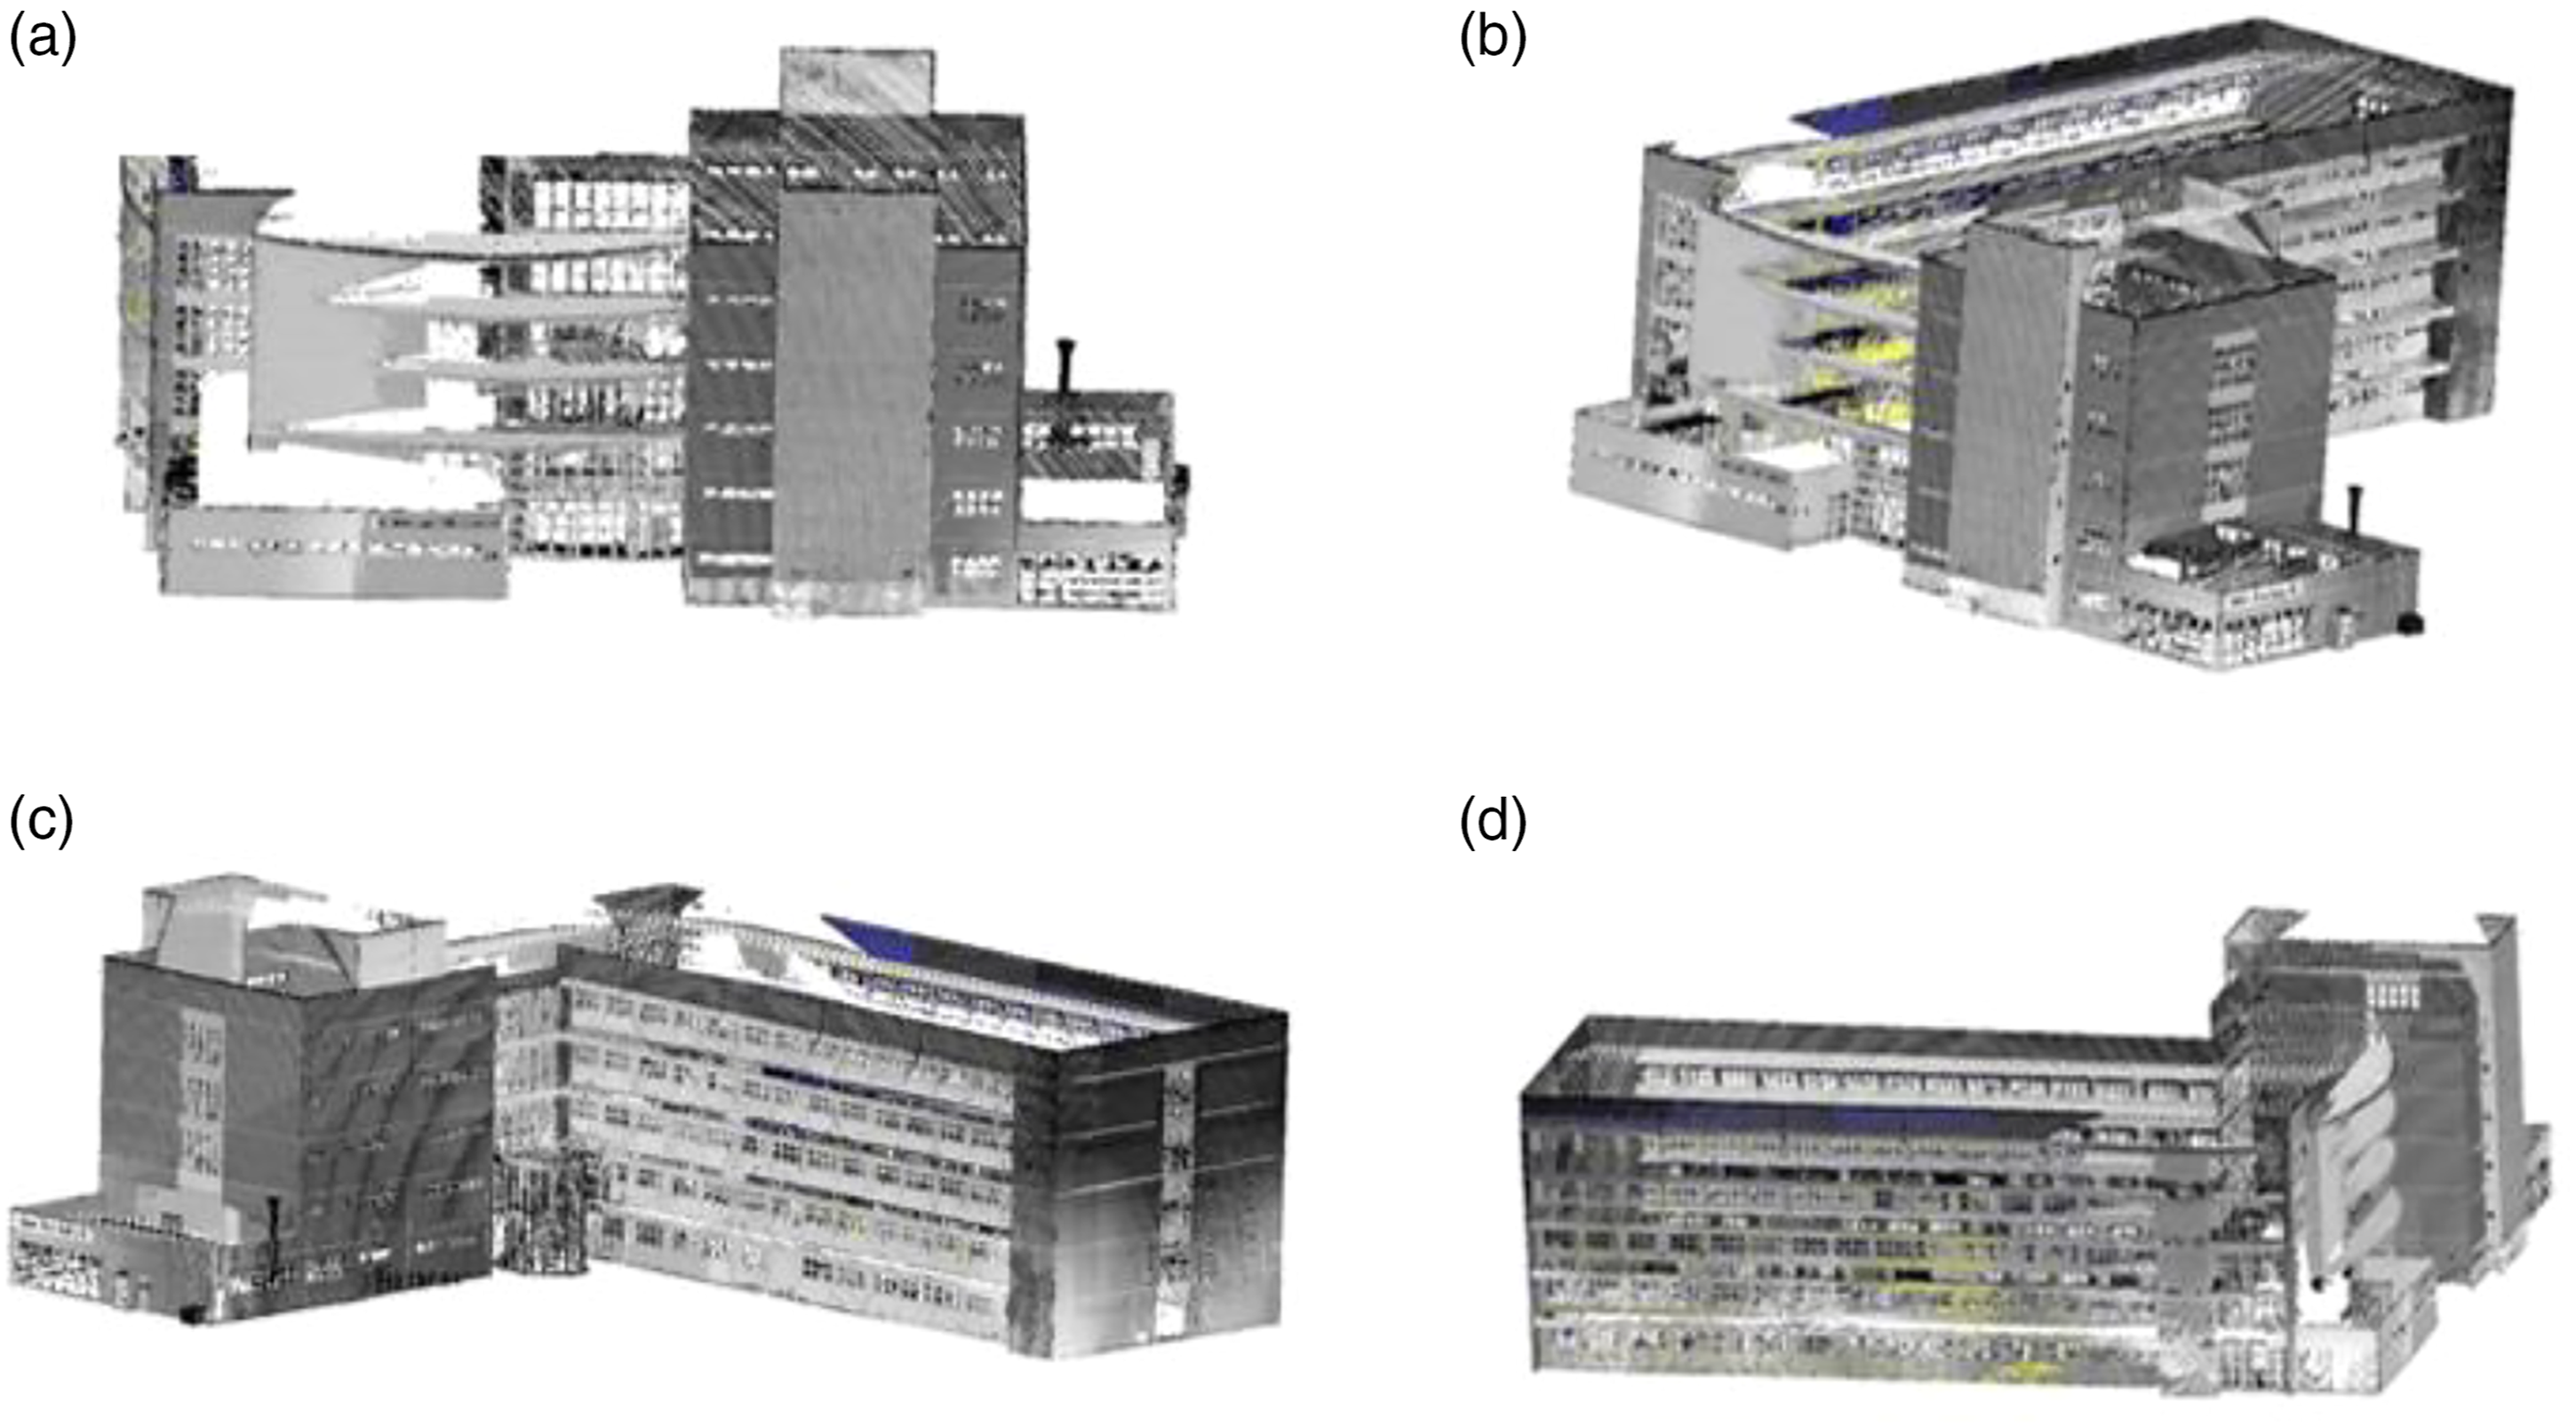
As-is BIM model
From the Lidar 3D point cloud, it was possible to produce a realistic as-is BIM model of the Occupational Therapy Building (Figure 10). The modeling was able to meet the requirements of LoD3 by representing doors, windows, glazed areas, setbacks (recessed facades), openings, and structural details, such as pillars and advanced slabs of the facades. Thus, as-is BIM is an important tool for understanding the current state of a building, consisting in a basic resource for any intervention work, such as expansion or renovation. As-is BIM of the Occupational Therapy Building. Ellipses highlight areas of data shortage/absence. (a) Southeast face. (b) Northeast face. (c) Northwest face. (d) Southwest face.
Due to obstructions to the laser pulses, the modeling presented some deficiencies highlighted by the ellipses in Figure 10(a) and (b). It is possible to see from the red ellipses that the modeling was compromised by the attached single-story blocks in the main and northeast facades, making it impossible to collect part of the data on the first and second floors of the building´s southeast and northeast faces. The advanced slabs present on the southeast and southwest faces hindered the modeling of the fourth floor and the platbands, highlighted in green in Figure 10(a) and (d). The ellipses in blue in Figure 10(b)–(d) indicate poorly modeled areas in the roof platbands and water tank, as a direct consequence of the building height, obstructions caused by the several platbands (with different heights) as well as the advanced slabs on the southwest face.
In sum, the attached single-story blocks prevented the TLS beam from reaching the walls adjacent to these blocks’ slabs. The low-density ALS point cloud made it impossible to model obstructed structures in the upper part of the building as well as to model the maintenance towers found on the roof and some areas beside the water tank.
Accuracy of the point cloud model
Figure 11(a) presents the real dimensions of the building obtained through EDM. Figure 11(b) shows the different heights of the building blocks. Their measurements were checked at several points from the top. Distance A corresponds to the height between the upper point of the tower containing the water tank and the ground and varies from 23.780 m to 23.890 m. This variation is due to the terrain unevenness and to differences in the platband height. The vertical distance B refers to the height extending from the main facade platband to the ground, varying between 20.208 m and 20.369 m in face of the same reasons exposed for Distance A. And Distance C relates to the height from the top of the platbands of the two single story attached blocks to the ground, measuring between 4.819 m and 4.925 m. Building dimensions: (a) Horizontal distances and (b) indications of vertical heights, both obtained by field measurements.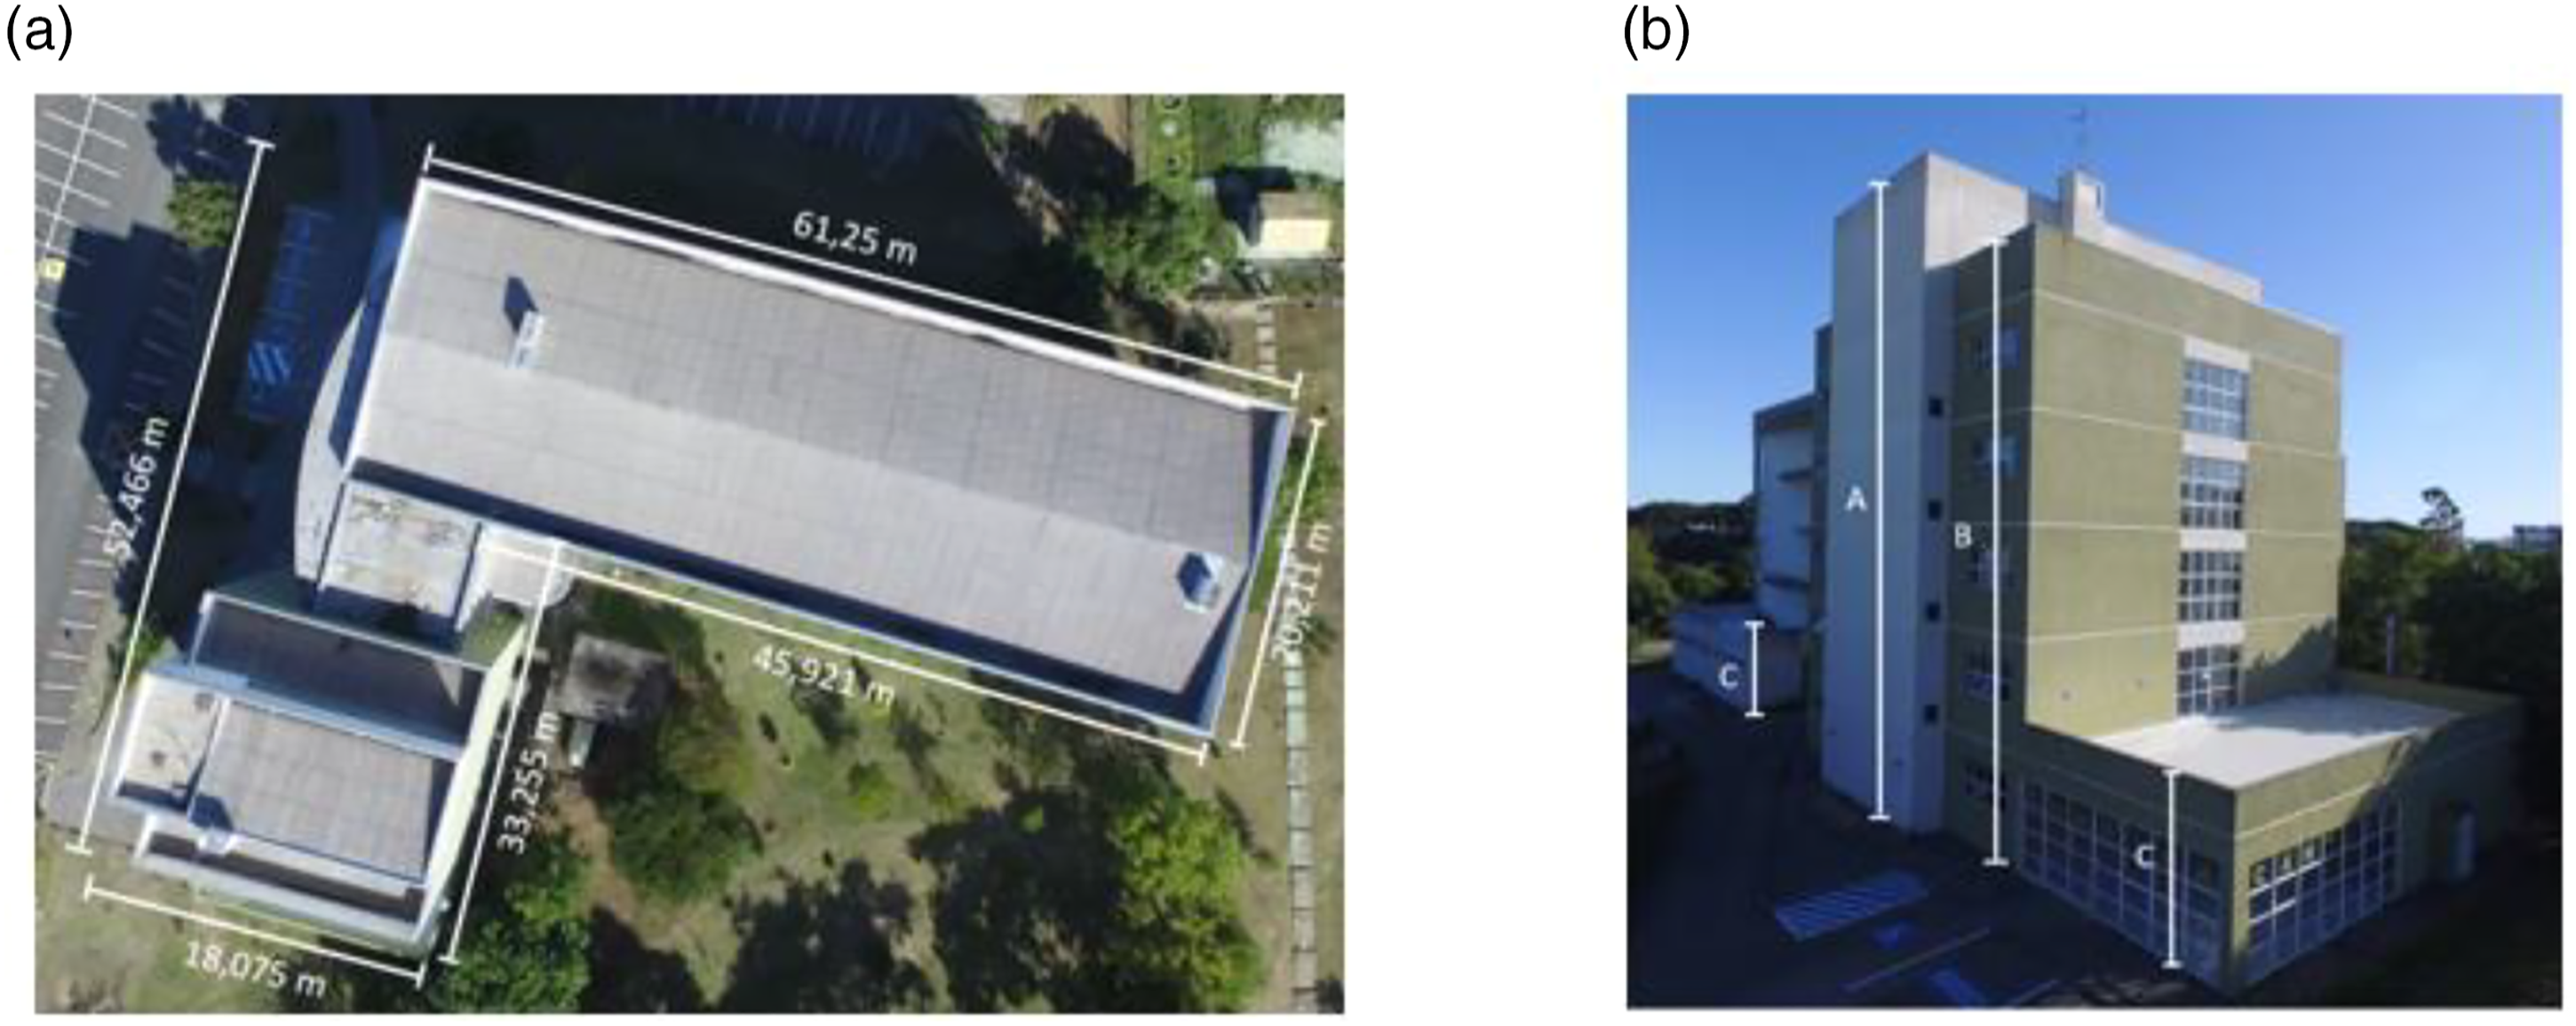
The dimensions obtained from the LiDAR point cloud were compared with the EDM dimensions obtained in the field. Actual dimensions by EDM ranged from 0.695 m to 23.82 m. The dimensions obtained in the point cloud ranged from 0.691 m to 23.922 m. The dimensions obtained were compared by classes, defined according to dimensions intervals as shown in Table 1.
Comparison between EDM and LiDAR dimensions by classes and in general: Maximum error, mean absolute and percentual error, mean standard deviation, and RMSE.

Dimensional agreement analysis was performed using simple linear regression. Figure 12 presents the scatter plot between the verified general dimensions: EDM x LiDAR. The graph presents the mathematical equation that describes the relationship between the dependent and independent dimensions, as well as the coefficient of determination R2. A significant level of agreement was found between the dimensions analyzed. In all relationships, the R2 was very close to 1, demonstrating a high correlation between the two data sets. It was found that the regression residuals are normally distributed with constant variance. Linear regression between general dimensions: EDM and LiDAR.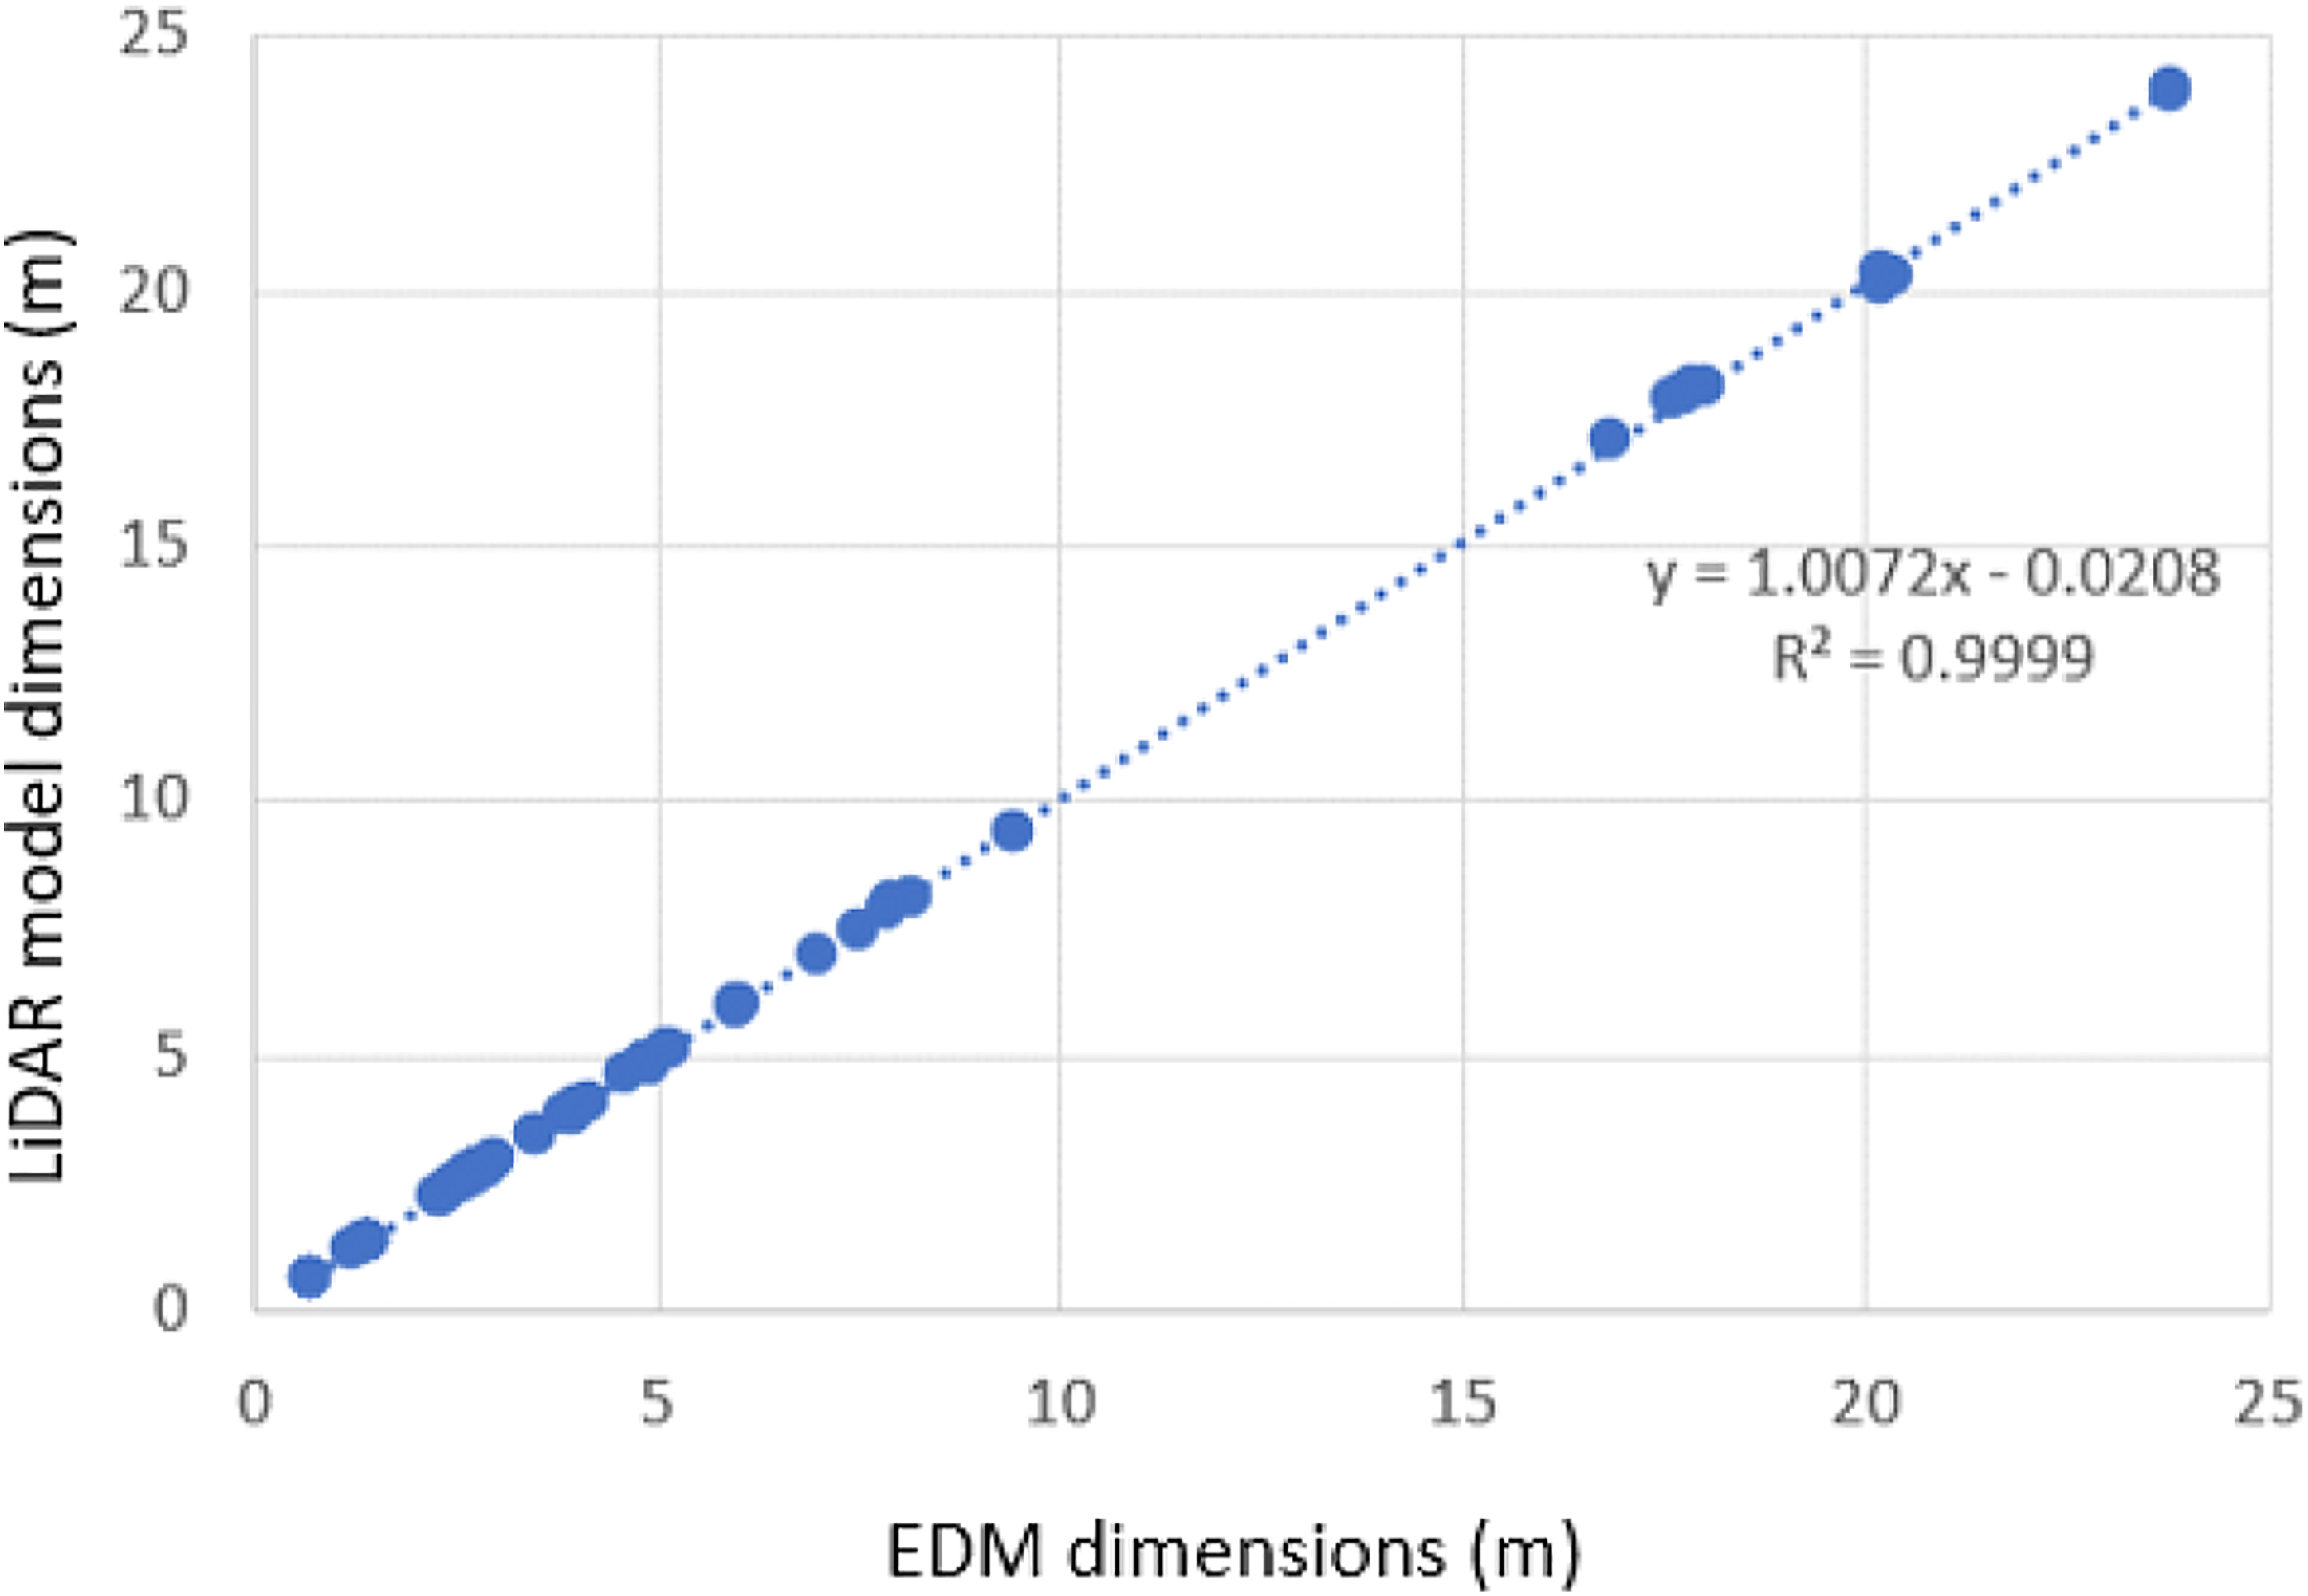
As-is BIM accuracy
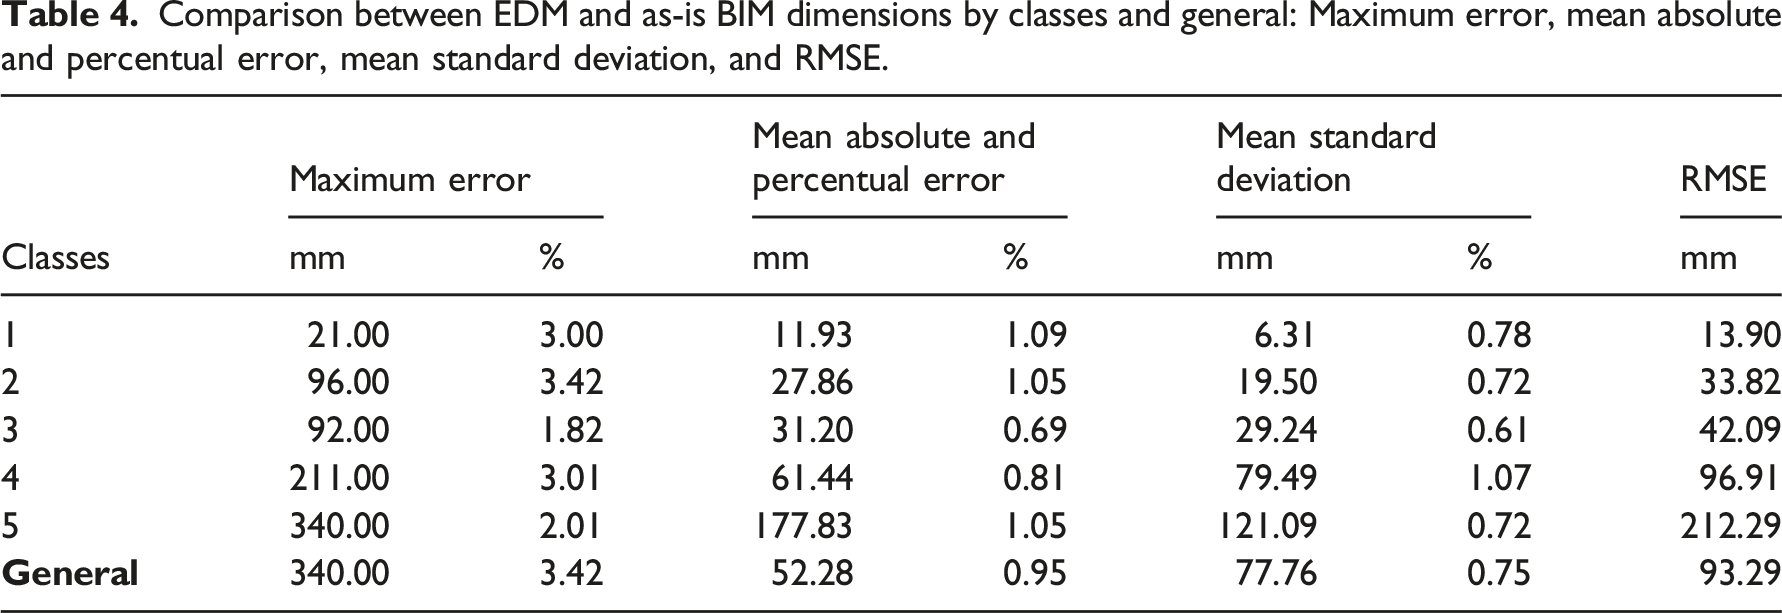
Comparison between EDM and as-is BIM dimensions by classes and general: Maximum error, mean absolute and percentual error, mean standard deviation, and RMSE.
As-is BIM precision
The precision of the as-is BIM model was assessed by means of a deviation analysis. This analysis was limited to an interval of 1 m, and the distance deviations were analyzed by means of a distribution histogram with mean and standard deviation and the spatial distribution of such displacements. The as-is BIM model has a mean distance of 137.6 mm and a standard deviation of 155.5 mm in relation to the point cloud model (Figure 13). Histogram and Gaussian function of as-is BIM model deviations.
The spatial distribution of distances deviations reveals that the greatest discrepancies are related to the areas of data shortage in the platbands and to the building internal structures. The latter ones, generated when the laser beam entered the building through the windowpanes, were not modelled in the as-is BIM model (Figure 14). It is also possible to verify that walls, windows, doors, and windowpanes present deviations within the general standard deviation of 155.5 mm, being mostly represented by the green and yellow colors. Distance deviation distribution of the as-is BIM model. (a) Southeast face. (b) Northeast face. (c) Northwest face. (d) Southwest face.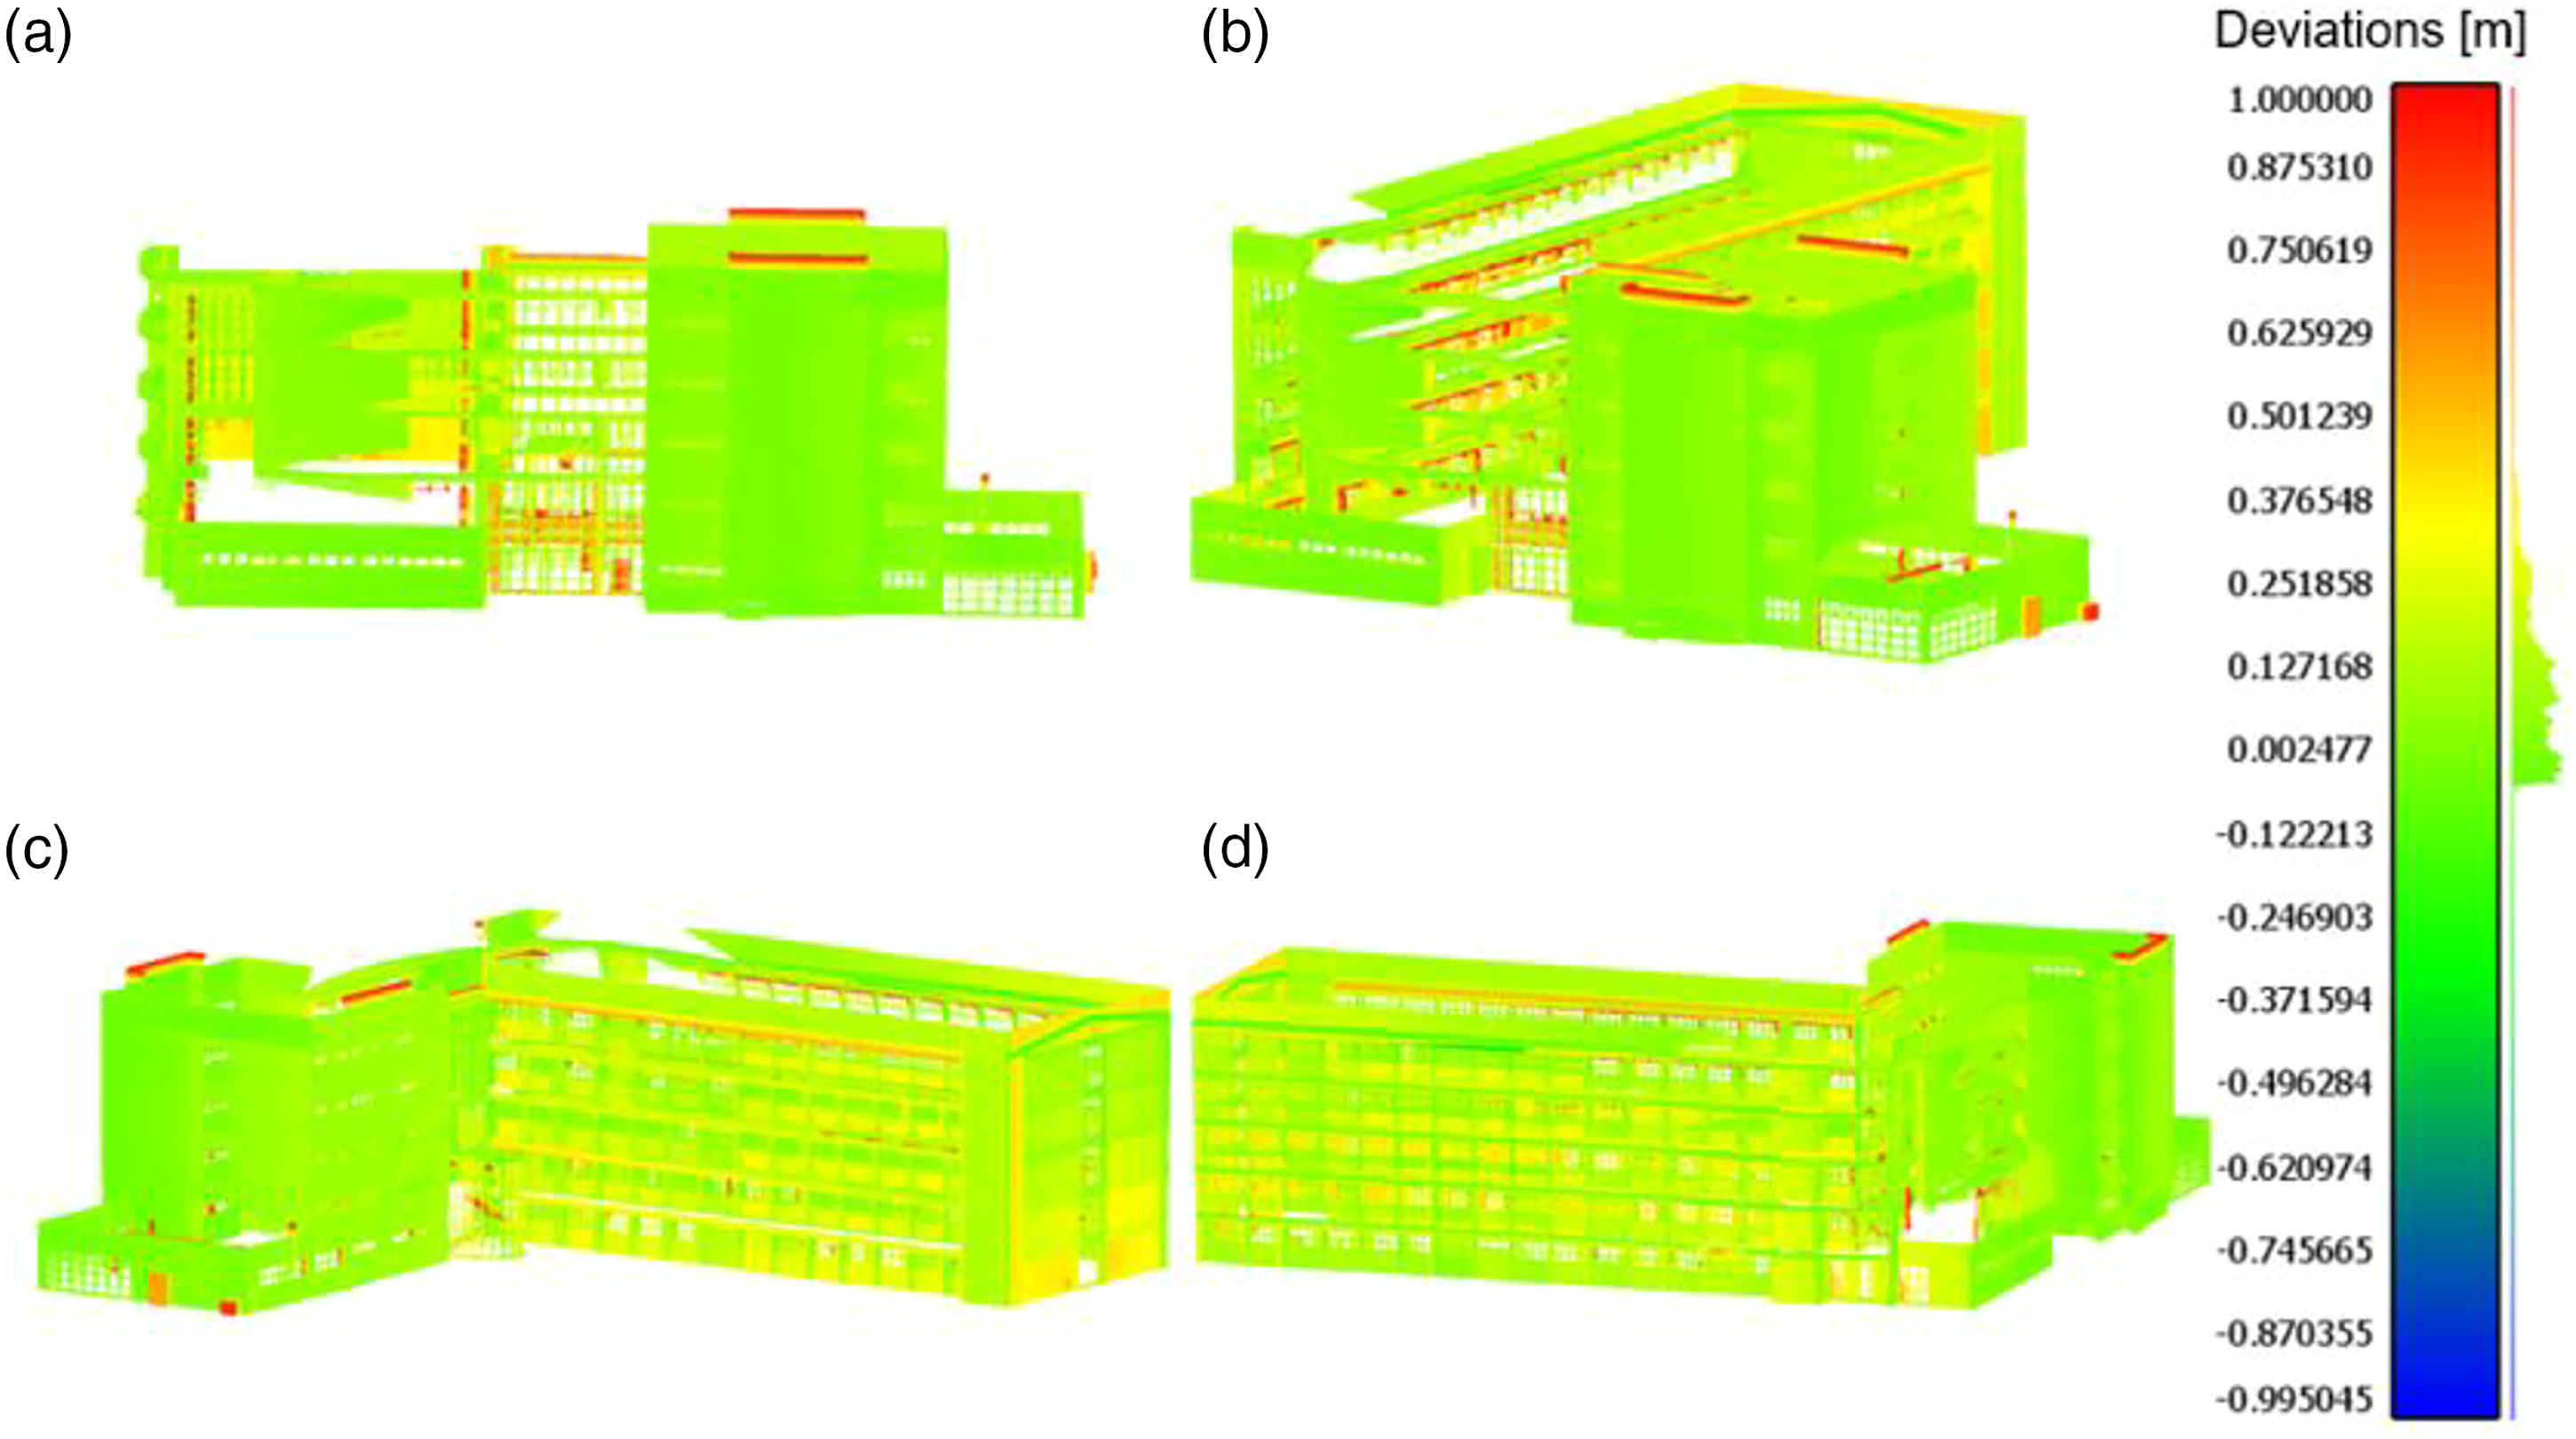
Discussion
Based on the obtained results, we ought to highlight the conditions of the TLS operation. The surroundings of the building represented a challenge for determining the scanning positions. The unevenness of the terrain on the southwestern face of the building and the proximity of the trees required careful planning for the assembly of the TLS, designed to maintain a sufficient overlapping of artificial targets. Due to these factors, most of the scanning took place very close to the building, what associated with its four-story height, platbands, and the presence of attached blocks on the ground floor led to obstructions to the laser beam, resulting in the shortage or even absence of data in the 3D point cloud. But despite being incomplete, it was possible to accomplish a three-dimensional model of the building, as it can be seen in Figure 9.
Reviewing point clouds registration methods offers great opportunities to achieve greater accuracy in data integration. Numerous publications address the topic describing, evaluating, and comparing the performance of various data registration approaches. It represents a strategic topic within the scope of using point clouds for manifold purposes. One of the simplest and most widely used algorithms is ICP. It is worth highlighting the possibility of evaluating the proposed variations in this algorithm, as explored by Zhu et al. 38 ALS and TLS data fusion is constrained by the fact that these data have different scanning perspectives and present low overlap, making the registration process difficult. In this case, it is worth mentioning the proposals for data registering optimization methods that use characteristics of the scanned objects by means of filtering, as in Pomerleau, 76 or the contour of constructions, as in Cheng et al. 39 Also, recent works aim at developing automatic methods of registering ALS and TLS data, such as the one proposed by Liang et al., 40 optimizing the alignment through the horizon context, identifying potential overlapping areas of ALS and TLS clouds.
The integration of LiDAR data made it possible to represent the studied building in a single cloud of 3D points with points referring both to the facades and roof. According to the BIM guide for 3D images, published by the GSA, 28 for an architectural design the error needs to be less than 13 mm. In this work, the LiDAR point cloud model presents average errors close to this threshold, especially in the smaller classes. These results corroborate the millimeter accuracy of the LiDAR data for building 3D reconstruction models, highlighted in the literature.21,30,32,35,39,70,77,78 Except for Class 5, which covers larger dimensions, the results are compatible with references70,78 that reached absolute errors between 5 mm and 30 mm. And, as expected, the herein obtained results are superior when compared to photogrammetric reconstructions of buildings, such as in Klein et al., 69 who obtained mean absolute error above 40 mm, or in Kim et al., 78 with absolute errors greater than 35 mm.
Since the as-is BIM model was constructed using the point cloud, all components were modeled using LiDAR data overlay. As some areas were not properly captured by the scanning, the modeling did not cover all parts of the building, as it can be seen in Figure 9. This lack of data resulted from the obstruction of the laser beam due to: (a) tripod of the TLS located close to the building due to the terrain unevenness on the southwest face; (b) presence of attached single story building blocks on the southeast and northeast faces; (c) existence of advanced slabs on the southwest and southeast faces; (d) low density of the ALS point cloud, making it impossible to register the platbands and roof details, such as the maintenance towers. To overcome these limitations, the use of data integration in the same type of acquisition platforms is encouraged. For example, integrating ALS with airborne photogrammetric data in order to tackle the data gap and model more structural details of buildings. Despite these limitations, it was possible to execute the as-is BIM model of the studied building.
The accuracy of the as-is BIM model was assessed by comparing the dimensions of the model with the EDM-based real dimensions of the building. Overall, the accuracy of the as-is BIM model was worse when compared to the accuracy of the point cloud model on which it was based. This finding was already expected, due to the subjectivity of the operator when performing the modeling in the software environment based on the three-dimensional point cloud. Considering the mean absolute errors, there was a worsening of around 20% in accuracy in Classes 1 and 2. In Classes 3 and 4, however, the worsening in accuracy was greater than 50%. Class 5, although presenting the lowest accuracy in both models, had a comparative reduction of 6.38% in the as-is BIM model. Considering all measurements, the decrease in accuracy was 18.84%.
A maximum precision tolerance is defined by the user at the beginning of the BIM process, and its verification is done in an iterative form, region by region, during the model execution. The discussion of this tolerance is to a less extent explored in the literature, as it involves complex continuous and iterative processes for the development of BIM models.
Through a comprehensive evaluation of the technology and methodology used in this work, some findings became evident: (a) the first one refers to operational limitations found in the surroundings of the building, such as trees and terrain unevenness; (b) the facades characteristics can obstruct the TLS laser beam, like the number of floors, setbacks, platbands, attached blocks on the ground floor, advanced slabs, and other decorative features; (c) the operator´s interference in recording EDM measurements can increase the subjectivity of field data; (d) the BIM execution is time-consuming, and even when semiautomatic plugins are adopted, an intensive manual operation is required. Despite the high resolution of LiDAR data, it was necessary to rely on photographs to identify building elements; (e) the data integration process from different platforms is highly dependent on the quality of the registration methods.
Considering the experience acquired with the accomplishment of this work, it is possible to list the following recommendations and directions for future work: 1. The integration of LiDAR and photogrammetric data from different perspectives, such as in the work developed by Wen et al.
77
should be further enhanced, so as to improve accuracy, in addition to allowing complete 3D modeling of buildings, that is, without gaps at LoD 3. 2. The limitation of ALS data due to a low-density point cloud encourages the development of automatic methods to detect and model roof details, such as the works developed by Kedzierski and Fryskowska
35
and Kurdi and Awrangjeb.
79
3. In spite of significant advances recently observed in the implementation of automatic methods for converting a point cloud into an as-is BIM model,80-86 the semantic and structural enrichment of all constructed elements is a future goal to be pursued and it still requires substantial efforts to achieve high rates of accuracy, thus effectively reducing the modeling time and the operator’s subjectivity.
Conclusions
This article presented the results of data integration from terrestrial and aerial platforms using LiDAR. The processing resulted in the creation of a 3D geometric model in the form of a point cloud. The model constituted the reference for the creation of an as-is BIM model at LoD3 of a building, targeted to provide documentation of its spatial characteristics in terms of its exterior design.
The operational conditions of TLS were challenging due to physical hindrances encountered in the building’s surroundings. However, the overlapping of scanning positions with the use of artificial targets, meant for registration, generated an appropriate cloud of facade points with reduced areas of no data. This operational constraint was not existent in the ALS scanning. However, this aerial survey was conducted with a low point density. Data integration proved to be very dependent on the process of registering TLS and ALS data. Hence, it is important to use advanced registration methods to cope with the eventual lack of overlap and difference in perspectives of such data. Even with limitations, data integration proved to be efficient as it enabled the creation of a complete 3D model of the building, being the basis for the as-is BIM process at LoD3.
The results demonstrate that there is a correspondence between the real measurements of the building and those obtained from the models. We attained a sound statistical agreement between the measurements values and a low absolute error, compatible with the literature. The as-is BIM process was able to represent the details of the facades, properly representing doors, windows, windowpanes, pilasters, beams, setbacks, and other architectural details of the building. Limitations were verified due to the presence of areas of no data in the point cloud caused by the obstruction of the laser beam. Finally, the results demonstrate that the integration of ALS and TLS data is an effective solution for the documentation, inventory, and preservation of buildings through as-is BIM.
As directions for future work, we intend to explore further methods for point cloud data acquisition and integration (including deep learning strategies), semiautomated approaches for BIM execution, geocoding of the integrated ALS/TLS point cloud, semantic labeling of the building components, and alternative distance meters for accuracy assessment.
Footnotes
Acknowledgments
We are grateful to the two anonymous reviewers who greatly improved the final quality of this article.
Declaration of conflicting interests
The author(s) declared no potential conflicts of interest with respect to the research, authorship, and/or publication of this article.
Funding
The author(s) disclosed receipt of the following financial support for the research, authorship, and/or publication of this article: This work was supported by the Conselho Nacional de Desenvolvimento Científico e Tecnológico (306107/2020-1, 311324/2021-5, and 317538/2021-7), Coordenação de Aperfeiçoamento de Pessoal de Nível Superior (1578589 and PROEX n° 0487), and Fundação de Amparo à Pesquisa do Estado de São Paulo (2020/09215-3).