



Abstract
Generative AI technologies have rapidly advanced in recent years, finding extensive applications in architectural design, including the generation of building volumes, which represent the three-dimensional form of buildings. However, current studies in this area lack scientific dataset classification methods and primarily focus on single generative models, with limited emphasis on model integration. To address these challenges, this study presents a comprehensive workflow that integrates multiple spatial computation methods to calculate the feature data of building volumes in urban areas, followed by cluster analysis to classify the building volume dataset. A generative model, combining Conditional Generative Adversarial Networks (CGAN) and Denoising Diffusion Probabilistic Models (DDPM), is introduced to improve the accuracy and diversity of generated building volume point clouds. The workflow is validated through a case study of the old town of Kashgar, demonstrating its effectiveness and robustness. Results show that the trained model achieves a mean training accuracy of 93.88% and a mean validation accuracy of 89.26%, with the training loss stabilizing at approximately 0.1 after 176 epochs. This approach accurately classifies the building volume dataset and generates diverse 3D point clouds of building volumes, highlighting its potential for the generative design of building masses in complex urban neighborhoods. This study offers new strategies for enhancing the design process using AI technologies.
Keywords
Introduction
Background
Generative AI technology has undergone rapid advancement and has been extensively applied across various phases of architectural design, including conceptual design, 1 plan design, 2 elevation design, 3 sectional design, 4 and structural design. 5 Nevertheless, its application in generating 3D building models remains an area of active exploration with significant room for further development. Architectural 3D volume design represents the initial phase of creating 3D conceptual representations of buildings or structures, emphasizing the exploration of fundamental spatial configurations, volumes, and massing prior to detailed refinement. This process is pivotal in architectural design as it addresses the volumetric characteristics of buildings, considering their spatial configuration and footprint, alongside their height, width, and depth, as well as their integration within urban or natural set-tings. The overarching aim of building volume design is to generate structures that are not only functional and aesthetically pleasing but also sustainable, optimizing spatial utilization and environmental interaction.
Before the advent of computers, architects used hand-drawn sketches or physical models for preliminary 3D form design. Hand-drawn sketches facilitated the quick capture and expression of design concepts, exploring different volumes and spatial layouts. Physical models, made from materials like cardboard or foam board visually represented design intentions and aided in understanding and adjusting buildings’ proportions and spatial relationships. Through iterative modifications of sketches and physical models, architects could refine designs, communicates with clients, gather feedback, and make adjustments. However, predigital methods of building volume design were significantly limited in efficiency, analytical capability, precision, and innovation.
With the emergence of computers and the application of various software and algorithmic models, architects adopted techniques such as parametric design in building 3D form design. Using software like Rhino and Grass-hopper, architects can define parameters and rules to quickly generate different design variants. 6 Building 3D form design can also rapidly integrate performance simulations or optimization algorithms (e.g., genetic algorithms) to identify optimal building forms. 7 Parametric design enhances design efficiency and generates multiple design options for evaluation and selection. Despite the significant advancements in efficiency and precision brought by computer-era building volume design, it still lags behind generative AI in automation, diversity, innovation, and adaptive learning capabilities.
Literature review
In recent years, generative artificial intelligence (AIGC) has rapidly evolved. The development of AIGC has benefited significantly from the rapid progress in generative models, including Generative Adversarial Networks (GANs),
8
Variational Autoencoders (VAEs),
9
and Denoising Diffusion Probabilistic Models (DDPMs).
10
AIGC has been widely applied in architectural design, offering multiple advantages, such as rapid generation of various design schemes, enhanced design efficiency, optimized design quality, and personalized customization. By automating the generation of floor plans, elevations, and 3D building volumes, AIGC reduces repetitive tasks, driving innovation and enhancing efficiency in architectural design. Initially, AIGC was mainly used to generate architectural images, including floor plans, elevations, structural diagrams, and renderings. The methods for applying generative AI to generate 3D architectural volumes can be classified into three main approaches: (i) Using Variational Autoencoders (VAEs): This approach involves generating 3D volumes through Variational Autoencoders (VAEs). (ii) Utilizing Generative Adversarial Networks (GANs): Since GANs outperform VAEs in terms of generative performance, an increasing number of researchers use GANs to generate 3D architectural volumes. (iii) Employing Denoising Diffusion Probabilistic Models (DDPMs): With the introduction of DDPMs, researchers have started using them to generate 3D architectural volumes.
Variational Autoencoders (VAEs) were introduced by Kingma and Welling (2013). In VAEs, the neural net-work components are called the encoder and decoder. The encoder maps input variables to parameters in a latent space corresponding to a variational distribution. This enables the encoder to generate multiple distinct samples from the same variational distribution. Conversely, the decoder maps from the latent space to the input space to generate data points. These two networks are usually trained together. The methods for generating 3D architectural volumes using VAEs can be divided into three categories: (i) Morphological Classification: Training datasets are divided and labelled based on morphology. Linear inter-polation or textual labels are used as control conditions to generate 3D volumes.11,12 (ii) Parametric 3D Models: These serve as training data. The VAE analyzes latent space vector features and com-pares them with the features of the 3D volumes.
13
(iii) Employing Boundary Conditions: Boundary conditions and their corresponding optimal 3D models serve as training data. The VAE uses boundary conditions as input to drive 3D volume generation.
14
The concept of Generative Adversarial Networks (GANs) was introduced by Goodfellow et al. (2014). GANs introduced a novel generative model estimation framework that trains two models through an adversarial process: a generative model (G), which captures the data distribution, and a discriminative model (D), which estimates the probability that a sample comes from the training data rather than from the generative model (G). In architectural design, GANs are widely used for tasks involving generating and recognising two-dimensional images. As the technology has evolved, various GAN variants have emerged, including Conditional GANs (CGAN), 15 pix2pix, 16 StyleGAN, 17 CycleGAN, 18 and 3DGAN. 19
CGANs generate samples based on labels, offering high controllability and making them suitable for tasks that require generating images under specific conditions. The application methods of CGANs in generating 3D architectural volumes can be classified into four main approaches: (i) Using Feature-Extracted Images: Feature-extracted images and architectural 3D volume views are used as the dataset to generate 3D volumes based on colour patterns.
20
(ii) Using Standardized Urban Layouts: Standardized urban building layouts and plot morphology data serve as the dataset to generate 3D volumes based on site plans.21,22 (iii) Using Voxel and SDF Representations: Architectural volumes are converted into voxel and Signed Distance Function (SDF) implicit formats, serving as the dataset for generating 3D volumes based on linear interpolation.
23
(iv) Using Streetscape Images or Building Sizes: Streetscape images or building sizes are used to classify the dataset, generating 3D volumes from a single image
24
or sketch.
25
(v) Using spatial sequence diagrams and spatial requirements: CGAN is used to generate detailed 3D forms based on spatial sequence diagrams and spatial requirements.
26
Pix2Pix is well suited for image-to-image translation tasks and requires paired training data. Sufficient paired data can generate high-quality results. The application methods of Pix2Pix in generating 3D architectural volumes can be divided into three approaches: (i) Using Paired Profiles of 3D Forms: Paired profiles of Taihu stones are used as the dataset to generate profiles with 3D information.
27
(ii) Using Point Cloud Models or Urban Morphology Images: Architectural point cloud volumes or urban morphology images with height information are used as the dataset to generate floor plans with 3D information.28,29 (iii) Using Digitally Simulated Building Models: Digitally simulated building volumes and corresponding environmental performance prediction maps are used as the dataset. Pix2Pix is utilized to predict the environmental performance of 3D architectural volumes.
30
(iv) Using section images: 3D models are transformed into section images for reconstruction and then reverted back to 3D forms, significantly reducing both training duration and costs while ensuring accurate restoration of the original 3D models.
31
StyleGAN generates high-quality, diverse images with rich details. The application method of StyleGAN in refining 3D architectural volumes involves using datasets of architectural residential volumes with different styles. It generates images with 3D information based on computational vectors and interpolation. 32 MayrhoferHufnagl and Ennemoser apply interpolation to create new 3D elements with transitioning forms based on StyleGAN and DCGAN. 33 CycleGAN excels at image style transfer without paired data. The application method of CycleGAN in refining 3D architectural volumes involves using collected architectural floor plans as the dataset to perform style transfer of 3D volumes and their reconstruction. 34 Some authors use CycleGAN to generate urban block layout images with 3D information tailored to specific sites and their surrounding environments. 35 3DGAN demonstrates outstanding performance in generating diverse 3D volumes. The application method of 3DGAN in generating 3D architectural volumes involves generating 3D forms based on lin-ear interpolation. 36 Kim et al. 37 use 3DGAN to generate voxelized and point cloud representations of building 3D forms components in ac-cordance with textual labels. Additionally, many researchers utilize other GAN variants to generate 3D architectural volumes. For example, Panagiota Pouliou et al. used CPCGAN to generate residential 3D volumes that meet site constraint conditions, 38 and Shu et al. 39 used TreeGAN to train point cloud volumes of churches and employed the generated point cloud for various forms of reconstruction.
Denoising Diffusion Probabilistic Models (DDPMs), commonly referred to as “diffusion models”, were introduced by Ho et al.
10
Diffusion models use variational inference to train a parametric Markov chain that generates samples matching the data distribution within a finite time frame. The application methods of DDPMs in generating 3D architectural volumes can be categorized into two main approaches: (i) Training on Taihu Stone and Architectural 3D Volumes: Researchers train Taihu stone 3D volumes and architectural 3D volumes. Interpolation is used to identify transitional forms between the two shapes.
40
(ii) Noise Generation: The diffusion model is trained on 3D volumes, leveraging 3D noise to generate new 3D volumes.
41
(iii) Urban Block Depth Image Generation: Researchers generate urban block depth images from textual descriptions using latent DMs, particularly stable diffusion, and reconstruct 3D urban models from these depth images.
42
In handling datasets, classification methods are used to enhance the precision and controllability of the generative model by categorizing datasets based on their features. However, the existing classification methods are often criticized for their reliance on subjective judgments regarding data forms, which limits the depth of analysis and lacks scientific rigor in the categorization of sample data. This subjectivity becomes particularly problematic when dealing with complex and diverse datasets, where classification accuracy and consistency are crucial for model performance. Such limitations lead to inconsistencies and affect the reliability and robustness of generative models.
A critical examination of early research in this domain reveals a predominant focus on applying a single generative model, such as VAEs, GANs, or DDPMs, or merely comparing two models. This narrow focus fails to recognize the potential benefits of an integrated approach that could leverage the unique strengths of each generative model. VAEs are known for their efficient latent space representation, GANs excel in capturing high-quality features through adversarial training, and DDPMs provide robust generation capabilities by progressively refining details. However, these models’ capabilities have not been effectively harnessed in a combined, holistic manner, which limits their applicability in complex real-world scenarios.
Furthermore, previous studies often overlook the challenges posed by dataset heterogeneity, which can impact the generative quality of models. There is a need for a more flexible and integrated approach that can accommodate the complexity of urban architectural forms. The compatibility and synergy between different generative models should be thoroughly explored to develop a more comprehensive approach that effectively accomplishes diverse 3D volume generation tasks. By combining these generative models in an integrated framework, researchers could achieve improved adaptability, enhanced diversity in generated outputs, and greater alignment with architectural design requirements. This integrative strategy holds the potential to address the limitations of existing methods and significantly advance the field of generative architectural modeling.
Research content
Based on the issues identified in previous studies, this research focuses on two key areas: the classification method for building volume datasets and the development of a generative model. To address the first area, various spatial computation methods are employed to analyze building volume datasets in urban areas comprehensively. By extracting features of building volumes and performing cluster analysis, diverse category labels are generated, leading to the establishment of a classification method based on architectural volume feature data. This method enhances the classification of datasets for generative models, making the process more reasonable, diversifying data labels, and improving the controllability of the generative model, ensuring that the generated building volumes align better with design requirements. For the second area, a generative model integrating DDPM and GAN is proposed. This approach combines GAN’s ability to capture complex dataset distributions with DDPM’s strength in generating high-quality details, ultimately improving the accuracy and diversity of 3D volume generation. This research proposes a new workflow to enhance the scientific rigour and efficiency of generative AI in architectural design by addressing these two areas, focusing on analyzing and generating building volumes in urban neighbourhoods.
The structure of this paper begins with an introduction that outlines the current state and challenges of applying generative AI technologies to generate 3D architectural volumes, as well as the innovations proposed in this study. The methodology section follows, detailing the workflow for classifying building volumes using clus-tering analysis and the generative model that integrates CGAN and DDPM technologies. A case study of the an-cient city of Kashgar is then presented to validate the feasibility and effectiveness of the proposed method. The paper concludes by summarizing the main findings, discussing the study’s limitations, and suggesting potential directions for future research.
Research methodology
This study focuses on the generation of building volumes within urban neighbourhoods. It aims to enhance the scientific rigour of building volumes dataset classification through clustering analysis. Additionally, it seeks to im-prove the stability and efficiency of the generative model by employing alternating training methods using CGAN and DDPM. This approach aims to achieve greater diversity and target consistency in generating building volumes. Based on these objectives, this paper proposes a workflow for generating building volumes using a combined CGAN and DDPM models approach, as illustrated in Figure 1. The detailed steps of the proposed workflow are as follows. Research methodology framework.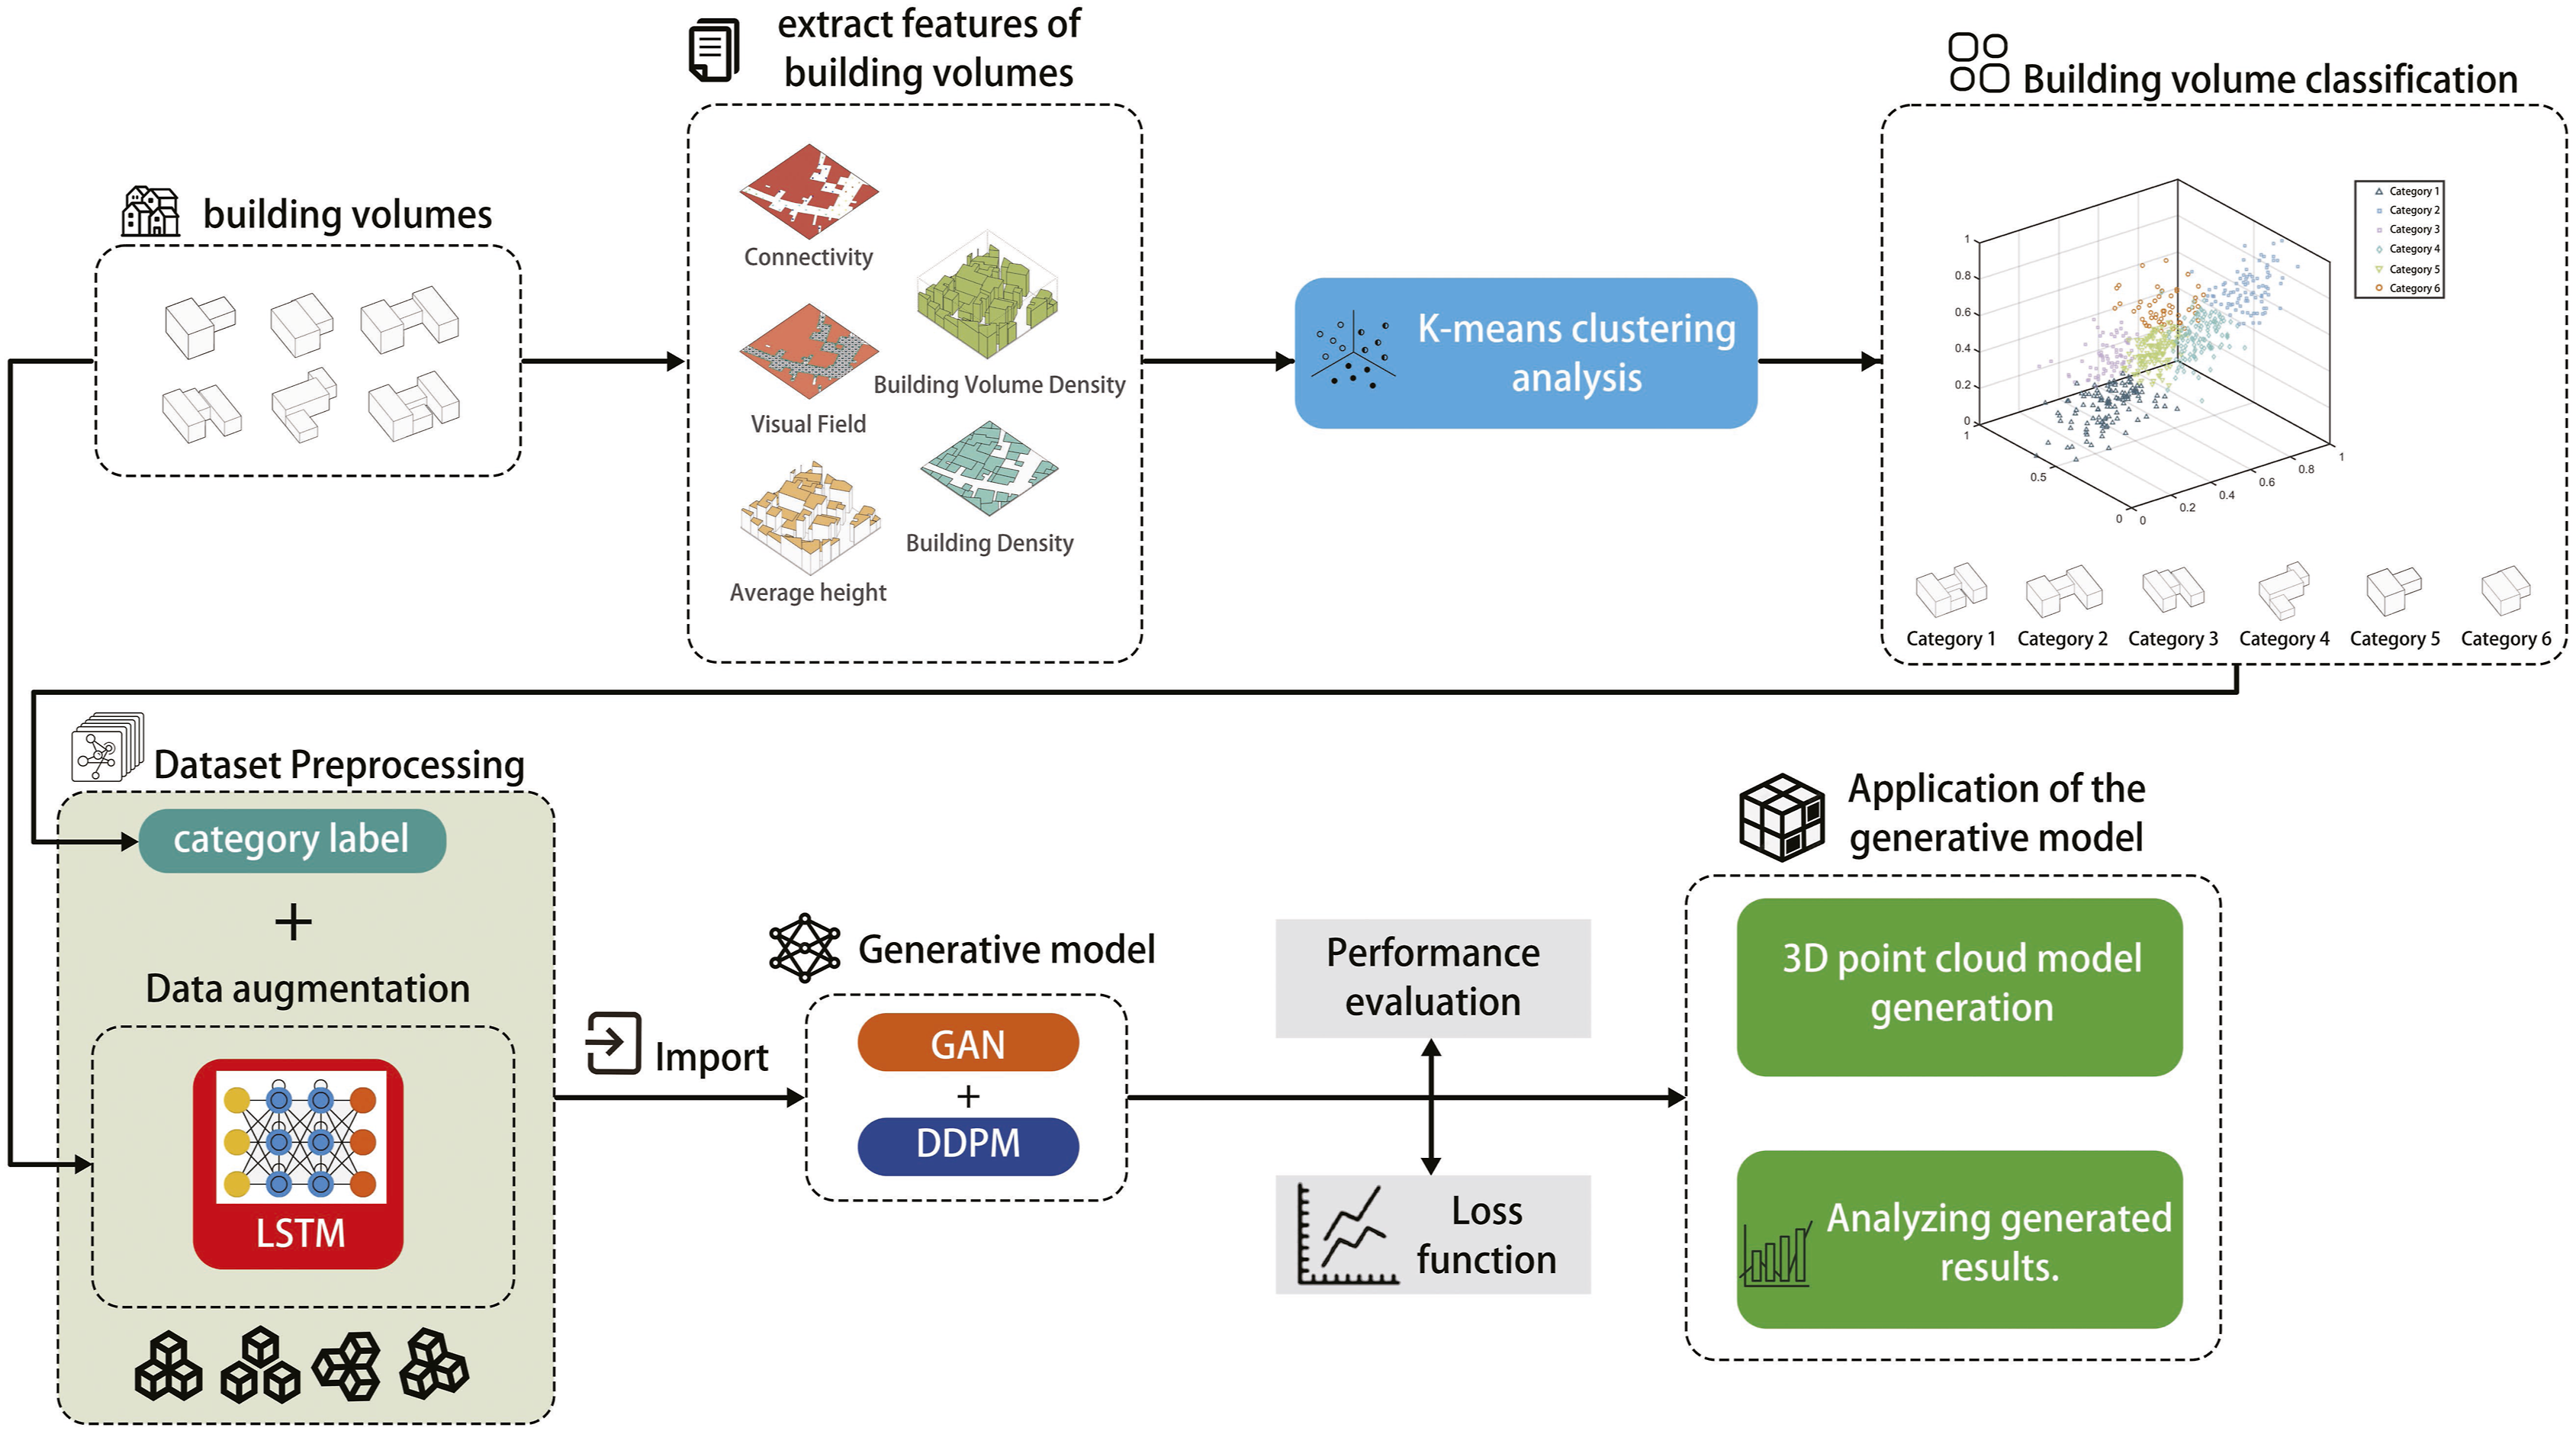
Features of architectural volumes
In this study, we first conduct a spatial division of the building volumes within urban areas into grid cells. Utilizing various spatial computation methods, we identify five-dimensional features of building volumes within each grid cell: connectivity of architectural volumes, Visual Field, volume average height, Building Density, and Building Volume Density.
Connectivity, as described in “The Social Logic of Space”,
43
is a metric within Space Syntax, a method for analyzing spatial configurations and their effects on human behaviour and social interactions. It measures the degree to which a spatial unit is connected to its adjacent spatial units. Specifically, connectivity quantifies the number of direct connections a node has to other nodes. This study focuses exclusively on the connectivity of street networks within urban areas. Computational nodes were placed at 5-m intervals along urban streets to calculate connectivity data. Subsequently, the connectivity between each node and other nodes unobstructed by building outlines was computed. The specific calculation formula as shown in formula (1):

Here,
Visual Field (Hillier and Hanson, 1984) is a metric within Space Syntax used to examine the visible range from a specific point within a space. It assesses all spatial areas seen from a given observation point. This analysis helps understand how spatial visibility affects activity patterns, space utilization, and navigation behaviours. In this study, 400 computational nodes were uniformly placed within each grid unit space for visual field analysis, and only those located on streets were retained. Each retained node is considered a starting point, emitting rays in eight directions with a maximum length of 100 m. The rays cease to extend when they encounter building outlines or reach their maximum length. The total length of all rays emitted from the retained nodes is calculated and considered as the visual field data for the grid unit. This process is repeated for each grid unit to calculate the visual field data. The specific calculation formula as shown in formula (2):

Here,
The Weighted Average Height of building volumes is a statistical measure used to describe the heights of buildings within a specific area. This measure accounts for the heights of various building volumes and their ar-ea-based proportional weights, providing a more representative average height. In this study, to calculate the weighted average height, the top surfaces of building volumes within each grid unit space are first identified, and the proportion of each top surface area to the total top surface area is calculated. Next, the height value from each top surface to the ground is obtained. Subsequently, each top surface’s height value is multiplied by its area proportion, and the sum of all products gives the weighted average height value for the building volumes within each grid unit. The specific calculation formula as shown in formula (3):

Here,
Building Density is a crucial concept in urban planning and architectural design, used to describe the scale and distribution of buildings within a specific area. Various methods exist for measuring building density; this study refers to the proportion of land occupied by buildings. To calculate building density data in this study, the base are-as of all volumes in each grid unit are first selected and summed to obtain the total base area. This total is then divided by the area of the grid unit to determine the proportion. The specific calculation formula as shown in formula (4):

Here,
Building Volume Density describes the ratio of the total building volume to the volume of a specific area (grid unit space). It provides a detailed description of space utilization, helping to understand the distribution and density of buildings in 3D space. In this study, we first extract the base area and height of each building volume within the grid unit space to calculate the building volume density. These values are then multiplied and summed to obtain the total building volume for each grid unit space. Next, the ratio of the total building volume to the volume of the grid unit space is calculated to obtain the building volume density. Subsequently, the building volume density for each grid unit space is calculated individually. The specific calculation formula as shown in formula (5):

Here,
Classification of building volume dataset
This section may be divided by subheadings. It should provide a concise and precise description of the experimental results, their interpretation, and the experimental conclusions that can be drawn. The five types of feature data of architectural volumes for each grid unit space are obtained using the methods outlined above. The initial weighting assigned to each feature is equal, as no feature is assumed to be more important without further analysis. The K-means clustering algorithm is then applied to classify all building volumes in each grid unit space and determine the categories of building volumes in each grid unit space. The following classification method is proposed to handle feature data with significant variation thresholds and provide a reliable basis for subsequent generative model training: (i) Feature Data Normalization: The first step is to normalize each feature by mapping its range to the interval between 0 and 1. This process helps eliminate dimensional differences across features, ensuring the data are comparable on the same scale. It improves the comparability of the data and provides a solid foundation for subsequent clustering analysis. Normalization prevents significant magnitude differences between features from unduly affecting the clustering process. (ii) K-means Clustering Analysis: K-means clustering analysis is performed multiple times for different numbers of categories, resulting in several clustering outcomes. In each outcome, categories with insufficient sample sizes are removed. This process ensures that each category contains enough samples, preventing categories with too few samples from negatively affecting the subsequent training of the generative model, thus ensuring the validity and reliability of the sample sizes in each cluster. (iii) Standard Deviation Comparison and Selection: The standard deviation of each clustering result is calculated and compared. The standard deviation reflects the uniformity of sample distribution within each category. Selecting the clustering result with a smaller standard deviation ensures more evenly distributed sample sizes across categories, which helps balance the contribution of each category’s data in the generative model. This step avoids issues of excessively large or small sample sizes in any category, ensuring more stable training of the generative model. (iv) Determining the Number of Clusters: The optimal number of clusters for K-means clustering is determined by ensuring that each category has a sufficient and evenly distributed sample size, neither too low nor excessively large. This process provides reliable dataset classification labels for the training of the generative model. These steps ensure that the clustering results align with the distribution characteristics of the actual data while providing valuable and reliable input data for model training.
This study highlights the advantages of the K-means clustering algorithm in several aspects: First, the K-means method offers high computational efficiency and scalability, enabling it to handle large datasets efficiently. It is particularly suitable for the building volume data of the 569 grid units considered in this study. Second, the K-means method is simple to implement, and its clustering results are intuitive, clearly revealing the distribution of architectural volume characteristics across different categories. Third, the K-means method calculates the standard deviation of sample sizes across different cluster configurations, effectively helping to determine the optimal number of clusters. This ensures balanced sample sizes in each category, avoiding skewed distributions. In contrast, methods such as hierarchical clustering and Gaussian mixture models often face high computational complexity and difficulties in determining the optimal number of clusters when dealing with high-dimensional and large-scale data. K-means clustering is the most suitable choice for this study due to its efficiency, interpretability, and effectiveness in selecting the optimal number of clusters.
The classification process chooses to use standard deviation analysis for several key reasons. First, the primary objective is to provide reliable classification criteria for building volumes to support subsequent training of the generative model. Clustering analysis focuses on ensuring a balanced sample distribution and sufficient sample sizes for each category rather than solely pursuing mathematical optimization metrics of clustering algorithms (such as the elbow method’s inflection point or the maximum silhouette coefficient). Standard deviation analysis provides a more effective balance of sample distribution and maximizes the use of available data, providing robust support for training generative models. Second, the characteristics of the data play a decisive role in the choice of method. The elbow method and the silhouette coefficient are typically suitable for uniformly distributed feature data, while the data in this study originate from real-world urban building volumes, where the feature data distribution is not perfectly uniform. In this case, standard deviation-based analysis provides a more intuitive measure of the balance in sample distribution, preventing adverse effects on model training due to uneven data distribution. Third, in generative model training, categories with too few samples significantly reduce the generation quality, necessitating the removal of these small sample categories. The elbow method and silhouette coefficient cannot directly account for the impact of removing small sample categories on clustering results. In contrast, standard deviation analysis can optimize clustering with this consideration, ensuring both the quality of classification results and the stability of model training. Considering the research objectives, data characteristics, and the need to remove small sample categories, standard deviation analysis is the most suitable choice.
Construction, training, and application of the generative model
The generative model developed in this study integrates Conditional Generative Adversarial Networks (CGAN) and Denoising Diffusion Probabilistic Models (DDPM) to enhance the quality and diversity of the generated building volume point cloud models. This integration leverages the strengths of both models—CGAN’s ability to generate complex data distributions conditioned on specific labels, and DDPM’s capacity to produce high-fidelity details through iterative denoising processes. The following steps outline the specific methodology for constructing, training, and applying the generative model.
Dataset preprocessing
In the dataset preprocessing phase, Long Short-Term Memory (LSTM) networks are employed to augment the building volume models represented as point clouds within the grid unit space. LSTM is employed for sequence prediction and generation of point cloud models, producing several new models. This augmentation increases the sample size of the initial dataset, enhancing its diversity and richness, thereby facilitating efficient learning by the neural network generative model. The point cloud models processed by LSTM are integrated to form the training dataset for the generative model. (i) Data Preparation and Preprocessing: To meet the input requirements of the LSTM network, we first preprocess the raw 3D point cloud model data. Each point cloud model is represented as a dataset containing multiple 3D coordinates (x, y, z). Each point in the dataset consists of three features: (x, y, z,). Using this format, the 3D coordinates of building point cloud models of the same category are input into the LSTM network for training, allowing the network to learn the relationships between point cloud models of different categories during the training process. This study uses the common 80/20 dataset partitioning method, with 80% of the data for training and 20% for validation. (ii) LSTM Network Architecture Design: To capture the temporal and spatial dependencies of the 3D point cloud data, this study designed a three-layer stacked LSTM network based on the TensorFlow framework. Each LSTM layer consists of a fixed number of memory units that extract deep features from the point cloud data. The model architecture consists of the following key components: (iii) A regression loss function based on Mean Squared Error (MSE) is used to optimize coordinate prediction. This loss function measures the discrepancy between the predicted and true coordinates. The Adam optimizer was used to minimize this loss, and gradient clipping is applied during training to mitigate gradient explosion.
Construction and training of the generative model
This study proposes a method that combines DIFFUSION and CGAN training, building upon the DIFFUSION-GAN framework
44
and integrating it with Conditional Generative Adversarial Networks (CGAN). During training, the generation process is guided to produce data corresponding to specific labels by incorporating conditional information. The DIFFUSION-CGAN not only inherits the advantages of CGAN in generating data conditioned on certain attributes but also leverages the powerful iterative denoising capability of DDPM, significantly improving the quality and detail of the generated data. Unlike DIFFUSION-GAN, DIFFUSION-CGAN does not adopt the original ADAPTIVE DIFFUSION method, primarily due to the additional discriminator-based strategy required, which complicates the framework. This study chose a more direct training strategy to simplify the training process. The process is shown in Figure 2: Illustration of the generative model architecture.
The Diffusion-CGAN uses a Fully Connected Neural Network (FCNN) architecture rather than the traditional 3D convolutional architecture. This choice was made for several reasons. First, FCNNs are more efficient at capturing conditional features by concatenating the conditional vector with noise as input, thereby improving the generator’s control over the generation process. Second, FCNNs can directly handle point cloud data, eliminating the complex preprocessing requirements of 3D convolutions. Previous research on StyleGAN 45 has shown the effectiveness of FCNN architectures in conditional generation tasks, particularly for handling multi-class labels and high-dimensional latent spaces.
With this design, Diffusion-CGAN achieves a balance between the flexibility of the generator, controllability in conditional generation, and fidelity of generated details in point cloud generation tasks. The generator is guided by conditional information to produce data that meets specific requirements, while the diffusion process refines the data by denoising and enhancing the details. Throughout this process, the conditional information is effectively embedded at each step, ensuring that the generated point cloud satisfies the conditional criteria and demonstrates improvements in quality and realism.
CGAN for generating preliminary point cloud models
In the process of generating preliminary point cloud models using CGAN, the input data includes both the conditional vector and the noise vector. The conditional vector consists of the architectural point cloud model and category label information, while the noise vector introduces diversity through randomly generated noise. Specifically, the input point cloud data consists of raw, unordered data containing a set of 3D coordinate points, which is not voxelized or flattened into a vector. Each point cloud comprises multiple 3D coordinates, representing the structural features of the point cloud. For example, a point cloud may contain
Gaussian noise is added to the 3D coordinates of the point cloud. Specifically, for each point
Diffusion and denoising of preliminary point cloud models with DDPM
In the forward diffusion process of DDPM, the initially generated point cloud model,

Here,
The conditional constraints are implemented using a U-Net-based denoising network during the denoising process. The U-Net architecture receives the noisy point cloud
The encoder path consists of three downsampling blocks, each containing two fully connected layers with ReLU activations and batch normalization. These blocks progressively increase the feature dimensions from 132 to 512, then to 1,024, followed by 2048 and 4,096, and finally reaching 8192 and 16,384 dimensions. These transformations leverage fully connected layers to accommodate the unordered nature of point cloud data, thereby avoiding the spatial assumptions inherent in convolutional layers.
Situated between the encoder and decoder, the bottleneck layer further processes the extracted features to form a rich, high-dimensional representation. This layer comprises two fully connected layers that reduce the dimension from 16,384 to 8192 and subsequently to 4096 dimensions, each followed by ReLU activations and batch normalization. The bottleneck serves as a critical junction, enabling the integration of high-level features before the reconstruction phase in the decoder.
The decoder path mirrors the encoder with three upsampling blocks, each responsible for reconstructing the denoised point cloud by restoring feature dimensions and integrating high-resolution details through skip connections. Each upsampling block begins with a fully connected layer that increases the dimension from 4096 to 8,192, followed by ReLU activation and batch normalization. It then concatenates the resulting features with the corresponding high-resolution features from the encoder’s third downsampling block (16,384 dimensions), forming a combined feature vector of 24,576 dimensions. A subsequent fully connected layer reduces this concatenated dimension back to 4,096, maintaining activation and normalization. This process is repeated in the subsequent upsampling blocks, progressively integrating features from the encoder’s second and first downsampling blocks and restoring the feature dimensions accordingly.
The final stage of the U-Net architecture involves generating the denoised point cloud. A fully connected layer maps the 4096-dimensional feature vector to 4096 dimensions, corresponding to the original point cloud structure (1024 points

Here, U-net structure diagram.
CGAN discriminator evaluation of the generated model
In the process of evaluating the generated model using the CGAN discriminator, the input data includes the noisy generated point cloud model,
Specifically, the discriminator evaluates the similarity between the generated and real point clouds under noise interference to determine if the generated point cloud is sufficiently realistic and consistent with the given conditions. The discriminator outputs a score that quantifies the similarity between the generated and real point cloud models. This feedback not only helps to guide the optimization of the CGAN generator but also aids in improving the denoising process of DDPM, thereby further enhancing the quality and authenticity of the generated point cloud model.
Generator and discriminator optimization in CGAN and DDPM
In this method, the generator and discriminator work together to optimize the quality and diversity of the generated point cloud model by combining CGAN and DDPM. In the CGAN generator, the generator’s objective is to produce point cloud samples that can deceive the discriminator. The generator’s loss function is defined as the negative log-likelihood of the discriminator’s assessment of the generated sample, as shown in formula (8):


During the feedback optimization process, the generator and DDPM are jointly optimized using the feedback signal from the discriminator. First, the generator adjusts its network parameters in response to the discriminator’s feedback to generate point cloud models that are more realistic and harder to distinguish from real data. This process uses the backpropagation algorithm, which updates the generator’s weights according to the discriminator’s error signal.
At the same time, the DDPM optimization process relies on the discriminator’s feedback. The discriminator’s feedback is used to optimize the DDPM denoising process, improving its accuracy and detail preservation when reconstructing the point cloud model. Through backpropagation, the discriminator’s feedback is passed to the denoising network, adjusting its parameters and enhancing its noise prediction capability.
Iterative training process
In the iterative training process, CGAN and DDPM undergo optimization over multiple rounds to gradually enhance the diversity and realism of the generated point clouds. In each iteration, the CGAN generator and DDPM mutually enhance each other’s performance, with feedback from the discriminator continuously guiding their optimization. CGAN excels at modeling complex data distributions under specific label conditions, generating preliminary point cloud models with structural features. DDPM improves the details and fidelity of the point cloud models through iterative denoising, enhancing their quality. CGAN generates diverse initial models through generator, while DDPM refines these models’ details. Together, they ensure that the final generated point cloud model is diverse and highly realistic, closely resembling real architectural point cloud data.
Generation testing of the model
After constructing and training the generative model, generation testing is performed. This process involves inputting the building point cloud model and its corresponding category labels into the trained CGAN and DDPM models to generate point cloud models with specified label features. The procedure follows: First, the CGAN generator uses a conditional vector and a noise vector
Case Study: The Old City of Kashgar
To address the issue of generating building volumes in urban districts, this study proposes a process using a combined CGAN and DDPM network approach. The Old City of Kashgar is used as a case study to validate the effectiveness of the proposed process. The framework of the case study is illustrated in the Figure 4. Case study framework.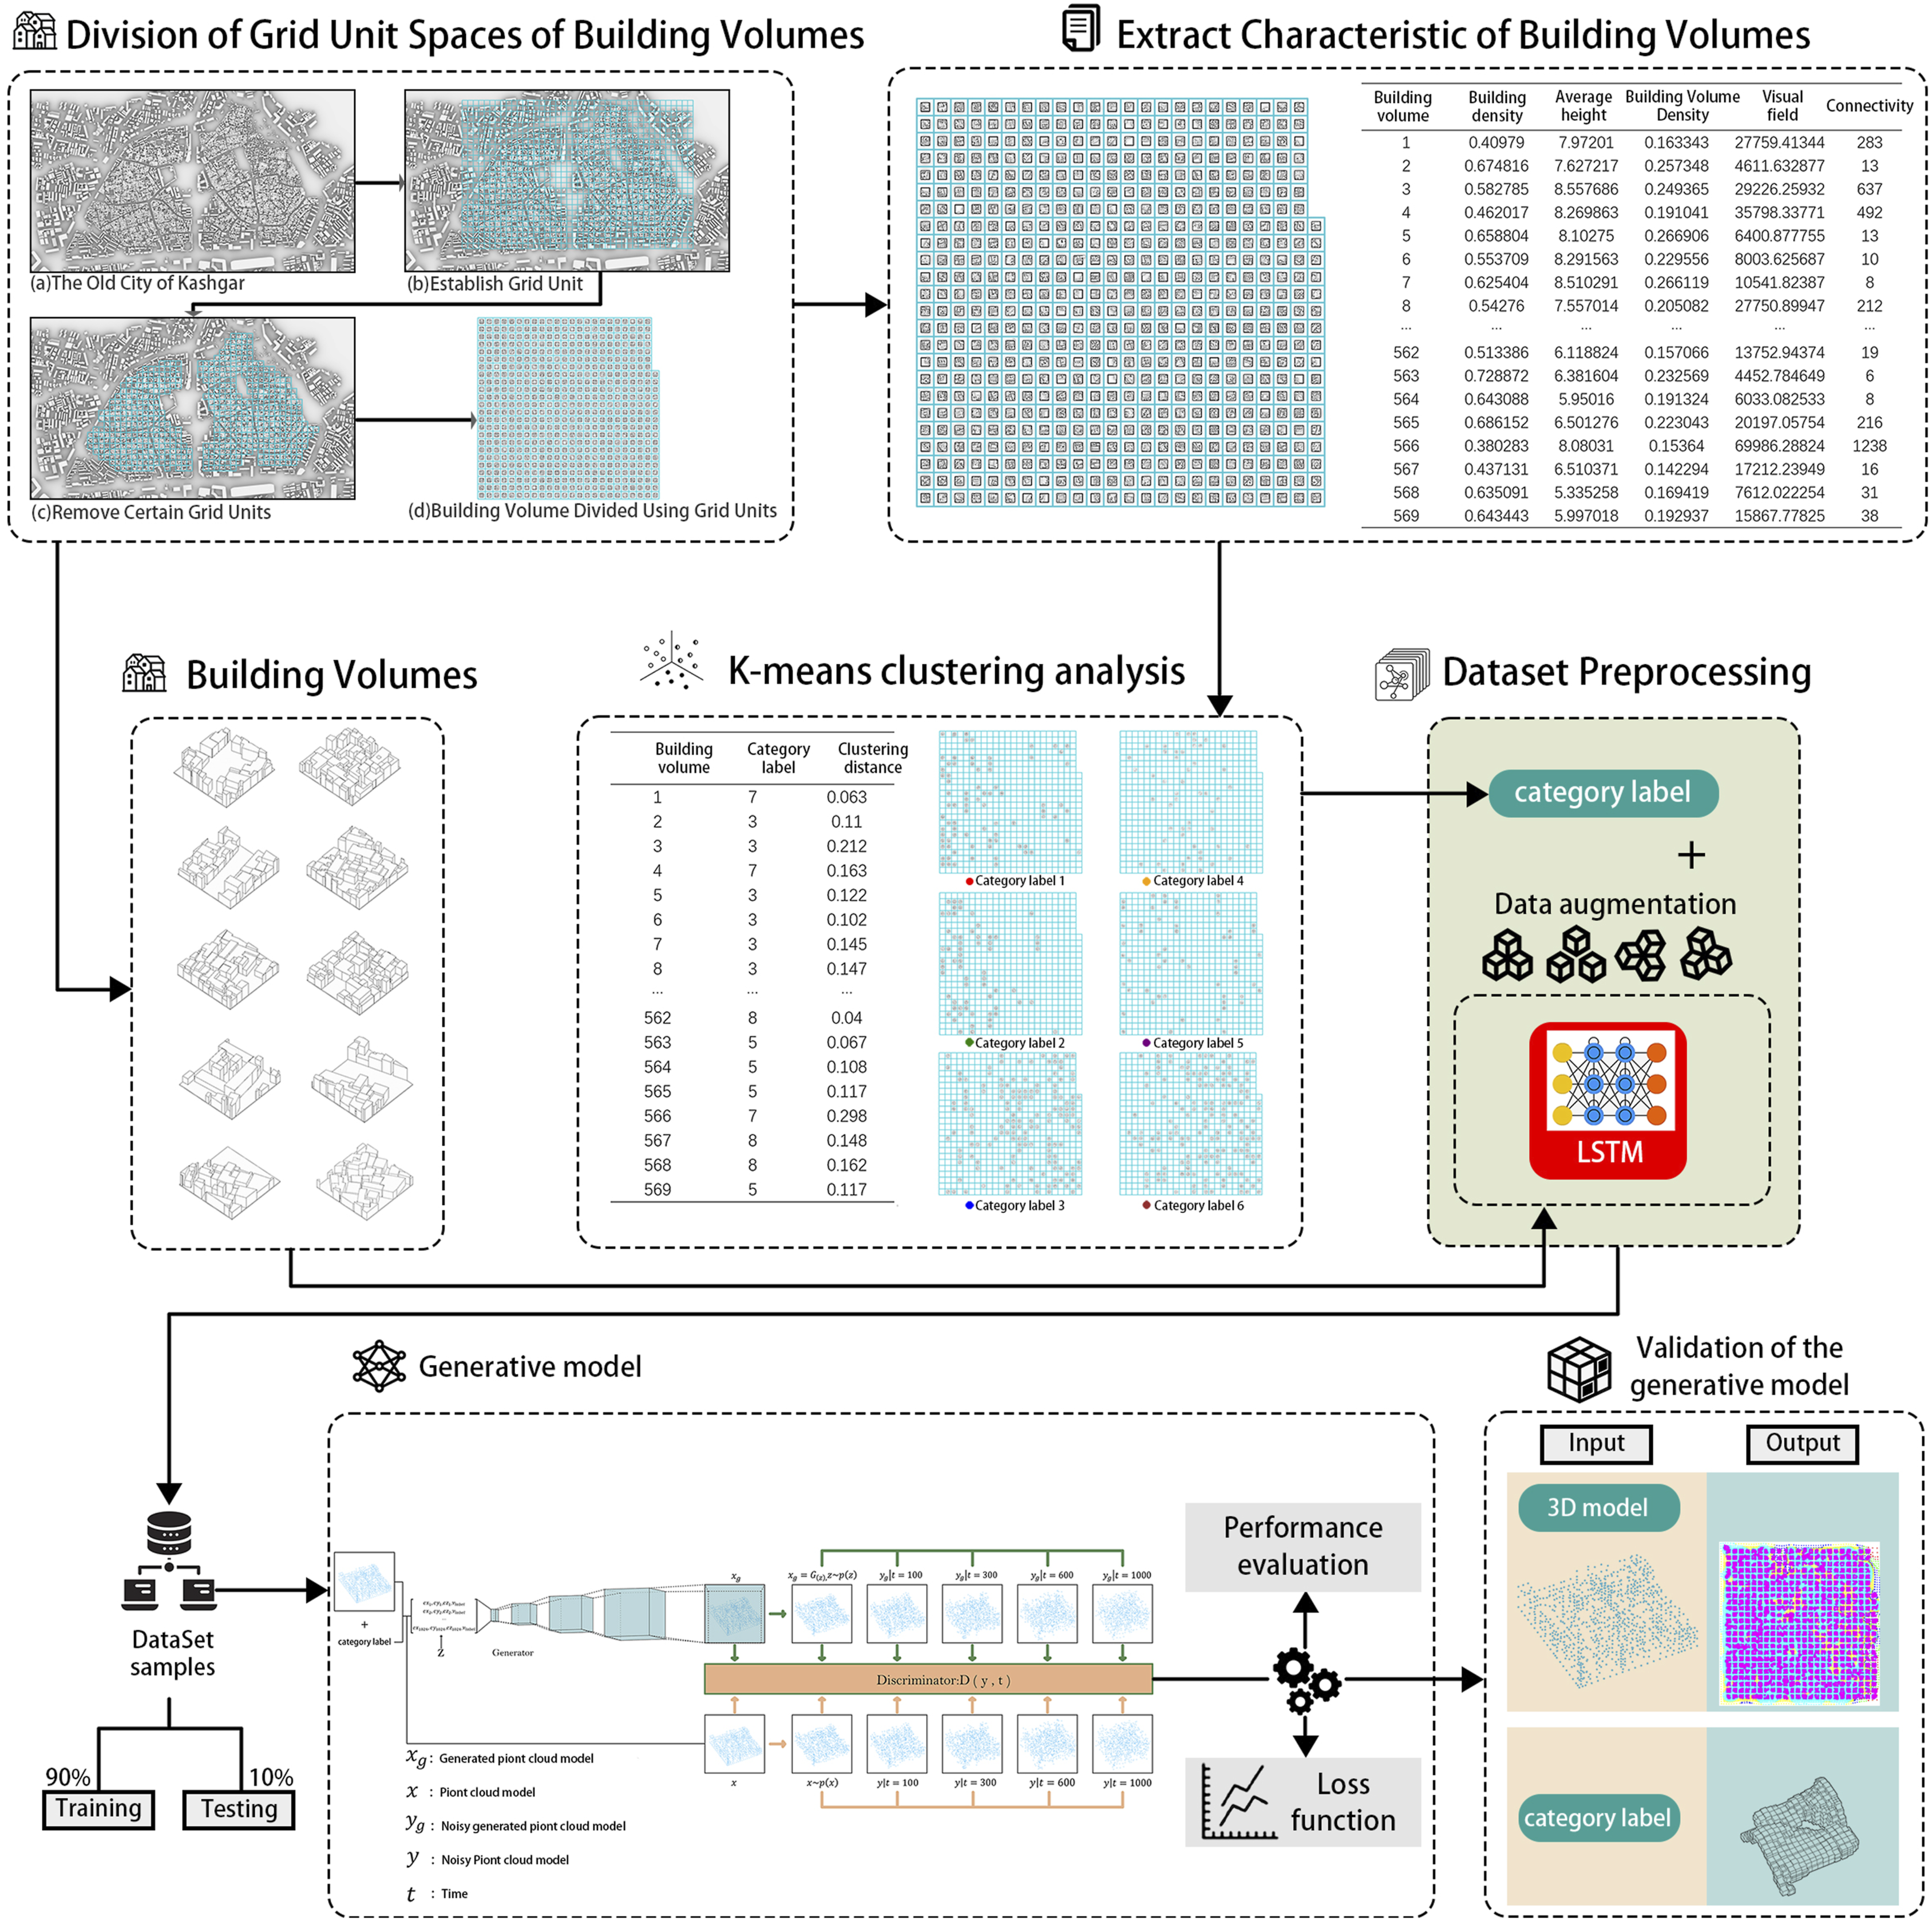
Selection and preprocessing of study subject
Study subject
The case study focuses on the Old City of Kashgar, an area characterized by high-density and diverse building volumes, as illustrated in the Figure 5. The building volumes include various forms such as linear, L-shaped, U-shaped, and square types.
46
They vary in height and interconnect, forming a self-organized volume cluster, making this area a representative subject for the study. Aerial view of Kashgar old city.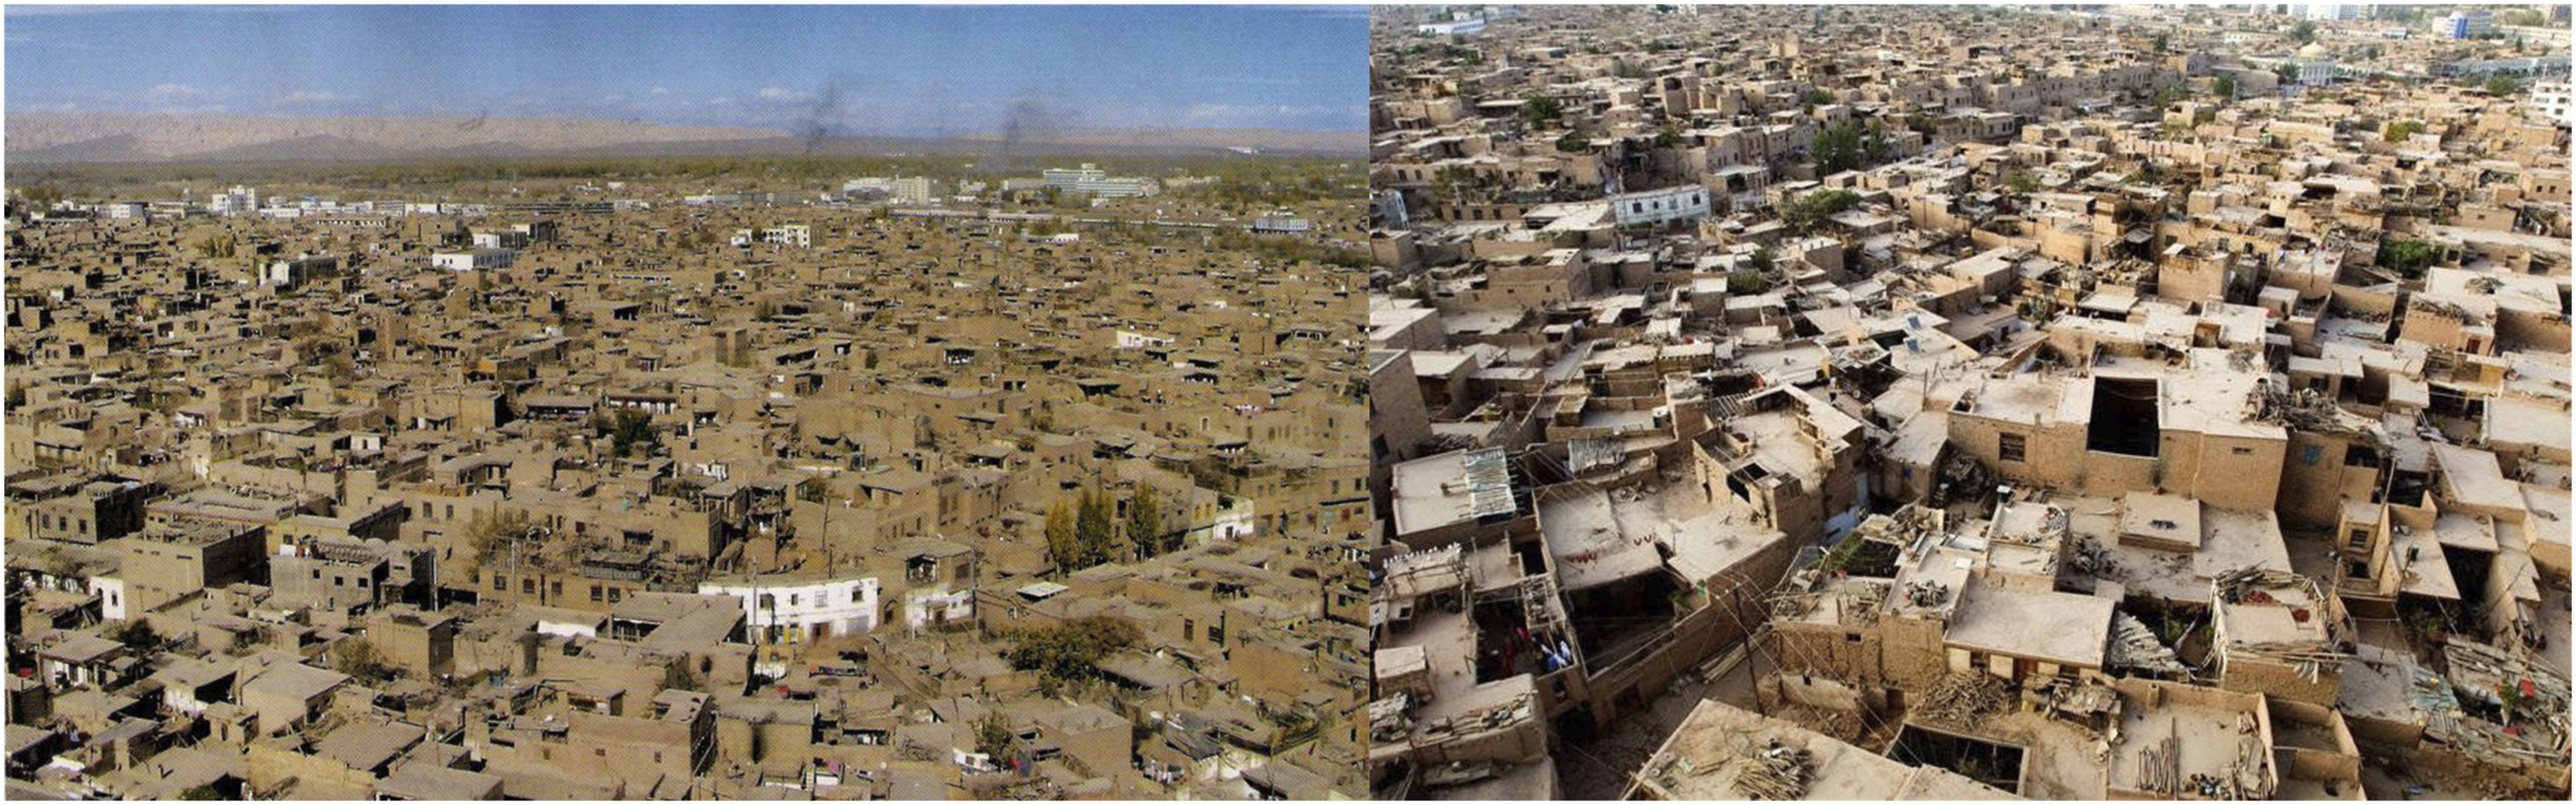
Division of grid unit spaces for the study subject
To achieve efficient numerical computation of building volume features and facilitate the normalization of training datasets for the generative model, this study developed a grid system covering the entire urban area, with each grid unit space serving as a training sample. The grid system was created using Rhino’s Grasshopper plugin, which allowed for precise control over grid dimensions and alignment with the urban layout. To ensure sufficient training samples for the neural network and capture the diversity of building forms, the grid unit size was set to 40 Division of grid unit spaces for the Kashgar Old City: (a) The Old City of Kashgar; (b) Establish Grid Unit; (c) Remove Certain Grid Units; (d) Building Volume Divided Using Grid Units.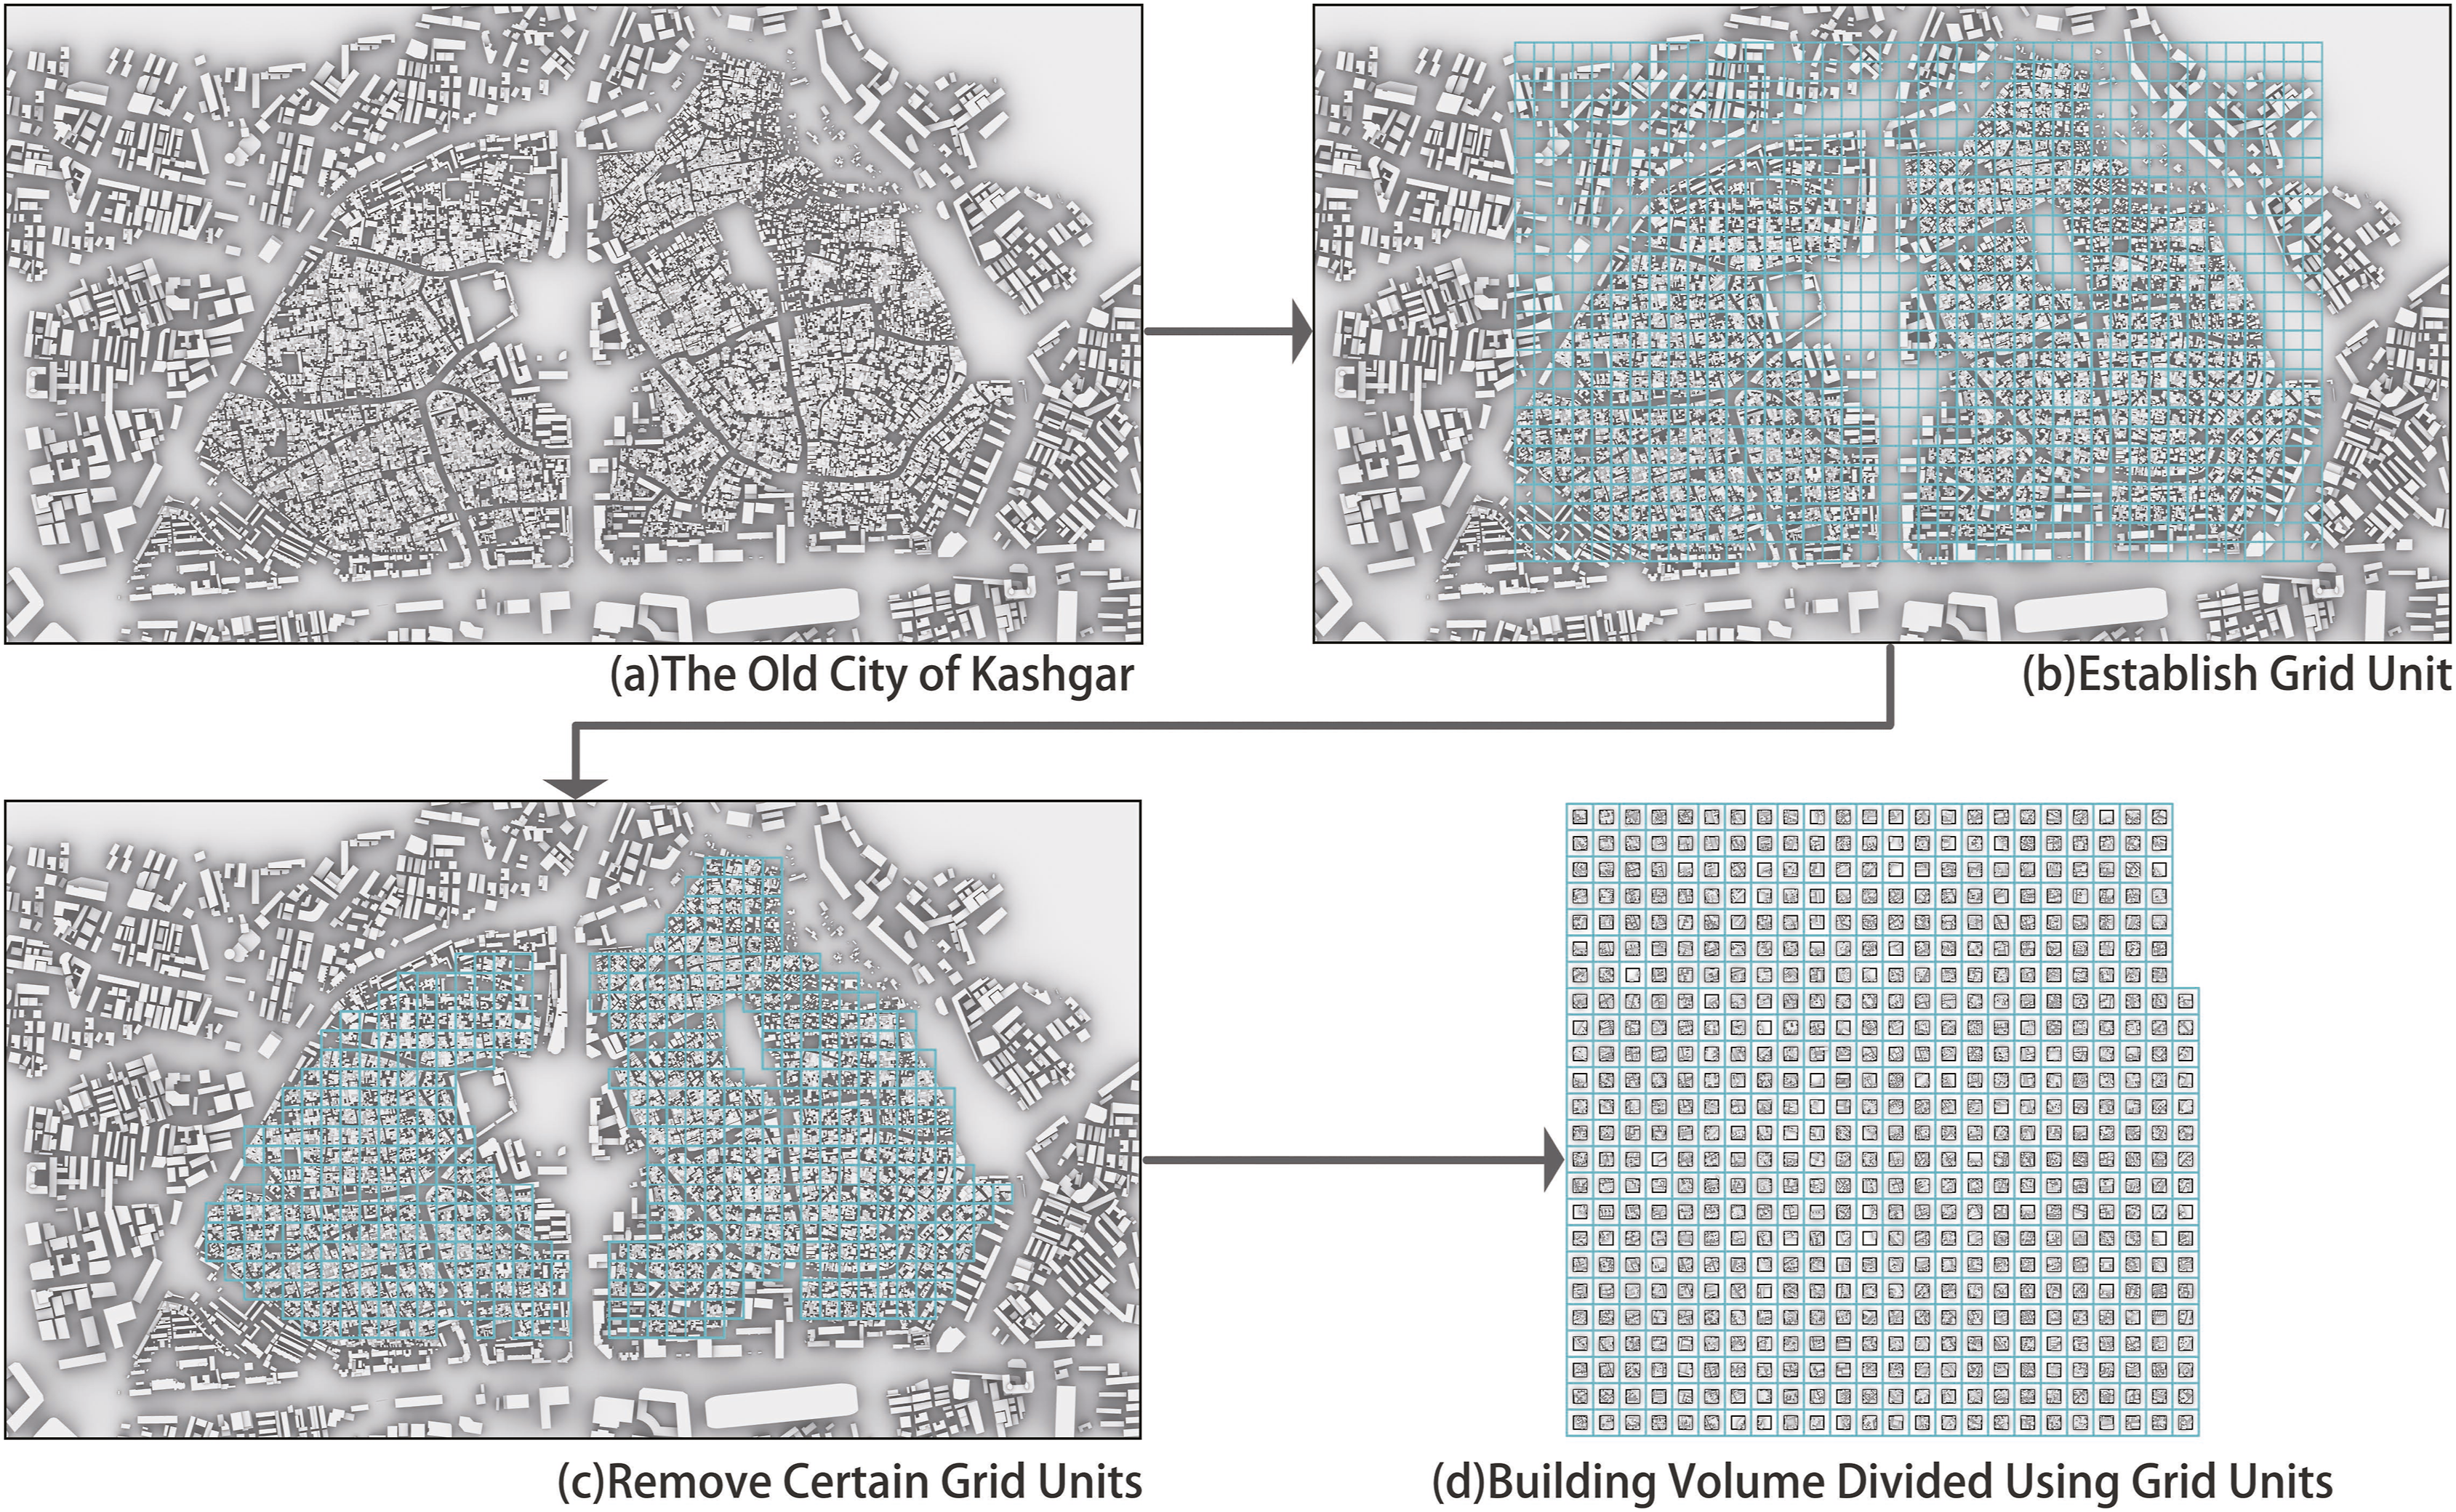
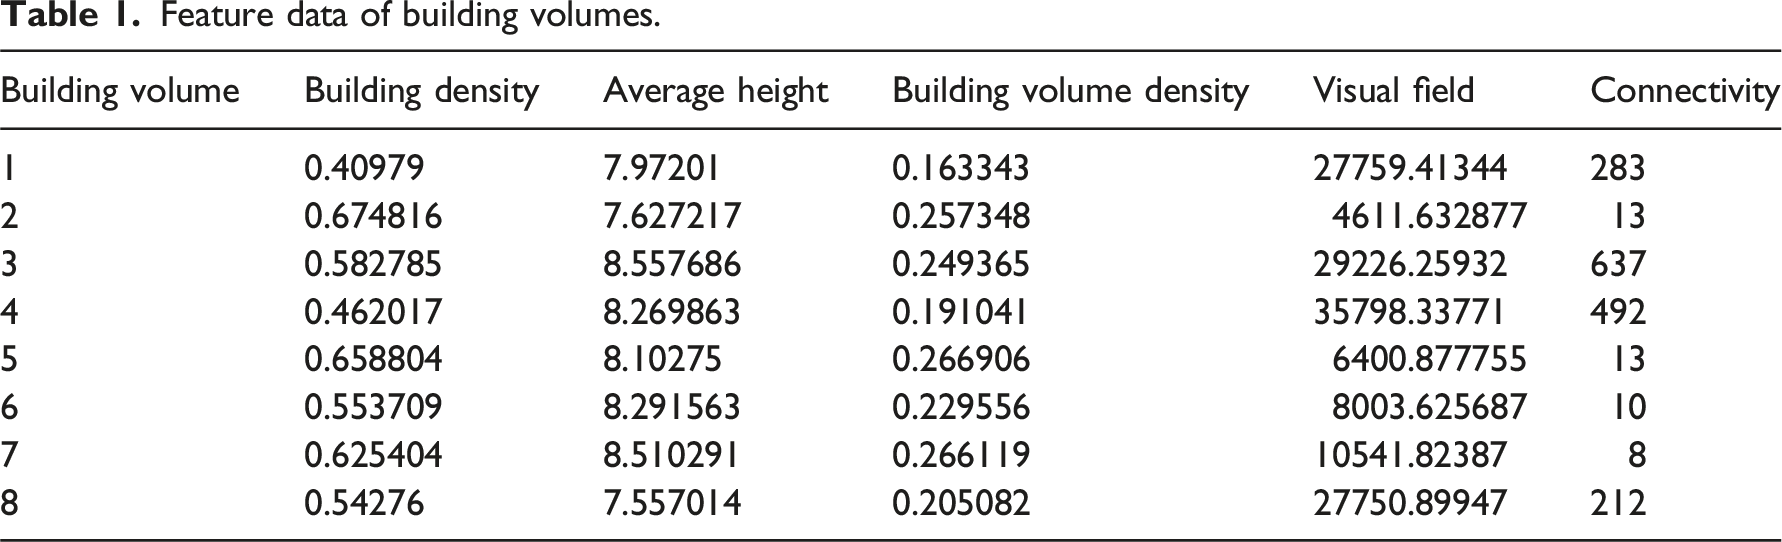
Calculation and classification of feature data for the study subject
Feature data of building volumes.
Feature data normalization and preprocessing
All computed feature data were initially normalized, mapping each feature’s range to a scale between 0 and 1. This step eliminates dimensional differences between features, ensuring the data can be compared uniformly. Normalization improves clustering accuracy and comparability by minimizing bias caused by large discrepancies between features. After normalization, the data is standardized, reducing the potential for bias in the clustering process.
Application of K-means clustering algorithm
The K-means clustering algorithm was then applied to categorize the feature data. K-means is a distance-based clustering method that groups data by iteratively optimizing cluster centroids. This study used SPSS software to implement the K-means algorithm and process the feature data. To ensure diversity and even distribution in the classification results, the number of clusters was set between 4 and 12. After experimenting with different numbers of clusters, nine results were obtained, shown in Figure 7(a)–(i). To ensure each category had sufficient samples and avoid training models with insufficient data, categories with fewer than 50 samples were removed from the analysis. Clustering results (a-i) and the standard deviation of each result (j).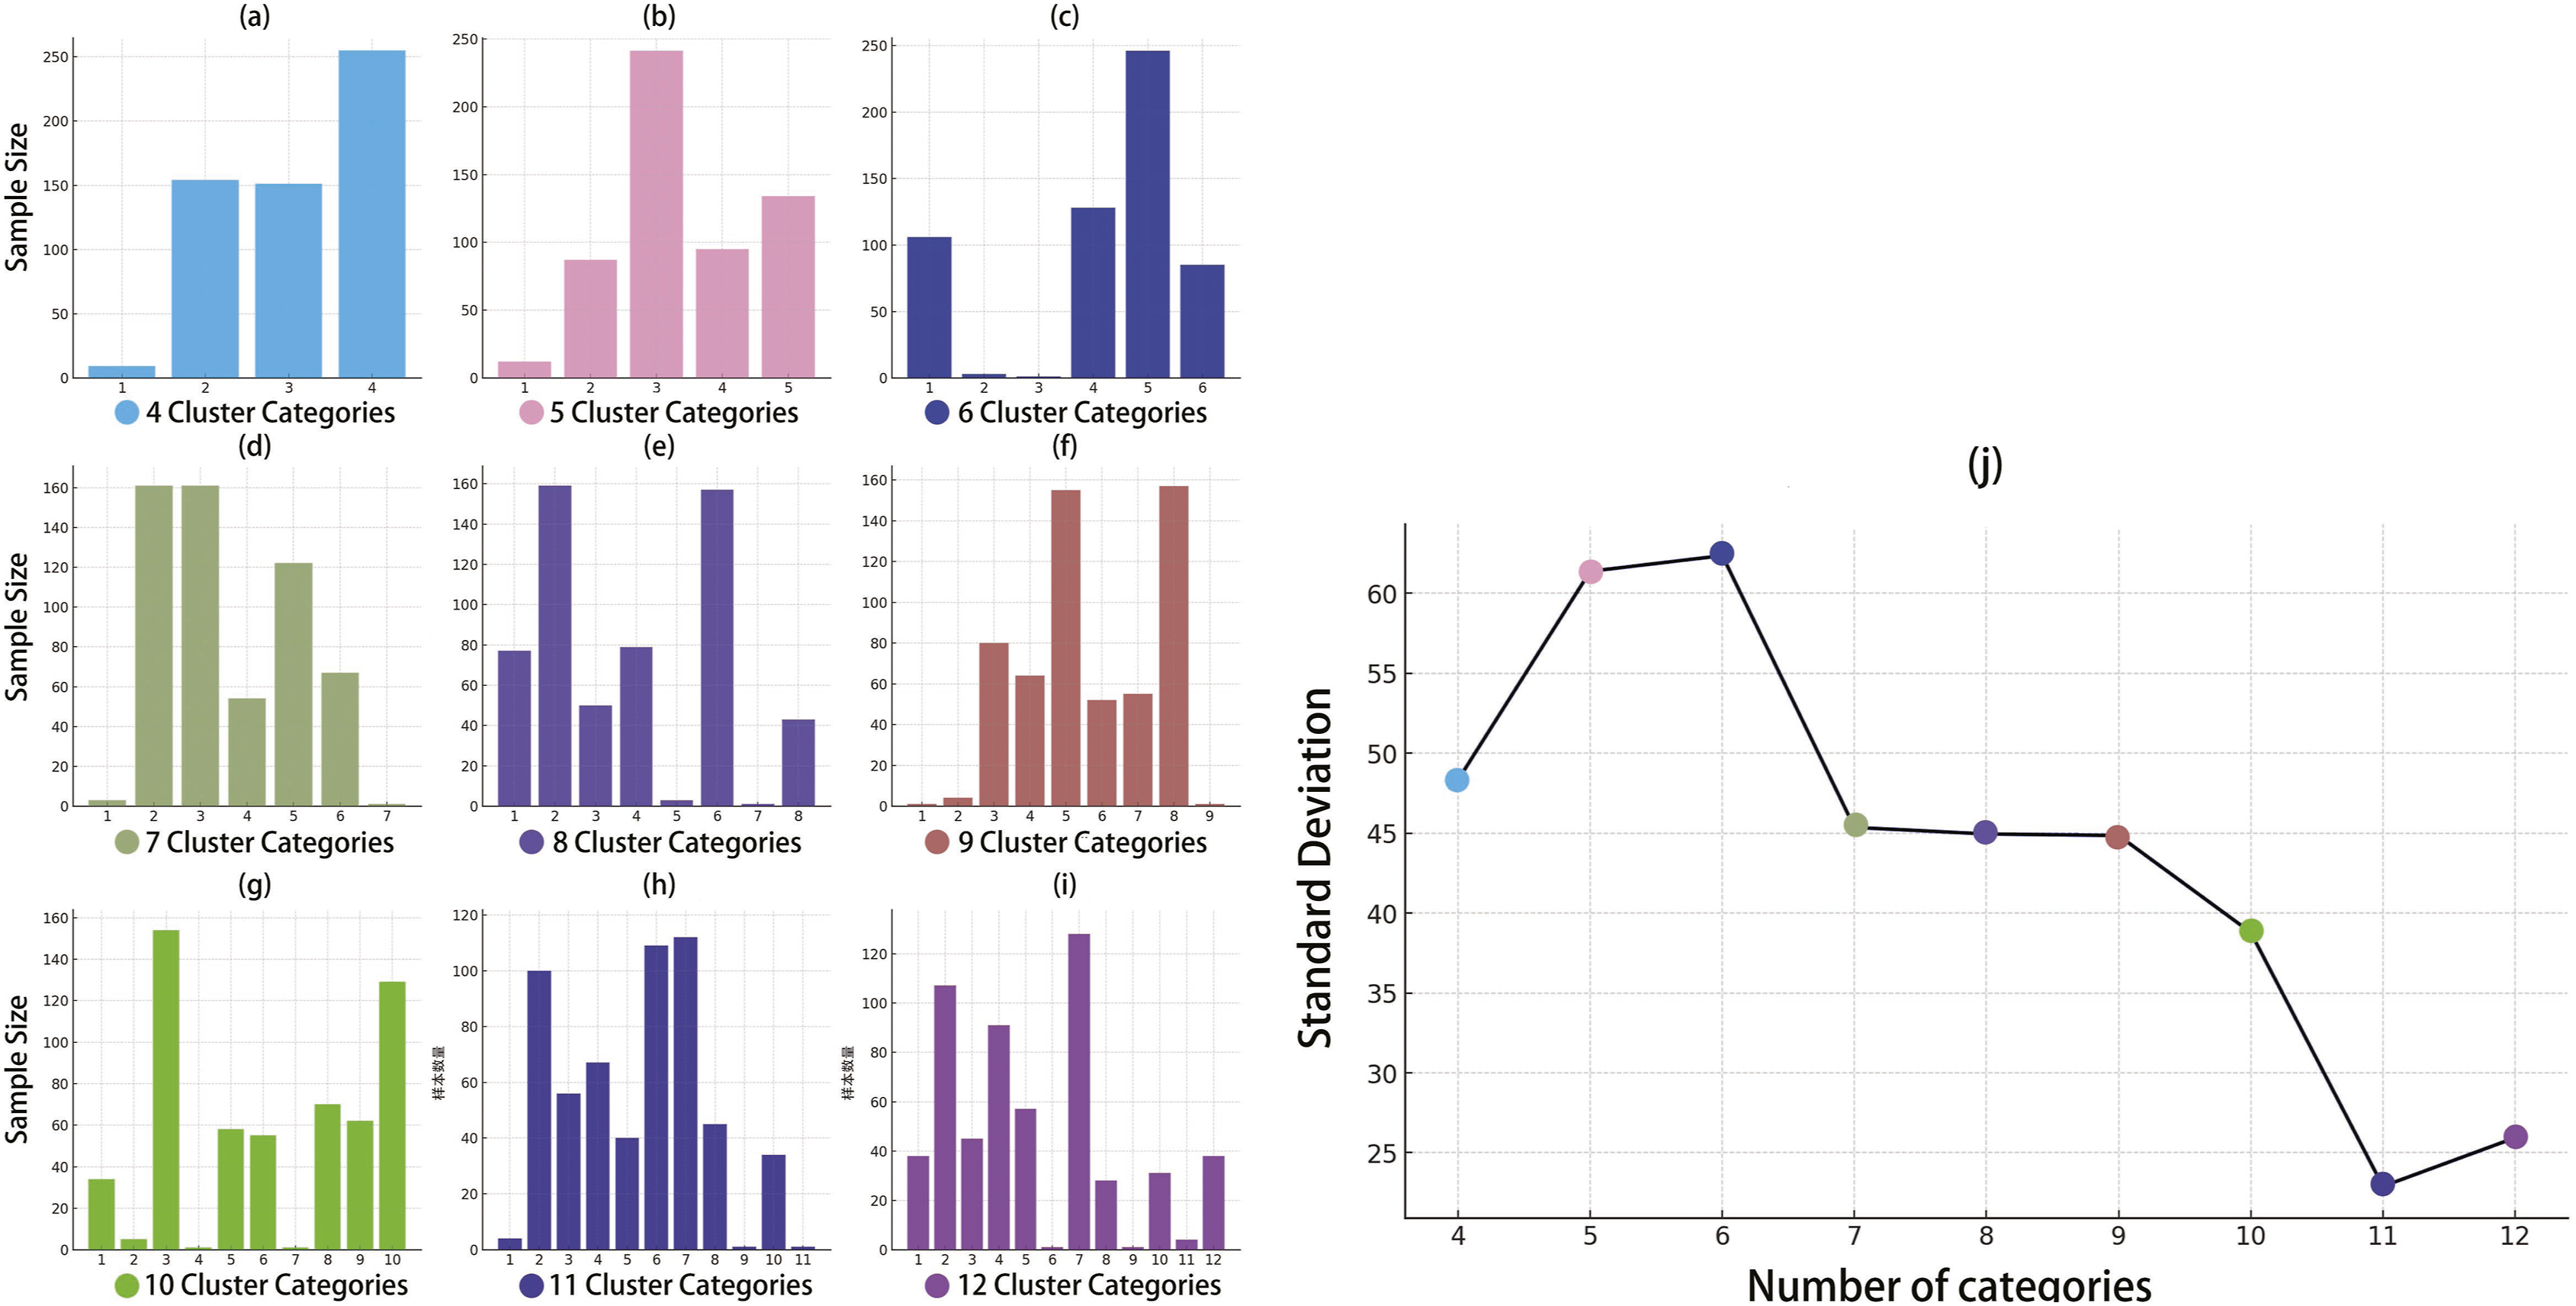
Standard deviation analysis and category selection
The standard deviation of the remaining sample sizes in each category was calculated to assess the uniformity of the clustering results. The standard deviation reflects how evenly the samples are distributed within each category: the smaller the standard deviation, the more uniform the distribution. By comparing the standard deviations of the nine clustering results in Figure 7(j), the result with the smallest standard deviation was selected. This outcome indicated that the samples within each category were distributed more evenly, making it more suitable for subsequent model training. Although the standard deviations of the 10, 11, and 12-cluster results were smaller, these would have removed more samples. Therefore, the clustering result with 9 categories was ultimately chosen. After filtering, six clusters were retained, providing a more diverse set of categorical labels for the subsequent model training.
Category label assignment and data visualization
To visually present the clustering results, the building volume samples from each grid cell were visualized in 3D space and assigned category labels, as shown in Figure 8. This approach clearly illustrates how the building volume data is distributed across different categories within each grid cell. The clustering analysis revealed the distribution characteristics of building volumes across the categories, as shown in Figure 9. Specifically, category 1 features high average height and building volume density. Category 2 shows relatively high building density, building volume density, and average height, but its visual field is the lowest, possibly representing areas with dense buildings that lack visual connectivity. Category 3 has a lower average height but higher building volume density, suggesting compact, low-rise buildings. Category 4 exhibits lower building and volume density and average height but a higher visual field, likely indicating low-rise areas with strong visual connections. Category 5 shows high average height and visual field but lower building and volume densities, suggesting sparsely distributed high-rise buildings with good visual connectivity. Finally, category 6 displays lower average height but slightly higher building and volume density, indicating densely packed low-rise buildings. In conclusion, the clustering analysis provides a clear categorization of building volume feature data and reveals the spatial distribution characteristics of each category’s building volume. These results offer valuable data for the subsequent model training and serve as a crucial reference for analyzing the building volume characteristics in the study area. Assigning cluster categories to each building volume in unit grid space. Assigning cluster categories to each building volume in unit grid space.

Selection and preprocessing of study subject
Datasets preprocessing
The LSTM model architecture.
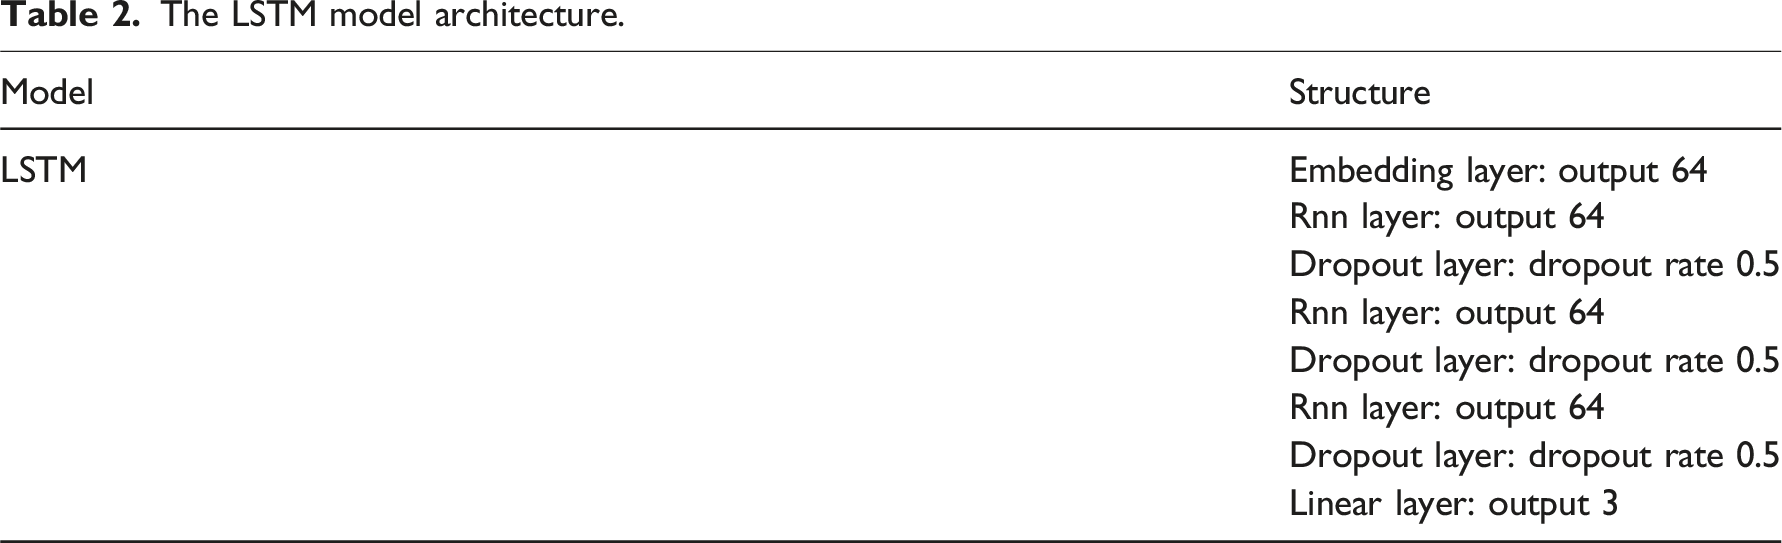
The LSTM model learns from point cloud data across different categories. The network parameters are optimized by minimizing the loss function, resulting in six LSTM networks, each trained for one of the six clustering categories. Throughout the training, the LSTM networks learn the temporal dependencies of the point cloud coordinates. The networks generate new point clouds based on the training data, where each point contains spatial coordinates (x, y, z).
In this study, the LSTM model was trained for 6 rounds, with 500 epochs per round, corresponding to 6 clustering categories. The changes in training loss, validation loss, training accuracy, and validation accuracy were recorded, as shown in Figure 10. At the beginning of each training or prediction cycle, the LSTM’s initial state was set to zero to ensure the stability of the training process. This setting ensured the model started each iteration with consistent initial conditions, promoting an effective learning process. The training results show a steady decline in average training loss and validation loss over the 6 rounds. The training loss decreased from an initial value of 0.7 to approximately 0.2 and stabilized in the final epochs. The validation loss decreased from 0.7 to around 0.3. Both losses exhibited a smooth decrease and leveled off in the later epochs, indicating that the model was gradually converging. The average training and validation accuracy showed a clear upward trend, with the training accuracy rising more quickly. The training accuracy increased rapidly from 0.2 to nearly 0.8, while the validation accuracy rose from 0.2 to about 0.7. Although some fluctuations occurred, training and validation accuracies consistently improved, indicating that the model continuously optimized and gradually improved its data-fitting capability. The experimental results confirm that the LSTM network can predict coordinates, enabling reliable data augmentation. Using LSTM for data augmentation, this study significantly increased the diversity and richness of the dataset, generating 540 distinct 3D point cloud models from different clusters. The loss and accuracy of LSTM model.
These generated point clouds differ in structure and distribution from the original data, significantly enhancing the diversity of the dataset. The data augmentation process consists of the following steps: (i) Input Seed Data: The model selects a seed sample from the existing point cloud data (e.g., a point cloud from the training set). (ii) Generate New Data: The LSTM model progressively generates new point cloud data using the learned temporal patterns. At each step, the model predicts the next point’s coordinates based on the current point’s coordinates, continuing until a complete point cloud is generated. (iii) Expand Dataset: The newly generated point cloud data is added to the original dataset, increasing the sample size and data diversity and enhancing subsequent generative models’ training effectiveness.
Generative model construction
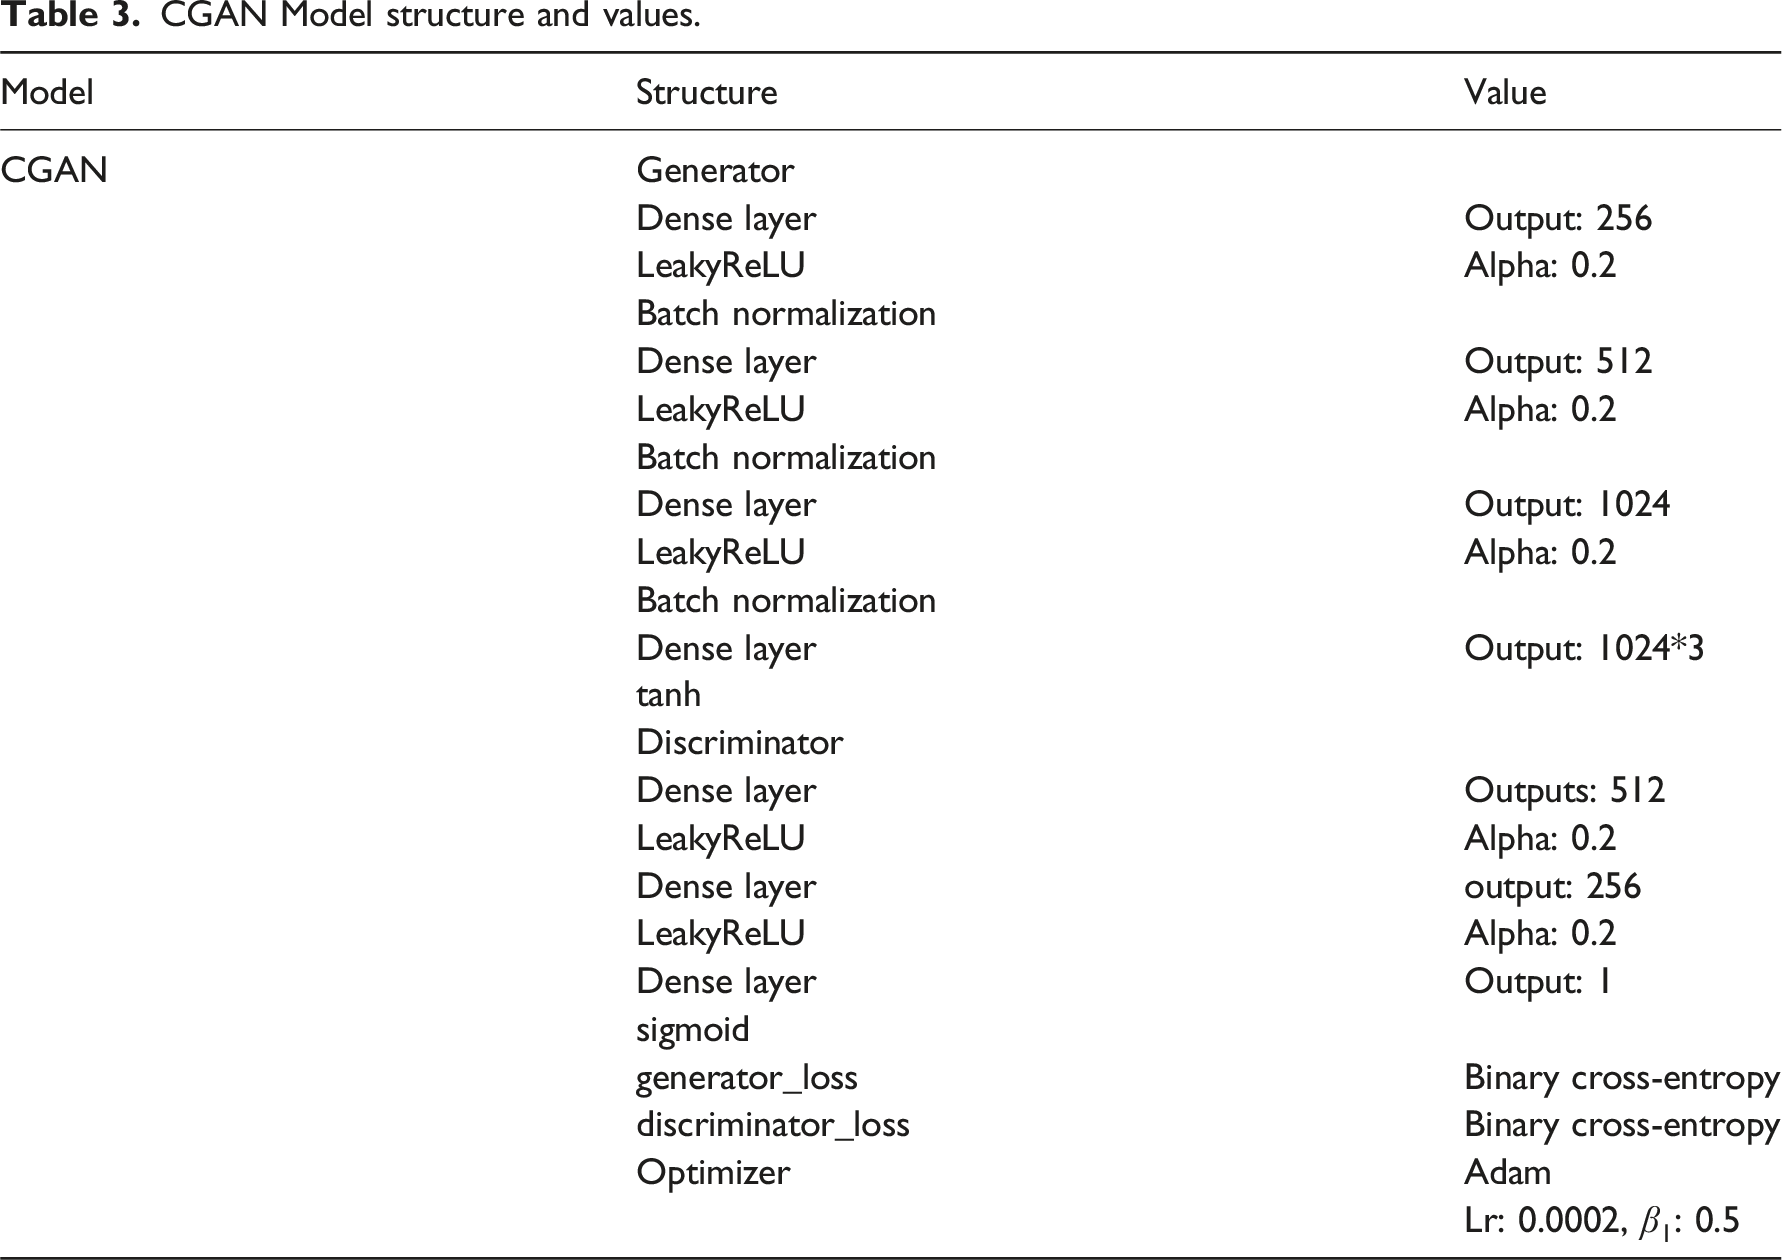
CGAN Model structure and values.
The generator
This integration effectively combines the strengths of both models—GAN’s ability to generate complex data distributions and DDPM’s advantage in producing high-quality details-resulting in more realistic and diverse point cloud models. The generative model were optimized using the Adam optimizer. During model training, the number of epochs is set to 1000. The number of augmented samples is 1109. Ninety percent of the model data is designated as the training dataset, while the remaining 10% is used as the validation dataset. The best-performing model is obtained after nine training rounds, each consisting of 1000 epochs, as shown in Figure 11. Its features include a mean training loss of 0.1078, mean training accuracy of 93.8825%, mean validation loss of 0.2123, and mean validation accuracy of 89.2575%. After multiple training rounds, the training loss of the final trained model stabilized at approximately 0.1 by epoch 176, and the validation loss stabilized at approximately 0.1 by epoch 189, as shown in Figure 11. The training accuracy reaches 95% by epoch 152, and the validation accuracy reaches 90% by epoch 163, as shown in Figure 11. The model’s loss values and accuracy quickly stabilize due to the extensive training over the previous epochs. The loss and accuracy of generative model.
Validation of generative model
First, using the building volumes of all grid unit spaces, six sets of building volume point cloud models were generated by specifying six category labels as input conditions. As shown in Figure 12, the first row displays the category labels, and the second row shows the six sets of building volume point cloud models generated based on these conditions. Each set contains 569 grid unit building point cloud models. The average height, building density, and point cloud count of the building point cloud model in each grid unit space are extracted and compared. As shown in Figure 13, regarding average height, Labels 1, 2, and 5 have higher average heights than Labels 3, 4, and 6. For building density, Labels 2 and 3 have higher building densities than Labels 1 and 6, while Labels 4 and 5 have the lowest densities. For point cloud count, Label 2 has more point clouds than Labels 1 and 3, and Labels 1 and 3 have more than Label 6. Labels 4 and 5 have the fewest point clouds. These differences are consistent with the category differences in the original building volume feature data. Generated six different sets of building volume point cloud models based on different category labels. Comparing the feature data of Generated six different sets of building volume point cloud models.

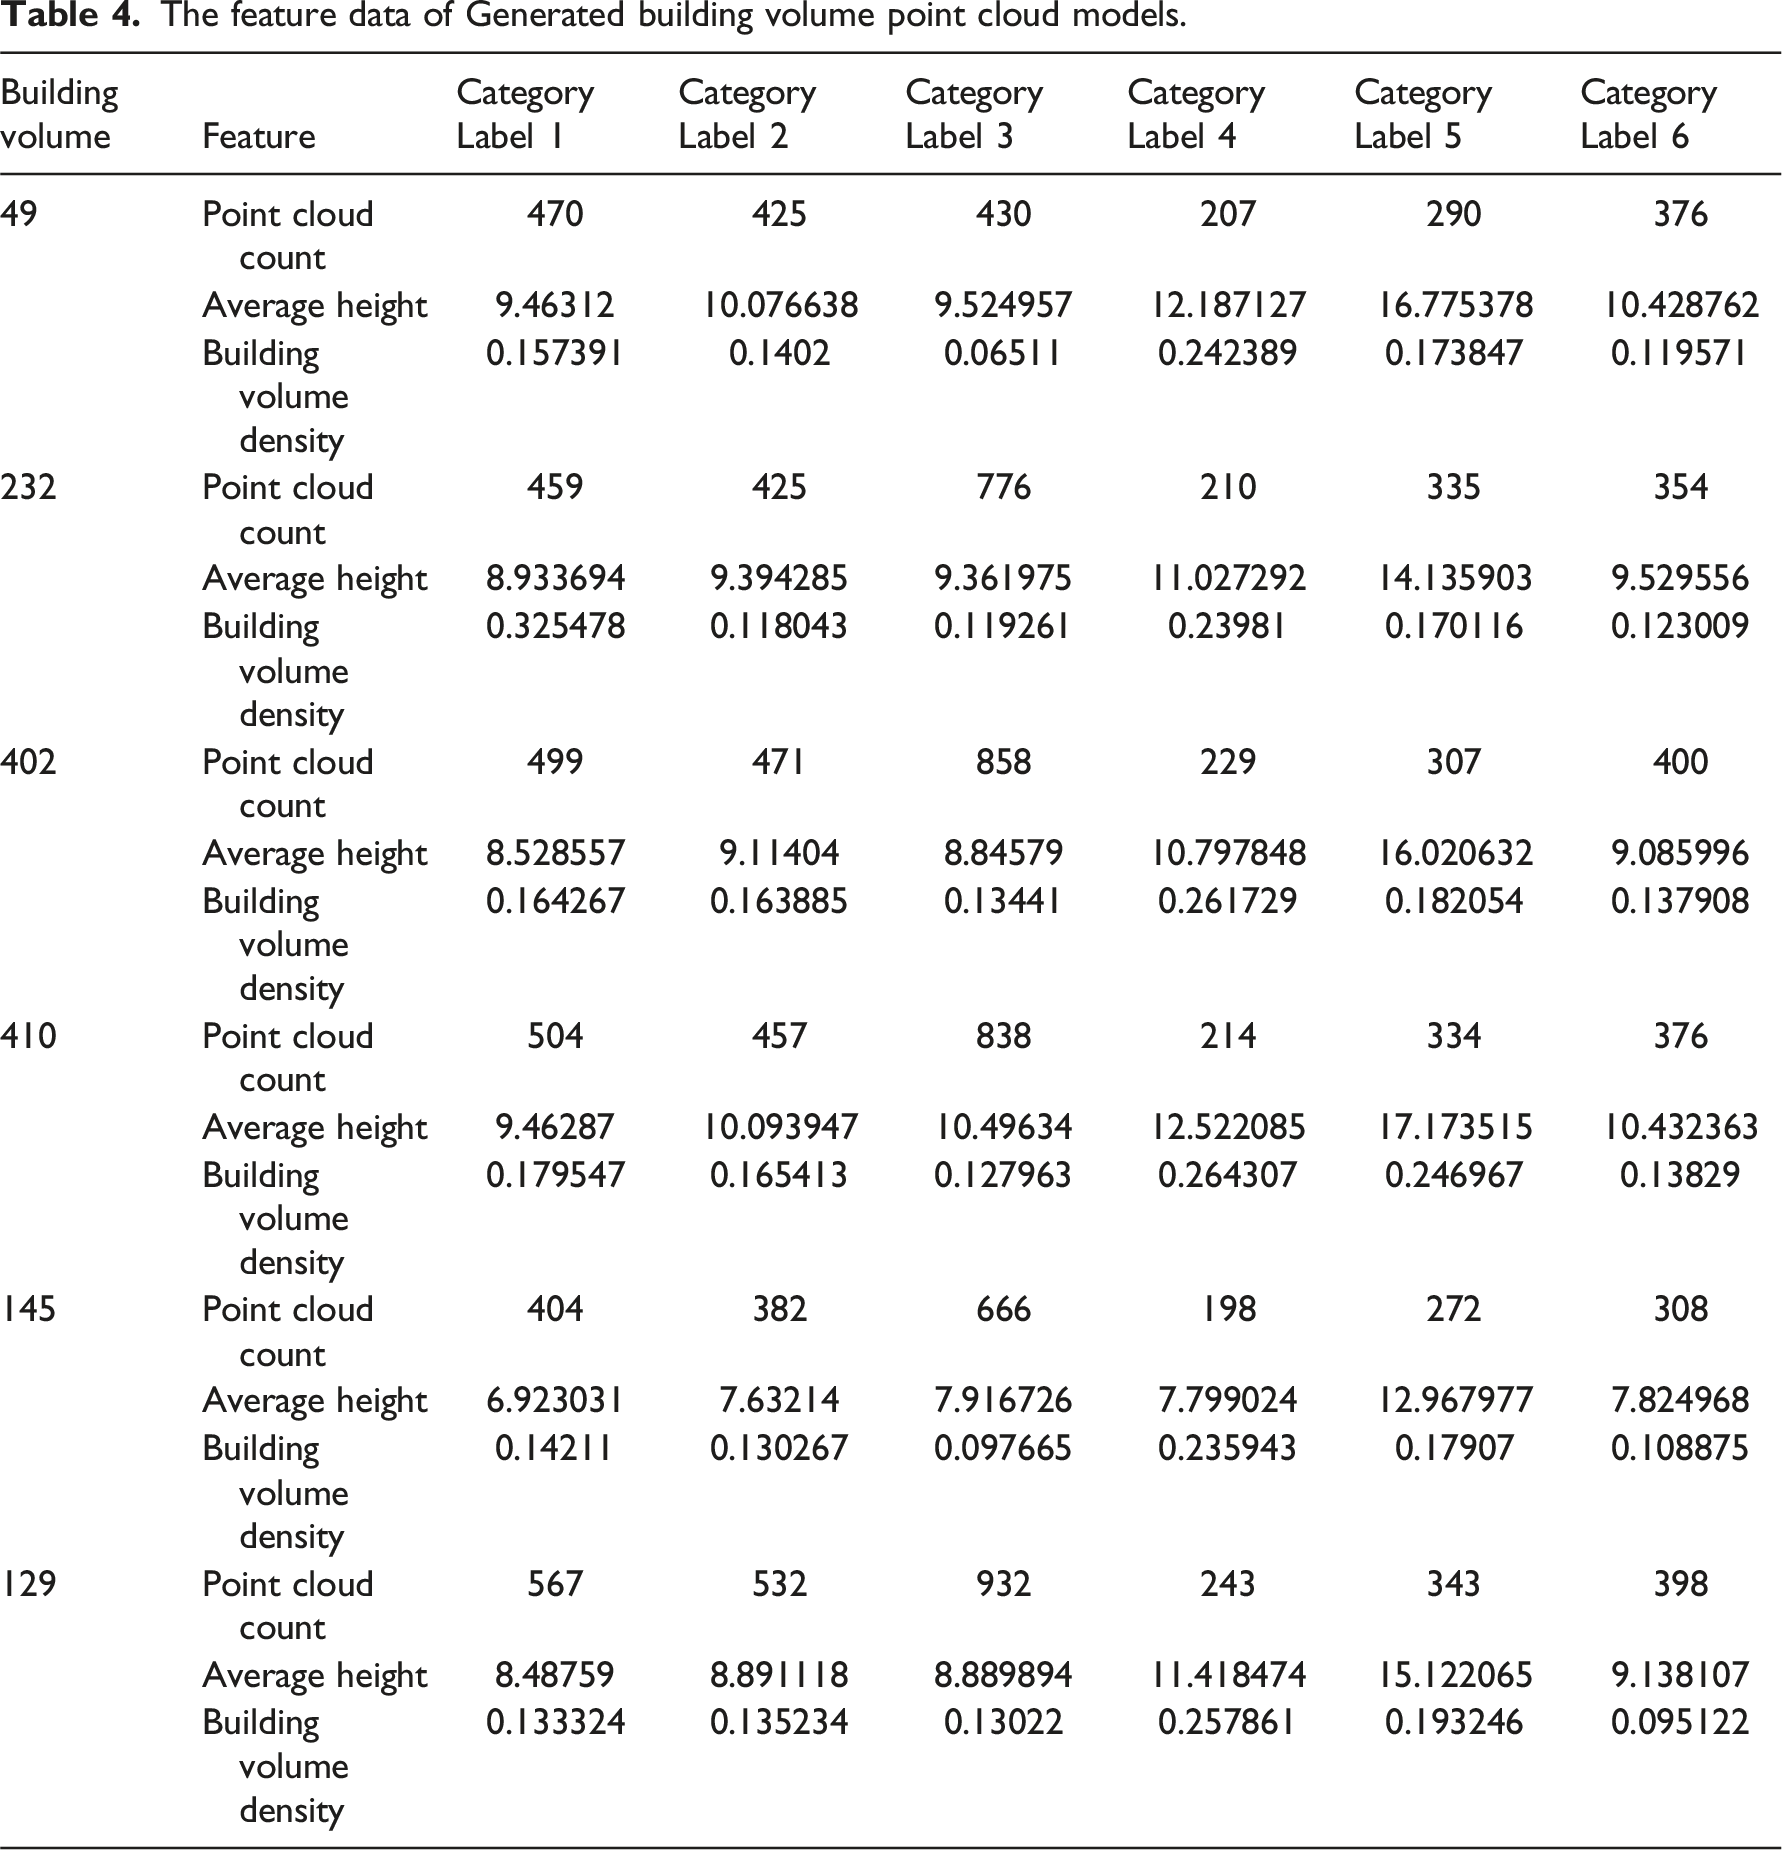
To further validate the model’s generative capability, a specific grid unit space’s building volume and six des-ignated category labels were used as input conditions to generate six building volume point cloud models. The gen-erated point cloud models with different clustering label features were then compared. As shown in Figure 14, the first row displays the grid unit indices, and the first column indicates the input category labels. The building point cloud models are generated based on different category labels, thus exhibiting varying features. Generated building volume point cloud models based on different category labels.
The feature data of Generated building volume point cloud models.
Design applications
The generative model based on CGAN and DDPM proposed in this study has practical applications in urban planning and architectural design. By generating building volume point cloud models that meet specific conditions, the model provides new solutions for tasks such as spatial optimization, rapid sketch generation, and heritage preservation. In urban planning, the generative model can improve urban layouts. For instance, in urban renewal high-density historic districts, planners can train the model using specific labels and point cloud data. Once trained, the model can generate building point cloud models with corresponding characteristics, such as high-density or low-height categories, to simulate reasonable spatial layouts. In architectural design, the generative model enables the rapid creation of diverse initial sketches, offering advantages, especially in renovation or expansion projects. Designers can input specific category labels (e.g., “3”, “4”, ”5”) to generate building point clouds with corresponding features, as shown in Figure 15. These generated models preserve the original architectural characteristics while incorporating new design elements. Moreover, in heritage preservation, the generative model combines conservation with innovation. By using point cloud data from existing historic buildings, the model generates point cloud models that preserve the original appearance while meeting new functional requirements, supporting adaptive reuse in heritage conservation. Although the generated point cloud models reflect the category characteristics to some extent, post-processing is still required in practical applications. For example, noise removal or form completion may be necessary to enhance the model’s detail expression capabilities. In this study, the generated point cloud models were integrated using Rhino software tools to provide designers with design solutions. Point cloud models generation based on feature labels.
Overall, the generative model presented in this research provides a novel approach to urban planning and architectural design by quickly generating diverse building point clouds. This approach shortens design time and improves the reliability and scientific basis of the design process. Additionally, the model shows significant potential for cross-disciplinary applications. These include simulating street network configurations, exploring urban renewal scenarios, and preserving the integrity of historic districts. Future research will focus on improving the model’s generation accuracy, optimizing point cloud density, and enhancing detail expression to better meet the demands of practical applications.
Discussion
This paper addresses the challenge of generating building volumes within urban districts by proposing an integrated generative approach combining CGAN and DDPM. The efficacy of this strategy is demonstrated through case analysis, with the discussion focusing on several key aspects, including comparative evaluation of results, the broader implications of the findings, generalizability, and critical considerations.
The classification methodology based on building volume features reveals that different categories of building volumes exhibit substantial morphological differences, whereas volumes within the same category display pronounced similarity. These findings underscore the effectiveness of the proposed classification approach in capturing the essential spatial and morphological attributes of urban building volumes, thereby facilitating the training of generative models. The integration of CGAN and DDPM for generating building volume point cloud models synergistically harnesses the advantages of both models—CGAN’s adeptness at handling intricate distributions and DDPM’s capability to generate high-fidelity details. This integrated approach results in diverse and realistic generated models, marking a notable advancement in the study of urban morphology.
While this research specifically focuses on the Old City of Kashgar, the proposed methodology and generative model exhibit potential applicability to other cities or regions characterized by distinct urban morphologies. The framework for classification and model generation can be adapted with relatively minor modifications to reflect local urban characteristics, thereby underscoring its versatility for broader applications. Beyond generating building volumes, this generative model can be applied to other urban planning and architectural design tasks, such as optimizing street network configurations, simulating urban infill scenarios, and designing adaptive reuse of existing structures. For example, the model could be used to propose new layouts that maintain the historical integrity of heritage districts while accommodating modern needs. Such adaptability is crucial, as it highlights the potential for the proposed approach to be generalized beyond a singular case study, extending its applicability to diverse con-texts within urban research and practice.
Beyond a descriptive account of the results, this study offers a nuanced analysis of the generative model’s performance. The alternating training regimen of CGAN and DDPM significantly enhances the quality of the generated point cloud models. The experimental outcomes demonstrate that the model achieves both morphological diversity and realistic detailing, attributes that are essential for practical urban design and planning applications. Nevertheless, there are inherent limitations to this study, including a limited set of building volume features, the sparse morphology of point clouds, and challenges associated with training convergence. These factors may limit the model’s adaptability and generalizability. Future research should focus on incorporating additional features and optimizing the neural network architecture to mitigate these limitations.
The findings presented in this discussion align with the research objectives outlined in the introduction and the literature review. The discussion effectively links the results to the overarching goals of improving generative mod-el quality and establishing a comprehensive classification framework for urban building volumes. This coherence and logical progression enhance the overall contribution of the study to the field of urban morphology research.
Conclusion
In conclusion, this study proposes a generation strategy that integrates CGAN and DDPM models for generating building volumes in urban areas. The classification method and generative model effectively produce diverse and high-quality building volume point cloud models. The alternating training approach of CGAN and DDPM fully leverages the advantages of both models. The proposed workflow can serve as a foundation for further studies on urban morphology generation and the development of automated urban design tools. The method has broad application potential in real-world scenarios such as urban planning, heritage preservation, and architectural design, offering a novel approach to preserving unique urban features while expanding and transforming urban areas.
However, this study has several limitations. First, the building volume features are quite limited, restricting the model’s generalizability to other urban contexts. The architectural styles, layouts, and functional diversity in different cities vary significantly, and the current model may underperform when dealing with these variations, making it difficult to meet the specific needs of different cities. Second, the generated point clouds are relatively sparse, which somewhat affects the accuracy and expressiveness of the model in practical applications. Sparse point cloud data may not fully capture architectural details, resulting in deficiencies in detail restoration and the representation of complex structures. Furthermore, some convergence issues observed during the training of complex models indicate that the model’s learning ability and stability still need further optimization. These issues may stem from the limited size of the dataset, which causes the model to overfit, thus affecting its performance on unseen data.
Future research should focus on the following areas to overcome the current limitations and improve the model’s performance: (i) Expanding the range of building volume features: The features used in the current study are limited, primarily focusing on basic geometric parameters such as height, volume, and shape. Future studies should incorporate more diverse architectural features, such as building styles, functional types, and structural complexity, to enhance the model’s generalization ability. While the current study mainly focuses on geometric parameters, cities differ significantly in architectural style, layout, and material choices. By including more feature dimensions, the model will be better suited to various urban forms and design requirements, thereby improving the applicability and accuracy of the generative model. (ii) Increasing point cloud density: The generated point clouds are relatively sparse, limiting the model’s ability to restore details and represent complex structures. To improve the model’s performance in detail restoration and complex structure expression, future research should focus on increasing the density of the point clouds. By using higher-resolution data acquisition methods and optimizing generative algorithms, it will be possible to produce denser point cloud data without compromising training efficiency. Additionally, adopting multi-scale generation strategies and post-processing techniques will help improve the richness and overall expressiveness of the point clouds, meeting the practical need for high-precision data. (iii) Optimizing the neural network architecture: Convergence issues during training affect the stability and quality of the generated models. Optimizing the neural network architecture is key to improving the model’s learning ability and stability. Future studies should enhance the model’s expressive power and feature extraction efficiency by increasing the number of network layers, adjusting the network structure, and incorporating attention mechanisms. Moreover, exploring different activation functions, regularization methods, and conducting systematic hyperparameter optimization can effectively address convergence issues during training and improve the quality and diversity of the generative model. (iv) Enhancing model robustness: To improve the model’s applicability and reliability in different urban environments, future research should focus on enhancing its robustness. This can be achieved by introducing regularization techniques, employing data augmentation methods, and expanding the dataset size. At the same time, utilizing transfer learning and domain adaptation techniques will help mitigate the impact of data distribution differences between cities, ensuring the model remains stable across diverse environments. These measures will effectively reduce overfitting risks and improve the model’s performance in real-world applications. (v) Training and validation on cross-city datasets: To comprehensively assess the model’s generalizability, future research should train and validate the model on cross-city datasets. By constructing a diverse dataset containing building point cloud data from multiple cities and adopting joint training and stratified validation strategies, the model’s adaptability to different urban features can be improved. Additionally, combining domain adaptation techniques with targeted optimization methods will ensure the model’s high applicability and reliability in various urban environments. This will provide more accurate and diverse generative tools for urban planning, heritage preservation, and architectural design.
Footnotes

Acknowledgments
The authors express their gratitude to Han Wang, a Master’s student at the School of Architecture, Tianjin University, for providing partial data support used for experiments.
Declaration of conflicting interests
The author(s) declared no potential conflicts of interest with respect to the research, authorship, and/or publication of this article.
Funding
The author(s) disclosed receipt of the following financial support for the research, authorship, and/or publication of this article: this work was supported by the the Tianjin Municipal Philosophy and Social Science Planning Project: TJJX15-007.