



Abstract
Objective:
To evaluate the effectiveness and safety of a mobile application for carbohydrate counting and bolus calculation (CHOC-BC) in adults with type 1 diabetes mellitus (T1DM).
Research Design and Methods:
A 12-week randomized controlled trial was conducted at King Fahad Medical City, Riyadh, Saudi Arabia. Adults with T1DM on multiple daily insulin injections and using Libre 2 glucose monitors were randomized to either CHOC-BC or conventional treatment. The primary endpoint was time in range (TIR; 70–180 mg/dL).
Results:
A total of 127 participants (70 females) were included: 64 in the intervention group and 63 in the control group with a mean age of 26.56 ± 4.8 and 26.74 ± 6.52 years, respectively. After 3 months, the intervention group achieved better TIR than the control group (51.20% ± 11.61% vs. 46.17% ± 13.02%; mean difference [MD], 5.03; 95% confidence interval [CI], 0.70–9.36; P = 0.023). Application users showed a significant reduction in level 2 time above range (17.25% ± 11.61% vs. 24.10% ± 15.74%; MD, −6.85; 95% CI, −11.70 to −1.99; P = 0.006). No significant differences were observed in body weight or time below range.
Conclusions:
The CHOC-BC mobile application empowered users to achieve better glycemic control while maintaining a safe profile that avoids hypoglycemia and weight gain.
This is a visual representation of the abstract.
Keywords
Introduction
Type 1 diabetes mellitus (T1DM) is the most common chronic disease in children and young adults. 1 It accounts for approximately 2% of diabetes cases worldwide, affecting around 9 million individuals. 2 To control glycemic levels, insulin, a balanced diet, and regular physical exercise are required. 3 The carbohydrate counting (CHOC) method is considered the most reliable strategy for insulin dose estimation relative to meals 4 as it allows greater flexibility in diet and reduces disease burden.5,6
CHOC was adopted in early landmark studies, such as the DCCT, positively impacting glucose control,7,8 while also facilitating dietary freedom and better quality of life. 9
Unfortunately, in clinical practice, regular use of CHOC among T1DM is challenging, which might impact blood glucose control and variability. 10 CHOC is often considered a difficult task for patients, as it requires multiple glucose assessments, carbohydrate estimation in homemade meals, precise reading of food labels, and extensive education. 11 Over 59% of people with T1DM do not accurately quantify carbohydrates in their meals. 12 Moreover, approximately 50% of patients with diabetes consider CHOC the most challenging aspect of managing their disease. 13 As a result, CHOC and insulin dose calculation can be particularly difficult for patients, especially younger individuals.
The rapid advancement in technology has helped patients with DM to achieve better glucose control. 14 Continuous glucose monitoring (CGM) systems have become highly sophisticated, enabling more accurate blood glucose measurement while also predicting glucose trends and alerting users of potential hypoglycemia or hyperglycemia. 15 Additionally, coaching applications have also improved, enabling patients to calculate insulin doses more accurately. 14
The CHOC applications facilitate precise carbohydrate calculations for patients by allowing them to easily select the desired food and quantity, instantly computing carbohydrate content and insulin doses based on individual insulin-to-carbohydrate ratio (ICR) and insulin sensitivity factor (ISF). 16 Interestingly, people with T1DM believe that technology will improve the CHOC process. 17
The importance of technology in helping with CHOC has been shown in a study randomizing 168 adults with poor metabolic control to either a mental calculation group or an automated bolus calculator (ABC) group. The ABC, which calculates mealtime and correction insulin doses based on individualized parameters after users manually enter carbohydrate content, led to significantly greater hemoglobin A1c (HbA1c) reduction after 12 months compared with the mental calculation group. 18 Similarly, a study conducted in Denmark involving 51 adults with T1DM randomized to three groups, namely, Control (n = 8), CarbCount (n = 21), and CarbCountABC (n = 22) arms. After 16 weeks of follow-up, HbA1c levels were significantly lower in the CarbCount group than in the control group but did not differ significantly between the CarbCount and CarbCountABC groups. 7 These findings highlight the effectiveness of CHOC applications in optimizing glucose control.
The cumulative assessment of these studies has highlighted several limitations. First, there is a strong tendency toward using HbA1c for glucose monitoring, potentially at the expense of CGM systems and ambulatory glucose profile (AGP), a more advanced method for evaluating glycemic control patterns. 15 Second, the sample size in most studies was small. More importantly, none of the prior research has investigated the efficacy of mobile applications that combine CHOC and bolus correction. Therefore, our aim was to assess the effectiveness and safety of the CHOC and bolus calculation (BC) mobile application for glucose control among adults with T1DM.
Research Design and Methods
Study design
A randomized controlled trial (RCT) was conducted with two parallel groups. Individuals with T1DM were randomly assigned to use the CHOC-BC application (CHOC-BC intervention group) or conventional treatment (Control group). Computer-based randomization was used to allocate participants to either of the two groups. This study was conducted at the diabetes clinics in King Fahad Medical City (KFMC), Riyadh, Saudi Arabia. Ethical approval was obtained from the KFMC Institutional Review Board (IRB), log number 22-630. This trial is registered at ClinicalTrials.gov (Identifier: NCT06945744). Recruitment began on May 21, 2023, and the study was completed on December 21, 2023.
Study subjects
Individuals were assessed for eligibility at the Obesity, Endocrine, and Metabolism Centre. Eligible participants included males and females aged 18–60 years with a clinical diagnosis of T1DM for at least 1 year and HbA1c levels (>6.5% [48 mmol/mol]). Participants must be on multiple daily insulin injections, possess basic knowledge of CHOC, and actively use a mobile phone operating on iOS 13 or higher or Android 11 or higher. Furthermore, participants needed to be active users of the Libre 2 CGM system, with a sensor capture rate of at least 30%.
Exclusion criteria included individuals with limited literacy, insulin pump users, pregnant or breastfeeding women, individuals with ischemic heart disease, and those with multiple comorbidities where hypoglycemia could pose a significant risk. Participants unwilling or unable to comply with the study protocol or those following a very low-carbohydrate diet (<10% daily carbohydrate intake) were also excluded.
Sample size
Group sample sizes of 61 in the first group and 61 in the second group achieve 90% power to detect noninferiority using a one-sided, two-sample t test. Time in range (TIR) of the CHOC-BC in our setting is presumed to be more than the standard calculator, and the higher value of the mean is considered better in our hypothesis. Our noninferiority testing aims to conclude that CHOC-BC is not appreciably worse than the standard, with a noninferiority margin of 10 percentage points in TIR% compared with the standard manual CHOC. The true ratio of the means at which the power is evaluated is 1.00. The significance level (alpha) of the test is 0.05. The coefficients of variation of both groups are assumed to be 0.20. The equipoised sample of 70 cases for each arm was enrolled, with the due consent of the patient, to overcome the subsequent 15.0% attrition rate expected during the follow-up period. Patients were allocated to two parallel arms using a Microsoft Excel 16 random sequence generator calculator.19,20
Study protocol
During the initial clinic visit, eligible participants received a comprehensive explanation of the study rationale and completed informed consent forms. Data collection began with comprehensive baseline assessments, including participant interviews and physical measurements. These assessments covered the following: demographics, medical history, anthropometric measures, insulin doses, and detailed documentation of bolus and basal insulin doses, ISF, total daily dose, and ICR, if available. Blood samples were collected from both groups after a minimum of 10 h fasting period. Subsequently, the samples were analyzed for HbA1c and lipid profile, including low-density lipoprotein, total cholesterol, and triglycerides.
Flash glucose monitoring
The FreeStyle Libre version 2 sensor was used in this study, and glycemic data were collected from LibreView, including the primary outcome TIR (70–180 mg/dL). Secondary outcomes included time above range (TAR; >180 and >250 mg/dL), glucose variability, defined as coefficient of variation, average glucose (mg/dL), glucose management indicator (GMI%), and HbA1c. Additionally, time below range (<70 and <54 mg/dL), number of the low-glucose events, and body mass index (BMI) were recorded to ensure the safety of the application. Libre data over 2 weeks before randomization were used as baseline. CGM-derived TIR and TAR were also analyzed bimonthly over 3 months to evaluate early changes in glycemic control in the intervention group. This frequent analysis facilitated close monitoring of participants’ progress and the early detection of potential application-related effects on glucose management.
Participants in both groups used a Libre glucose flash meter for at least 2 weeks before randomization and continued for at least 2 weeks after the intervention group started using the application. To minimize the risk of hypoglycemia, participants were instructed to check their glucose levels before each meal, 2 h after meal and 3 h after the meal.
Dietary management plan
The study involved a comprehensive intervention led by a registered dietitian (principal investigator) who individually educated participants on personalized nutritional plans. The control group used mental CHOC calculations and correction boluses. The clinical dietitian reviewed the concepts of CHOC and reviewed the existing ICR and ISF for both groups. The intervention group received education on CHOC-BC mobile application. Both groups were offered the chance to contact the clinical dietitian to relay inquiries about the CHOC.
Additionally, the clinical dietitian reviewed and recalculated each participant’s ICR using the formula 500/TDD 5 and ISF using the formula 1700/TDD 21 or continued with the previous calculations if the participant already had them. Any inconsistencies between participant- and clinical dietitian-calculated values were discussed and reconciled as per physician recommendations.
CHOC-BC mobile application
The CHOC-BC mobile application was developed by a team of endocrinologists and registered dietitians in collaboration with information technology. Carbohydrate content for unlabeled foods was obtained following the American Dietetic Association’s guidelines, 22 whereas data for restaurant food were derived from official sources. The application also features over 700 different types of foods. To ensure validity, the application was evaluated by two expert clinical dietitians working at CHOC and the diabetes clinic in KFMC as part of the IRB approval process. This user-friendly application guides participants through a step-by-step process for calculating insulin boluses. Initially, it requires participants to input their individual ICR, ISF, and target blood glucose levels. For enhanced safety, the application utilizes preset ranges for these values to prevent potentially harmful miscalculations. Acceptable ranges were 20–100 mg/(dL·unit) for ISF, 5–50 g/unit for ICR, and 120–200 mg/dL for target blood sugar level. All entered data were stored within the application with the option for later editing if needed.
Next, participants input their current blood glucose readings. To prevent hypoglycemia and hyperglycemia, the application automatically rejects values outside the acceptable range (below 80 mg/dL or above 500 mg/dL). It prompts users to correct their blood sugar level before using the application. Finally, users select their desired food items from a predefined list or search for specific items using the search function. Selected items are added to a virtual basket. Upon pressing the “Basket” button, the application calculates the total insulin dose required, including separate values for carbohydrate and correction doses, and presents detailed information for each parameter.
To promote participant understanding and ensure safe application utilization, a clinical dietitian guided participants through various meals using the CHOC-BC application during clinic visits. The duration of education sessions varied between 1 and 2 h, tailored to each participant’s knowledge and learning pace. At the end of the visit, the participants in both groups received detailed instruction sheets via WhatsApp for future reference (Supplementary Data S1).
Virtual follow-up
During the 3 months following the initial visit, the clinical dietitian communicated with the intervention group every 2 weeks (or as needed) to ensure proper application use and address safety concerns (particularly hypoglycemia risk). Additionally, AGP data were collected every 2 weeks, shared, and discussed with the patient by the dietitian via WhatsApp or voice call. If there were concerns over glucose levels, the treating physician was consulted.
Completion visit
Upon completion of the 3-month study period, patients in both groups were notified of the requirement for blood tests to assess HbA1c and lipid profile. Additionally, weight measurements, insulin doses (including basal and bolus), ISF, ICR (if applicable), physical activity levels, and any other relevant information, such as changes in medication or following a new diet, were recorded. Finally, data were downloaded at 2-week intervals and 3 months for both groups, which have been used for comparison.
Statistical analysis
IBM SPSS Statistics version 28 was used for all statistical analyses, with a P value of <0.05 being considered statistically significant. Categorical data were presented as frequencies and percentages, whereas continuous data were summarized using mean values with standard deviations.
To assess baseline differences between the intervention and control groups, chi-square tests were used for categorical variables, whereas independent-sample t tests were conducted for normally distributed continuous variables. While comparing baseline data with postintervention measurements, changes within each group over time were evaluated using paired-sample t test for normally distributed continuous variables.
To assess the differences in postintervention outcomes between the intervention and control groups, adjusting for baseline characteristics, an analysis of covariance test was used.
A stepwise regression analysis was performed to determine factors associated with TIR. TIR served as the dependent variable, and factors such as age, sex, time sensor active, ICR, and BMI were considered independent variables.
Data and resource availability
The datasets generated and/or analyzed during the current study are not publicly available due to patient confidentiality but are available from the corresponding author upon reasonable request. The CHOC-BC mobile application used in this study is publicly available for download at https://apps.apple.com/sa/app/ikfmc/id478245466.
Results
Baseline characteristics
A total of 140 participants were enrolled in the study and randomly assigned to either the intervention (n = 70) or the control (n = 70) group. Based on the exclusion criteria, 127 participants were included in the final analysis (64 to intervention and 63 to control). Figure 1 shows a flow diagram illustrating the participant flow throughout the study (including enrollment, randomization, allocation, and analysis).

Flowchart of participant enrollment, allocation, follow-up, and analysis.
The study demonstrated successful randomization between intervention and control groups, with no statistically significant differences in age (mean age approximately 26–27 years) or duration of diabetes (around 13 years) between groups. Anthropometric measures including weight and BMI were similar between groups (mean BMI approximately 25 kg/m2), indicating comparable baseline characteristics. Importantly, baseline HbA1c levels were not significantly different between application users and controls (approximately 8.15% [66 mmol/mol] in both groups), ensuring a balanced starting point for the study. The comparison between the intervention and control groups using AGP parameters revealed largely similar baseline metrics. Key measures such as TIR and time spent below 70 mg/dL did not significantly differ between groups (P > 0.05), suggesting comparable glycemic profiles at the study outset. Glycemic variability (GV) also showed no significant differences between groups. However, the intervention group did exhibit a higher TAR (>180 mg/dL; 28.52% vs. 25.92%, P = 0.006). These findings underscore the balanced baseline characteristics and engagement levels between the intervention and control groups, laying a foundation for evaluating the impact of the CHOC-BC application on glycemic outcomes. Data are summarized in Table 1.
Baseline Anthropometric, Laboratory, and Flash Glucose Monitoring Data
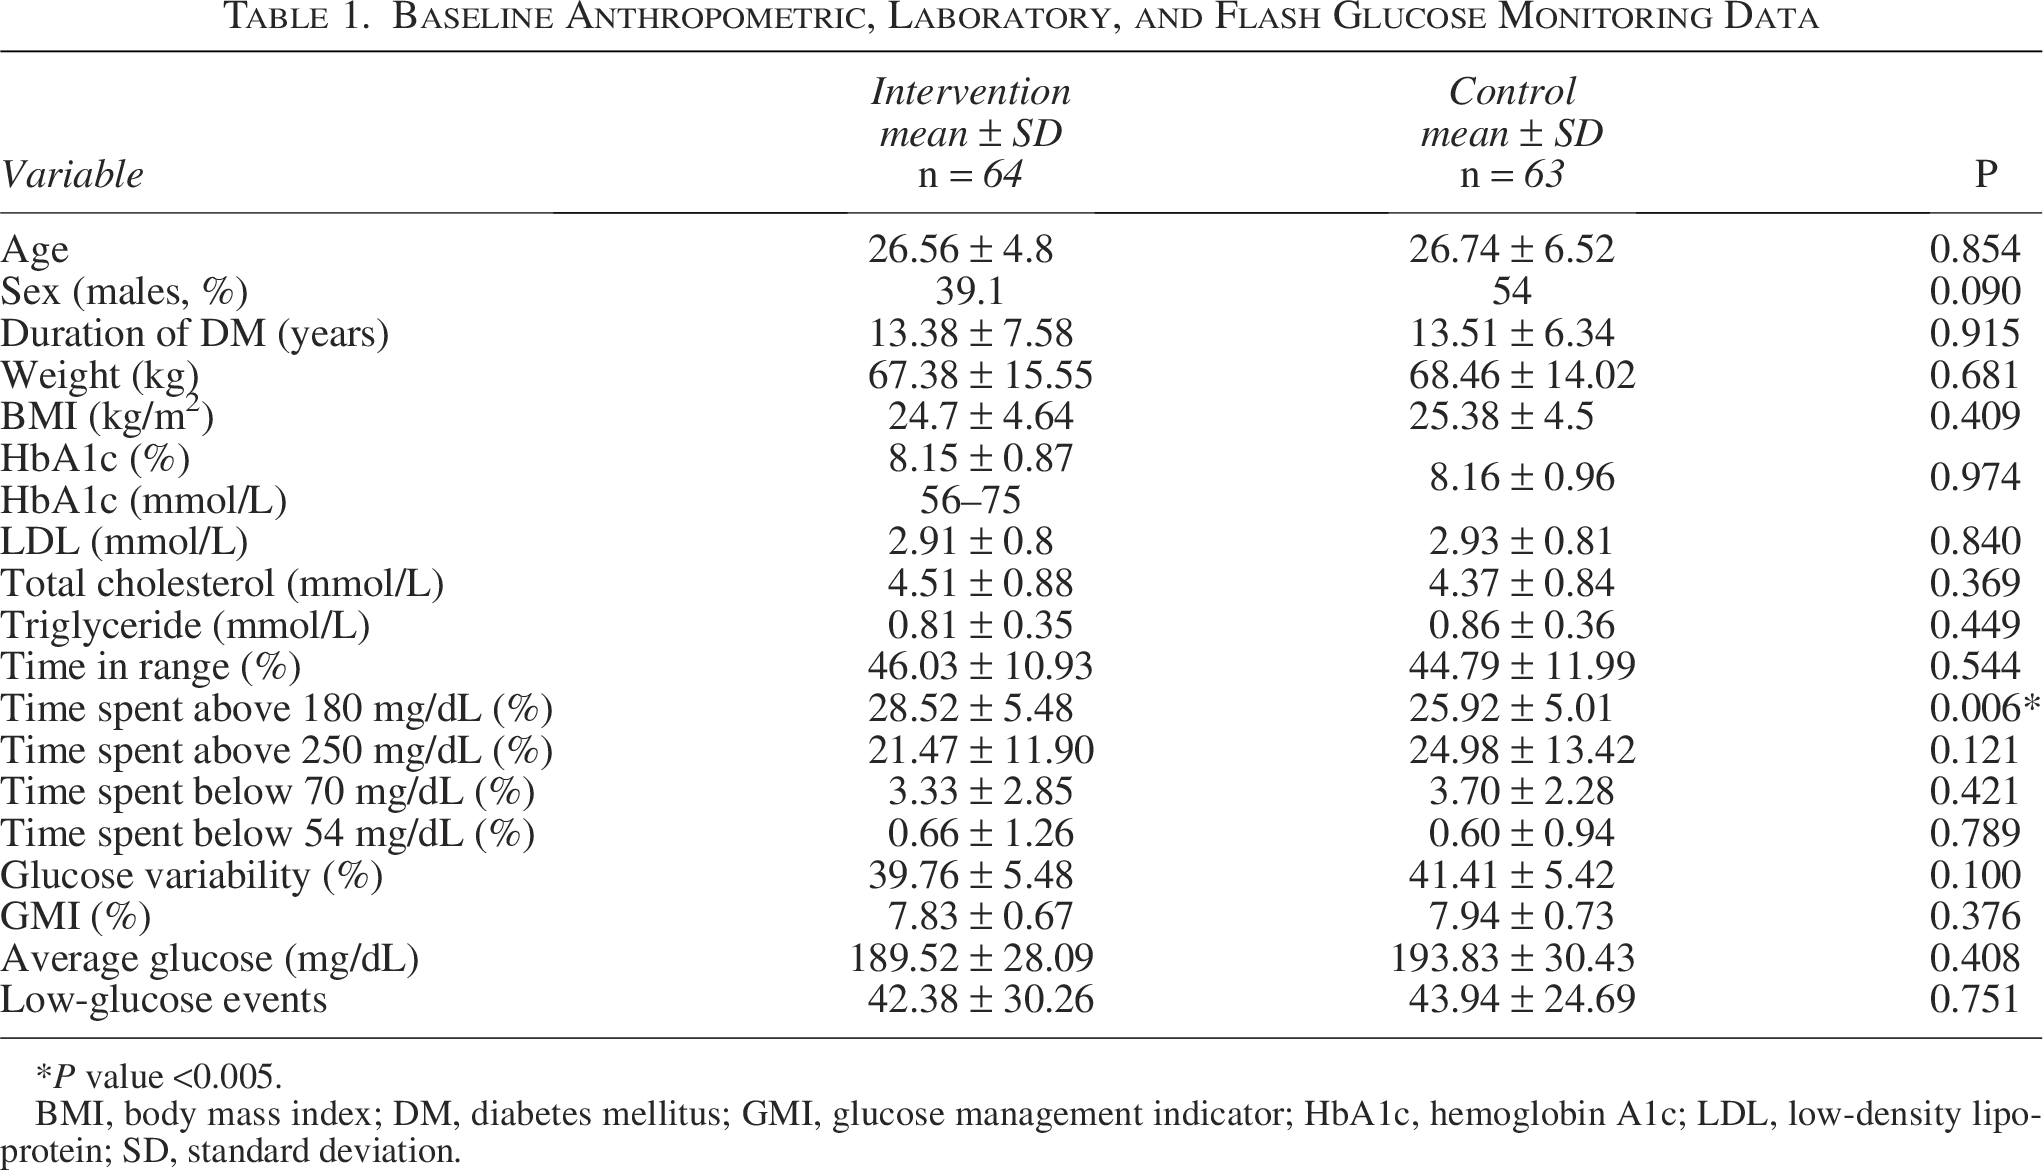
*P value <0.005.
BMI, body mass index; DM, diabetes mellitus; GMI, glucose management indicator; HbA1c, hemoglobin A1c; LDL, low-density lipoprotein; SD, standard deviation.
Primary outcome
The primary outcome was achieved better in the intervention group compared with the control group. The CHOC-BC application users had significantly higher TIR (70–180 mg/dL) compared with controls (51.20% ± 11.61% vs. 46.17% ± 13.02%; mean difference [MD], 5.03; 95% confidence interval [CI], 0.70–9.36; P < 0.001) adjusted for age, BMI, preintervention TIR, average sensor capture, and application use assignment (Fig. 2A).

Secondary outcome
The CHOC-BC application showed significant benefits in several secondary outcomes. Users of the application spent significantly less time above the high glucose threshold (>250 mg/dL) compared with the control group (17.25% ± 11.61% vs. 24.10% ± 15.74%; MD, −6.85; 95% CI, −11.70 to −1.99; P < 0.001), adjusted for age, BMI, average sensor capture, TIR, preintervention percentage of glucose readings above 250 mg/dL, and application use assignment (Fig. 2B). Moreover, GV was significantly improved in the intervention group compared with the control group (39.83% ± 5.50% vs. 41.94% ± 5.78%, P < 0.001), adjusted for age, BMI, average sensor capture, TIR, preintervention percentage of glucose readings above 250 mg/dL, and application use assignment (Fig. 2C). Additionally, mean glucose levels were significantly lower in the intervention group after using the application (179.19 ± 27.92 vs. 191.71 ± 35.78, respectively; P < 0.001), adjusted for age, BMI, and preintervention average sensor capture, TIR, average glucose, and application use assignment (Fig. 2D).
In contrast, HbA1c did not differ significantly between the two groups (HbA1c; 63 mmol/mol [7.93% ± 0.85%] vs. 66 mmol/mol [8.15% ± 1.02%], P = 0.189) for intervention and control groups. The time spent between 180 and 250 mg/dL GMI did not show a significant difference. Data are summarized in Table 2.
Final Glucose Metrics, Laboratory, and Anthropometrics in Intervention and Control Arms
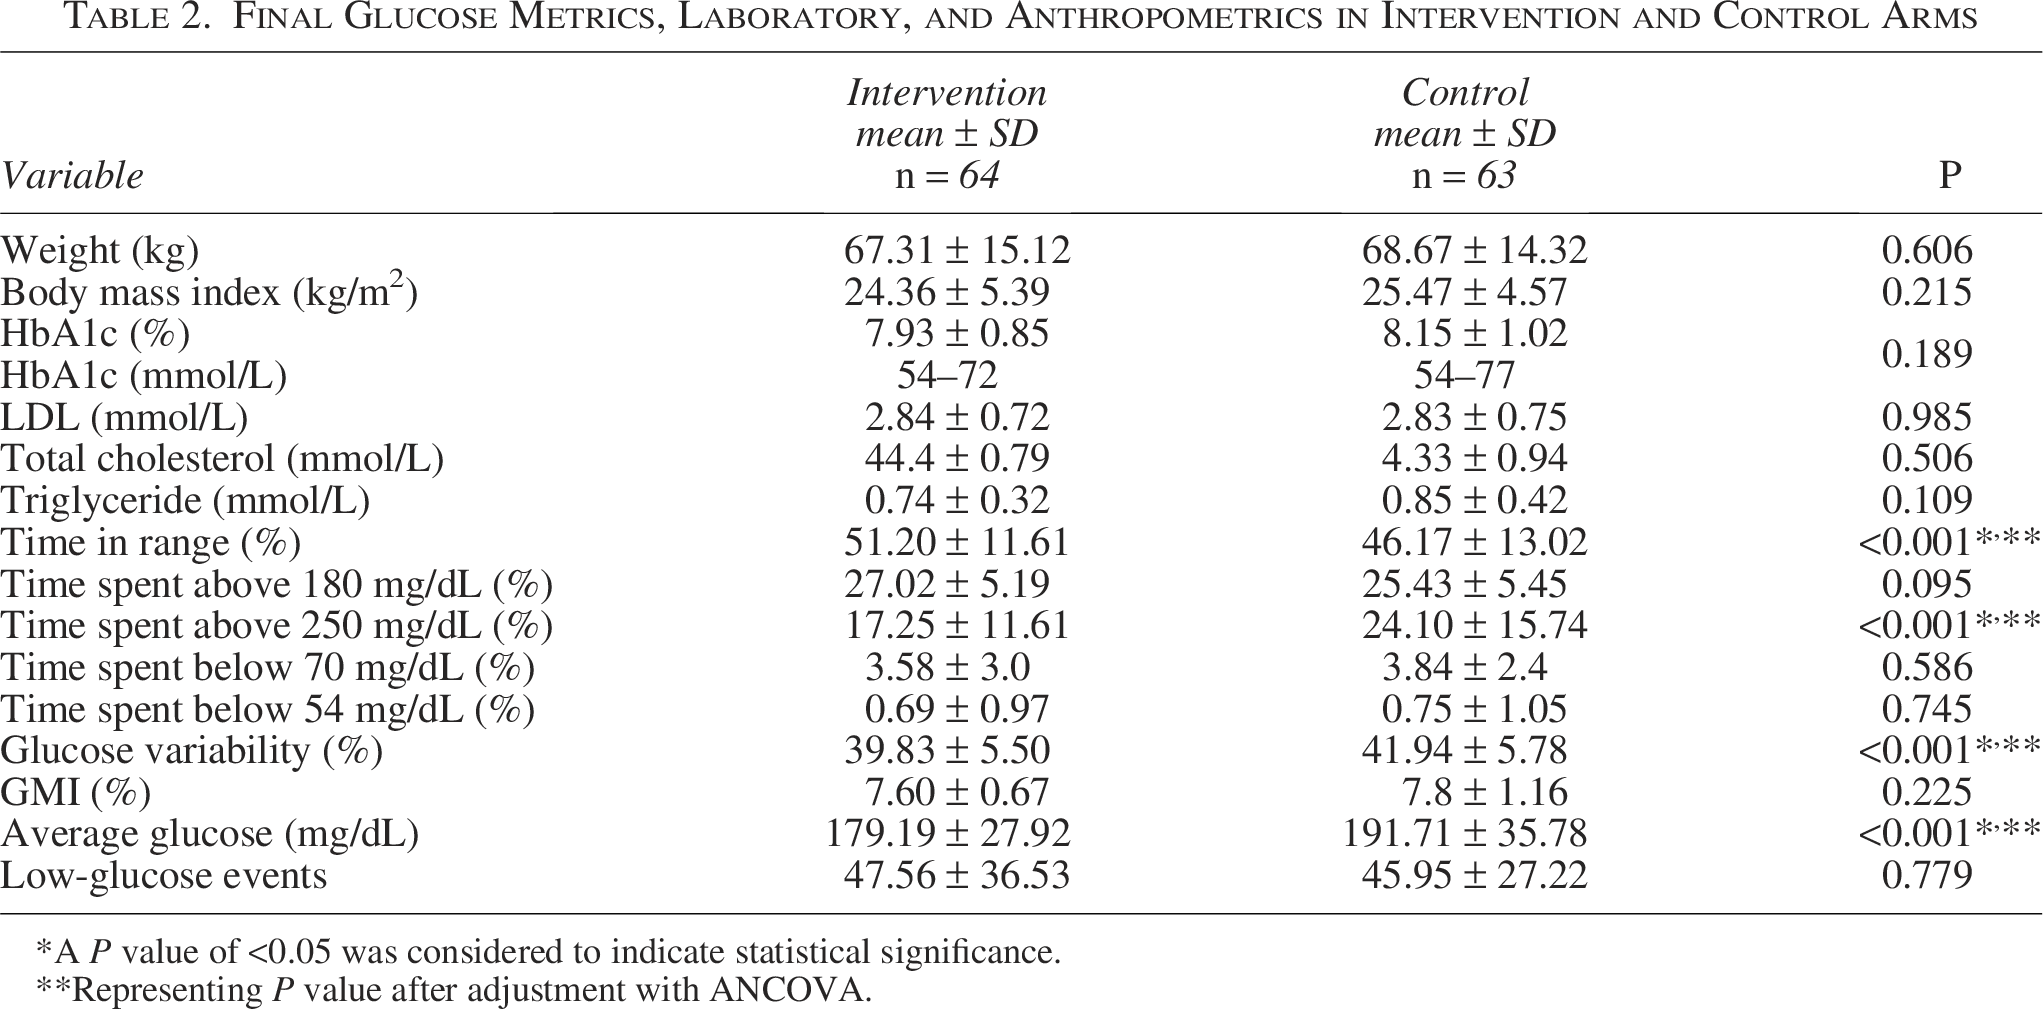
*A P value of <0.05 was considered to indicate statistical significance.
**Representing P value after adjustment with ANCOVA.
Bimonthly data
To fully assess the impact of CHOC-BC application on TIR, this metric was studied every 2 weeks. The greatest absolute increments in TIR occurred during the first 2 weeks and again in the last 2 weeks of the study period. At baseline, the TIR was 46%. It then increased to 51.8% in the first 2 weeks, representing a 12.5% increase from the baseline. Subsequently, the TIR decreased slightly to 49.5% in week 4. However, it rebounded to 51.1% in week 6 and remained relatively stable at 51.1% and 51.3% in the following 2 weeks. Notably, it increased again in the final 2 weeks, reaching 52.3%, representing a 13.6% increase from the baseline (Supplementary Data S2).
Safety outcome
The CHOC-BC application demonstrated good safety outcomes over the study period. The time spent below 70 mg/dL did not differ significantly between the two groups. In addition, the number of low-glucose events did not differ significantly between the intervention and control groups (47.56 ± 36.53 vs. 45.95 ± 27.22, respectively; P = 0.779). Furthermore, despite the application’s focus on flexible food choices, weight and BMI results did not differ significantly between groups. Data are summarized in Table 2.
Regression analysis model for TIR
A stepwise regression analysis was conducted to identify factors associated with achieving the TIR (70–180 mg/dL) postintervention. The dependent variable was TIR.
Independent factors included age, sex, percentage of time sensor active, ICR, and BMI. Through the stepwise selection process, only two variables emerged as statistically significant predictors of the target blood glucose range percentage: the percentage of time sensor active and ICR.
Discussion and Conclusions
Diabetes technology, particularly smartphone-based applications such as the CHOC-BC introduced in this study, has significantly improved glucose control for individuals with T1DM. In this RCT, it was found that application users experienced more than 5% increase in TIR, equating to almost 1.5 h/d. Furthermore, application users showed a reduction of approximately 2 h/d in level 2 hyperglycemia (>250 mg/dL), along with lower average glucose levels and decreased GV. The safety of the application was ensured, as there were no significant differences in time spent in hypoglycemia between users and controls. This study establishes an important connection between the mobile-based CHOC-BC application and TIR, which is a key measure of glucose control recommended by experts in the field. 15
The CHOC-BC application may enhance glycemic control by improving insulin dose calculations and patient engagement. It offers an effective tool for accurate bolus and correction dose calculations based on carbohydrate intake, and it includes a database of over 700 food items, ranging from traditional dishes to restaurant options. By automating correction dose calculations, the application simplifies a traditionally complex process, potentially improving adherence. Additionally, users have shown a rise in glucose monitoring frequency over time, suggesting greater engagement in self-management. This finding aligns with previous research that links higher scanning rates to improved glucose control. 23
A number of studies have examined the relationship between CHOC and glycemic control in adults with T1DM, primarily focusing on HbA1c as the primary endpoint. In a short-term study conducted by Ayano‐Takahara et al. in 2015, a positive correlation was found between carbohydrate intake and TIR over 72 h. 24 However, most studies have primarily used HbA1c to assess glycemic control. Schmidt et al. and Hommel et al. demonstrated improved glycemic control with CHOC interventions using bolus calculators over 16 weeks and 12 months, respectively.7,18 Notably, the DAFNE study reported significant HbA1c improvements over 6 months for patients with poor glycemic control HbA1c >9% (75 mmol/mol) with the use of CHOC. 9 However, our study participants had moderately elevated baseline HbA1c levels of 8.15% ± 0.87% (66 mmol/mol), which may explain the lack of significant improvement in HbA1c. Additionally, the shorter duration of our study (12 weeks) may have contributed to these nonsignificant findings, given that HbA1c improvements can lag behind TIR.25–27
The existing literature on HbA1c reduction with CHOC has yielded mixed results. For example, Laurenzi et al. conducted a 24-week CHOC intervention with 61 adults with T1DM using continuous subcutaneous insulin infusion. However, they found no significant change in HbA1c levels. 28 It is important to note that our study was not specifically designed to evaluate HbA1c changes.
The assessment of the safety of the CHOC-BC application, using CGM technology and AGP data, showed no significant differences in time spent in hypoglycemia between users and nonusers of the application. This suggests that the application is a safe tool for individuals with T1DM, potentially enhancing confidence in CHOC and insulin dosing before meals, thus reducing high glucose levels without an increase in hypoglycemia. 29 Previous studies utilizing similar diabetes technologies, such as the ABC device and self-monitoring of blood glucose, have reported comparable hypoglycemia outcomes in CHOC interventions, further supporting the safety and efficacy of incorporating such technology into diabetes management.7,18,30
Our study found a significant improvement in GV in the intervention group, indicating that the CHOC-BC application effectively reduces fluctuations in blood glucose levels. This improvement may be due to more accurate CHOC and insulin dosing, which the application facilitates. This supports findings from other studies that link accurate CHOC with reduced GV in individuals with T1DM.31,32
The strengths of this study include being the first to examine the effect of a mobile-based application that combines CHOC and BC on TIR, a recognized measure of glucose control. The study utilized randomized controlled sampling, which provides a robust evidence of efficacy. Additionally, the use of continuous glucose monitoring system enabled close patient monitoring and extensive glucose data collection, ensuring application safety and effectiveness.
The study has several limitations. First, the control group had a higher baseline time spent in the glucose range of 180–250 mg/dL. This issue can occur in clinical trials, even with successful randomization, as indicated by the other parameters. Second, the intervention group was monitored every 2 weeks, which may have influenced glycemic outcomes; however, this frequent monitoring was necessary to collect data and to ensure the safety of the newly introduced application. Third, compliance with the application was not directly measured, and the technology used needed further enhancement of the current version. Fourth, there were inaccuracies in the carbohydrate content of some traditional meals, highlighting areas that need improvement in future studies.
In summary, using technology to enhance CHOC is a rapidly advancing field that has the potential to improve the management of T1DM. The introduction of the mobile-based CHOC-BC application has shown promising results, demonstrating improved glucose control among individuals with T1DM, without increasing the risk of hypoglycemia or weight gain. Based on the findings of this RCT, it is recommended that patients with T1DM utilize such applications to improve CHOC and BCs.
Clinical dietitians should be encouraged to learn and promote this technology to maximize its benefits for patients. Future studies should explore the application’s usefulness across a broader range of patients with T1DM, including pediatric, adolescent, and pregnant populations. Additionally, further research is necessary to evaluate the application’s impact on long-term diabetes complications and to expand its capabilities, potentially incorporating artificial intelligence technologies for automated carbohydrate estimation via a mobile camera.
Authors’ Contributions
S.A. was involved in the conception, design, and conduct of the study and in researching data. T.A. researched data. S.A. and S.H.A. wrote the first draft of the article. A.J., M.A., and R.A. reviewed and edited the article. T.W. conducted the statistical analysis. S.H.A. and N.A. contributed to the discussion and reviewed and edited the article. All authors reviewed and approved the final version of the article.
Footnotes
Acknowledgments
The authors would like to thank the Research Centre at King Fahad Medical City, Riyadh, for their valuable financial support provided for the article (RFA 023-015).
Author Disclosure Statement
The authors declare no conflicts of interest.
Funding Information
No funding was received for this article.
Guarantor Statement
S.A. is the guarantor of this work and, as such, had full access to all the data in the study and takes responsibility for the integrity of the data and the accuracy of the data analysis.
Supplemental Material
References
Supplementary Material
Please find the following supplemental material available below.
For Open Access articles published under a Creative Commons License, all supplemental material carries the same license as the article it is associated with.
For non-Open Access articles published, all supplemental material carries a non-exclusive license, and permission requests for re-use of supplemental material or any part of supplemental material shall be sent directly to the copyright owner as specified in the copyright notice associated with the article.
