
Abstract
Continuous glucose monitors (CGMs) are becoming increasingly available, yet the relationship between CGM metrics and hemoglobin A1c (HbA1c) among individuals with prediabetes and normoglycemia remains unclear. We examined associations between HbA1c and eight CGM metrics across glycemic status. Our cohort included 972 individuals: 421 (43.3%) with type 2 diabetes, 319 (32.8%) with prediabetes, and 232 (23.9%) with normoglycemia. Associations were strongest in type 2 diabetes, with mean glucose showing the strongest relationships (standardized β = 0.79, P < 0.001). In prediabetes, associations were substantially attenuated, with mean glucose showing moderate association (standardized β = 0.22, P < 0.001). Among individuals with normoglycemia, CGM metrics showed minimal associations with HbA1c, with mean glucose demonstrating a weak association (standardized β = 0.10, P = 0.022) and time in range showing no significant relationship. All interaction terms were statistically significant (P < 0.001). These findings suggest that standard CGM metrics should not be interpreted to reflect HbA1c for individuals with prediabetes and normoglycemia.
Introduction
Continuous glucose monitors (CGMs) are increasingly available not only to individuals with diabetes, but also to those with prediabetes and normoglycemia. 1 In 2024, the Food and Drug Administration approved over-the-counter CGMs for use by individuals with and without diabetes. 2 As CGM availability expands, patients and clinicians must understand how to interpret common CGM metrics (e.g., time in range [TIR]) in relation to hemoglobin A1c (HbA1c), the gold standard for long-term glycemic assessment.
While studies have evaluated the correlation between HbA1c and CGM metrics among patients with type 1 and type 2 diabetes, fewer data exist on prediabetes or normoglycemia. Expert consensus includes TIR, mean glucose, and glucose management indicator (GMI) as metrics to assess glycemic control in diabetes.3,4 In addition, Montaser et al. have shown that essential CGM metrics can be distilled into two key dimensions, treatment efficacy (hyperglycemia exposure) and treatment safety (hypoglycemia risk), which together capture the principal aspects of glycemic control in diabetes. 5 However, these may not align with HbA1c, limiting their utility. For example, studies have found significant discordance between GMI and HbA1c among patients with type 1 and type 2 diabetes. 6 This discrepancy is well-documented in type 1 diabetes, where clinical trials revealed glycemic category-dependent differences between HbA1c and GMI estimates. 7 Among individuals with prediabetes or normoglycemia, optimal interpretations and applications of CGM metrics are still emerging.8–10 Preliminary evidence suggests that CGM-derived metrics may better predict progression to type 2 diabetes than HbA1c. 11 Novel dynamic CGM-based markers have shown promise in differentiating individuals with type 1 diabetes, type 2 diabetes, and healthy controls, with or without autoantibodies, and in tracking disease progression over time. 12 These findings point to a role for CGM in early detection and prevention efforts, although further research is needed to define appropriate thresholds and applications in these populations.
Clarifying the relationship between HbA1c and CGM metrics is essential for guiding clinical interpretation of CGM metrics, as the use expands to populations with prediabetes and normoglycemia. Therefore, the objective of our study was to determine how key CGM metrics correlate with HbA1c across the glycemic spectrum.
Methods
This study uses data from the Artificial Intelligence Ready and Exploratory Atlas for Diabetes Insights (AI-READI) cohort, which includes adults aged 40 years and older with and without a type 2 diabetes diagnosis.13,14 Individuals were excluded if they were older than 85 years, were pregnant, had gestational diabetes, or type 1 diabetes. Individuals were recruited across three sites in the United States: the University of Alabama at Birmingham, the University of California, San Diego, and the University of Washington starting in 2022. Individuals wore a Dexcom G6, which captured blood glucose readings every 5 min, for up to 10 days. HbA1c was measured before the CGM wear time. For this analysis, we also excluded individuals who did not have HbA1c measurements or did not meet our CGM criteria. Based on prior studies and expert consensus, CGM data were considered if individuals had at least 7 days of sampling and at least 70% collection during wear time.3,4,9 We also removed the first 12 hours of CGM data. 9
The primary analysis focused on evaluating the relationship between HbA1c and key CGM metrics. We focused on CGM metrics that reflect glycemic control and variability: mean glucose, TIR (percent of time spent within a glucose range of 70–180 mg/dL), time in tight range (TITR) (percent of time spent within a glucose range of 70–140 mg/dL), glucose standard deviation (SD), mean amplitude of glycemic excursions (MAGE) (the mean of the heights of glucose excursions that are greater than glucose SDs), mean of daily differences (MODD) (the mean of all absolute value differences between glucose measured at the same time of day on two consecutive days), continuous overall net glycemic action (CONGA) (the SD of the difference between glucose values that are 24 hours apart), and J-index (combines the mean glucose and SD to provide information on glycemic control and variability).15–19 Individuals were categorized into three groups based on the reported study group and HbA1c: normoglycemia (HbA1c <5.7%), prediabetes (≥5.7% and ≤6.4%), and type 2 diabetes (≥6.5%). All metrics were calculated using the iglu package. 20
Individual characteristics were summarized using descriptive statistics, with differences across groups assessed using chi-squared test for categorical variables and the Kruskal–Wallis rank-sum test for continuous variables. To examine whether the CGM-HbA1c relationships differed across glycemic status, we conducted both stratified linear regression analyses and interaction modeling. For the stratified approach, we fit separate linear regression models for each glycemic group. In addition, we fit models with interaction terms between CGM metrics and glycemic status to formally test for differences in associations across groups. Adjusted models included age and body mass index as covariates. We used robust sandwich variance estimators to account for heteroscedasticity across groups. To enable comparison across different CGM metrics, we conducted analyses using standardized variables. Sensitivity analyses included: (1) Deming regression to account for measurement error in both HbA1c and CGM metrics, (2) models adjusted for hemoglobin levels to address potential confounding by anemia, and (3) models adjusted for study site to account for potential site-specific differences. 21 Statistical significance was set at P < 0.05. Analyses were performed using R (version 4.4.0).
Results
Our cohort included 972 individuals, 421 (43.3%) had type 2 diabetes, 319 (32.8%) had prediabetes, and 232 (23.9%) had normoglycemia (Table 1). Individuals with normoglycemia were younger (mean = 58 years, SD = 11), had lower average HbA1c (mean = 5.32%, SD = 0.24), and lower body mass index (mean = 28, SD = 7) compared with those with prediabetes and type 2 diabetes. CGM metrics differed significantly among the three groups.
Patient Characteristics and Associations of Continuous Glucose Monitor Metrics with Hemoglobin A1c (n = 972), by Glycemic Status
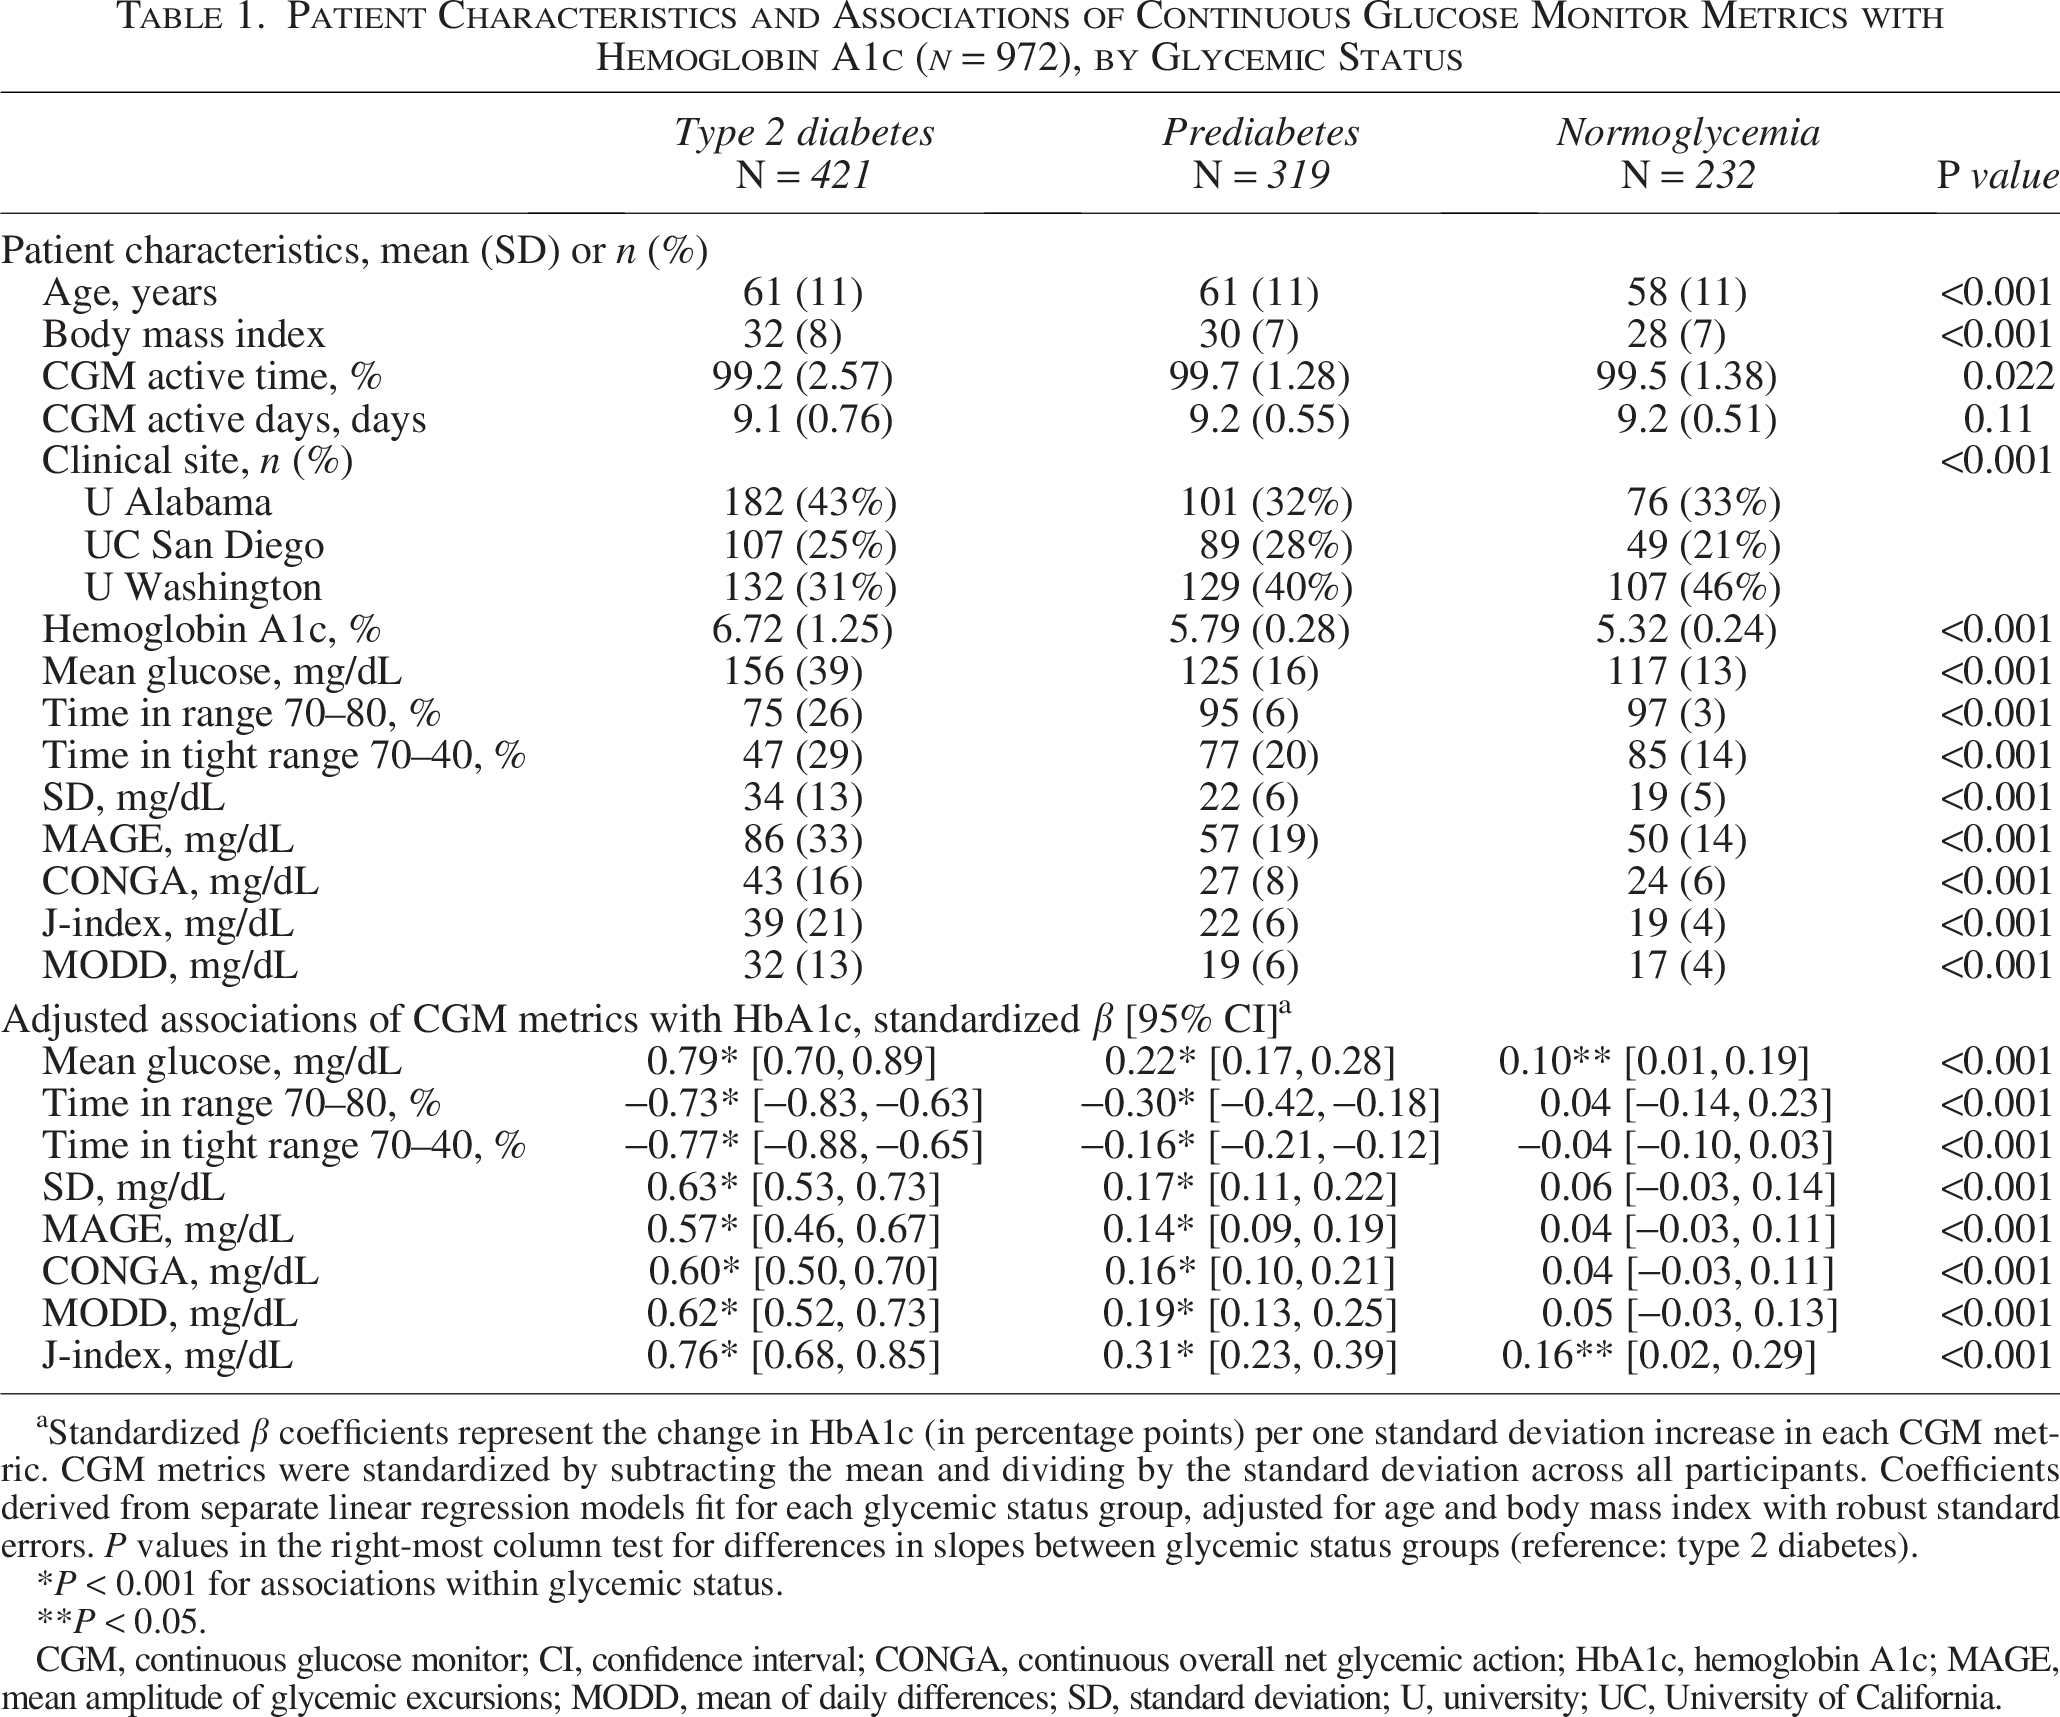
Standardized β coefficients represent the change in HbA1c (in percentage points) per one standard deviation increase in each CGM metric. CGM metrics were standardized by subtracting the mean and dividing by the standard deviation across all participants. Coefficients derived from separate linear regression models fit for each glycemic status group, adjusted for age and body mass index with robust standard errors. P values in the right-most column test for differences in slopes between glycemic status groups (reference: type 2 diabetes).
P < 0.001 for associations within glycemic status.
P < 0.05.
CGM, continuous glucose monitor; CI, confidence interval; CONGA, continuous overall net glycemic action; HbA1c, hemoglobin A1c; MAGE, mean amplitude of glycemic excursions; MODD, mean of daily differences; SD, standard deviation; U, university; UC, University of California.
Adjusted linear regression models with interaction terms revealed significantly different relationships between CGM metrics and HbA1c across glycemic status. For all CGM metrics, the association with HbA1c was significantly stronger in the type 2 diabetes compared with the prediabetes and normoglycemic groups (interaction P values <0.001, Table 1).
Individuals with type 2 diabetes demonstrated strong associations between all CGM metrics and HbA1c (Table 1). Mean glucose showed the strongest relationships (standardized β = 0.79, P < 0.001), with mean glucose showing each 1 mg/dL increase associated with a 0.02% increase in HbA1c (unstandardized) (Fig. 1). Time-based metrics demonstrated robust associations, with TITR (standardized β = −0.77, P < 0.001) and TIR (standardized β = −0.73, P < 0.001) showing strong negative relationships. Glycemic variability metrics showed a moderate-to-strong associations, with standardized coefficients ranging from 0.57 to 0.63 (all P < 0.001). The J-index composite metric performed well (standardized β = 0.76, P < 0.001).
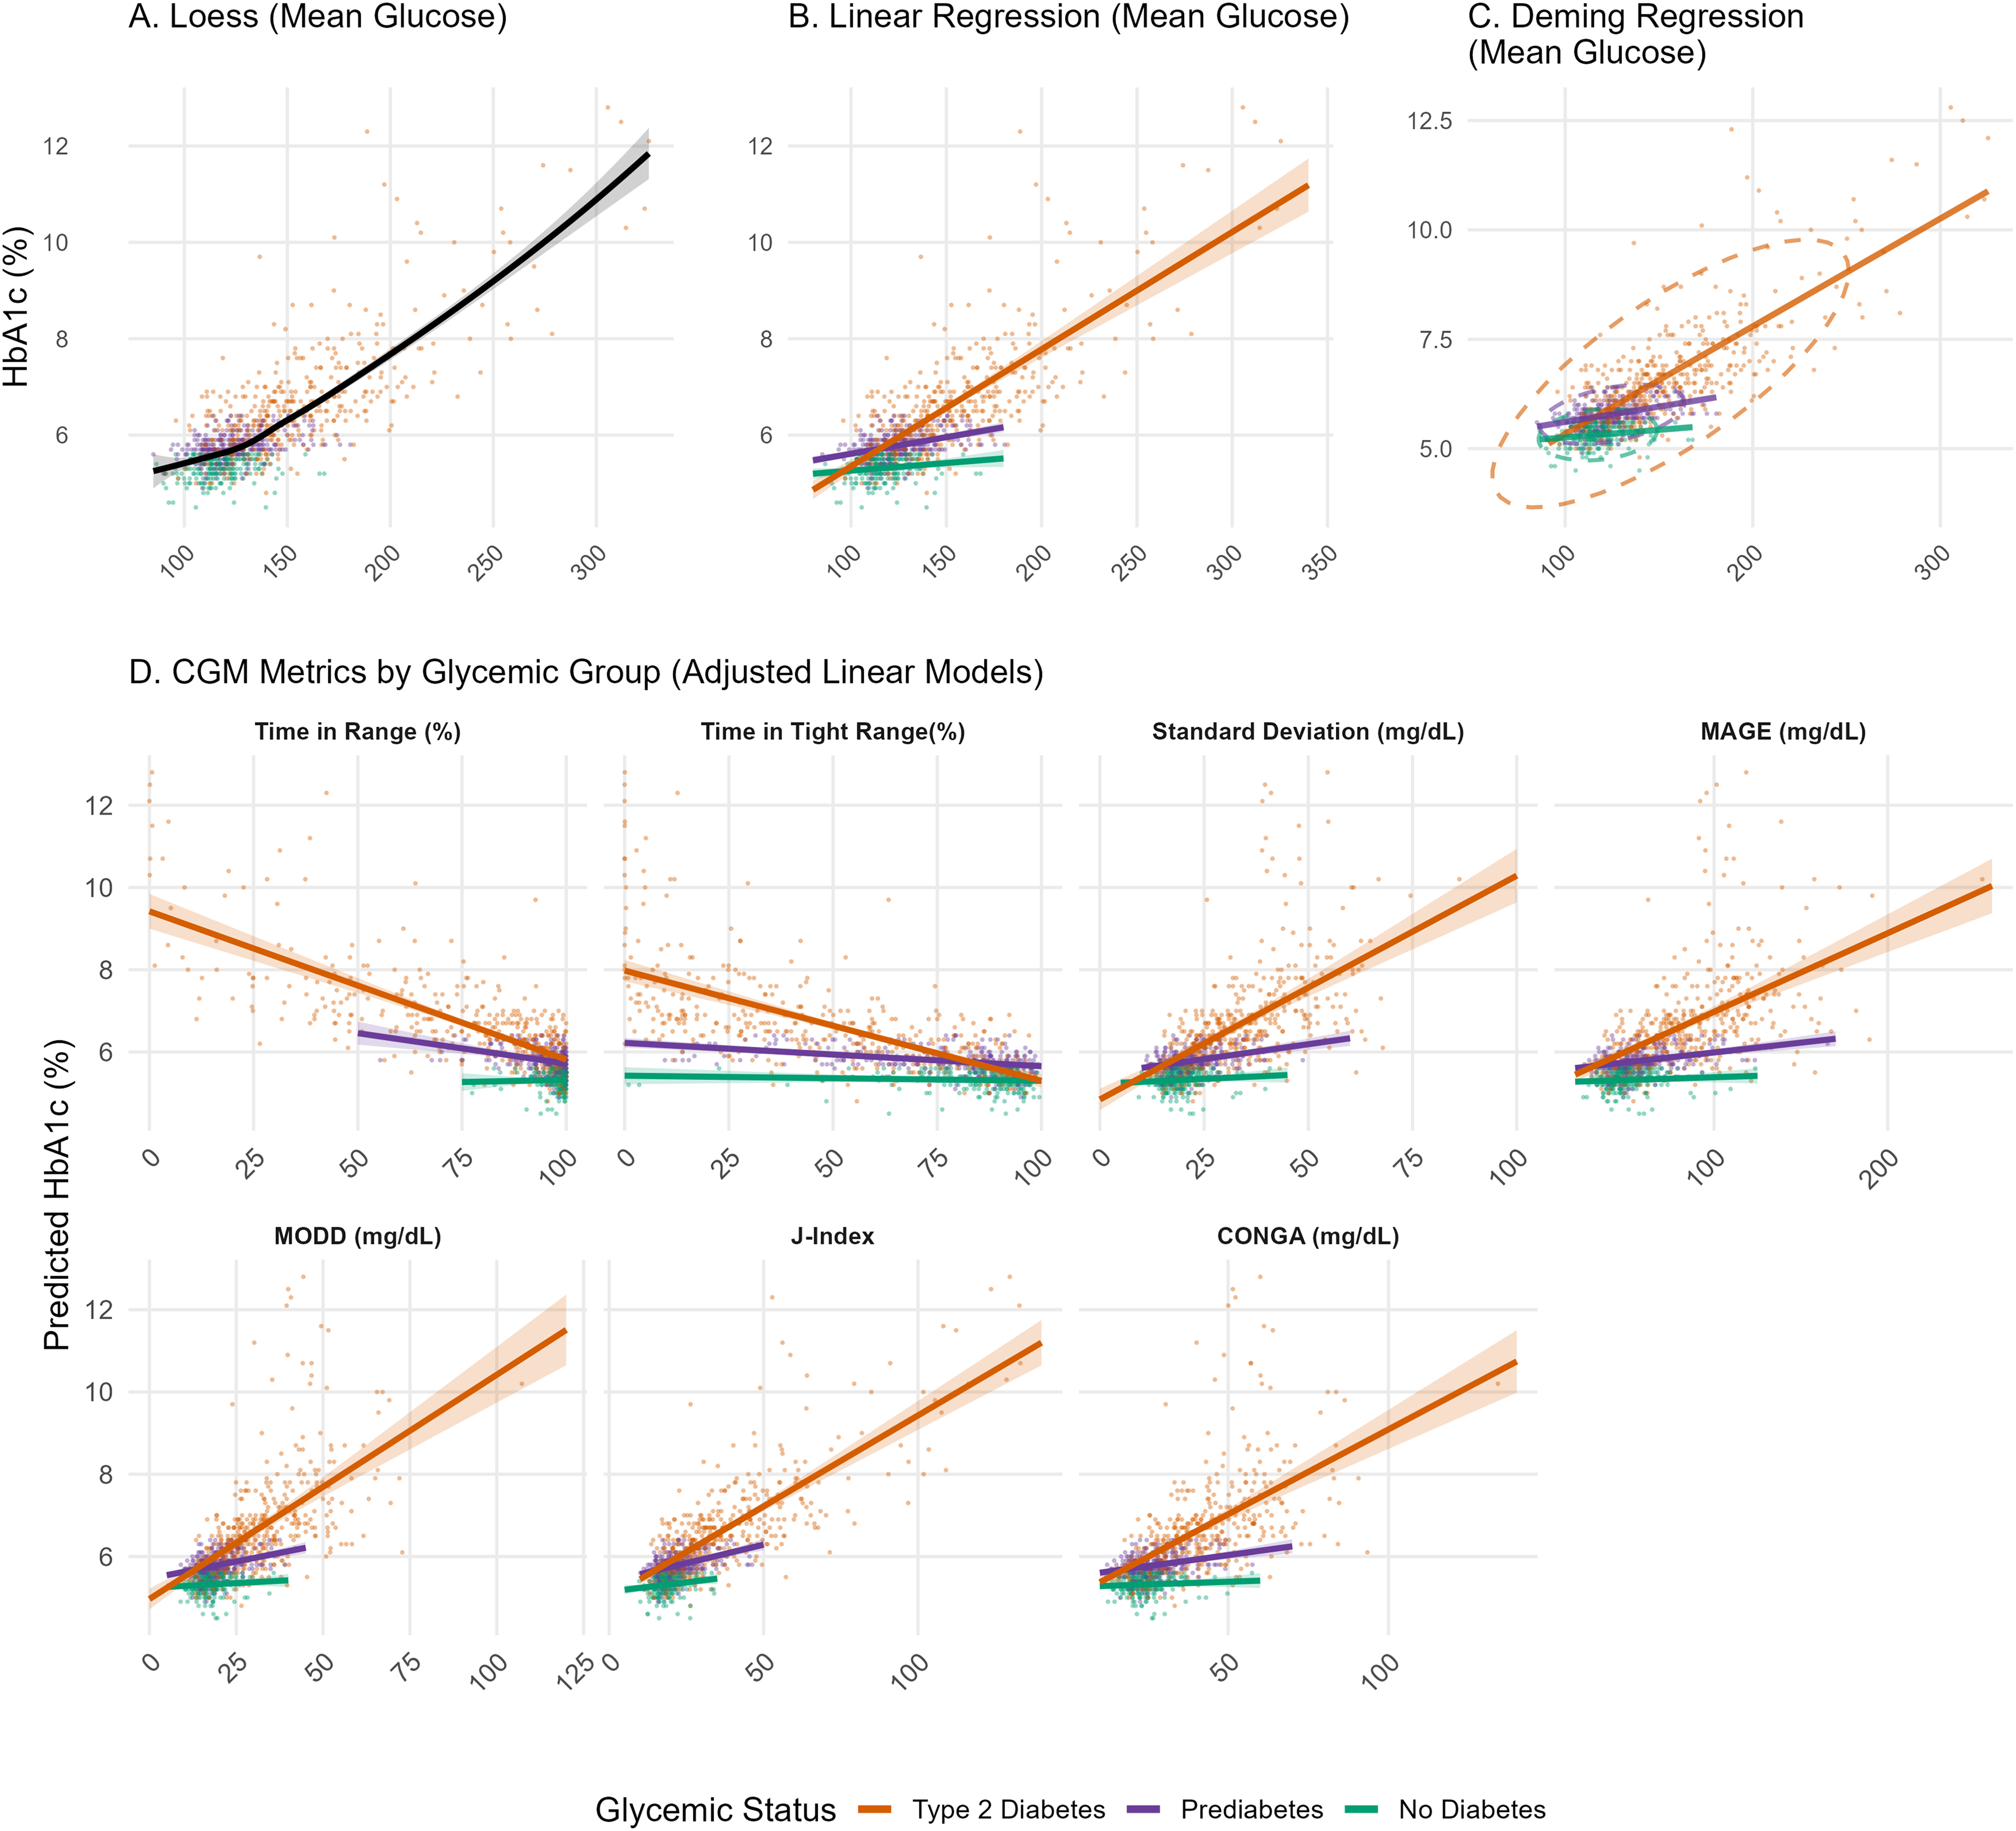
Association between hemoglobin A1c (HbA1c) and selected continuous glucose monitor (CGM) metrics by glycemic status. Panels
For individuals with prediabetes, CGM metrics maintained statistical significance but with substantially attenuated effect sizes compared with type 2 diabetes. The mean glucose relationship was reduced (standardized β = 0.22, P < 0.001), with each 1 mg/dL increase associated with only a 0.007% increase in HbA1c (unstandardized). Time-based metrics showed moderate associations (TITR: standardized β = −0.16; TIR: standardized β = −0.30, both P < 0.001). Glycemic variability metrics were attenuated, with standardized coefficients ranging from 0.14 to 0.19 (SD: standardized β = 0.17; MODD: standardized β = 0.19; MAGE: standardized β = 0.14; CONGA: standardized β = 0.16; all P < 0.001). The J-index demonstrated the strongest relationship (standardized β = 0.31, P < 0.001).
Among individuals with normoglycemia, CGM metrics showed minimal or nonsignificant associations with HbA1c. Mean glucose demonstrated a weak but significant relationship (standardized β = 0.10, P = 0.026), with each 1 mg/dL increase associated with only a 0.003% increase in HbA1c (unstandardized). Time-based metrics showed inconsistent relationships, with TIR showing a small positive coefficient contrary to expectations (standardized β = 0.04, P = 0.643). Glycemic variability metrics were nonsignificant (SD: standardized β = 0.06, P = 0.183; MODD: standardized β = 0.05, P = 0.193; MAGE: standardized β = 0.04, P = 0.272). The J-index had a weak but significant association (standardized β = 0.16, P = 0.028).
Sensitivity analyses confirmed similar patterns. Deming regression confirmed the same pattern across glycemic status (Supplementary Table S3). Log-transformed Deming regression analysis also yielded consistent patterns of correlation attenuation across glycemic groups. Results remained consistent after adjusting for study site as well as when performing within-group standardization. In addition, after adjusting for hemoglobin levels, the patterns persisted (all interaction P < 0.001) (Supplementary Table S4).
Discussion
In this study, we found that the relationship between HbA1c and CGM metrics of control and variability weakened from type 2 diabetes to normoglycemia. While CGM metrics were strongly correlated with HbA1c in type 2 diabetes, these associations were moderate in prediabetes, and weak or absent among individuals with normoglycemia. These findings suggest that standard CGM metrics may require revised thresholds or a more nuanced interpretation in individuals with normoglycemia.
Our findings align with prior studies highlighting the discordance between CGM metrics and HbA1c across the glycemic spectrum. Among 153 individuals, Shah et al. similarly found that the GMI overestimates HbA1c in individuals with normoglycemia. 8 Our findings contrast with prior work in populations with diabetes, where CGM metrics demonstrate coherent and clinically meaningful relationships with HbA1c and glycemic control, further underscoring the need for revised interpretive frameworks in earlier dysglycemia. 5 The observed discordances likely reflect multiple mechanisms. Individuals with normoglycemia and prediabetes exhibit intermittent glucose excursions or meal-dependent hyperglycemia that may not sustain long enough to impact the 2–3-month average reflected by HbA1c, creating a temporal mismatch that is particularly pronounced in early dysglycemia. The reduced correlation with mean glucose may additionally reflect individual differences in the red blood cell lifespan, hemoglobin glycation rates, and other nonglycemic factors that influence HbA1c formation, as reflected by Xu and Dunn et al., in studies demonstrating nonlinear relationships between mean glucose and HbA1c in individuals with diabetes that vary due to these factors.22,23 Of note, the shape of the nonlinear association we observed differs from that in Xu and Dunn et al. because they only examined data from individuals with diabetes. They reported that mean glucose did not change as rapidly with decreasing HbA1c, which may be partially explained by the activity of glucose transporter-1. In contrast, because we included the full range of HbA1c, it is apparent that the nonlinear association curves may curve in the opposite direction. This difference highlights how the glucose-HbA1c relationship varies across the broader glycemic spectrum, demonstrating distinct patterns in populations with and without diabetes. While range restriction in narrower glucose distributions may contribute to the attenuation in associations we observed, the clinical significance of this phenomenon remains paramount since clinicians and patients must understand that CGM metrics become substantially less reliable in populations without diabetes. There is an urgent need to establish consensus for how to interpret these data and evaluate CGM in these populations. 24
Our findings have clinical implications for the care of individuals with and without diabetes. The discordance between CGM metrics and HbA1c may lead to misinterpretation by clinicians, unnecessary anxiety, inappropriate lifestyle modifications, or misguided clinical decisions. In particular, the weaker correlation between mean glucose and HbA1c in individuals with prediabetes and normoglycemia may create diagnostic uncertainty, since weak correlations make it difficult to use mean glucose from CGM as a reliable indicator of glycemic status reflected by HbA1c. Importantly, conversions, such as GMI or estimated average glucose values, should not be used to estimate HbA1c in these populations, as the weak correlations render such equations unreliable and potentially misleading.
In individuals without diabetes, the CGM may serve as a real-time biofeedback tool to observe the impact of lifestyle and medication changes on glycemic control and variability. 25 By contrast, among individuals with type 2 diabetes, CGM metrics were strongly and consistently associated with HbA1c. This reinforces the clinical utility of these measures and supports continued use of the current CGM in this population. Despite these findings and expanded support for CGMs among individuals with type 2 diabetes, existing disparities in use and access may limit their impact.26,27 Future interventions aimed at digital inclusion in diabetes care are needed and may incorporate multilevel strategies, such as digital navigators, to address these gaps.28,29 Our findings validate existing CGM metrics for diabetes management while highlighting their limitations when applied to other populations.
The limited role of CGM metrics in individuals with normoglycemia underscores the critical need for long-term outcome studies in this population. There is only one study, the A Estrada Glycation and Inflammation Study (AEGIS), that has linked baseline CGM with later diagnosis of type 2 diabetes, observing that those who had the lowest TITR were more likely to develop type 2 diabetes over 5 years. 30 Using a machine learning algorithm to analyze the same baseline CGM data and following this cohort up to 12 years, investigators observed that the association of CGM data with diabetes development was stronger than baseline HbA1c. 11 A proof-of-concept study has also demonstrated the potential utility of CGM to identify glycemic abnormalities among individuals with gestational diabetes as early as the first trimester of pregnancy. 31 As many longitudinal cohort studies, in addition to AEGIS, are now collecting CGM data, we may soon have a better idea of what CGM metrics, patterns, or longitudinal trends are associated with poor outcomes.10,32,33
Our study has several limitations. First, CGM data inclusion criteria are not standardized, however, our inclusion criteria were consistent with prior studies and expert consensus. Second, we did not account for additional conditions that affect HbA1c independent of glycemia, such as chronic kidney disease or hemoglobin variants. 34 Third, participants may have modified their behavior while wearing a CGM, impacting glucose readings, especially since HbA1c was tested before the CGM wear time. The dataset does not contain participant logs to quantify this potential effect, limiting our ability to assess the magnitude of this factor. Fourth, there was likely selection bias in who chose to participate, thus limiting generalizability. Fifth, our findings are based on a single CGM device type and may not generalize to other devices, which have different measurement accuracy. Finally, this was a cross-sectional study, and future studies should evaluate the longitudinal relationship between CGM metrics and long-term outcomes.
This study demonstrates that CGM metrics show progressively weaker alignment with HbA1c across the glycemic spectrum, limiting their interpretability outside of populations with diabetes. Future research priorities examining whether CGM patterns can predict progression to prediabetes or diabetes and cardiovascular risk may be warranted, but at this time, the utility of CGM as an indicator for diabetes risk is unclear. As CGM use expands beyond traditional diabetes care, both clinicians and patients should recognize that CGM-derived estimates may not accurately reflect HbA1c status, particularly in prediabetes and normoglycemia.
Authors’ Contributions
Conceptualization: J.A.R. and N.L.S. Methodology: J.A.R., S.L., and N.L.S. Formal analysis: J.A.R. Writing: All authors. Supervision: N.L.S.
Footnotes
Acknowledgment
The authors would like to thank Natacha Meyer for her guidance on figure design.
Author Disclosure Statement
J.A.R. reported receiving grants from the National Institutes of Health (NIH). L.S. reported receiving grants from the NIH and honoraria from the National Kidney Foundation. N.L.S. received funding for an investigator-initiated research grant from Novo Nordisk, unrelated to the current project. N.E.P. reported a role as coinvestigator in a multisite hospital CGM Dexcom study (completed 2024) and unrelated to the current project. No other disclosures were reported.
Funding Information
J.A.R. was supported by NIMHD K23MD016439 and by the AIM-AHEAD Bridge2AI AI-READI Training Program. N.L.S. was supported, in part, by NIDDK R01DK129305.
Supplemental Material
References
Supplementary Material
Please find the following supplemental material available below.
For Open Access articles published under a Creative Commons License, all supplemental material carries the same license as the article it is associated with.
For non-Open Access articles published, all supplemental material carries a non-exclusive license, and permission requests for re-use of supplemental material or any part of supplemental material shall be sent directly to the copyright owner as specified in the copyright notice associated with the article.