
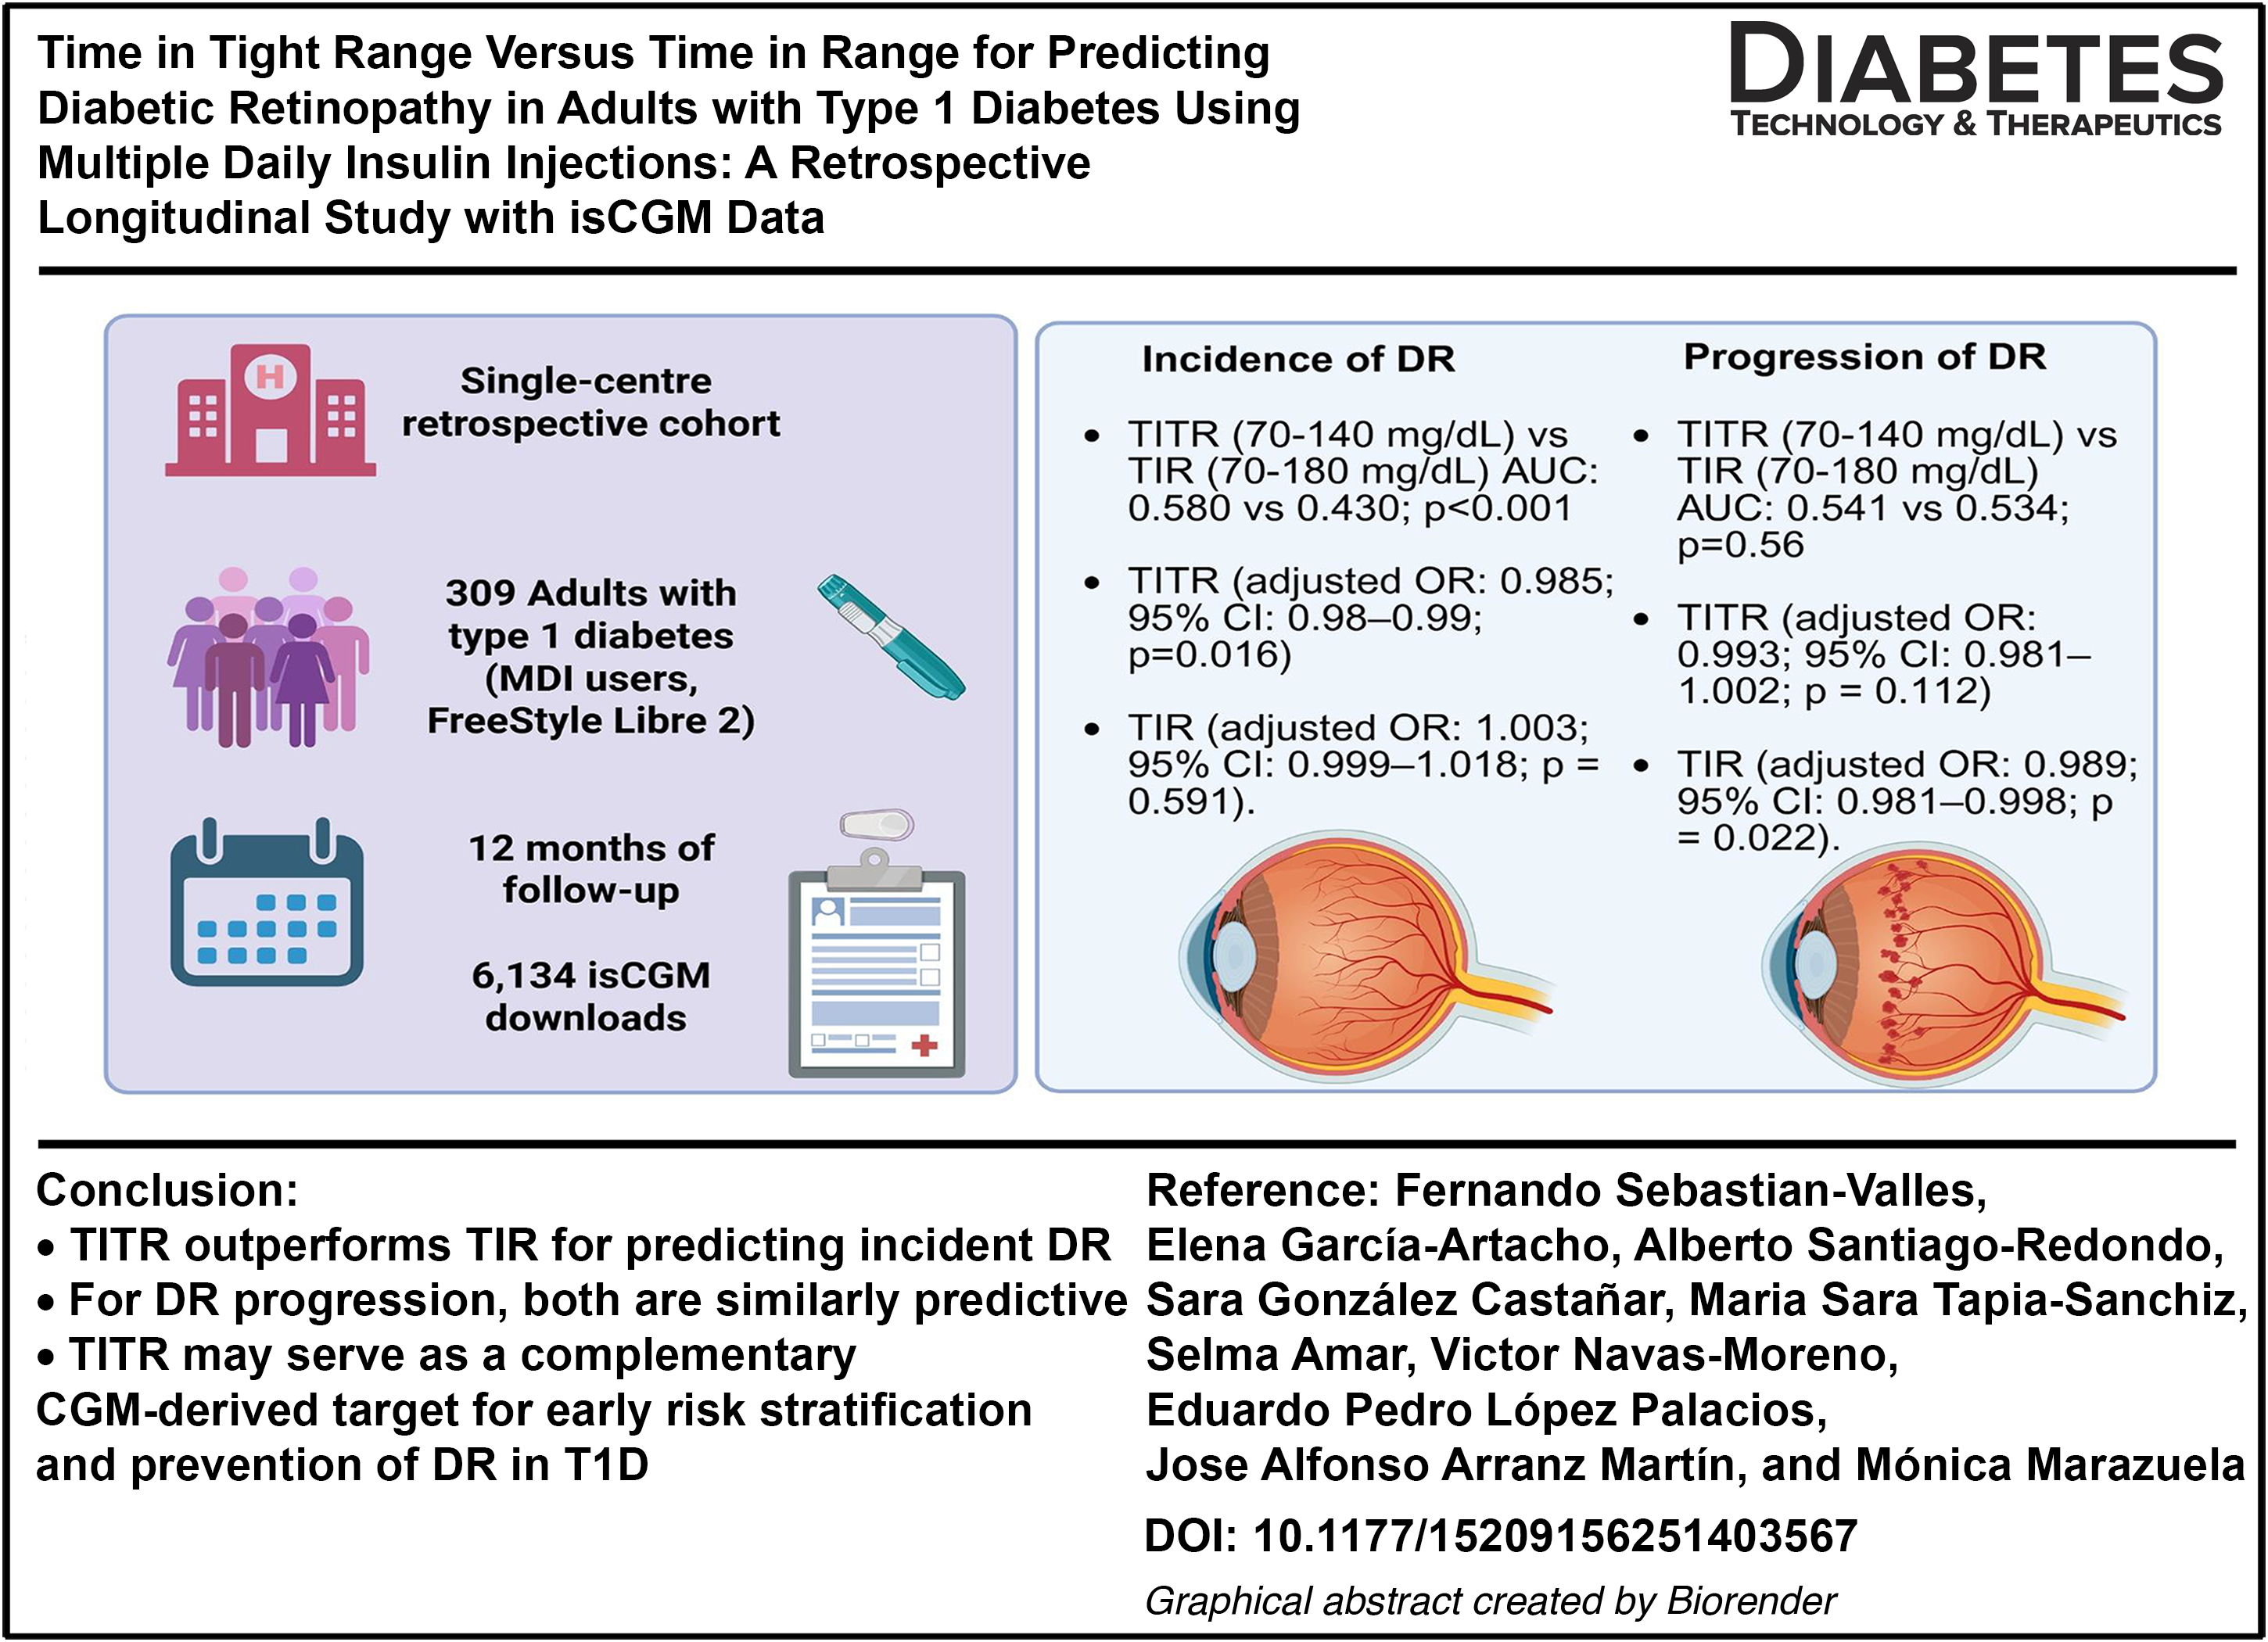
Abstract
Background:
Time in tight range (TITR, 70–140 mg/dL) has emerged as a glycemic metric offering stricter assessment than conventional time in range (TIR, 70–180 mg/dL). Whether TITR provides additional prognostic value for diabetic retinopathy (DR) in adults with type 1 diabetes (T1D) remains unclear.
Methods:
We conducted a retrospective cohort study of 309 adults with T1D on multiple daily insulin injections using intermittently scanned continuous glucose monitoring (CGM) system. Ophthalmological assessments were performed at baseline and after 12 months (May 2024–May 2025). DR incidence (in those free of DR at baseline) and progression (in those with established DR) were defined according to Early Treatment Diabetic Retinopathy Study criteria. Longitudinal TITR and TIR were extracted every 14–28 days. Multivariable logistic regression adjusted for age, sex, diabetes duration, HbA1c, hypertension, Low-density lipoprotein (LDL) cholesterol, body mass index, and smoking was applied.
Results:
At baseline, 198 participants (64.1%) had no DR, 71 (23.0%) nonproliferative, and 40 (12.9%) proliferative DR. During follow-up, 10/198 (5.1%) developed DR and 26/111 (23.4%) with baseline DR progressed. Higher TITR was independently associated with lower risk of incident DR (adjusted OR per % increase: 0.965; 95% CI: 0.950–0.980), whereas TIR was not. Receiver operating characteristic analysis confirmed superior discrimination for TITR versus TIR (area under the curve 0.580 vs. 0.430; P < 0.001). In stratified analyses, TITR predicted incident DR only among participants with HbA1c below the cohort median (7.1%). Both TITR and TIR were associated with lower risk of DR progression in models including HbA1c, with similar discriminative performance. Diabetes duration, HbA1c, hypertension, and smoking were independently associated with DR outcomes alongside CGM metrics.
Conclusions:
TITR provides modestly superior predictive value over TIR for incident DR, particularly in individuals with near-target HbA1c, but both metrics perform similarly for predicting progression. CGM-derived metrics should be interpreted in the context of overall glycemic control and clinical risk factors.
Introduction
Type 1 diabetes (T1D) is a chronic autoimmune disease associated with a substantial clinical and economic burden, primarily due to its long-term complications.1,2 Among these, diabetic retinopathy (DR) stands out as one of the most prevalent and specific microvascular manifestations of T1D. It is characterized by progressive neurovascular degeneration driven by chronic hyperglycemia. 3 Proliferative DR, which represents its most advanced form, can lead to irreversible vision loss and remains one of the leading causes of preventable blindness worldwide,4,5 while also significantly contributing to the financial pressure on healthcare systems. 6 Long-term data from the Wisconsin Epidemiologic Study of Diabetic Retinopathy, with up to 25 years of follow-up, have shown that the majority of individuals with T1D eventually develop some degree of DR, with a substantial proportion progressing to vision-threatening stages. 7 Although the incidence and progression of DR have declined over recent decades, likely as a result of improved glycemic control and earlier disease detection, the overall burden remains considerable. 8
The development and progression of DR in people with T1D is influenced by a wide range of clinical and demographic factors. Established risk factors 9 include younger age at diabetes onset, 10 longer disease duration11,12 hypertension,13,14 dyslipidaemia,15,16 smoking, 17 obesity,14,16 and poor glycemic control.18–20 In this context, the advent of continuous glucose monitoring (CGM) systems has enabled the use of novel glucose metrics that offer a more nuanced characterization of glycemic exposure, opening new avenues for understanding their relationship with DR. While time in range (TIR; 70–180 mg/dL) has become the predominant metric following the publication of the International Consensus on Time in Range 21 and has even been proposed as a valid clinical trial endpoint, 22 time in tight range (TITR; 70–140 mg/dL) has gained increasing attention in recent years.23–25 It is now considered an emerging target in the era of technological and therapeutic advances in T1D. Although TITR and TIR are highly correlated and both predict glycated haemoglobin (HbA1c) levels effectively, TITR may offer additional advantages in specific clinical contexts 26 and has been proposed as a useful alternative for individuals requiring stricter glycemic control. 27
To date, only one retrospective case–control study has longitudinally assessed the association between TITR and incident DR in individuals with T1D, based on CGM data collected annually during scheduled clinical visits. 28 In that study, TITR demonstrated a predictive performance for incident DR comparable with that of TIR, HbA1c, and mean glucose. In addition, some cross-sectional studies have reported a significant association between TITR and the presence of DR; 29 however, its prognostic value for the incidence or progression of DR has not yet been evaluated using continuous CGM data over a defined follow-up period or within a cohort design in adults treated with multiple daily insulin injections.
Against this background, the aim of the present study was to compare the predictive value of TITR versus TIR regarding the incidence and progression of DR in adults with T1D treated with multiple daily insulin injections.
Materials and Methods
Study design
We conducted a single-center, retrospective cohort study including individuals with T1D treated with multiple daily insulin injections. Eligible participants were regular users of the FreeStyle Libre 2® intermittently scanned CGM (isCGM) system (Abbott), with data available on the LibreView platform since at least May 1, 2024, and who had undergone an ophthalmological evaluation within the preceding 2 years (from May 1, 2022). From that index date, up to 22 sequential CGM data downloads (one baseline and 21 successive 14-day intervals) were analyzed over a 12-month follow-up period ending on May 1, 2025. Data about DR diagnosis and/or progression were also collected in the setting of ophthalmological evaluation during the follow-up period, starting from the index date above mentioned. Inclusion criteria were a confirmed diagnosis of T1D and regular use of isCGM. Exclusion criteria included: diagnosis of type 2 diabetes, monogenic diabetes (e.g., MODY), use of insulin pump therapy, and absence of ophthalmological evaluation during the follow-up period. The study followed the Strengthening the Reporting of Observational Studies in Epidemiology (STROBE) guidelines 30 and was approved by the Research Ethics Committee of Hospital Universitario de La Princesa (Madrid,Spain) (Study number: 5814 01/25). The research was conducted in accordance with the Declaration of Helsinki. To reduce device- and treatment-related heterogeneity, we included only adults on multiple daily insulin injections using the same isCGM, as cross-platform differences in CGM accuracy may bias glucose metrics,31,32 and pump users may differ systematically from multiple daily insulin injectionsusers in ways that could confound retinal outcomes.
Data collection and variables
DR was classified according to the internationally accepted criteria of the Early Treatment Diabetic Retinopathy Study (ETDRS). 33 Mild DR was defined as the presence of at least one microaneurysm. Moderate DR included microaneurysms with hard exudates, cotton wool spots or blot hemorrhages. Severe DR was defined by the presence of more than 20 intraretinal hemorrhages per quadrant, venous beading in ≥2 quadrants or prominent intraretinal microvascular abnormalities in ≥1 quadrant, in the absence of proliferative features. Proliferative DR was diagnosed in the presence of neovascularization or vitreous/preretinal hemorrhage. Incident DR was defined as no DR at baseline progressing to any DR at follow-up ophthalmological assessment. Progression of DR was defined as an increase in severity grade between the baseline and follow-up examinations. Stability or improvement was defined as no change in grade or a lower DR grade at follow-up, respectively. Glucose metrics were extracted from the LibreView platform at 14-day intervals and included: TIR (70–180 mg/dL), TITR (70–140 mg/dL), time below range (TBR, <70 mg/dL), time above range (TAR, >180 mg/dL), number of daily scans, sensor usage, coefficient of variation (CV) and standard deviation (SD). Downloads with sensor usage <70% were excluded from analysis due to data being considered not evaluable. 21 Additional sociodemographic, clinical and laboratory data were retrieved from the electronic medical record: age, sex, diabetes duration, body mass index (BMI), smoking status, baseline HbA1c, most recent HbA1c available and total daily insulin dose. HbA1c was measured by ion-exchange high-performance liquid chromatography (ADAMS A1c HA8180 V, ARKRAY®). Total cholesterol was assessed by enzymatic methods (Alinity C Cholesterol Reagent Kit, Abbott).
Statistical analysis
Statistical analyses were performed using STATA version 17.0. Outliers were assessed through visual inspection and statistical methods. Normality of distribution was evaluated using the Kolmogorov–Smirnov test and normal probability plots. Continuous variables with suspected extreme values were winsorized at the 1st and 99th percentiles. Normally distributed continuous variables are presented as mean ± standard deviation (SD), while non-normally distributed variables are reported as median (25th–75th percentiles). Categorical variables are described as absolute and relative frequencies.
The cohort was initially stratified into three groups: no retinopathy, nonproliferative retinopathy, and proliferative retinopathy or macular edema. Baseline group comparisons were conducted using ANOVA or the Kruskal–Wallis test, depending on distribution. Comparisons of clinical and CGM-derived metrics between individuals who developed or did not develop DR, as well as between those with progression versus stability of DR, were conducted using the Wilcoxon signed-rank test. Descriptive plots were generated for mean TIR and TITR according to incident DR in participants without baseline retinopathy and according to progression versus stability among those with DR at baseline. Receiver operating characteristic (ROC) curves were generated using predicted probabilities from logistic regression models, and the corresponding areas under the curve (AUC) were estimated with standard nonparametric methods. AUCs were compared using the DeLong test.
Finally, multivariable logistic regression models for panel data were fitted to assess the association between CGM-derived metrics and the incidence or progression of DR. Models were adjusted for age, sex, mean HbA1c (2024–2025), hypertension, Low-density lipoprotein (LDL) cholesterol, diabetes duration, and BMI. Because of the collinearity between mean HbA1c (2024–2025) and CGM-derived glucose metrics, two sets of models were constructed: one including HbA1c and one excluding it. In addition, we explored potential effect modification by glycemic control through HbA1c×TIR and HbA1c×TITR interaction terms, and by performing stratified analyses according to the median HbA1c value of the cohort.
Results
Study cohort characteristics
Of the 342 individuals initially assessed for eligibility, 25 were excluded due to the absence of CGM data during follow-up or lack of ophthalmological evaluation within the study period. Among those excluded, 4 (16%) had DR, while 21 (84%) showed no signs of DR. The final cohort consisted of 309 participants who completed follow-up until May 2025. At baseline (May 2024), 198 participants (64.1%) had no evidence of DR, 71 (23.0%) had nonproliferative DR, and 40 (12.9%) presented with proliferative DR or diabetic macular edema. The cohort flowchart is shown in Figure 1. A total of 6198 CGM downloads were obtained out of a theoretical maximum of 7182 (86.3% completeness). After excluding downloads with <70% active sensor time, missing uploads, or temporary discontinuation of sensor use, and removing participants who did not complete follow-up, 4208 evaluable downloads were retained (median 11 [IQR 6–16] per participant).

Flowchart. Baseline: May 2024. A total of 115 individuals had some degree of diabetic retinopathy; four of them were lost to follow-up. *Incidence was estimated among individuals without DR at baseline.
At baseline, the mean age was 51.4 ± 17.3 years, and 46.6% were women. Fifty-seven individuals (18.5%) were active smokers and 90 (29.3%) had a diagnosis of hypertension. The mean diabetes duration was 24.5 ± 13.6 years. The most recent mean HbA1c was 7.3% ± 1.0% (56 ± 11 mmol/mol [45–67]). Median TIR (70–180 mg/dL) was 68% (IQR: 55–77), and TITR (70–140 mg/dL) was 45% (IQR: 33–55). Compared with participants without DR, those with retinopathy were older, had a higher prevalence of hypertension, a longer diabetes duration, and higher levels of HbA1c, mean glucose, glucose management indicator (GMI), and TAR >250 mg/dL. No significant differences were observed in TIR or TITR. Baseline characteristics are detailed in Table 1.
Baseline Characteristics of the Cohort
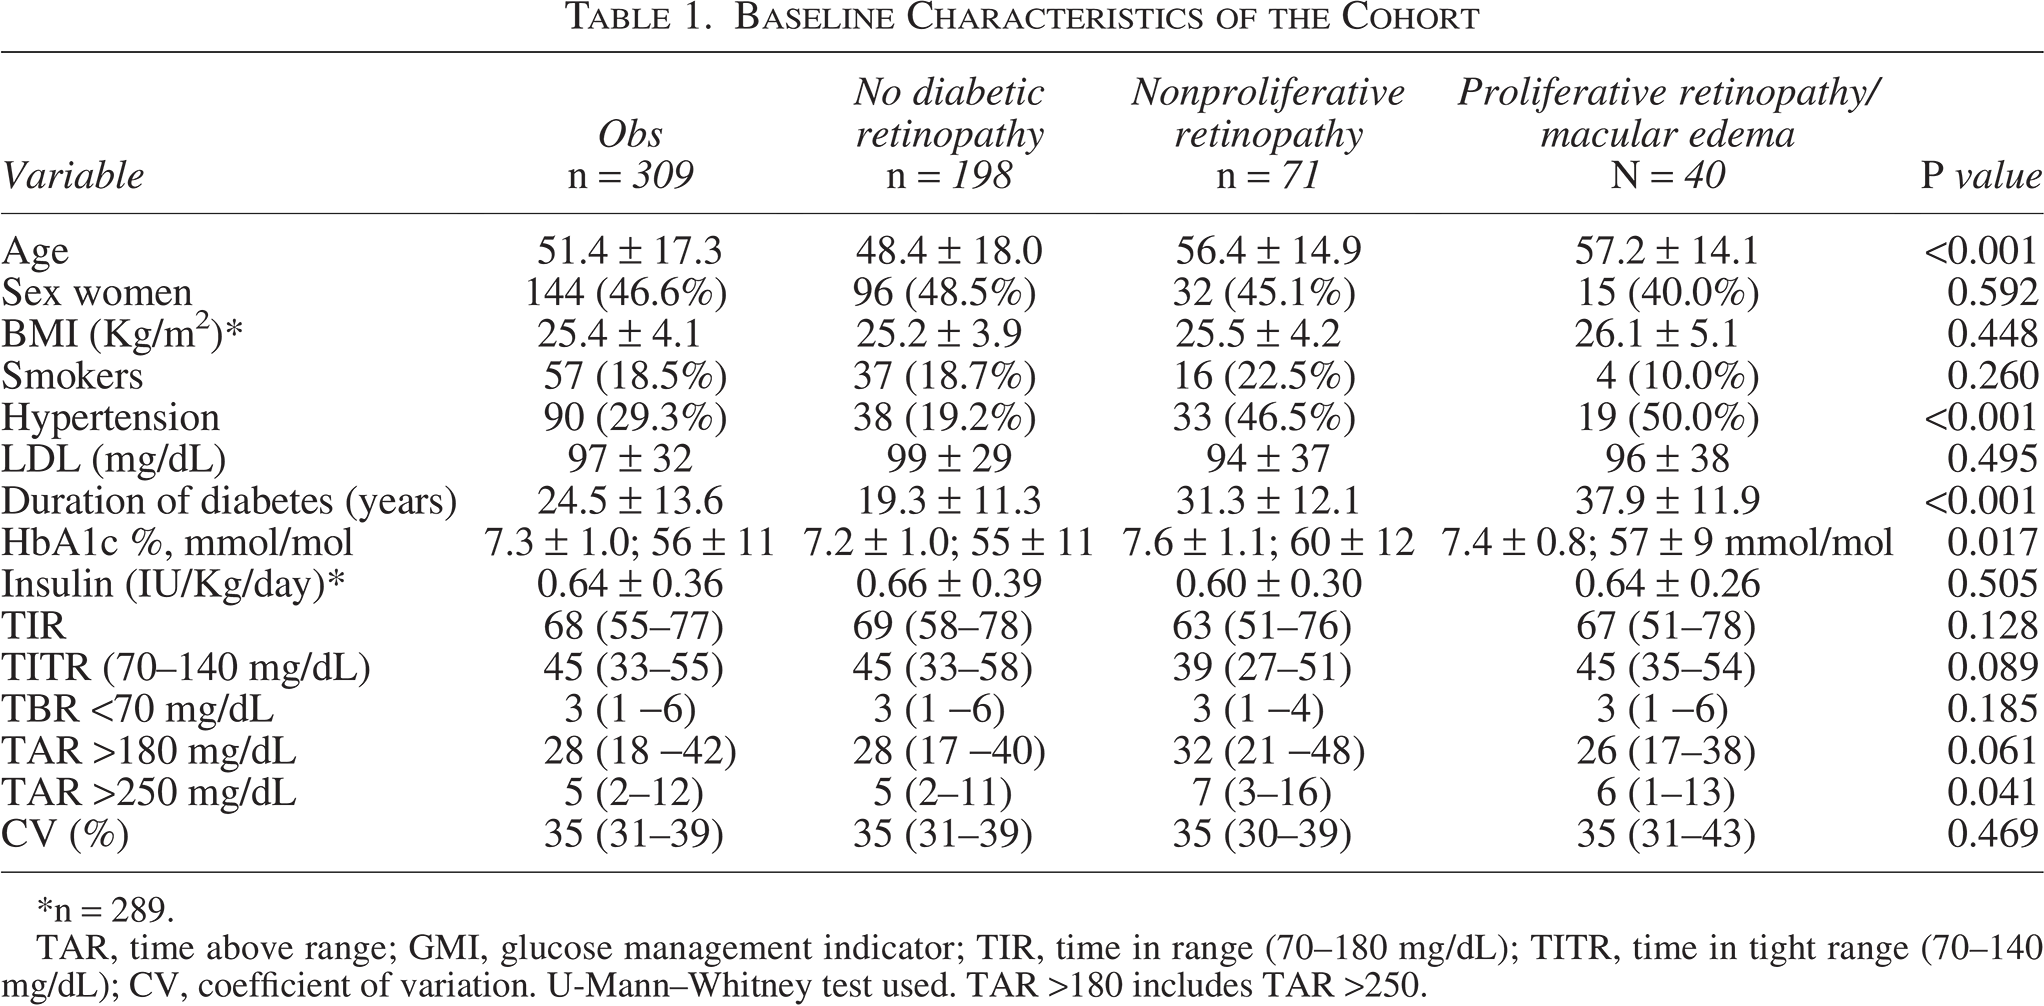
n = 289.
TAR, time above range; GMI, glucose management indicator; TIR, time in range (70–180 mg/dL); TITR, time in tight range (70–140 mg/dL); CV, coefficient of variation. U-Mann–Whitney test used. TAR >180 includes TAR >250.
Incidence of DR
Among the 198 participants without DR at baseline, 10 (5.1%) developed DR between May 2024 and May 2025. Those who developed DR had a longer diabetes duration (26.4 ± 11.0 vs. 18.9 ± 11.3 years; P = 0.034) and a higher median HbA1c during follow-up (7.4% [IQR: 6.7–7.9] (57 [IQR: 50–63] mmol/mol) vs. 7.0% [IQR: 6.5–7.5] (53 [IQR: 48–58] mmol/mol); P = 0.014). They also exhibited significantly higher values of mean glucose, GMI, and glucose coefficient of variation. In contrast, participants who did not develop DR had significantly higher TITR values (P < 0.05). No significant differences were observed in TIR between groups (P = 0.877). Full results are presented in Table 2.
Diabetic Retinopathy Incidence

U-Mann–Whitney test used. TAR >180 includes TAR >250. *n = 289.
Panel data.
Longitudinal analysis of TIR and TITR revealed inconsistent TIR trajectories over time, while TITR showed a more consistent pattern, with persistently lower values in participants who developed DR. This suggests greater discriminative capacity of TITR regarding the development of DR (see Fig. 2).
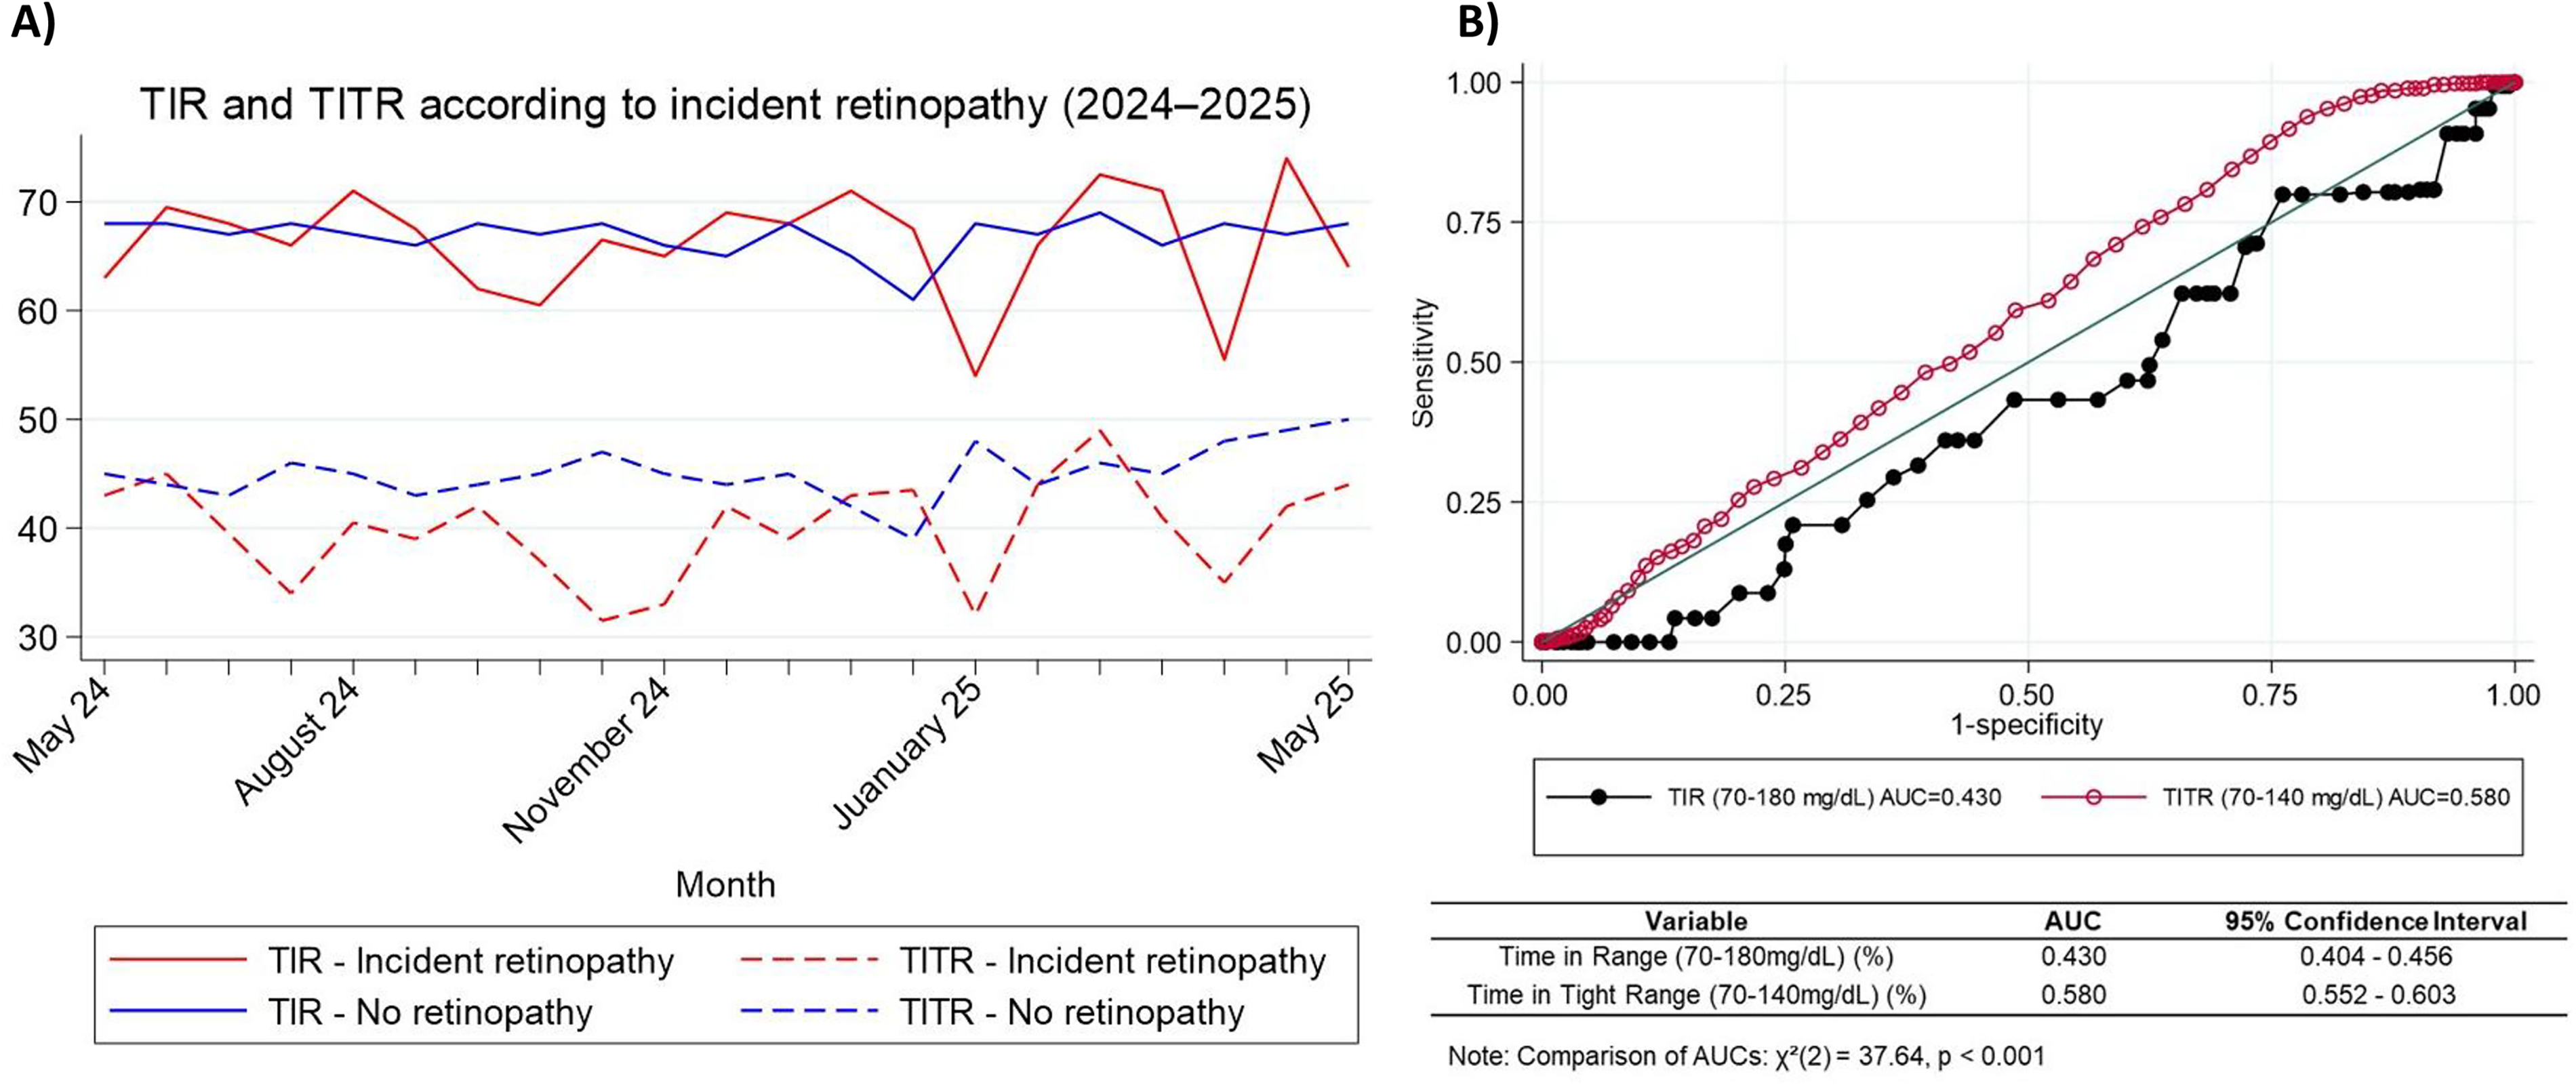
Monthly time in range (TIR) and time in tight range (TITR) by diabetic retinopathy (DR) incidence status and discriminative performance for incident diabetic retinopathy.
Discriminative performance analysis
ROC curves were constructed to compare the discriminative performance of TITR and TIR in predicting incident DR. The AUC for TITR was 0.580, significantly higher than that of TIR (AUC = 0.430; P < 0.001) (see Fig. 2). Among other evaluated metrics, TAR >250 mg/dL showed the best performance (AUC = 0.5428; 95% CI: 0.5035–0.5822), followed by mean glucose (AUC = 0.5314) and TAR >180 mg/dL (AUC = 0.5148). GMI showed the lowest discriminative ability (AUC = 0.4625). Global comparisons between metrics were statistically significant (P < 0.001), indicating heterogeneity in their predictive performance (see Supplementary Table S1).
Multivariable analysis for DR incidence
We first evaluated the independent association between TITR and incident DR using multivariable logistic regression adjusted for age, sex, diabetes duration, hypertension, smoking, and LDL cholesterol. Higher TITR was significantly associated with a reduced risk of DR (adjusted OR: 0.986; 95% CI: 0.975–0.997; P = 0.016). In contrast, TIR was not significantly associated with incident DR (adjusted OR: 1.003; 95% CI: 0.999–1.018; P = 0.591). Other significant predictors in the TITR model included age, diabetes duration, hypertension, and smoking. Comparable associations were observed in the TIR model, except that TIR itself was not a significant predictor (Supplementary Table S2).
As a sensitivity analysis, both models were repeated with mean HbA1c (2024–2025) included as a covariate. TITR remained independently associated with a lower risk of incident DR (adjusted OR: 0.965; 95% CI: 0.950–0.980; P < 0.001), confirming the robustness of the association. However, in this setting, HbA1c appeared paradoxically protective (adjusted OR: 0.466; 95% CI: 0.318–0.680; P < 0.001), a finding that likely reflects collinearity between HbA1c and CGM-derived metrics rather than a true biological effect (Supplementary Table S2). We next examined whether the association of TITR and TIR with DR was modified by long-term glycemic control. Both metrics demonstrated significant interactions with HbA1c (TITR×HbA1c, P < 0.001; TIR×HbA1c, P = 0.003), indicating that their predictive value varied by HbA1c level. In stratified analyses, TITR was strongly associated with reduced DR risk among participants with HbA1c below the cohort median (7.1%), but not among those with higher HbA1c. Conversely, TIR showed an inverse association with DR only in the lower HbA1c stratum, while in the higher stratum it was not protective and even trended toward increased risk. These findings suggest that CGM-derived metrics, particularly TITR, provide additional prognostic information when HbA1c is near target, whereas their discriminative value is attenuated at higher HbA1c levels (Supplementary Table S2).
Progression of DR
Among the 111 participants with DR at baseline, 85 (76.6%) remained stable during follow-up, while 26 (23.4%) experienced disease progression. Those with progression had a significantly lower baseline BMI (24.0 ± 3.5 vs. 26.2 ± 4.7 kg/m2; P = 0.026) and lower TITR values [median: 36%; IQR: 27–48] compared with those with stable disease [median: 40%; IQR: 28–50]; P = 0.021. Participants with progression also showed higher values of mean glucose, GMI, and time above range (>180 and >250 mg/dL). TIR was lower in the progression group, although this did not reach statistical significance. Complete data are shown in Supplementary Table S3. Longitudinal analysis revealed consistently higher TIR and TITR values in participants without progression over the follow-up period, with stable trends over time (Fig. 3).
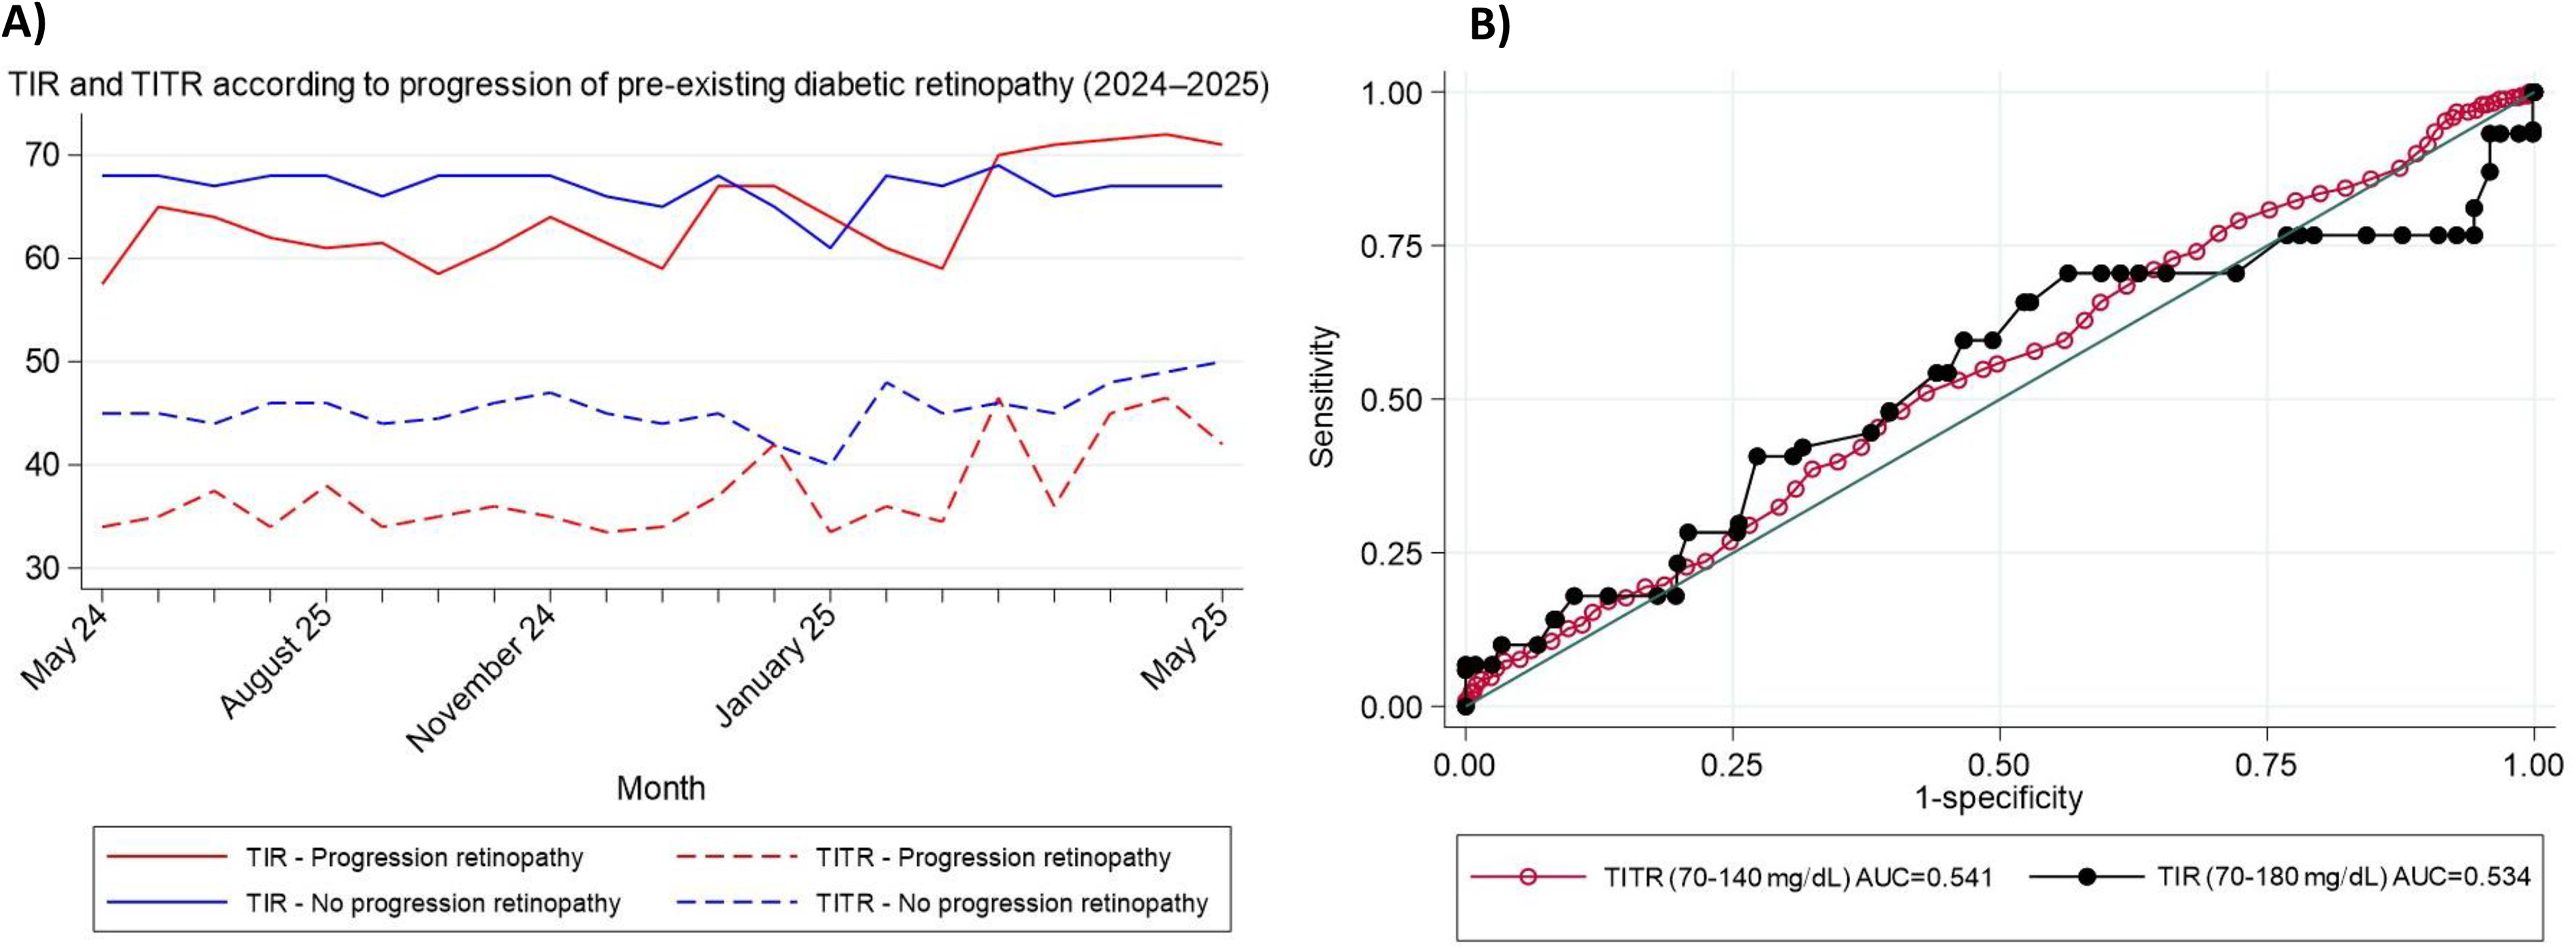
Predictive analysis of DR progression
ROC curve analysis showed that both TIR and TITR had similar discriminative performance in identifying DR progression (AUC = 0.534 and 0.541, respectively; P = 0.56, Fig. 3). GMI and TAR >250 mg/dL had the highest AUC values (0.5765 and 0.5756, respectively), followed by mean glucose (AUC = 0.5634). TAR >180 mg/dL had lower performance (AUC = 0.540). Overall differences among metrics were statistically significant (P < 0.001), indicating heterogeneity in their capacity to discriminate DR progression (see Supplementary Table S4).
Multivariable analysis for DR progression
Multivariable models adjusted for age, sex, diabetes duration, smoking status, hypertension, LDL cholesterol, and BMI showed that both TITR and TIR were associated with a lower risk of DR progression. In the model including TITR, higher TITR was associated with reduced progression risk (adjusted OR: 0.993; 95% CI: 0.981–1.002; P = 0.112), although the association was not statistically significant. In contrast, TIR remained significantly associated with lower progression risk (adjusted OR: 0.989; 95% CI: 0.981–0.998; P = 0.022). Subsequent models including mean HbA1c (2024–2025) confirmed that both TITR (adjusted OR: 0.982; 95% CI: 0.966–0.996; P < 0.001) and TIR (adjusted OR: 0.977; 95% CI: 0.965–0.990; P < 0.001) remained independently associated with DR progression. Full results are provided in Supplementary Table S5.
Discussion
This is the first study to directly compare the longitudinal utility of TITR (70–140 mg/dL) versus conventional TIR (70–180 mg/dL) for predicting the incidence and progression of DR in adults with T1D treated with multiple daily insulin injections. Our findings suggest that TITR may offer slightly greater predictive value than TIR for incident DR, independently of classical clinical variables such as HbA1c, hypertension, smoking status, or diabetes duration. In contrast, both metrics demonstrated comparable performance in predicting DR progression in individuals with preestablished disease.
In our cohort, CGM-derived metrics showed modest standalone discrimination and were most informative when interpreted alongside established risk factors. For incident DR, TITR outperformed TIR (AUC 0.580 vs. 0.430) and remained independently associated with lower risk after multivariable adjustment (adjusted OR per 1% increase 0.965; ≈30% lower odds per +10% TITR), whereas TIR was not independently predictive. For DR progression, TITR and TIR displayed similar and modest discrimination (AUC 0.541 and 0.534, respectively) and both were independently associated with lower risk in HbA1c-adjusted models (TITR OR per 1% 0.982; ≈16% lower odds per +10%; TIR OR per 1% 0.977; ≈21% per +10%). Other markers of glycemic burden (e.g., average glucose, GMI, and TAR >250 mg/dL) showed better discrimination for progression than TITR/TIR. Notably, classical determinants including longer diabetes duration, higher HbA1c, hypertension, and smoking contributed substantially to risk in all models, suggesting that CGM metrics should complement rather than replace established clinical predictors when stratifying the risk of incident and progressive DR.
TITR has gained increasing attention in recent literature, particularly in the context of advanced hybrid closed-loop systems, which aim to optimize glycemic control near euglycemia. Prior studies have demonstrated a strong correlation between TITR and TIR,26,29 although this concordance may diminish in settings of low glycemic variability.34,35 A recent study proposed that achieving a TITR >50% may represent a clinically meaningful target, being associated with a GMI <6.5%. 24 The longitudinal impact of TITR on DR was previously explored in a retrospective study collecting glucose metrics during annual clinical visits over 7 years, which found concordance between several glycemic metrics and DR incidence. 28 However, that study did not explicitly compare the predictive value of different metrics—likely due to its design and reliance on isolated annual data points. Our study expands upon these findings by employing continuous isCGM-derived data in a real-world clinical context, with an overall acceptable glycemic control (median HbA1c ∼7.0%) and a homogeneous cohort in terms of treatment regimen and CGM device.
In individuals without DR at baseline, TITR appeared to more accurately capture subtle fluctuations in glycemic exposure within the context of chronic good control, where extreme glucose values are less frequent. This greater sensitivity to reflect minor but sustained elevations in glucose may explain its superior utility in predicting DR onset. Supporting this hypothesis, studies in individuals with type 2 diabetes using short-term CGM and prospective ophthalmological follow-up have shown that DR development is more closely linked to mild but sustained hyperglycemic exposure—patterns that TITR may reflect better than TIR does. 36 Conversely, among individuals with pre-existing DR, TIR demonstrated comparable predictive utility with TITR. In this subgroup, characterized by higher median HbA1c (∼7.4%), glycemic burden appeared to be more heavily influenced by overt hyperglycemia. Indeed, TAR >250 mg/dL and GMI were shown to be the metrics with the strongest predictive value for DR progression. This pattern aligns with prior cross-sectional findings in individuals with HbA1c <7%, where TAR >250 mg/dL was the metric most strongly associated with the presence of DR. 37 The differing predictive value of TITR and TIR according to DR stage may reflect the nonlinear nature of their association with glycemic control. Beck et al. demonstrated that while TITR and TIR are highly concordant, this relationship is modulated by additional parameters such as the coefficient of variation and time in hypoglycemia. 38 A longitudinal study in nearly 2000 young individuals with T1D also found that glycemic variability influences the relationship between TITR and TIR. 26 In that study, TIR showed stronger predictive power for HbA1c, which may explain its weaker association with incident DR in our cohort. Specifically, because TIR is highly collinear with HbA1c, its independent predictive value diminishes when HbA1c is excluded from the model. In contrast, TITR may better reflect broader aspects of glucose stability, particularly postprandial and nocturnal control, and appears less affected by collinearity with HbA1c-potentially accounting for its consistent association with DR incidence in both adjusted and unadjusted models. This interpretation is supported by our stratified analyses, which revealed that TITR was strongly associated with a reduced risk of DR incidence only among participants with HbA1c below the cohort median of 7.1%, whereas the association disappeared at higher HbA1c levels. By contrast, TIR also predicted lower DR risk in the lower HbA1c stratum, but showed a positive association with DR incidence when HbA1c was above 7.1%. These findings suggest that TITR may be more informative in individuals achieving near-target glycemic control, while the apparent association of TIR with increased DR risk at higher HbA1c levels could reflect collinearity and statistical artifacts rather than a true biological relationship.
Taken together, our results support the combined use of TITR and HbA1c as prognostic tools in individuals without DR. Despite a uniform follow-up with consistent treatment regimens and isCGM devices, the overall predictive capacity of CGM-derived metrics for DR was moderate. In this context, modifiable cardiovascular risk factors such as smoking 17 and hypertension13,14 emerged as relevant determinants of DR incidence, while classical factors such as age, sex and dyslipidemia were associated with a greater risk of progression in individuals with pre-existing DR. 8 An unexpected finding was the inverse association between BMI and DR risk, a relationship previously described in type 2 diabetes, 39 but less explored in T1D. Kim et al. reported a non-significant trend toward greater DR progression among individuals with lower BMI 40 and a recent large multicenter study suggested that the association between BMI and DR progression could vary by geographic region. 41 Further prospective studies are warranted to confirm this hypothesis in T1D populations.
This study has important limitations. Its retrospective, single-center design limits external validity and precludes causal inference. We did not evaluate optimal cut-off points for TITR or TIR, as this would require internal or split-sample cross-validation in accordance with TRIPOD guidelines, 42 followed by prospective external validation. Moreover, lifestyle factors such as physical activity and diet-which may influence DR risk-were not collected. Socioeconomic status, increasingly recognized as a determinant of diabetes complications,43–45 was also not analyzed. Data on ophthalmological interventions and DR regression or improvement were not collected. Furthermore, although isCGM metrics were extracted in a standardized manner, HbA1c values were not always temporally aligned with CGM downloads. Finally, the small number of incident events may limit the robustness of the statistical analyses, and the exclusive inclusion of individuals treated with multiple daily insulin injections and isCGM restricts the generalizability of our findings.
In conclusion, TITR appears to offer superior utility over conventional TIR for predicting the incidence of DR, independently of other clinical variables including HbA1c. However, both metrics demonstrate similar performance in predicting disease progression. The relative value of each glycemic metric may depend on the stage of DR and the baseline level of glycemic control. Therefore, CGM-derived metrics should be interpreted within the context of the patient’s broader clinical profile rather than be considered as standalone predictors.
Authors’ Contributions
F.S.-V. conceived the study, coordinated the project, researched data, conducted the literature review, and wrote the first draft of the article. E.G.-A. and A.S.-R. collected and curated the data, contributed to the discussion, and reviewed/edited the article. S.G.C., S.A., and M.S.T.-S. contributed to data analysis, figure preparation, and article editing. V.N.-M. and J.A.A.-M. assisted with clinical interpretation of the results and critically revised the article. E.P.L.-P. contributed to the ophthalmological assessments and interpretation of retinopathy findings. M.M. supervised the study, supported funding acquisition, and reviewed/edited the article. All authors reviewed and approved the final version of the article.
Footnotes
Acknowledgment
The authors acknowledge the Spanish Society of Diabetes (Sociedad Española de Diabetes, SED) for its decisive support of this project through the “XV AYUDAS SED A PROYECTOS DE INVESTIGACIÓN EN DIABETES DIRIGIDOS POR JÓVENES INVESTIGADORES.”
Author Disclosure Statement
The authors declare that they have no competing interests.
Funding Information
This work was funded by Proyectos de Investigacion en Salud PI19/00584, PI22/01404 and PMP22/00021 (funded by Instituto de Salud Carlos III), iTIRONET- P2022/BMD7379 (funded by Comunidad de Madrid), and co-financed by FEDER funds to M.M.
Availability of Data and Materials
The datasets used and/or analyzed during the current study are available from the corresponding author on reasonable request.
Ethics Approval and Consent to Participate
The Research Ethics Committee of Hospital Universitario de La Princesa (Madrid, Spain), (Study number: 5814 01/25 approved this study and waived informed consent from patients. The research was conducted according to the Declaration of Helsinki.
Supplemental Material
References
Supplementary Material
Please find the following supplemental material available below.
For Open Access articles published under a Creative Commons License, all supplemental material carries the same license as the article it is associated with.
For non-Open Access articles published, all supplemental material carries a non-exclusive license, and permission requests for re-use of supplemental material or any part of supplemental material shall be sent directly to the copyright owner as specified in the copyright notice associated with the article.