
Abstract
Aims:
To evaluate the impact of automated insulin delivery (AID) systems on the incidence and progression of diabetic retinopathy (DR) in adults with type 1 diabetes (T1D) compared with multiple daily injections (MDI).
Methods:
This prospective cohort study followed 379 adults with T1D for a mean of 4.9 ± 1.4 years. DR was assessed via standardized retinal imaging. At baseline, 80 participants used AID, and 35 initiated AID during follow-up; 264 remained on MDI. Outcomes included baseline DR prevalence, incident DR, and DR progression. Multivariate Poisson and Cox regression models adjusted for key covariates (age, diabetes duration, pre-baseline HbA1c) were used, with propensity score-matched and HbA1c trajectory analyses as sensitivity checks.
Results:
DR prevalence at baseline was 13.9% with no group differences. Incident DR was lower among AID users (6.1% vs. 18.9% in MDI; hazard ratio = 0.33, 95% confidence interval: 0.13–0.73; P = 0.01; number needed to treat = 8). DR progression and all vision-threatening events occurred only in the MDI group (41.7% vs. 0%; P < 0.001). Use of AID systems resulted in a greater reduction in HbA1c compared with MDI (−0.32% vs. −0.06%; P = 0.01).
Conclusions:
AID systems were associated with improved glycemic control and reduced incidence and progression of DR in adults with T1D. These findings support AID use to prevent early microvascular complications.
Keywords
Introduction
Long-term glycemic control is key to preventing complications in type 1 diabetes (T1D).1,2 The Diabetes Control and Complications Trial (DCCT) and its follow-up Epidemiology of Diabetes Interventions and Complications (EDIC) study demonstrated that intensive glycemic management significantly reduces the incidence and progression of diabetic retinopathy (DR) and the need for vision-saving procedures.3–5 These findings established early tight glycemic control as the foundation of T1D care and a benchmark for evaluating new therapies and technologies. However, DCCT/EDIC predated modern tools such as continuous glucose monitoring (CGM) and automated insulin delivery (AID) systems, which are now reshaping diabetes management.
AID systems revamped T1D management, offering algorithm-driven insulin adjustments and, in advanced models, automated correction boluses. 6 Randomized controlled trials and real-world studies consistently show that AID systems improve glycemic outcomes and time in range (TIR), with strong Grade A evidence supporting their clinical use.1,6–8 AID implementation progressed gradually—as influenced by regional health policies and reimbursement pathways—with a recent rapid expansion that explains that AID technologies are now widely available in many countries.1,6,7,9,10
Although AID systems clearly improve glycemic control, their long-term effects on chronic complications—particularly microvascular outcomes—remain uncertain. As AID adoption increases, evaluating its impact beyond glycemic metrics becomes essential. We therefore conducted a prospective, real-world study to compare the incidence of DR in adults with T1D using AID systems versus multiple daily injections (MDI).
Methods and Ethics
Study design
We conducted a prospective, observational, longitudinal study at the Type 1 Diabetes Unit of a tertiary university hospital in Madrid, Spain. The protocol was approved by the Hospital Universitario Ramón y Cajal Ethics Committee (CEIM No. 189/17; October 4, 2017; NCT04950634) and adhered to the Declaration of Helsinki. All participants provided written informed consent before enrollment. Between January 2018 and December 2021, we consecutively enrolled 379 adults with T1D under regular follow-up.
The primary objective was to compare the incidence of DR between adults treated with AID systems and those managed with MDI. Secondary aims included: (1) assessing the baseline prevalence of DR; (2) evaluating DR severity and progression during follow-up; and (3) analyzing metabolic outcomes, including the percentage change in HbA1c from baseline and the longitudinal changes in glycemic variability metrics and TIR.
Study population
Participants were eligible for inclusion if they were adults (aged ≥18 years) with a diagnosis of T1D confirmed according to the American Diabetes Association criteria 11 and a minimum disease duration of 5 years at the time of enrollment. Additional inclusion criteria required regular follow-up at our outpatient clinic and the availability of at least one gradable baseline retinal examination. Individuals were excluded if they had concomitant ocular conditions that could interfere with a reliable DR assessment—such as advanced glaucoma or age-related macular degeneration—or if they were unable to provide informed consent.
Analysis-specific populations
For the prevalence analysis, all participants with a gradable retinal assessment at baseline were included, regardless of previous DR diagnosis or history of ocular interventions. The incidence analysis was restricted to individuals who were free of DR at baseline, defined according to the International Clinical Diabetic Retinopathy (ICDR) “no DR” category, and without prior DR-specific treatments. Progression analyses were conducted among participants with any degree of DR at baseline and defined as the occurrence of at least one of the following: a worsening of two or more steps on the ICDR scale, the development of referable DR, or initiation of a DR-related therapy.
In addition, to address potential baseline imbalances between participant comparison subgroups inherent to real-world cohorts, supplementary analyses were conducted in a propensity score-matched (PSM) subset. Matching was based on age, duration of diabetes, mean HbA1c in the 5 years preceding study entry, triglycerides, and statin use.
Operational definitions
The baseline (index) date was defined as the participant’s first gradable retinal screening examination. A retinal assessment was considered gradable if fundus photographs were of sufficient quality to permit classification according to the ICDR severity scale. 12 A history of DR-specific intervention was defined as any panretinal or focal/grid laser photocoagulation, intravitreal injection of anti-vascular endothelial growth factor agents or corticosteroids, or vitrectomy documented before the index date.
Study procedures
At baseline, demographic and clinical characteristics were collected, including age, sex, diabetes duration, smoking status, medication use, cardiovascular risk factors, and prior complications. Physical examination comprised blood pressure, heart rate, height, weight, and body mass index (BMI). Laboratory tests (HbA1c, renal function, lipid profile) were obtained at baseline and at follow-up visits as part of routine care. All HbA1c determinations were performed in the same certified laboratory using high-performance liquid chromatography (HPLC; National Glycohemoglobin Standardization Program [NGSP]-certified and DCCT-aligned), ensuring consistency across the study period.
Treatment modality was classified as AID if participants used a hybrid closed-loop system at baseline or initiated one during follow-up (“ever-AID” definition). During the study period, the AID system available at our center was the MiniMed™ 780G system (Medtronic Diabetes, Northridge, CA, USA). All AID users in this study were treated with the MiniMed 780G system. Although the MiniMed 670G system received CE marking in June 2018, its use at our institution was minimal. A small number of patients briefly initiated therapy with MiniMed 670G but were upgraded to MiniMed 780G immediately after its availability in July 2020. There was no concurrent use of both systems, and no participant contributed follow-up time under MiniMed 670G.
Data collection and measures
Primary endpoint
Incident DR is defined as the first detection of any DR during follow-up among participants free of DR at baseline. The event date was the time of the first positive retinal screen. Participants were censored at the last negative screen, loss to follow-up, or study end.
Secondary endpoints
Retinal ascertainment and grading
Retinal outcomes were obtained through the hospital’s standardized screening program, which included two-field nonmydriatic fundus photography performed annually, in accordance with current clinical guidelines, with optical coherence tomography conducted when clinically indicated. 2 Retinal images were graded by trained ophthalmologists using the ICDR severity scale, classified into five ordinal categories (no DR, mild NPDR, moderate NPDR, severe NPDR—defined by the “4–2–1” rule—and proliferative DR). DME was recorded as present or absent. Images were graded by ophthalmologists blinded to participants’ treatment modality and HbA1c values. Unscheduled ophthalmology visits, interventions, and DR-related procedures were captured and adjudicated from the electronic health record.
Exposure definition for endpoint analyses
The primary exposure was defined as “ever-AID,” including participants who were using an AID system at baseline or who initiated one during follow-up; all others were classified as MDI (see the Study Procedures section). The MiniMed 780G system received CE marking in Europe on June 11, 2020, and was first implemented in our cohort on July 20, 2020. Although the recruitment period began before that date, AID exposure was calculated individually for each participant from the documented initiation of the system until censoring or the occurrence of a retinal event. To minimize immortal-time bias and exposure misclassification, we created a variable representing cumulative exposure to AID (in months) for each participant. This variable was calculated and structured in a start–stop format, assigning 0 exposure months before AID initiation and increasing monthly thereafter. For participants never exposed to AID, cumulative exposure remained 0. This variable was included as a continuous covariate in an adjusted Cox regression model to assess whether longer duration of AID use was independently associated with retinopathy risk.
To assess cumulative glycemic exposure, mean HbA1c in the 5 years preceding baseline and during follow-up was calculated for each participant using all available laboratory measurements extracted from the electronic medical record, with a minimum of three values required. The number of HbA1c results contributing to each mean was documented (mean 9 ± 5 values). All HbA1c determinations were performed in the same certified laboratory using HPLC (NGSP-certified and DCCT-aligned), ensuring methodological consistency across the study period.
Statistical analysis
Continuous variables were summarized as mean ± SD and categorical variables as counts and percentages. Normality of continuous variables was assessed, and log transformation was applied when appropriate. Analyses prioritized estimation over hypothesis testing, reporting effect sizes with 95% confidence intervals (CIs), with two-sided α = 0.05. Follow-up began at the index date and ended at the first qualifying event, last negative retinal screen, loss to follow-up, or study end. The primary analysis compared time to incident DR between AID and MDI using Cox proportional hazards models, with results expressed as hazard ratios (HRs) and 95% CIs. Proportional hazard assumptions were verified with Schoenfeld residuals, and cumulative incidence was illustrated with Kaplan–Meier curves. Secondary analyses included estimation of baseline DR prevalence using Poisson regression with robust variance to obtain prevalence ratios and logistic regression to explore determinants of prevalent DR. DR progression (≥two-step ICDR worsening, referable DR, or intervention) and time to first ophthalmologic intervention were analyzed with Cox models. Longitudinal changes in HbA1c and CGM-derived metrics were evaluated using linear mixed-effects models with random intercepts and random slopes for time when supported by model fit. CGM metrics were analyzed according to international consensus definitions, including only downloads with ≥70% sensor wear. 13
All regression models were adjusted for a prespecified minimal set of covariates (age, sex, diabetes duration, triglycerides, and 5-year pre-baseline mean HbA1c). For progression analyses, given the limited number of events (n = 15), multivariable Cox regression was restricted to diabetes duration and 5-year pre-baseline mean HbA1c to avoid model overfitting in line with recommended events-per-variable criteria.
Sensitivity analyses addressed potential baseline confounding and mediation by glycemic control. First, a PSM cohort was generated using logistic regression to estimate the probability of AID use based on baseline age, diabetes duration, sex, 5-year pre-baseline mean HbA1c, triglyceride levels, and statin use. Participants were matched in a 2:1 ratio using nearest-neighbor matching without replacement. Cox proportional hazards models were then applied in the matched cohort. Second, to explore potential mediation by glycemic control, a Cox model was fitted in the full sample, including the percentage change in HbA1c from baseline to end of follow-up as an additional covariate.
Model assumptions, including proportional hazards for Cox models and linearity for continuous covariates, were assessed using standard diagnostic methods. Robust standard errors were used when model misspecification or heteroscedasticity was suspected. All analyses were conducted using IBM SPSS Statistics, version 29.0 (IBM España S.A., Madrid, Spain).
Results
Study population and baseline characteristics
Between 2018 and 2021, 436 adults with T1D were screened; 57 were excluded due to missing or ungradable retinal imaging. The final cohort included 379 participants followed for a mean of 4.9 ± 1.4 years (range = 3.1–6.5). Follow-up completion was high (97.6%, 370/379), with a mean of 3.6 retinal evaluations per participant. One death occurred during follow-up.
At baseline, 264 participants (70%) were on MDI throughout the study, and 115 (30%) used AID—80 already at baseline and 35 who transitioned during follow-up. Mean AID use at baseline was 10.7 ± 10.5 months; among late adopters, initiation occurred after 15.8 ± 6.3 months. AID users were younger than MDI users (38 vs. 42 years, P = 0.01), more likely to be female (53% vs. 41%, P = 0.01), and had a slightly lower historical HbA1c (7.2% vs. 7.5%, P = 0.02), with similar diabetes duration (24 vs. 25 years, P = 0.68). Other clinical characteristics, including diabetes duration, BMI, and lipid profile, were similar between groups (Table 1).
Baseline Characteristics of Study Participants According to Treatment Group
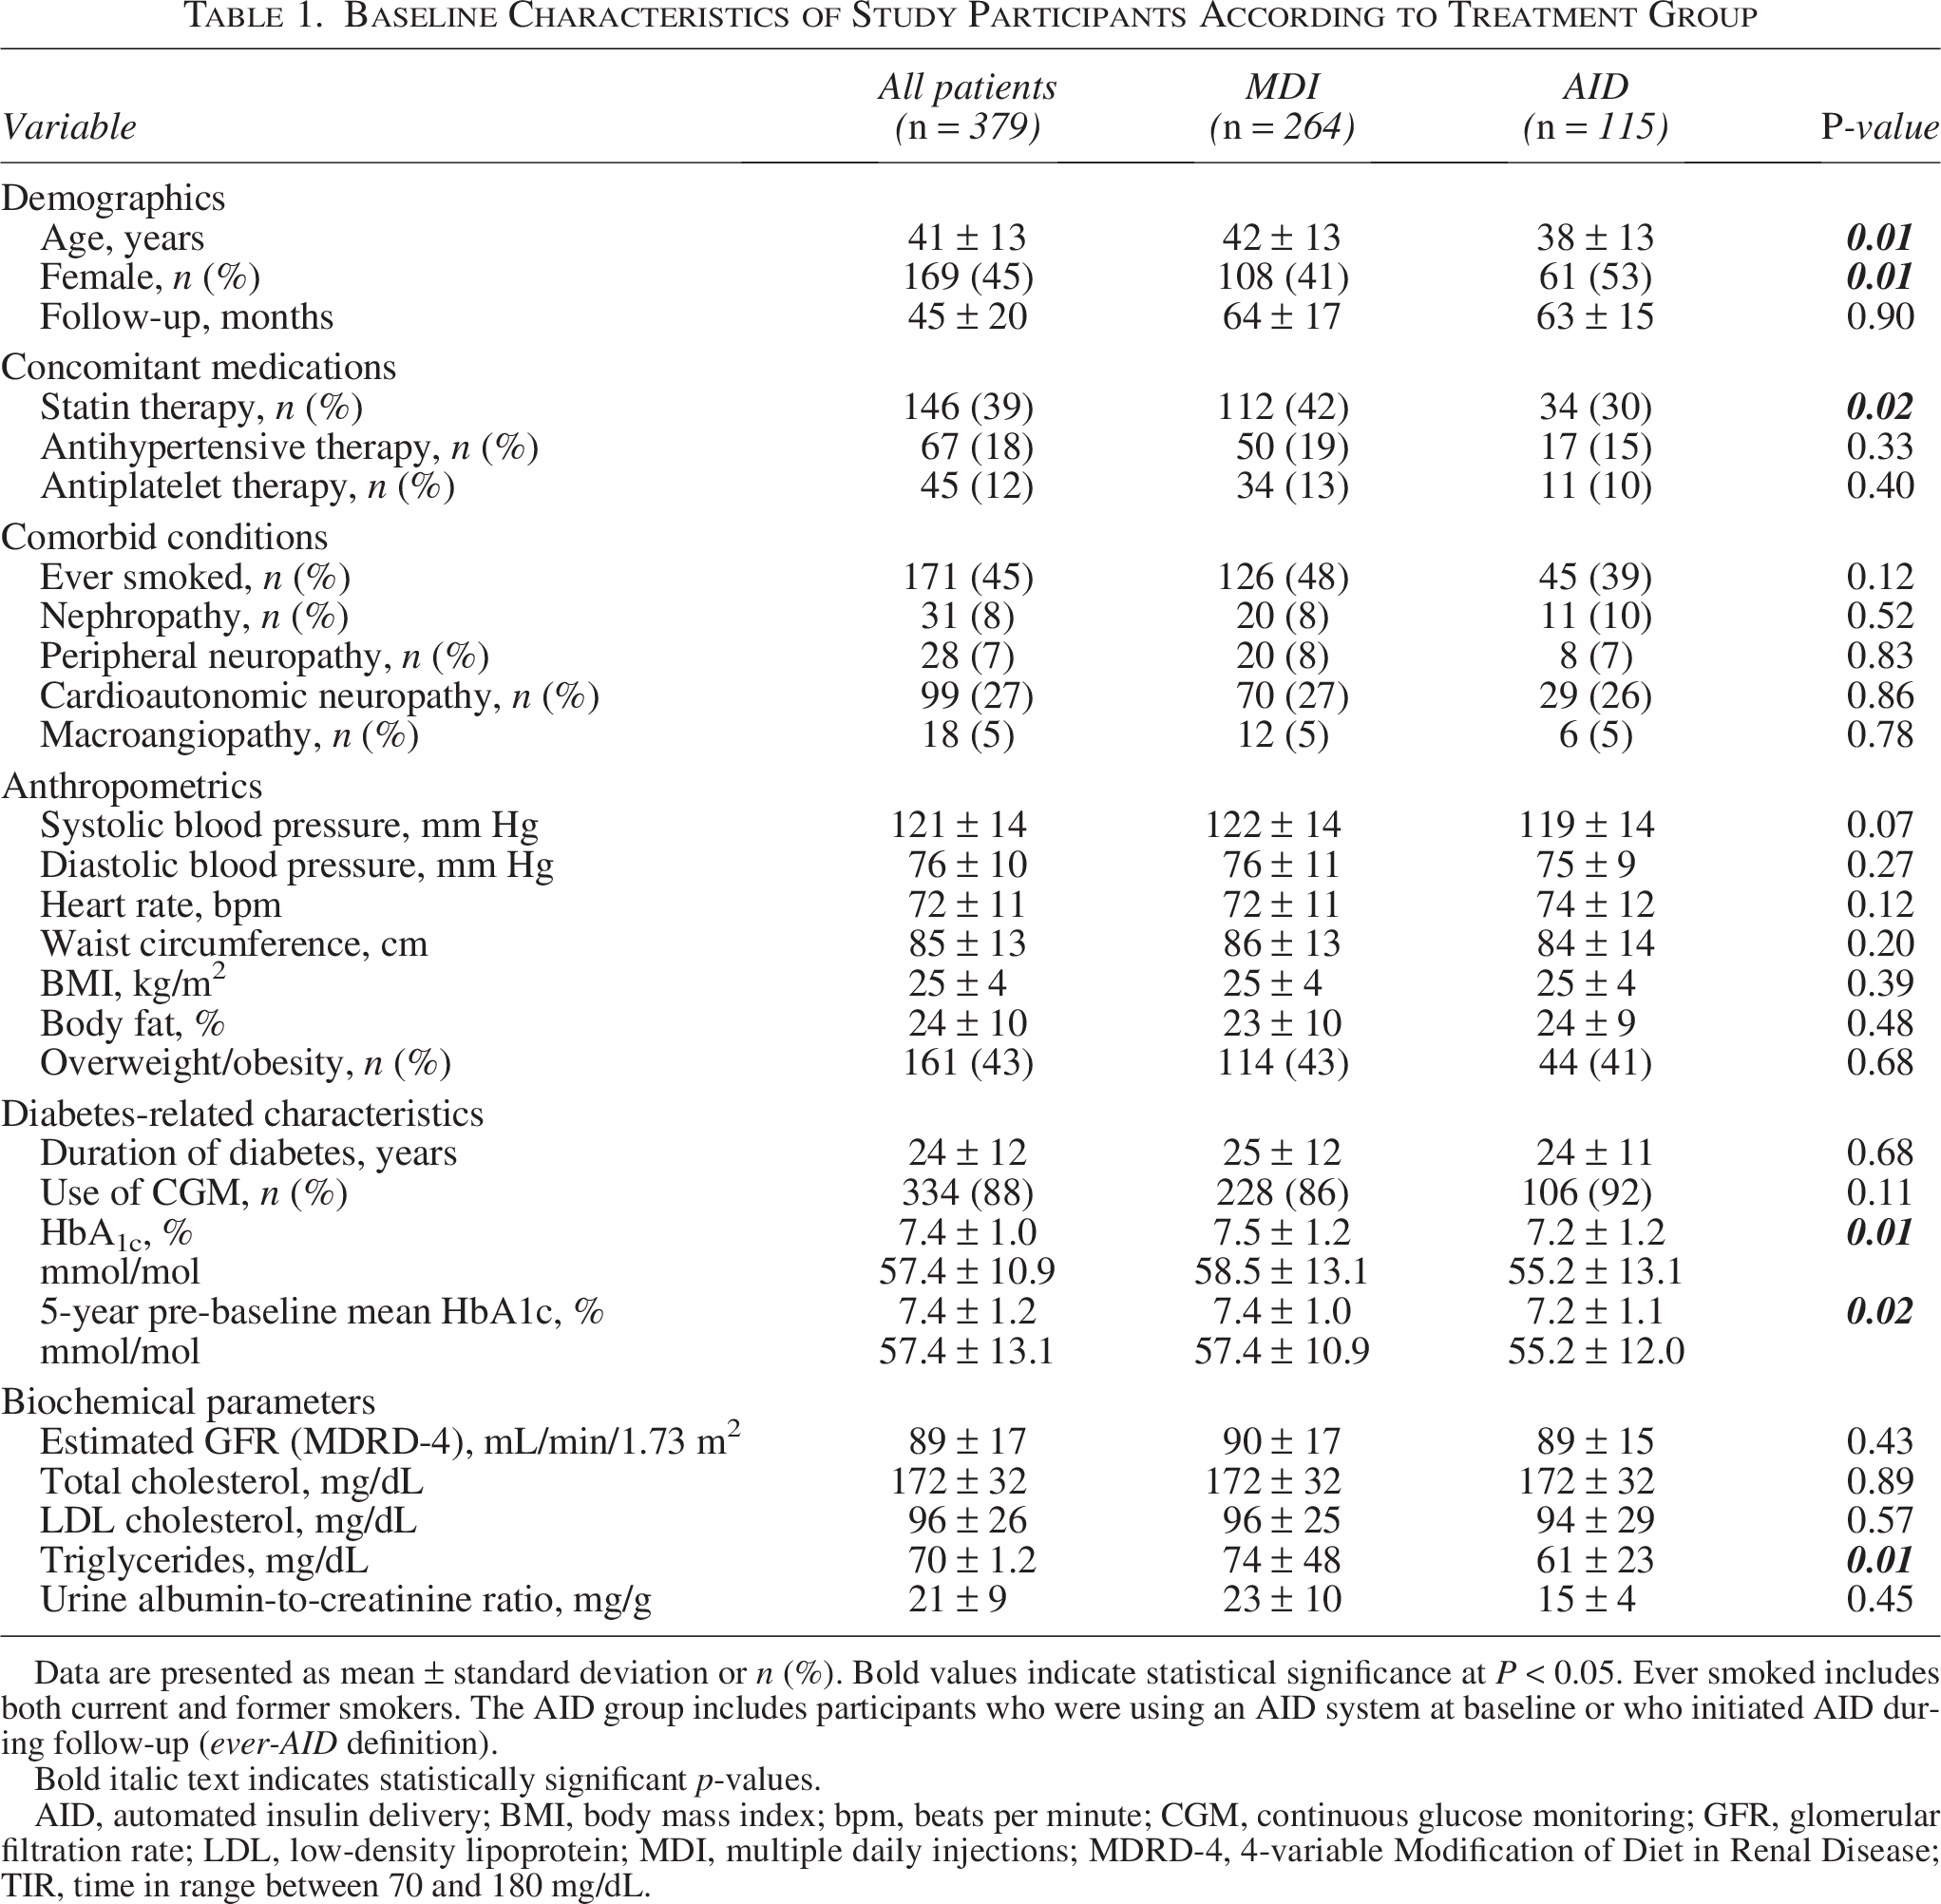
Data are presented as mean ± standard deviation or n (%). Bold values indicate statistical significance at P < 0.05. Ever smoked includes both current and former smokers. The AID group includes participants who were using an AID system at baseline or who initiated AID during follow-up (ever-AID definition).
Bold italic text indicates statistically significant p-values.
AID, automated insulin delivery; BMI, body mass index; bpm, beats per minute; CGM, continuous glucose monitoring; GFR, glomerular filtration rate; LDL, low-density lipoprotein; MDI, multiple daily injections; MDRD-4, 4-variable Modification of Diet in Renal Disease; TIR, time in range between 70 and 180 mg/dL.
Baseline prevalence of DR
At study entry, 53 of 379 participants had evidence of DR, yielding a baseline prevalence of 13.9% (95% CI: 10.6–17.6). Among these, 45.3% were classified as mild NPDR, 20.8% had moderate NPDR, 24.5% had severe NPDR, and 7.5% had proliferative DR. Clinically significant DME was detected in 13.5%. Ocular interventions before enrollment included panretinal photocoagulation (40.4%), intravitreal therapy (13.2%), and vitrectomy (3.8%). There were no statistically significant differences in the prevalence (AID 15.0% vs. MDI 13.6%) and severity distribution of DR between treatment groups (Supplementary Table S1). In adjusted Poisson regression models accounting for diabetes duration, sex, and baseline HbA1c, the prevalence ratio for DR in AID versus MDI users was 1.13 (95% CI: 0.61–2.11), indicating no significant between-group differences at baseline.
In multivariable logistic regression, only diabetes duration (odds ratio [OR] = 1.15, 95% CI: 1.10–1.19; P < 0.001) and 5-year pre-baseline mean HbA1c (OR = 2.29, 95% CI: 1.54–3.41; P < 0.001) remained independently associated with prevalent DR following backward selection. The final model showed good explanatory power (Nagelkerke’s R2 = 0.38; global P < 0.001), highlighting the importance of both glycemic history and disease duration in determining baseline DR risk (Supplementary Table S2).
Primary outcome: Incident DR and associated risk factors
During follow-up, 49 participants developed DR, yielding a cumulative incidence of 12.9%. Six out of 98 participants in the AID group (6.1%, 95% CI: 2.8–12.7) and 43 out of 228 in the MDI group (18.9%, 95% CI: 14.3–24.4) developed DR, corresponding to an absolute risk reduction with AID use of 12.7% (95% CI: 4.7–19.2). In other words, using MDI as reference, AID treatment was accompanied by a relative risk of 0.33 (95% CI: 0.14–0.74) and a relative risk reduction of 67.5% (95% CI: 26.2–85.7) of developing DR. The number needed to treat (NNT) to prevent one case of DR was 8 (95% CI: 5–21). Kaplan–Meier curves showed a clear and sustained separation in incidence rates between groups over time (Fig. 1).
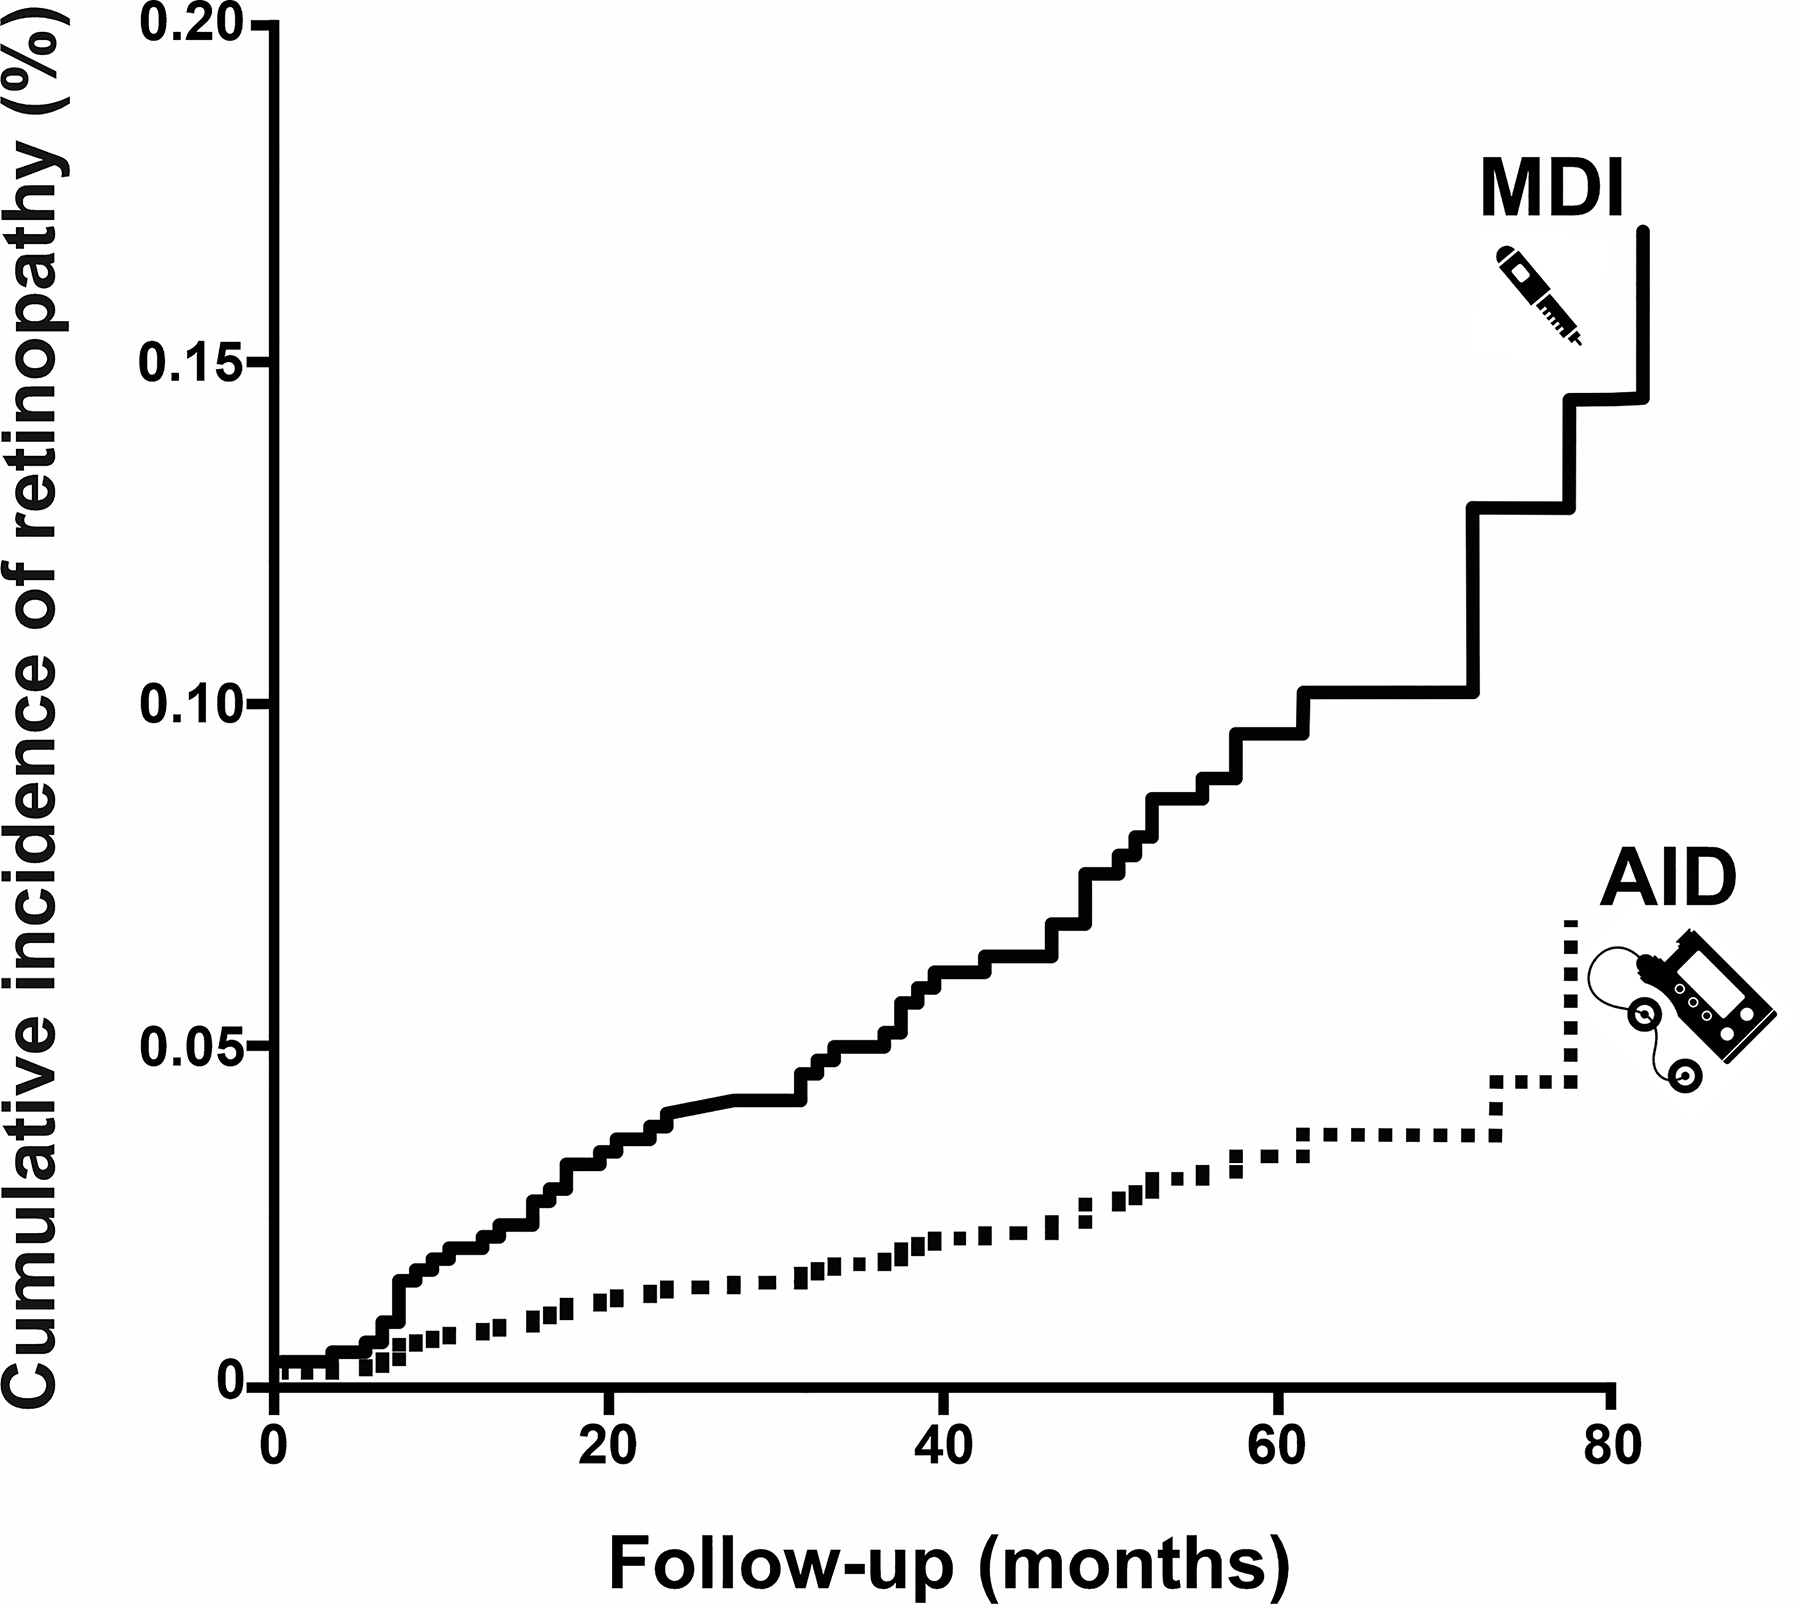
Cumulative incidence of diabetic ocular complications in type 1 diabetes (T1D). Kaplan–Meier curves showing the cumulative incidence of diabetic retinopathy (DR) over a mean follow-up of 4.9 years in adults with T1D, stratified by insulin delivery modality: automated insulin delivery (AID) versus multiple daily injections (MDI). DR occurred in 6.1% of AID users and 18.9% of MDI users.
No cases of proliferative DR were reported. DR severity was comparable between groups (Supplementary Table S1). In the AID group, no participants required panretinal photocoagulation or vitrectomy; one patient received intravitreal therapy. Among individuals who developed DR, the mean time to event tended to be longer in the AID group (45 ± 23 months) than in the MDI group (28 ± 19 months), although this difference did not reach statistical significance (P = 0.09).
In multivariable Cox regression models adjusted for age, diabetes duration, 5-year pre-baseline mean HbA1c, sex, and triglyceride levels, both treatment modality and longitudinal HbA1c change were independently associated with incident DR (Table 2). After adjustment, AID use was associated with a 67.2% reduction in DR risk compared with MDI (HR = 0.328, 95% CI: 0.126–0.726; P = 0.01). Moreover, each additional month of AID use was associated with a 1.8% reduction in the hazard of incident DR (HR = 0.982, 95% CI: 0.966–0.998; P = 0.03). One additional year of diabetes duration increased the hazard of DR by 7.3% (HR = 1.073, 95% CI: 1.040–1.108; P < 0.001), and each 1% increase in pre-baseline HbA1c more than doubled the risk (HR = 2.254, 95% CI: 1.584–3.206; P < 0.001). Longitudinal increases in HbA1c during follow-up were also associated with greater DR risk (HR = 1.043 per 1% increase, 95% CI: 1.008–1.080; P = 0.02). Importantly, older age was also independently associated with increased DR risk (HR = 1.044 per year, 95% CI: 1.014–1.074; P = 0.01) (Table 2). Neither triglyceride levels nor sex was significantly associated with DR incidence. Proportional hazard assumptions were met in all models.
Adjusted Cox Regression Analyses for Predictors of Incident Diabetic Retinopathy, Including Propensity Score-Matched Cohort
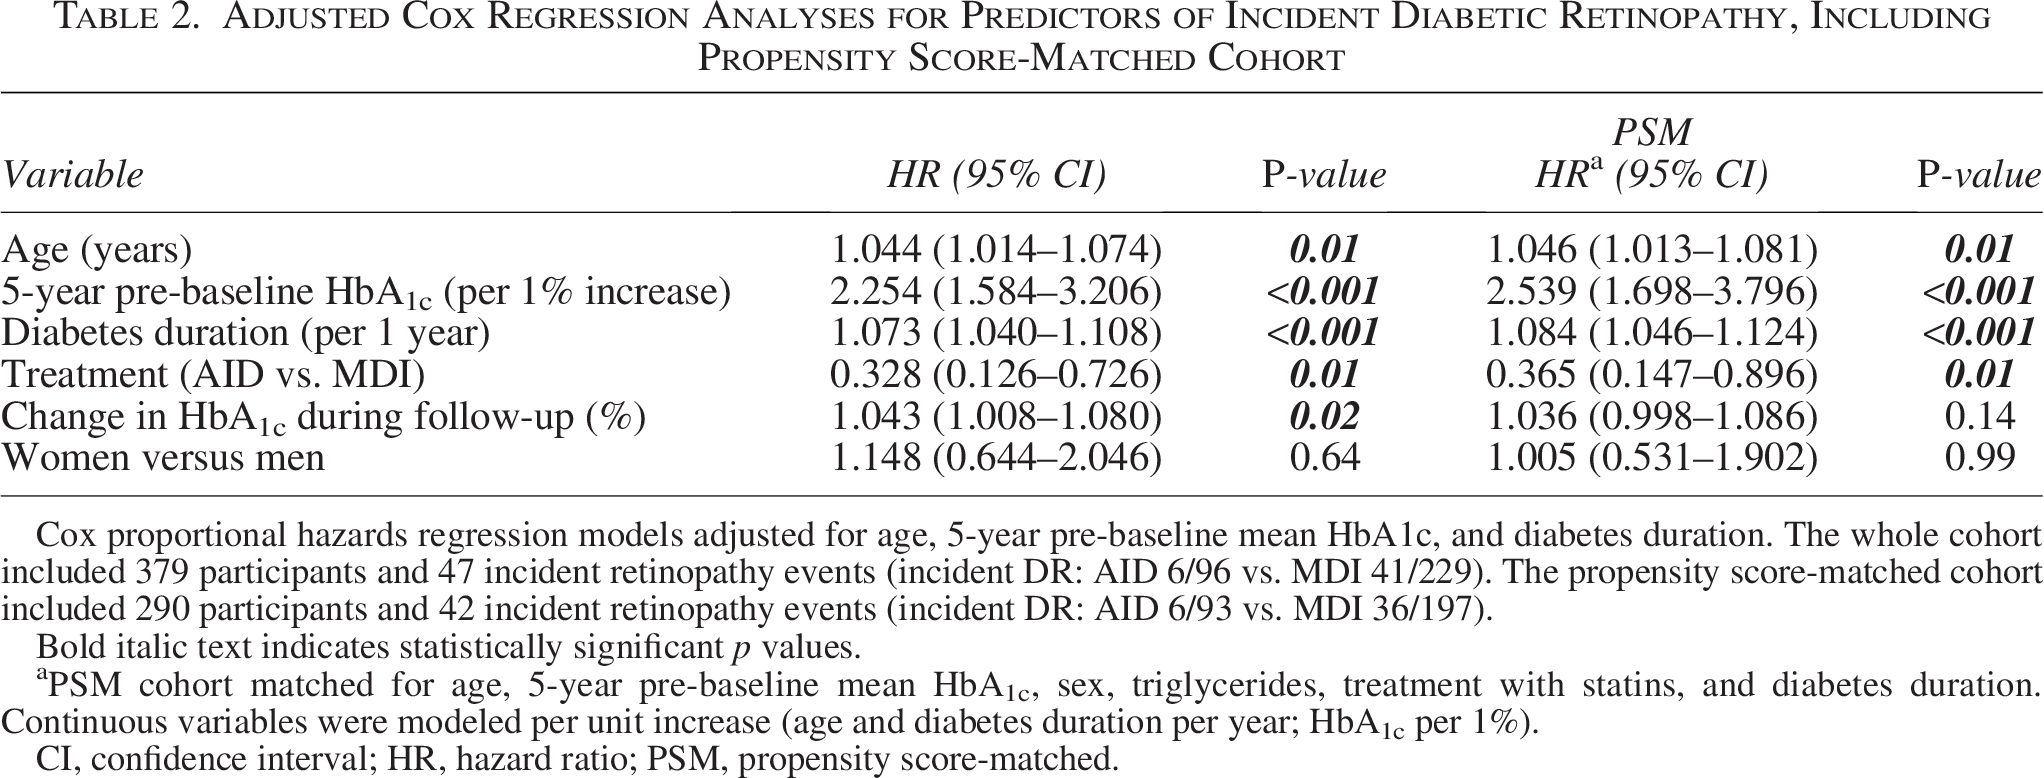
Cox proportional hazards regression models adjusted for age, 5-year pre-baseline mean HbA1c, and diabetes duration. The whole cohort included 379 participants and 47 incident retinopathy events (incident DR: AID 6/96 vs. MDI 41/229). The propensity score-matched cohort included 290 participants and 42 incident retinopathy events (incident DR: AID 6/93 vs. MDI 36/197).
Bold italic text indicates statistically significant p values.
PSM cohort matched for age, 5-year pre-baseline mean HbA1c, sex, triglycerides, treatment with statins, and diabetes duration. Continuous variables were modeled per unit increase (age and diabetes duration per year; HbA1c per 1%).
CI, confidence interval; HR, hazard ratio; PSM, propensity score-matched.
A sensitivity analysis using 2:1 nearest-neighbor PSM was performed to account for baseline imbalances. Three hundred and thirty participants were matched on baseline age, diabetes duration, sex, 5-year pre-baseline mean HbA1c, triglycerides, and statin use. After matching, baseline characteristics were well balanced between groups (Supplementary Table S3). In this matched cohort, baseline DR prevalence was 12.1% (95% CI: 9.0–16.1), with no statistically significant differences between groups (AID 15.5% vs. MDI 10.5%). Importantly, the PSM analysis confirmed the primary findings: AID use remained significantly associated with a lower risk of incident DR (HR = 0.33, 95% CI: 0.13–0.79; P = 0.01) after adjustment for diabetes duration and 5-year pre-baseline mean HbA1c (Table 2).
DR progression and ophthalmologic interventions
During follow-up, participants with DR at baseline underwent significantly more ophthalmologic assessments than those without baseline DR (mean = 7.5 ± 4.0 vs. 2.9 ± 0.8; P < 0.001), reflecting a higher monitoring intensity in individuals at greater clinical risk, in line with routine real-world practice. Among 53 participants with DR at baseline, 15 (28.3%) experienced progression during follow-up (Supplementary Table S1). All progression events occurred in the MDI group (41.7%, 95% CI: 27.1–57.8), whereas no such events were observed in AID users (0%, 95% CI: 0–18.4; P < 0.001). In the MDI group, eight participants (22.2%) progressed to moderate NPDR, one (2.8%) to severe NPDR, and six (16.7%) to proliferative DR. Macular edema was detected in 10 participants (27.8%) in the MDI group and in none of the AID users. Similarly, all ophthalmologic interventions—including panretinal photocoagulation (three cases, 8.3%), intravitreal therapy (nine cases, 25.0%), and vitrectomy (three cases, 8.3%)—were required exclusively in MDI users. The distribution of DR progression and interventions is summarized in Supplementary Table S1. Only 5-year pre-baseline mean HbA1c was independently associated with DR progression (HR = 2.24, 95% CI: 1.33–3.76; P = 0.01).
Glycemic outcomes
AID users experienced a greater reduction in HbA1c during follow-up compared with MDI users (−0.32% vs. −0.06%; between-group difference = −0.26%, 95% CI: −0.44 to −0.08; P = 0.01). Among those with adequate CGM data (≥70% sensor wear, n = 281), AID users also showed significantly better glycemic profiles, including higher TIR, lower GMI, and reduced glucose variability (Table 3). Notably, participants who developed DR had higher follow-up HbA1c, regardless of treatment modality.
Continuous Glucose Monitoring Metrics, Biochemical Parameters, and Insulin Dose by Diabetic Retinopathy Incidence and Treatment Group (Multiple Daily Injections vs. Automated Insulin Delivery) at Baseline and Follow-Up
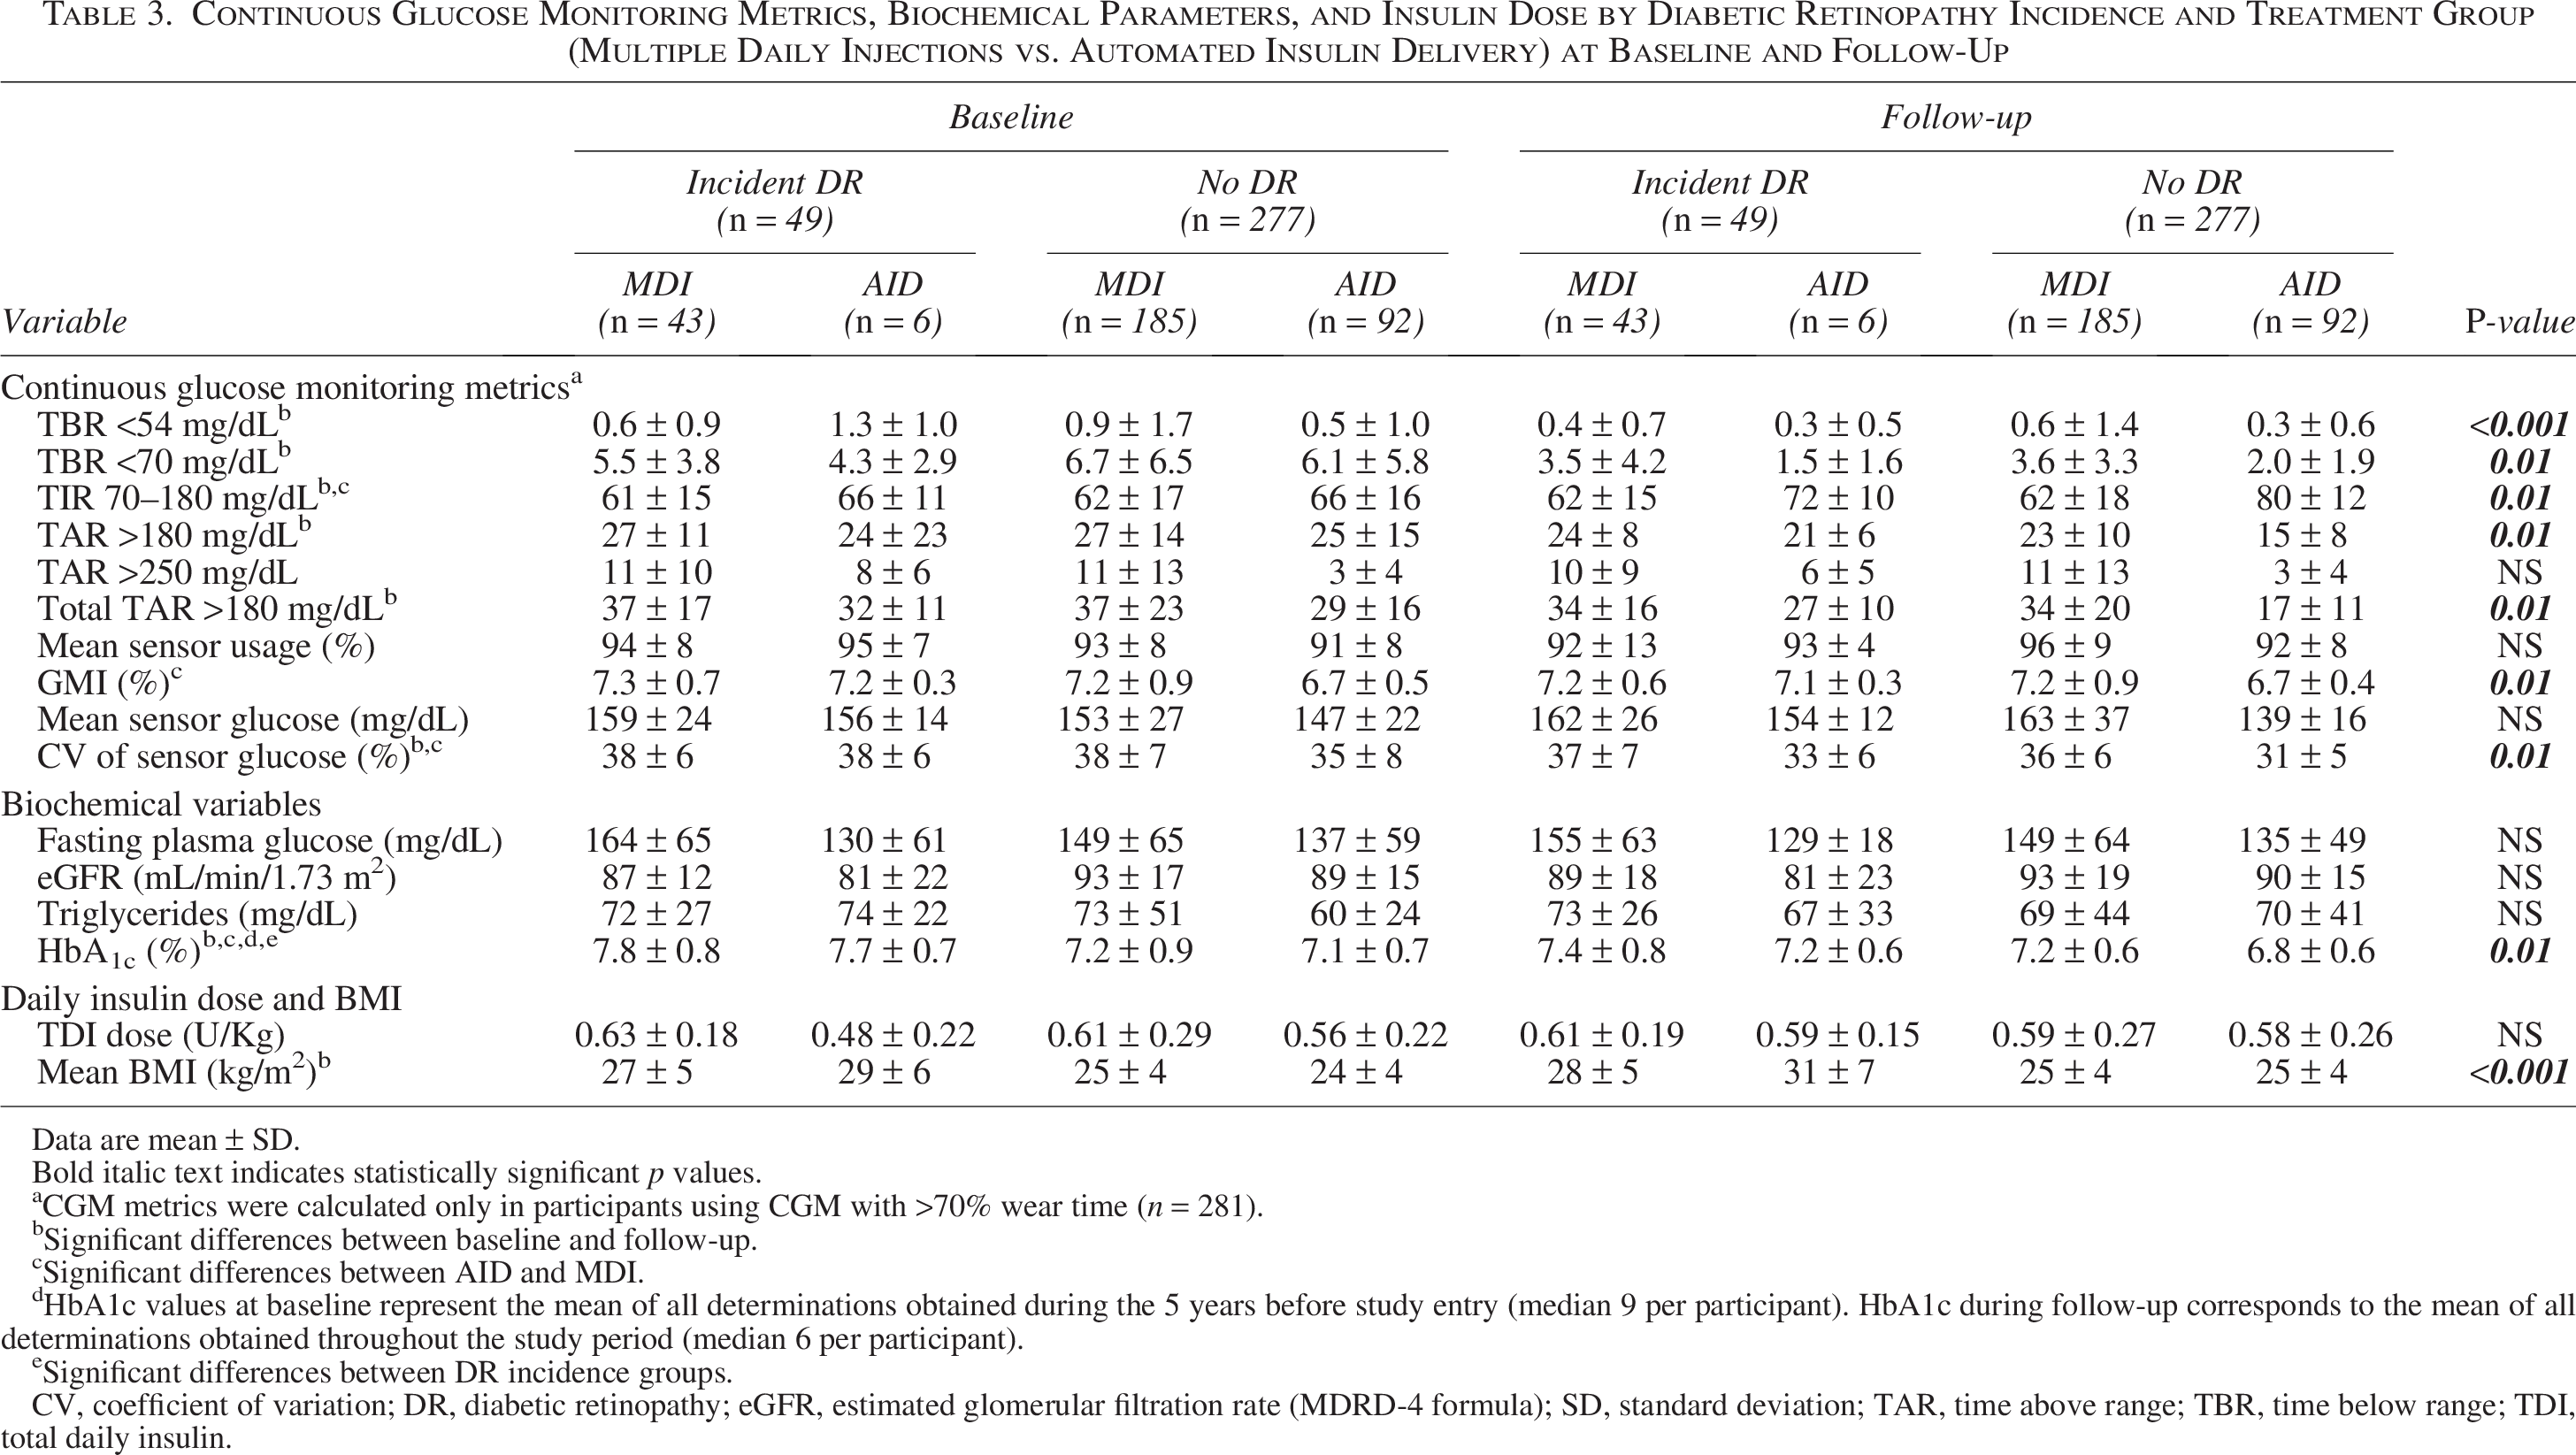
Data are mean ± SD.
Bold italic text indicates statistically significant p values.
aCGM metrics were calculated only in participants using CGM with >70% wear time (n = 281).
Significant differences between baseline and follow-up.
Significant differences between AID and MDI.
dHbA1c values at baseline represent the mean of all determinations obtained during the 5 years before study entry (median 9 per participant). HbA1c during follow-up corresponds to the mean of all determinations obtained throughout the study period (median 6 per participant).
Significant differences between DR incidence groups.
CV, coefficient of variation; DR, diabetic retinopathy; eGFR, estimated glomerular filtration rate (MDRD-4 formula); SD, standard deviation; TAR, time above range; TBR, time below range; TDI, total daily insulin.
Discussion
In this prospective cohort study of adults with T1D, conducted in a real-world clinical setting, the use of AID systems was associated with a lower incidence and progression of DR compared with MDI treatment. Over a mean follow-up of 4.9 years, incident DR occurred in 6.1% of AID users versus 18.9% of MDI users, yielding a relative risk reduction of 67.5%, an absolute risk reduction of 12.7%, and an NNT of 8, in parallel to an improvement in glycemic control parameters. Moreover, all DR progression events and vision-threatening complications occurred exclusively in the MDI group. These findings suggest that the improvement in glycemic control achieved with the use of AID systems results in a meaningful protection against early microvascular complications of T1D, especially in routine care settings, where maintenance of adequate glycemic control remains a major challenge.
Our results extend those of the landmark DCCT/EDIC studies,4,14,15 which demonstrated that intensive insulin therapy significantly reduced the risk of DR development and progression compared with conventional insulin therapy, with long-lasting effects extending over decades. In DCCT, DR progression was reduced by 54% in participants with mild DR and by 76% in those without DR at baseline over 6.5 years of follow-up. 4 The sustained benefits observed in EDIC, despite convergence of HbA1c levels later on, further demonstrated the importance of early glycemic optimization. 14 Three decades later, our present data suggest that modern AID systems may enhance protection against microvascular complications of T1D over intensive insulin therapy.
An improvement in glycemic control appears to be the main mediator of this effect.16–18 In our cohort, AID users achieved a significantly greater HbA1c reduction compared with MDI users as well as better CGM-derived metrics during follow-up, including higher TIR, lower GMI, and lower glucose variability. It is important to note that, in adjusted models that took into account age, diabetes duration, and glycemic control history over 5 years, treatment modality (AID vs. MDI) and the change in HbA1c during follow-up were associated with the incidence of DR, reinforcing the interpretation that improved glycemic control was the basis for this protective effect on DR.
DR progression outcomes further support the protective effect of AID. Among the 53 participants with DR at baseline, 15 (28.3%) experienced progression, all of whom were on MDI. All vision-threatening complications—including proliferative DR, macular edema, panretinal photocoagulation, intravitreal therapy, and vitrectomy—were observed exclusively in MDI users. Notably, the absence of progression among AID users emerged as the most robust and clinically meaningful finding of the study. This result, consistently observed across primary and sensitivity analyses, suggests a substantial protective effect of AID in halting DR progression. Crucially, our time-updated exposure models incorporated the exact initiation dates and cumulative duration of AID use, minimizing immortal-time bias and reducing the risk of exposure misclassification. Consequently, we believe that the primary focus of interpretation should emphasize the role of AID in preventing DR worsening, while recognizing that incidence estimates—although favorable—are more susceptible to residual confounding and misclassification.
Our findings align with recent retrospective data evaluating short-term retinopathy outcomes after AID initiation. In a multicenter study of 209 adults with T1D, Wong et al. 19 reported that 94.2% of participants experienced stable or improved DR after a median of 12 months on AID, with only 1.4% showing progression. While this limited worsening was hypothesized to result from rapid HbA1c reductions, it is also plausible that the higher baseline HbA1c and longer diabetes duration in that cohort contributed independently to the risk. 20 In our study, among the participants with preexisting retinopathy who initiated AID during follow-up (n = 8), none experienced retinopathy worsening, despite likely improvements in glycemic control. This contrasts with the early worsening phenomenon described in the DCCT, where intensive glycemic treatment in individuals with long-standing diabetes and baseline DR was associated with short-term progression.5,17 These results reinforce the safety of AID systems in individuals with or without prior DR and support their potential role in long-term protection against both incident and progressive retinopathy.
We might highlight several strengths of our present study, including a well-characterized cohort showing very high retention (97.6%) over time, and standardized DR screening procedures, enhancing internal validity. The use of real-world data adds clinical relevance, and the inclusion of PSM analysis helped to address baseline imbalances. Moreover, we evaluated a broad range of outcomes, from DR incidence to progression and vision-threatening events, allowing for a comprehensive assessment of clinical impact. Several limitations should be acknowledged. First, due to the observational design of the study, residual confounding and selection bias cannot be ruled out. Participants in the MDI group were older and had higher historical HbA1c levels, potentially influencing DR outcomes. To address this, we performed a PSM analysis adjusting for baseline age, diabetes duration, 5-year pre-baseline HbA1c, triglycerides, and statin use. This confirmed the protective association between AID use and DR incidence. Nonetheless, despite matching and multivariable adjustments, the possibility of unmeasured confounding remains. Second, treatment allocation was not randomized. Although adjusted and matched analyses were applied, unmeasured factors may still influence the findings. Third, the “ever-AID” exposure definition does not account for variations in adherence or treatment continuity over time. Fourth, while AID use was modeled as a time-varying covariate and a predominant-treatment sensitivity analysis was conducted to minimize immortal-time and misclassification bias, residual misclassification may persist due to heterogeneity in device approval, adoption timing, and use intensity. Fifth, the relatively small number of DR progression events (n = 15) limited statistical power for multivariable and subgroup analyses. In addition, although initiation and censoring dates were recorded, the timing of post-AID retinal assessments was not systematically collected, limiting precision in the exposure–outcome temporal relationship. This reflects the real-world nature of the study. Sixth, while the first-generation MiniMed 670G system was available early in recruitment, its use was minimal and short term. All participants were transitioned to the MiniMed 780G, ensuring consistent exposure to second-generation AID technology. Last, although a 4.9-year follow-up is sufficient to detect early DR changes, longer observation is needed to assess effects on proliferative DR and other long-term complications. Microvascular comorbidities such as nephropathy (8%), peripheral neuropathy (7%), and cardioautonomic dysfunction (27%) were present at baseline but not included as covariates. Their similar distribution across treatment groups reduces the likelihood of confounding, but future research should consider composite microvascular endpoints to better evaluate the broader impact of AID systems on vascular complications in T1D.
Conclusion
In a real-world setting, adults with T1D using AID systems showed lower incidence and progression of DR compared with those on MDI, alongside better glycemic control. These findings support broader AID use to reduce early microvascular complications. Future studies should assess long-term durability, cost-effectiveness, and applicability across diverse populations and health care systems.
Authors’ Contributions
All authors have made substantial contributions to all of the following: (1) the conception and design of the study, the acquisition of data, or the analysis and interpretation of data; (2) the drafting of the article or its critical revision; and (3) the final approval of the version to be submitted. The article, including the related data and tables, has not been previously published and is not being considered elsewhere.
Footnotes
Author Disclosure Statement
The authors have no relevant affiliations or financial involvement with any organization or entity with a financial interest in or financial conflict with the subject matter or materials discussed in the article.
Funding Information
This work has been supported by grants from the Fondo de Investigación Sanitaria (PI22/00616) of the Instituto de Salud Carlos III, cofunded by the European Union. The funding organization played no role in the study design, the collection, analysis, and interpretation of data; the writing of the repor; nor in the decision to submit the report for publication.
Availability of Data and Materials
The datasets generated during the current study are available from the corresponding author upon reasonable request.
Guarantor Statement
L.N.-C. is the guarantor of this work and, as such, had full access to all the data in the study and takes responsibility for the integrity of the data and the accuracy of the data analysis.
Artificial Intelligence-Assisted Technology Declaration
The authors used ChatGPT (OpenAI, GPT-4, September 2023 version) to support the English-language editing and organization of this article. All artificial intelligence-generated content was reviewed and edited by the authors, who take full responsibility for the final version.
Supplemental Material
References
Supplementary Material
Please find the following supplemental material available below.
For Open Access articles published under a Creative Commons License, all supplemental material carries the same license as the article it is associated with.
For non-Open Access articles published, all supplemental material carries a non-exclusive license, and permission requests for re-use of supplemental material or any part of supplemental material shall be sent directly to the copyright owner as specified in the copyright notice associated with the article.