
Abstract
Introduction:
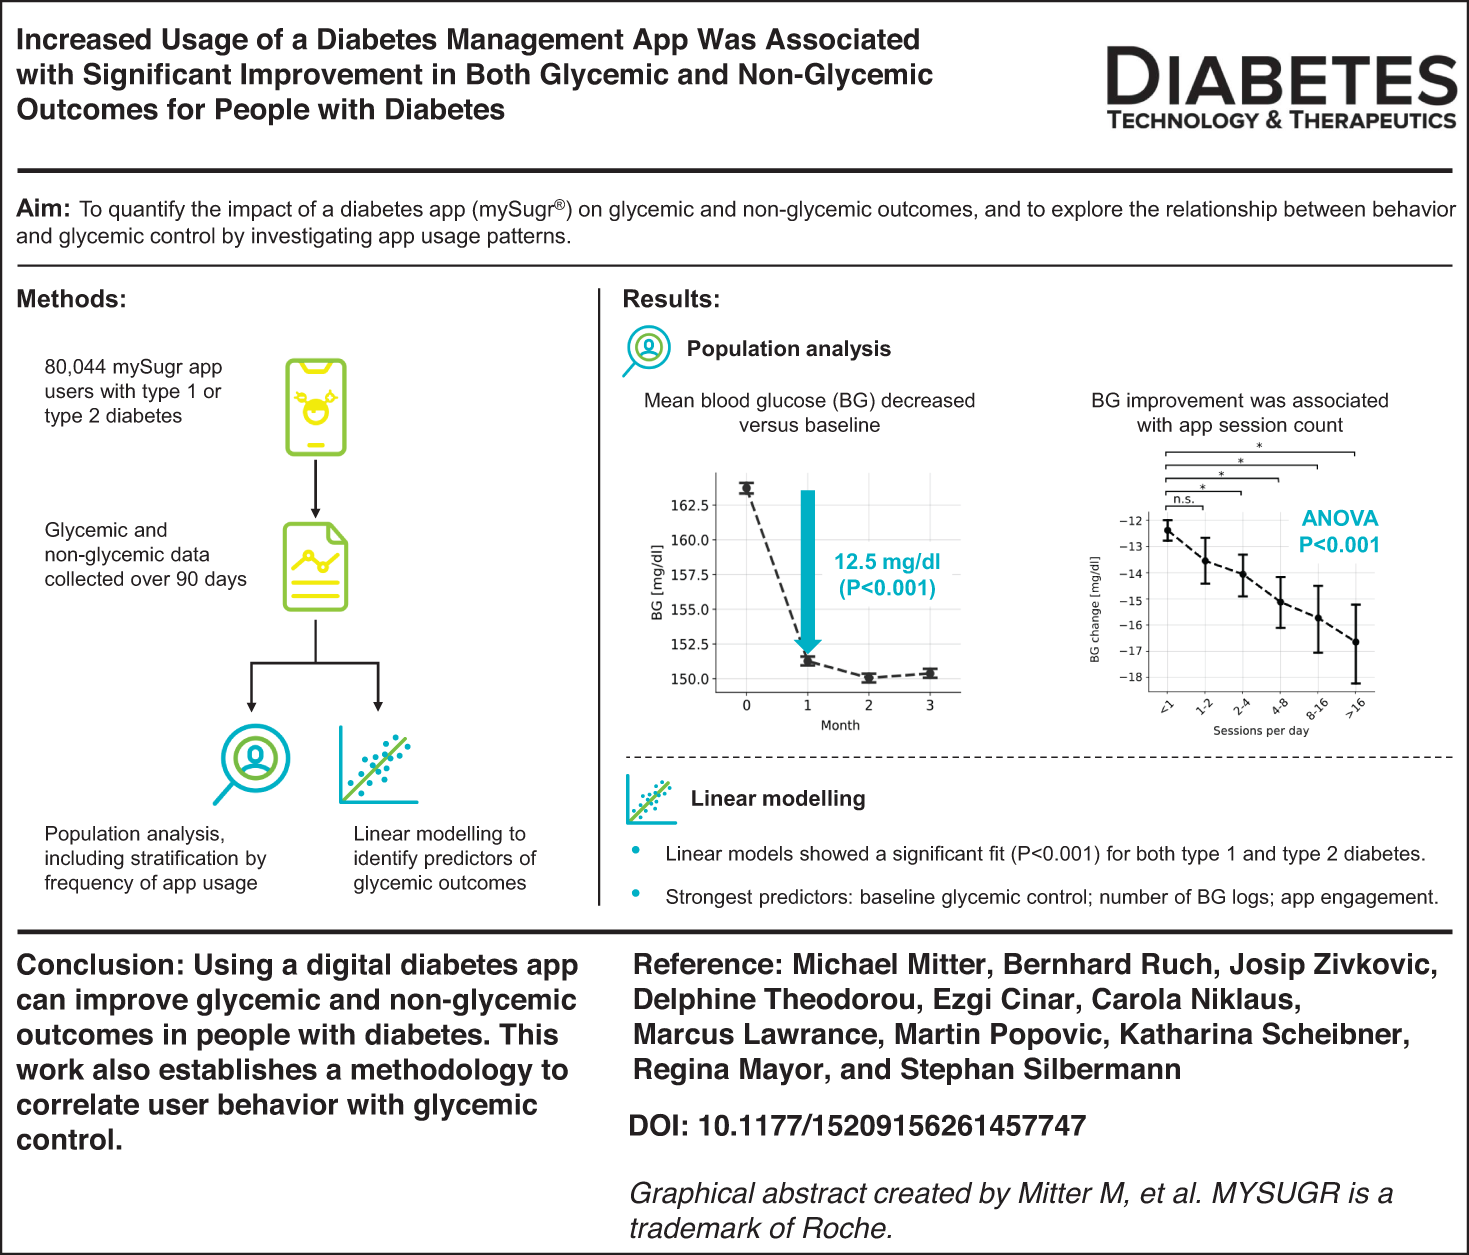
Mobile health applications (apps) have been associated with improved glycemic outcomes in people with diabetes, but the behavioral factors leading to these outcomes remain poorly understood. The aim of this study was to quantify the impact of a diabetes app (mySugr®) on glycemic and non-glycemic outcomes and to explore the relationship between behavior and glycemic control by investigating app usage patterns.
Methods:
Glycemic (blood glucose [BG]) and non-glycemic (body mass index [BMI] and “tags” indicating hypoglycemia and hyperglycemia feelings) outcomes of mySugr users with type 1 (T1DM) or type 2 (T2DM) diabetes mellitus were collected in the app over 90 days and assessed through population analysis, including stratification by frequency of app usage. Linear modeling was employed to identify characteristics of app users that may predict glycemic outcomes.
Results:
Data from 80,044 mySugr users were analyzed. Improved glycemic control was observed (change in mean BG = −12.5 mg/dL; P < 0.001), correlating with app usage and was greatest in users with >16 app sessions/day. In users with T2DM, a 2.4% reduction from baseline was observed in mean BMI (−0.76 kg/m2; P < 0.001; n = 6910). Users with T1DM or T2DM reported reductions of 16% and 27% in hypoglycemia and hyperglycemia feelings, respectively (143,600 tags). Linear models showed a significant fit (P < 0.001) for both T1DM (n = 17,465) and T2DM (n = 39,069) users and explained a large degree of the variability in glycemic outcomes (R2 = 0.355 for T1DM and R2 = 0.444 for T2DM). Baseline glycemic control was the strongest predictor of glycemic outcomes, followed by number of BG logs and app engagement.
Conclusions:
Using a digital diabetes app can improve glycemic and non-glycemic outcomes in people with diabetes. This work also establishes a methodology to correlate user behavior with glycemic control.
Keywords
Introduction
Good glycemic control in diabetes, defined as glycated hemoglobin (HbA1c) of <7% (<53 mmol/mol) without significant hypoglycemia, 1 is associated with reduced incidence of long-term microvascular and macrovascular complications (e.g., retinopathy and cardiovascular diseases).2–4 Accordingly, short-term studies may focus on interventions that improve measures of glycemic control, under the assumption that such improvements will translate into long-term clinical benefits. 3
Despite therapeutic advances, many people with diabetes fail to achieve their recommended glycemic targets.5,6 This is due to a myriad of factors: studies have emphasized the impact of user demographics and socioeconomic factors on glycemic control,7–10 and diabetes management involves complex daily decisions on everyday behavior, including dietary intake, insulin dosage, and exercise.11–15 Previous studies using qualitative methods16,17 or clinical data from medical records 18 have shown an association between glycemic control and everyday behavior; however, this relationship has not been quantitatively analyzed.
In recent years, digital health applications (apps) have provided users with a means of tracking their daily diabetes-related decision-making, enabling more effective diabetes management.19–24 This technology may improve glycemic control with potentially fewer side effects and lower long-term health care costs compared with sole reliance on pharmaceutical interventions.25–27 However, research linking intensity of app engagement to both glycemic and non-glycemic outcomes across diabetes types is still limited.
The mySugr® app is a CE-marked medical device with over six million registered downloads worldwide. It is used for diabetes self-management and comprises functionalities such as a digital logbook and bolus calculator. This allows users to log diverse data about their daily life, both manually and through integration with connected devices (e.g., blood glucose [BG] meters) and health monitoring platforms (e.g., Apple Health, Google Fit). 28 In this study, we collected a large and diverse dataset through the mySugr app to investigate the effect of app usage on individuals with type 1 (T1DM) and type 2 diabetes mellitus (T2DM) by quantifying glycemic and non-glycemic outcomes over a 90-day period. We also developed a linear model, based on this multimodal dataset, to predict glycemic outcomes for individual users and examine the relationship between behavioral patterns and user outcomes.
Methods
Data source and collection
Data from people with diabetes were collected through the mySugr app from January 1, 2010, to July 1, 2023. The demographic characteristics of app users are outlined in Table 1, and data about their everyday life with diabetes, collected either manually or imported through connected devices and services, are provided in Supplementary Table S1.
Demographic Attributes of Logging App Users
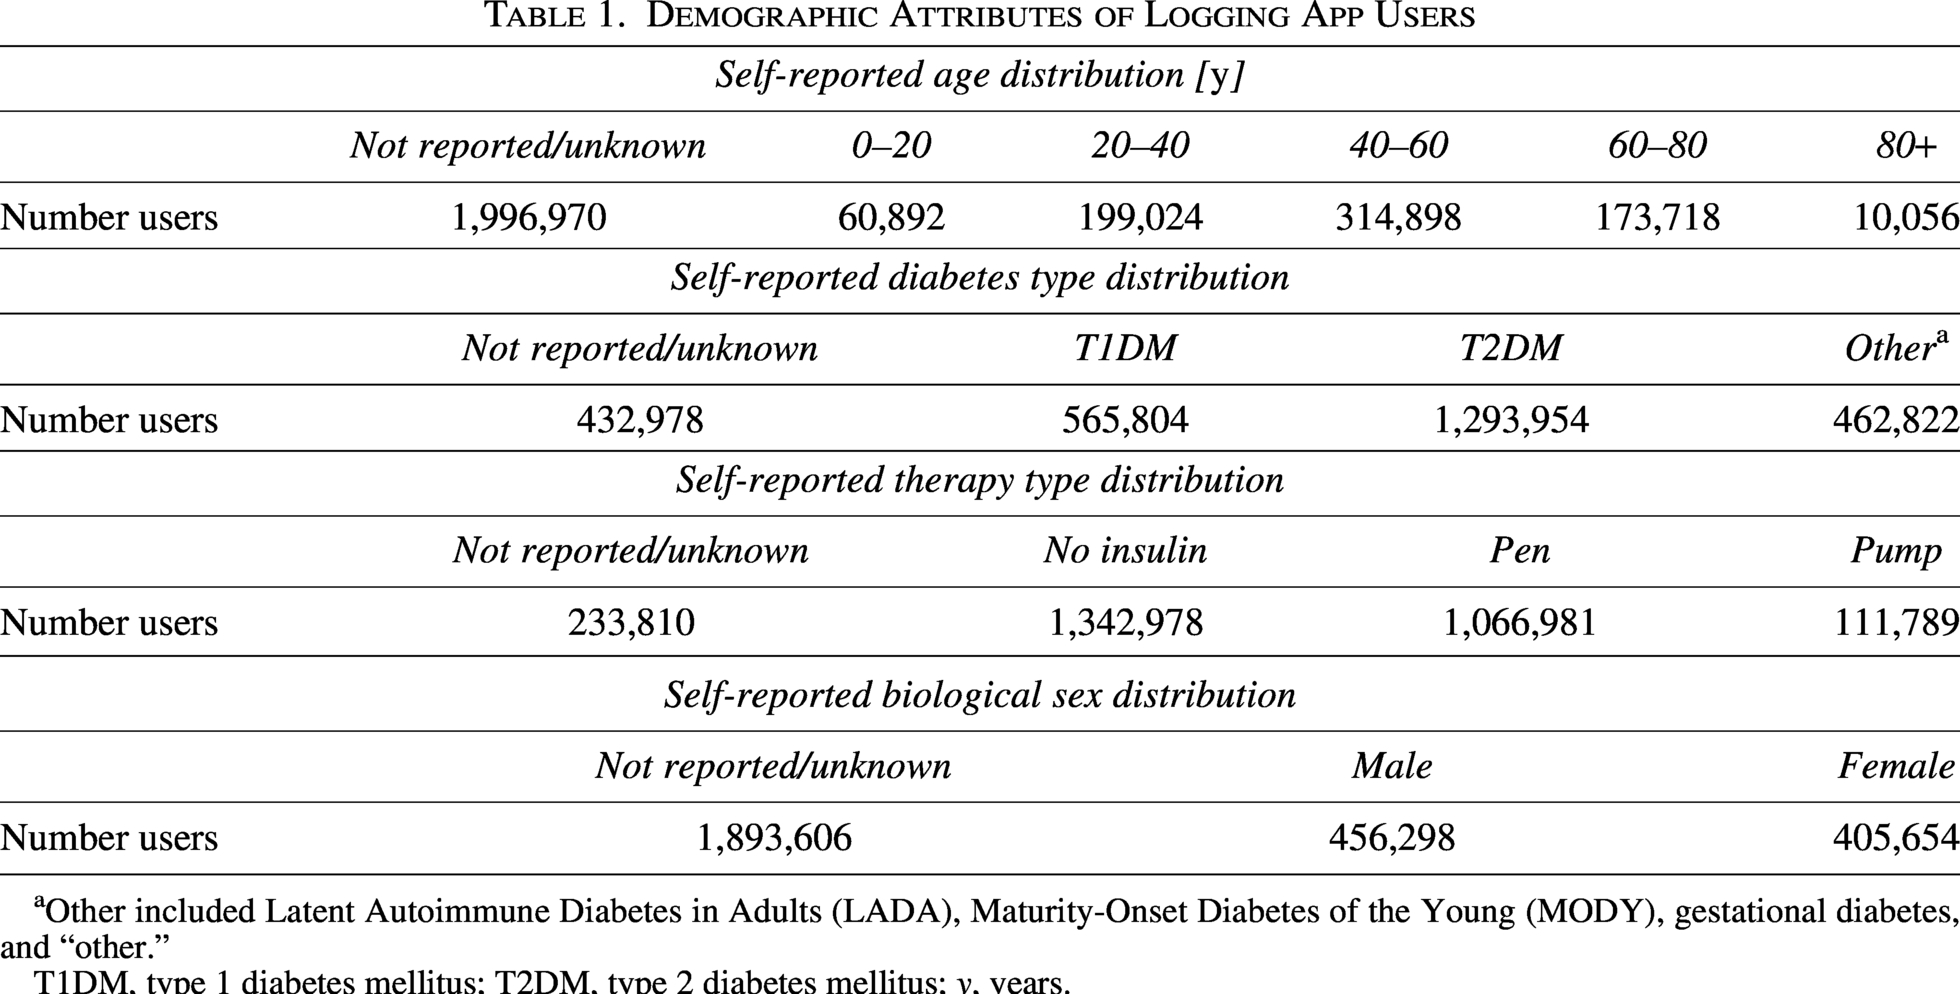
Other included Latent Autoimmune Diabetes in Adults (LADA), Maturity-Onset Diabetes of the Young (MODY), gestational diabetes, and “other.”
T1DM, type 1 diabetes mellitus; T2DM, type 2 diabetes mellitus; y, years.
Software
All analyses were performed using Python version 3.11.4. Plotting was performed on the Matplotlib package version 3.7.2 and Seaborn package version 0.12.2. Numerical computation and data manipulation were performed using NumPy version 1.26.4 and Pandas version 2.0.3. Statistical testing was performed using Statsmodels version 0.14.0 and Pingouin version 0.5.4. Pre-processing of the data used for modeling was performed using Scikit-learn version 1.3.0, and modeling was performed using Statsmodels version 0.14.0.
Population analysis of glycemic and non-glycemic outcomes
Glycemic and non-glycemic outcomes
The glycemic outcome assessed was BG. The non-glycemic outcomes assessed were body mass index (BMI) and tags for feelings of hypoglycemia and hyperglycemia, which are two of the possible context tags (icons to describe certain situations and emotions) that users can add to BG log entries in the mySugr app.
User cohorts
Population metrics for all users involved in this study were determined relative to the first time a user created a log entry (hereafter referred to as Day 1) and were grouped into four 30-day intervals, hereafter referred to as Month 0 (the 30 days before mySugr use), Month 1 (from Day 1 to Day 30 of mySugr use), Month 2 (from Day 31 to Day 60 of mySugr use), and Month 3 (from Day 61 to Day 90 of mySugr use).
For the analysis of changes in BG levels, users who had (1) ≥15 BG measurements in Month 0 (imported from connected devices) and (2) ≥15 BG measurements in Month 3 and ≥90 BG measurements over the 90-day observation period were included. Users whose diabetes type was known were stratified into T1DM and T2DM cohorts. For the analysis of changes in BMI, >1 BMI entry in each of the 3 months of the observation period was required. For analysis of context tags, ≥15 total tags of any kind in each of the 3 months of the observation period were required, and the number of tags was calculated as a fraction of all used tags to ensure that any potential change was not due to changes in overall logging activity.
Change in glycemic and non-glycemic outcomes
Mean BG levels were first calculated for each user and month, and the population mean for each month was calculated by averaging the values across the users. Changes in mean BG levels for each user were determined by subtracting the mean BG value in Month 3 from the mean BG value in Month 0, and a two-sided, one-sample Wilcoxon rank sum test was used to test statistical significance. 29 Changes in BMI and tags for feelings of hypoglycemia and hyperglycemia were calculated by subtracting the mean values in Month 3 from the mean values in Month 1, due to the manual entry of these values in the mySugr app precluding availability of data from Month 0.
Stratification by frequency of app usage and baseline glycemic control
To stratify users according to the frequency of their app usage, the total app sessions per user over the 3 months of the observation period were grouped into logarithmic bins, and the mean BG change over the 3 months was calculated for each bin. An app session is defined as the user opening the app. For the stratification into different glycemic control categories at baseline, the estimated HbA1c (eHbA1c) level in Month 0 was calculated for each user based on a standard conversion formula from mean BG. 30 App users were stratified into four groups: <7%, 7–<8%, 8–<9% and ≥9% eHbA1c.
Stratification by baseline hypo- and hyperglycemic risk
To understand the performance of the mySugr app across different target ranges, we conducted a descriptive analysis of users who exhibited extreme proportions of hypoglycemic or hyperglycemic tests at the start of app usage (Month 0).
Users at risk of hypoglycemia and hyperglycemia were defined based on American Diabetes Association guidelines 1 as follows: users with >4% of BG measurements below range in Month 0 (hypoglycemia) and users with >25% of BG measurements above range in Month 0 (hyperglycemia).
Statistical analysis
To assess if changes in glycemic and non-glycemic outcomes (BG levels, BMI, and feelings of hypoglycemia and hyperglycemia) were significantly different according to frequency of app usage and baseline glycemic control, an analysis of variance (ANOVA) test was run between all categories, followed by paired post-hoc tests using Bonferroni correction for multiple testing and a two-sided Mann–Whitney U test for individual testing. 29 Proportions of tests below, in or above range were compared between Month 0 (baseline) and Month 3 (after 90 days). Comparisons were performed using two-sided Wilcoxon signed-rank tests.
Use of linear modeling to identify predictors of improved glycemic control
These models relate the change in mean BG per month between Month 0 and Month 3 with a rich feature set of user characteristics. These were separated into baseline features (including age, sex, the length of time that the person has had diabetes, and Month 0 glycemic metrics such as BG and the fraction of tests below, in, and above range), app usage features (features that quantify the frequency and context of app usage, including context tags), and behavioral features (features that have been engineered based on information shared in the app, such as BG monitoring, insulin delivery, and carbohydrate intake). More details are included in the supplementary materials.
User cohort
The cohort used for these models included the cohort used for the population analysis, with the addition of users who rarely logged their BG measurements (i.e., users were not required to have ≥90 BG entries over the 3-month observation period but were required to have ≥15 BG measurements in Month 0 [imported from connected devices] and ≥15 BG measurements in Month 3). Since usage patterns and behavioral characteristics may differ significantly between users with T1DM and T2DM, a separate model was created for each diabetes type.
Model development and validation
A total of 133 features were considered for BG model development (Supplementary Table S2). To define a set of minimal features, all numerical features were first pre-processed through imputation and standardization of the median value, and categorical features were pre-processed into a binary format using one-hot encoding. The 20 most important features were then identified through sequential feature selection using a Lasso model and fivefold cross-validation. An ordinary least-squares model was fit using these 20 features, and only the significant ones (P < 0.05) were selected to search for interaction with glycemic outcomes. This was done by first computing all possible pairs of the 20 most important features and fitting all possible models that included significant single features and up to three interaction terms. The model with the lowest Akaike information criterion was selected for final analysis to explore interaction effects.31,32 The number of sessions was treated as a continuous independent variable and the change in HbA1c as a dependent variable.
Data were split per user into a train dataset and a test dataset, with a 75%–25% train–test split. All models were fit on the train set and then validated on the test set using R2 and adjusted R2 score. Statistical analysis of the model coefficients was performed as follows: R2 values were calculated and adjusted to account for the number of features (potential predictors) included in the model to better quantify how well the model represents the observed BG change and check for overfitting of the model. The overall fit was tested for statistical significance using an F-test. The coefficients for each feature, which quantify the strength and direction of the interaction of the feature with the BG change, were tested for statistical significance using a two-sided one-sample t-test. To quantify the effect size, the main regression analysis was repeated using standardized coefficients (β) for both the T1DM and T2DM models. 33 The effect sizes were grouped into four classes (small, β < 0.05; small but meaningful, β = 0.05–0.10; moderate, β = 0.10–0.25; and large, β > 0.25). 33
Results
Usage of a digital diabetes app is associated with improved glycemic control over a 90-day period
To investigate whether app usage was associated with a change in glycemic control, changes in BG levels versus baseline (Month 0, i.e., prior to app usage initiation) were monitored in 80,044 app users who consistently logged their BG levels over the 90-day observation period. In Month 1 of app usage, a significant decrease in the mean BG value was observed compared with Month 0 (change in mean BG = −12.5 mg/dL; P < 0.001; Fig. 1a and b; Supplementary Table S3). Improvements were maintained in Months 2 and 3 of app usage. This trend remained broadly consistent when the user population was stratified by diabetes type (Fig. 1c and d), indicating a statistically significant improvement in glycemic control with app usage independent of diabetes type (P < 0.001).
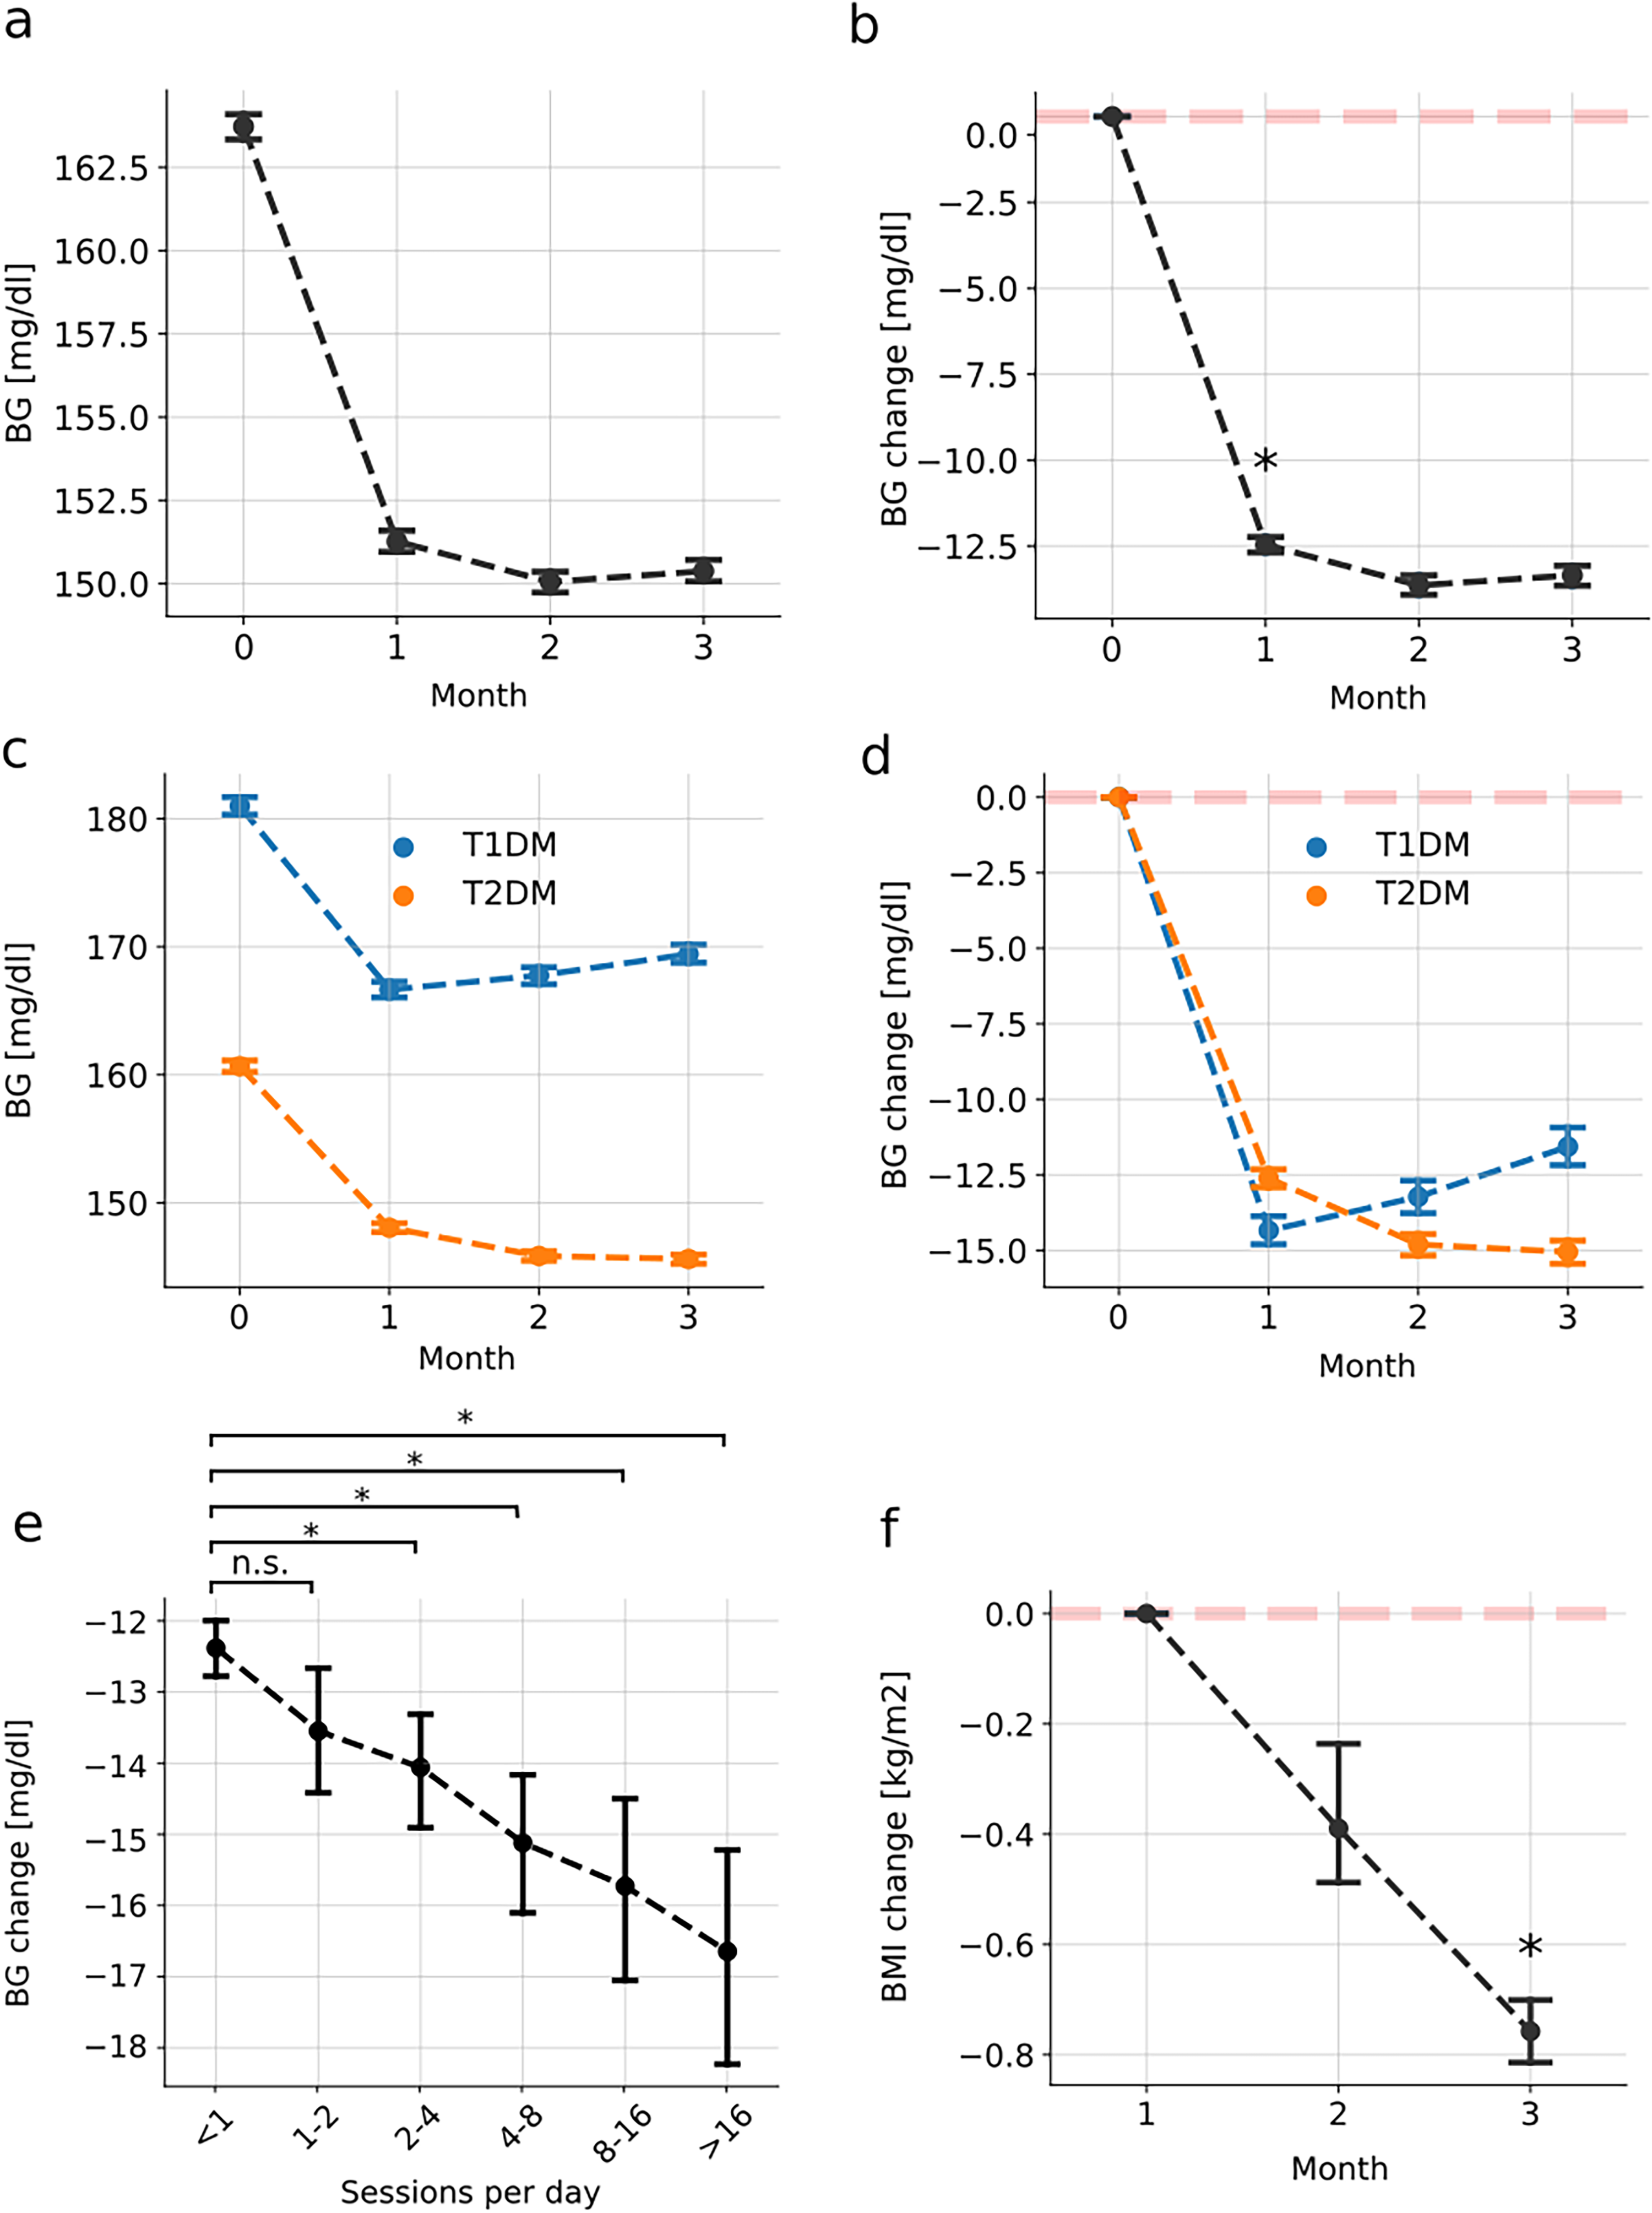
Glycemic and non-glycemic metric changes over 90 days of app use.
Mean improvement in BG levels was significantly associated with the level of app engagement when users were stratified by their app session count (ANOVA P < 0.001; Fig. 1e). The greatest improvement was seen in users reporting >16 sessions/day (n = 3127) with a difference of −4.2 mg/dL in mean BG change (P < 0.001; Fig. 1e) compared with users reporting <1 sessions/day (n = 45,013). Except for the user group with 1 to 2 sessions/day, a significant difference in the mean BG level improvement was observed in all app engagement categories compared with the group reporting <1 sessions/day. These results support a positive association between frequency of app usage and improved glycemic control, with the most pronounced improvement being observed among users with the highest engagement.
On average, users at risk of hypoglycemia, including both T1DM (n = 10,196) and T2DM users (n = 3429), experienced a significant reduction in BG measurements that fell below the recommended range (T1DM users: 1.2% reduction, T2DM users: 3.9% reduction, P < 0.001 for both comparisons; Fig. S1a and b). Quantification of outcomes after 90 days showed that 18.5% of T1DM users and 62.0% of T2DM users reached the recommended frequency of BG values within range.
Users at risk of hyperglycemia, including both T1DM (n = 15,561) and T2DM users (n = 17,944), also experienced a significant reduction in incidents of measurements exceeding the recommended range (T1DM users: 9.2% reduction, T2DM users: 21.8% reduction, P < 0.001 for both comparisons; Fig. S1c and d). The proportion of users who achieved the guideline recommendation after 90 days of app use was 16.6% for T1DM users and 47.3% for T2DM users.
Usage of a digital diabetes app is associated with improved non-glycemic metrics over a 90-day period
Association of app usage with weight control was examined in a cohort of 6910 users with T2DM who logged ≥1 BMI value per month in the app. The mean ± 95% confidence interval (CI) baseline BMI value of this cohort was 32.3 ± 0.18 kg/m2. After 90 days of using the app, the mean (95% CI) BMI value significantly decreased by −0.76 ± 0.06 kg/m2 (P < 0.001; 2.4% change from baseline; Fig. 1f).
Change in self-reported outcomes with app usage was explored based on a total of 143,600 user tags that captured feelings of hypoglycemia and hyperglycemia. In Month 3 of using the app, feelings of hypoglycemia and hyperglycemia were significantly reduced (P < 0.001 for both) compared with Month 1, with mean (95% CI) decreases of 16 ± 2.3% (absolute decrease, 0.24%) and 27 ± 1.3% (absolute decrease, 0.05%), respectively (Fig. 2a and b).
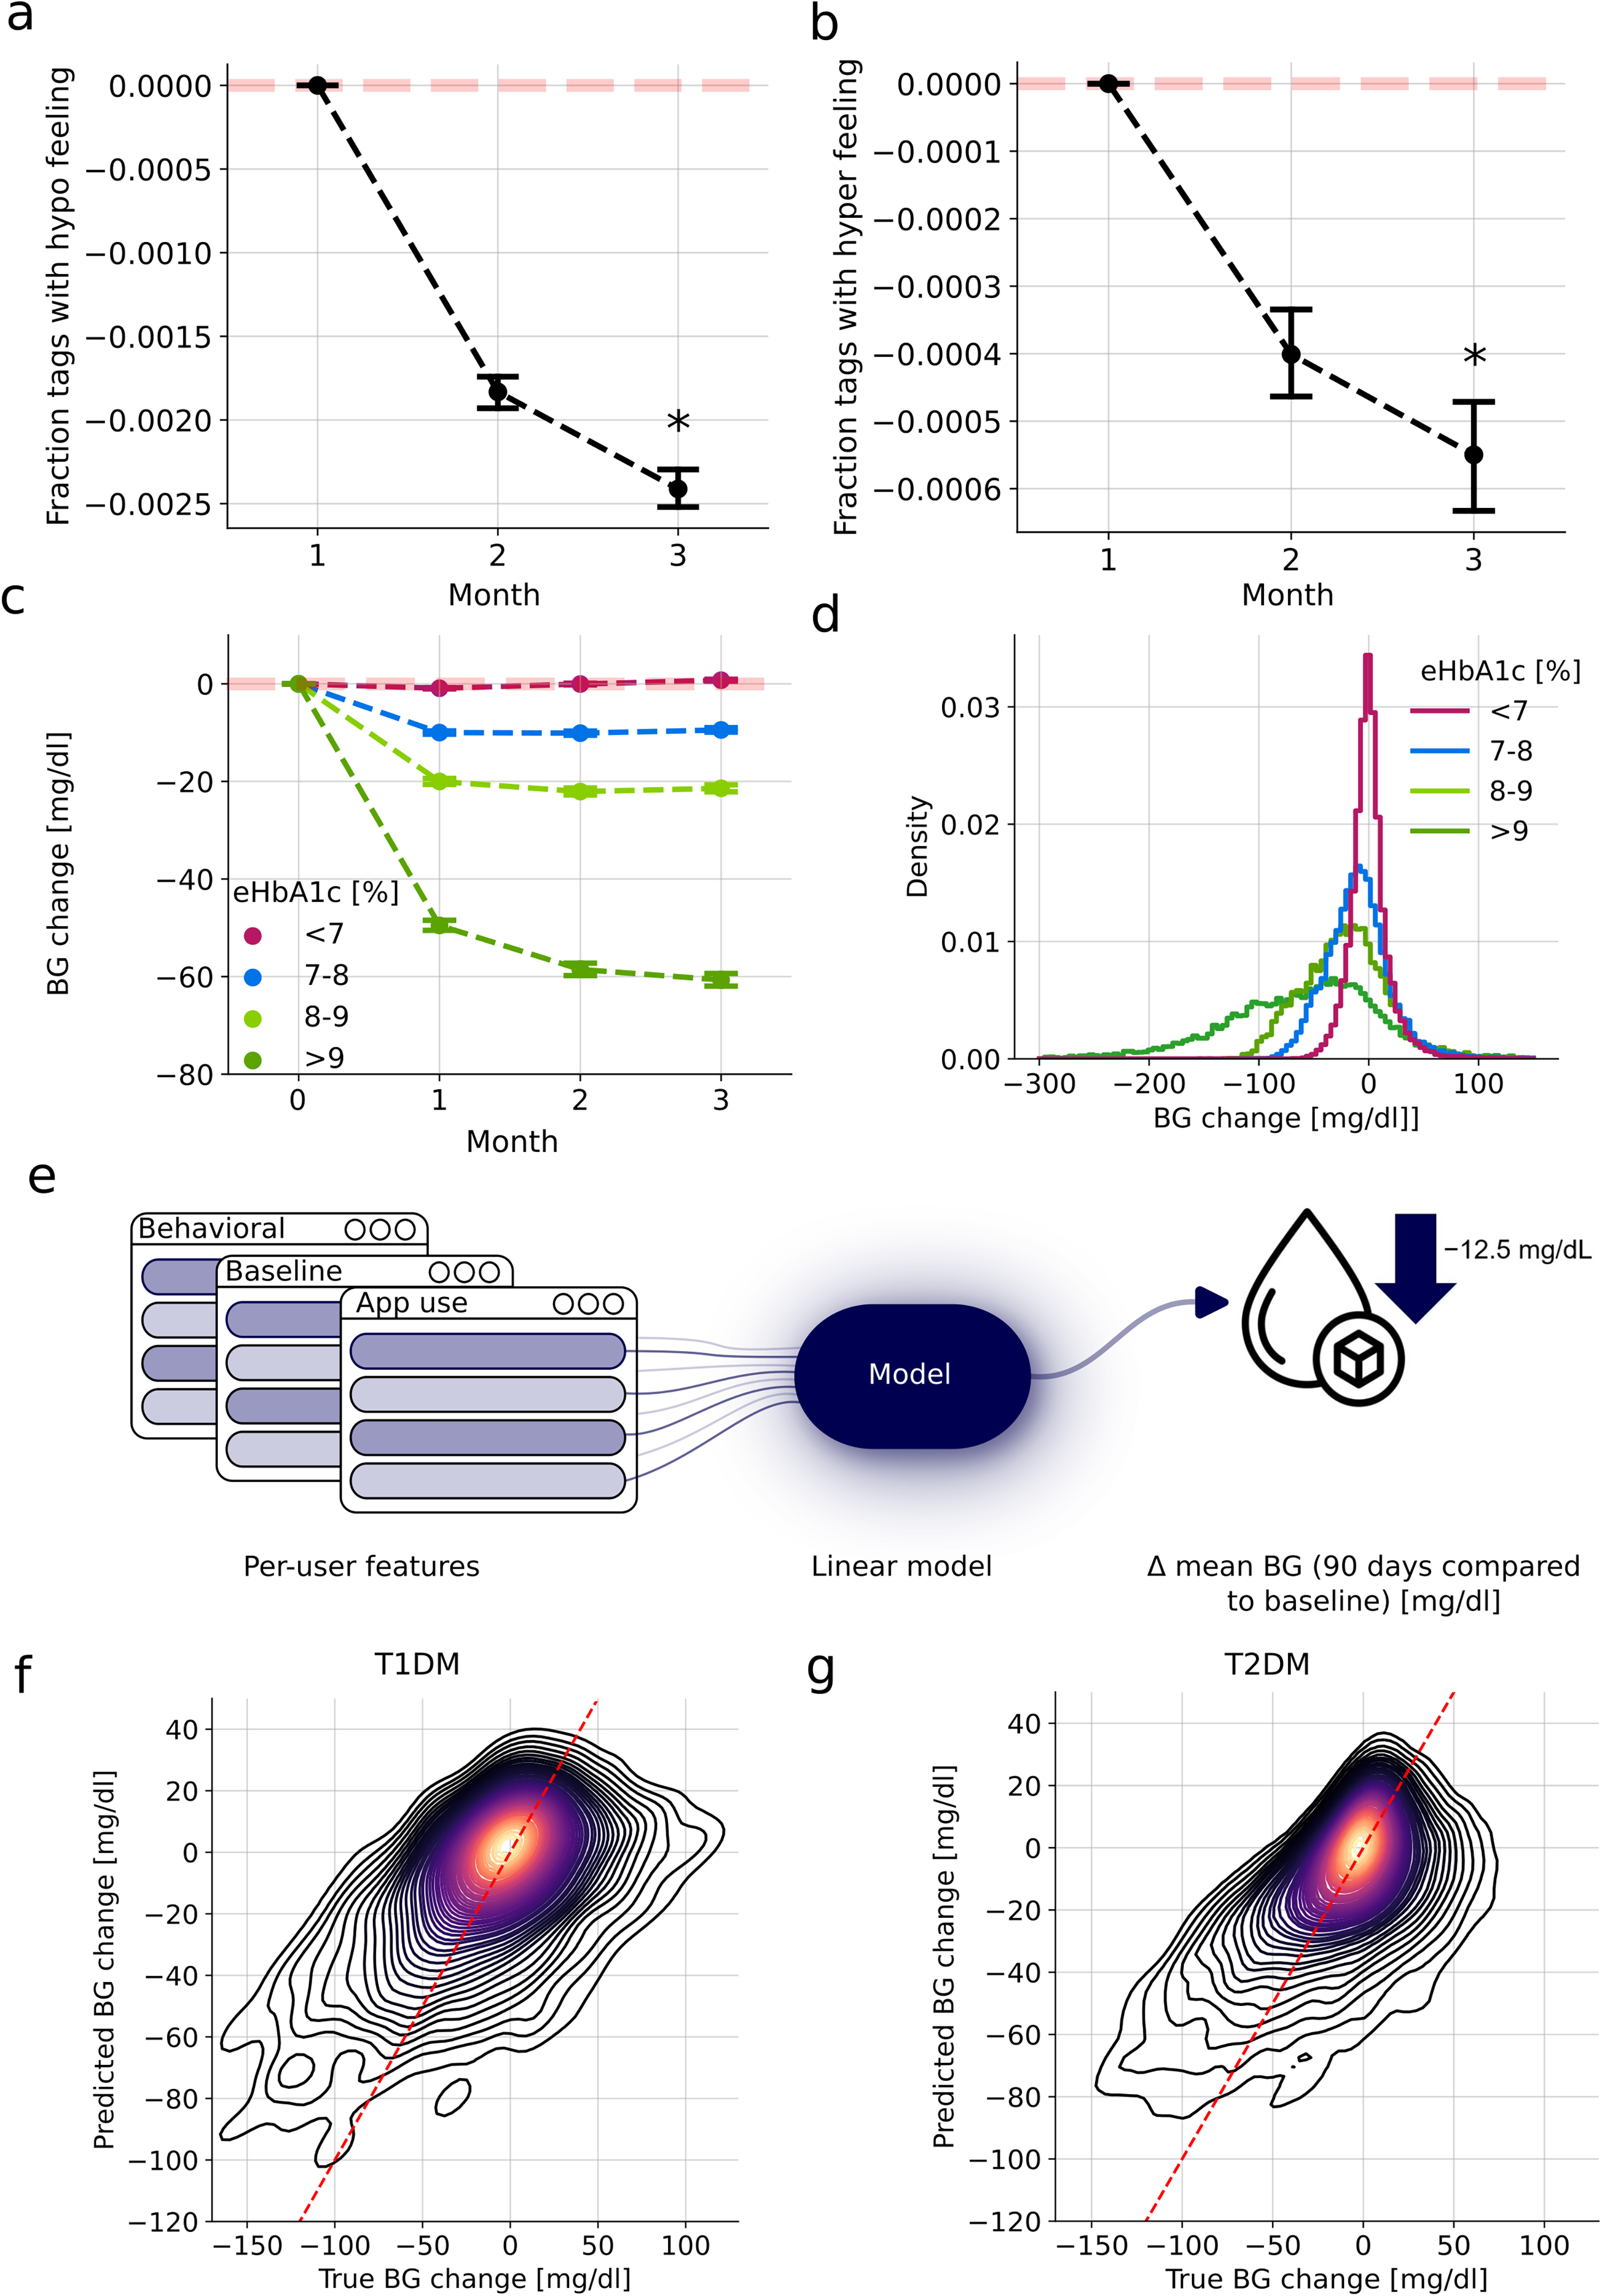
Variability of glycemic outcomes using a linear model.
Baseline eHbA1c level correlates with glycemic outcomes over a 90-day period of app usage
To ascertain whether glycemic outcomes depend on baseline glycemic control, app users were stratified based on their Month 0 eHbA1c level. Change in eHbA1c level over the 90-day observation period was greater in users with poorer baseline glycemic control, with the eHbA1c ≥ 9% group showing the greatest improvement (change in mean BG = −60.7 ± 0.67 mg/dL; Fig. 2c). Nevertheless, large variations were observed between groups with different eHbA1c levels (Fig. 2d).
Linear modeling was able to explain a large degree of variability in glycemic outcomes
To further explore the influence of user characteristics on glycemic outcomes, linear models were employed to predict changes in mean BG levels in users with T1DM and T2DM after 90 days of app usage (Fig. 2e). A comprehensive set of features was included (Supplementary Table S2), and the most predictive features and first-order interactions were identified. On the test dataset, the models achieved coefficient of determination scores of R2 = 0.355 (adjusted R2 = 0.353) for users with T1DM (n = 17,465 in the training dataset; n = 5822 in the test dataset) and R2 = 0.444 (adjusted R2 = 0.443) for users with T2DM (n = 39,069 in the training dataset; n = 13,023 in the test dataset) (Fig. 2f and g and Fig. S2a and b; Tables 2 and 3 for statistical tests and results on the training dataset).
Results of the Linear Glycemic Outcome Model for Users with Type 1 Diabetes Mellitus (T1DM) in the Training Dataset
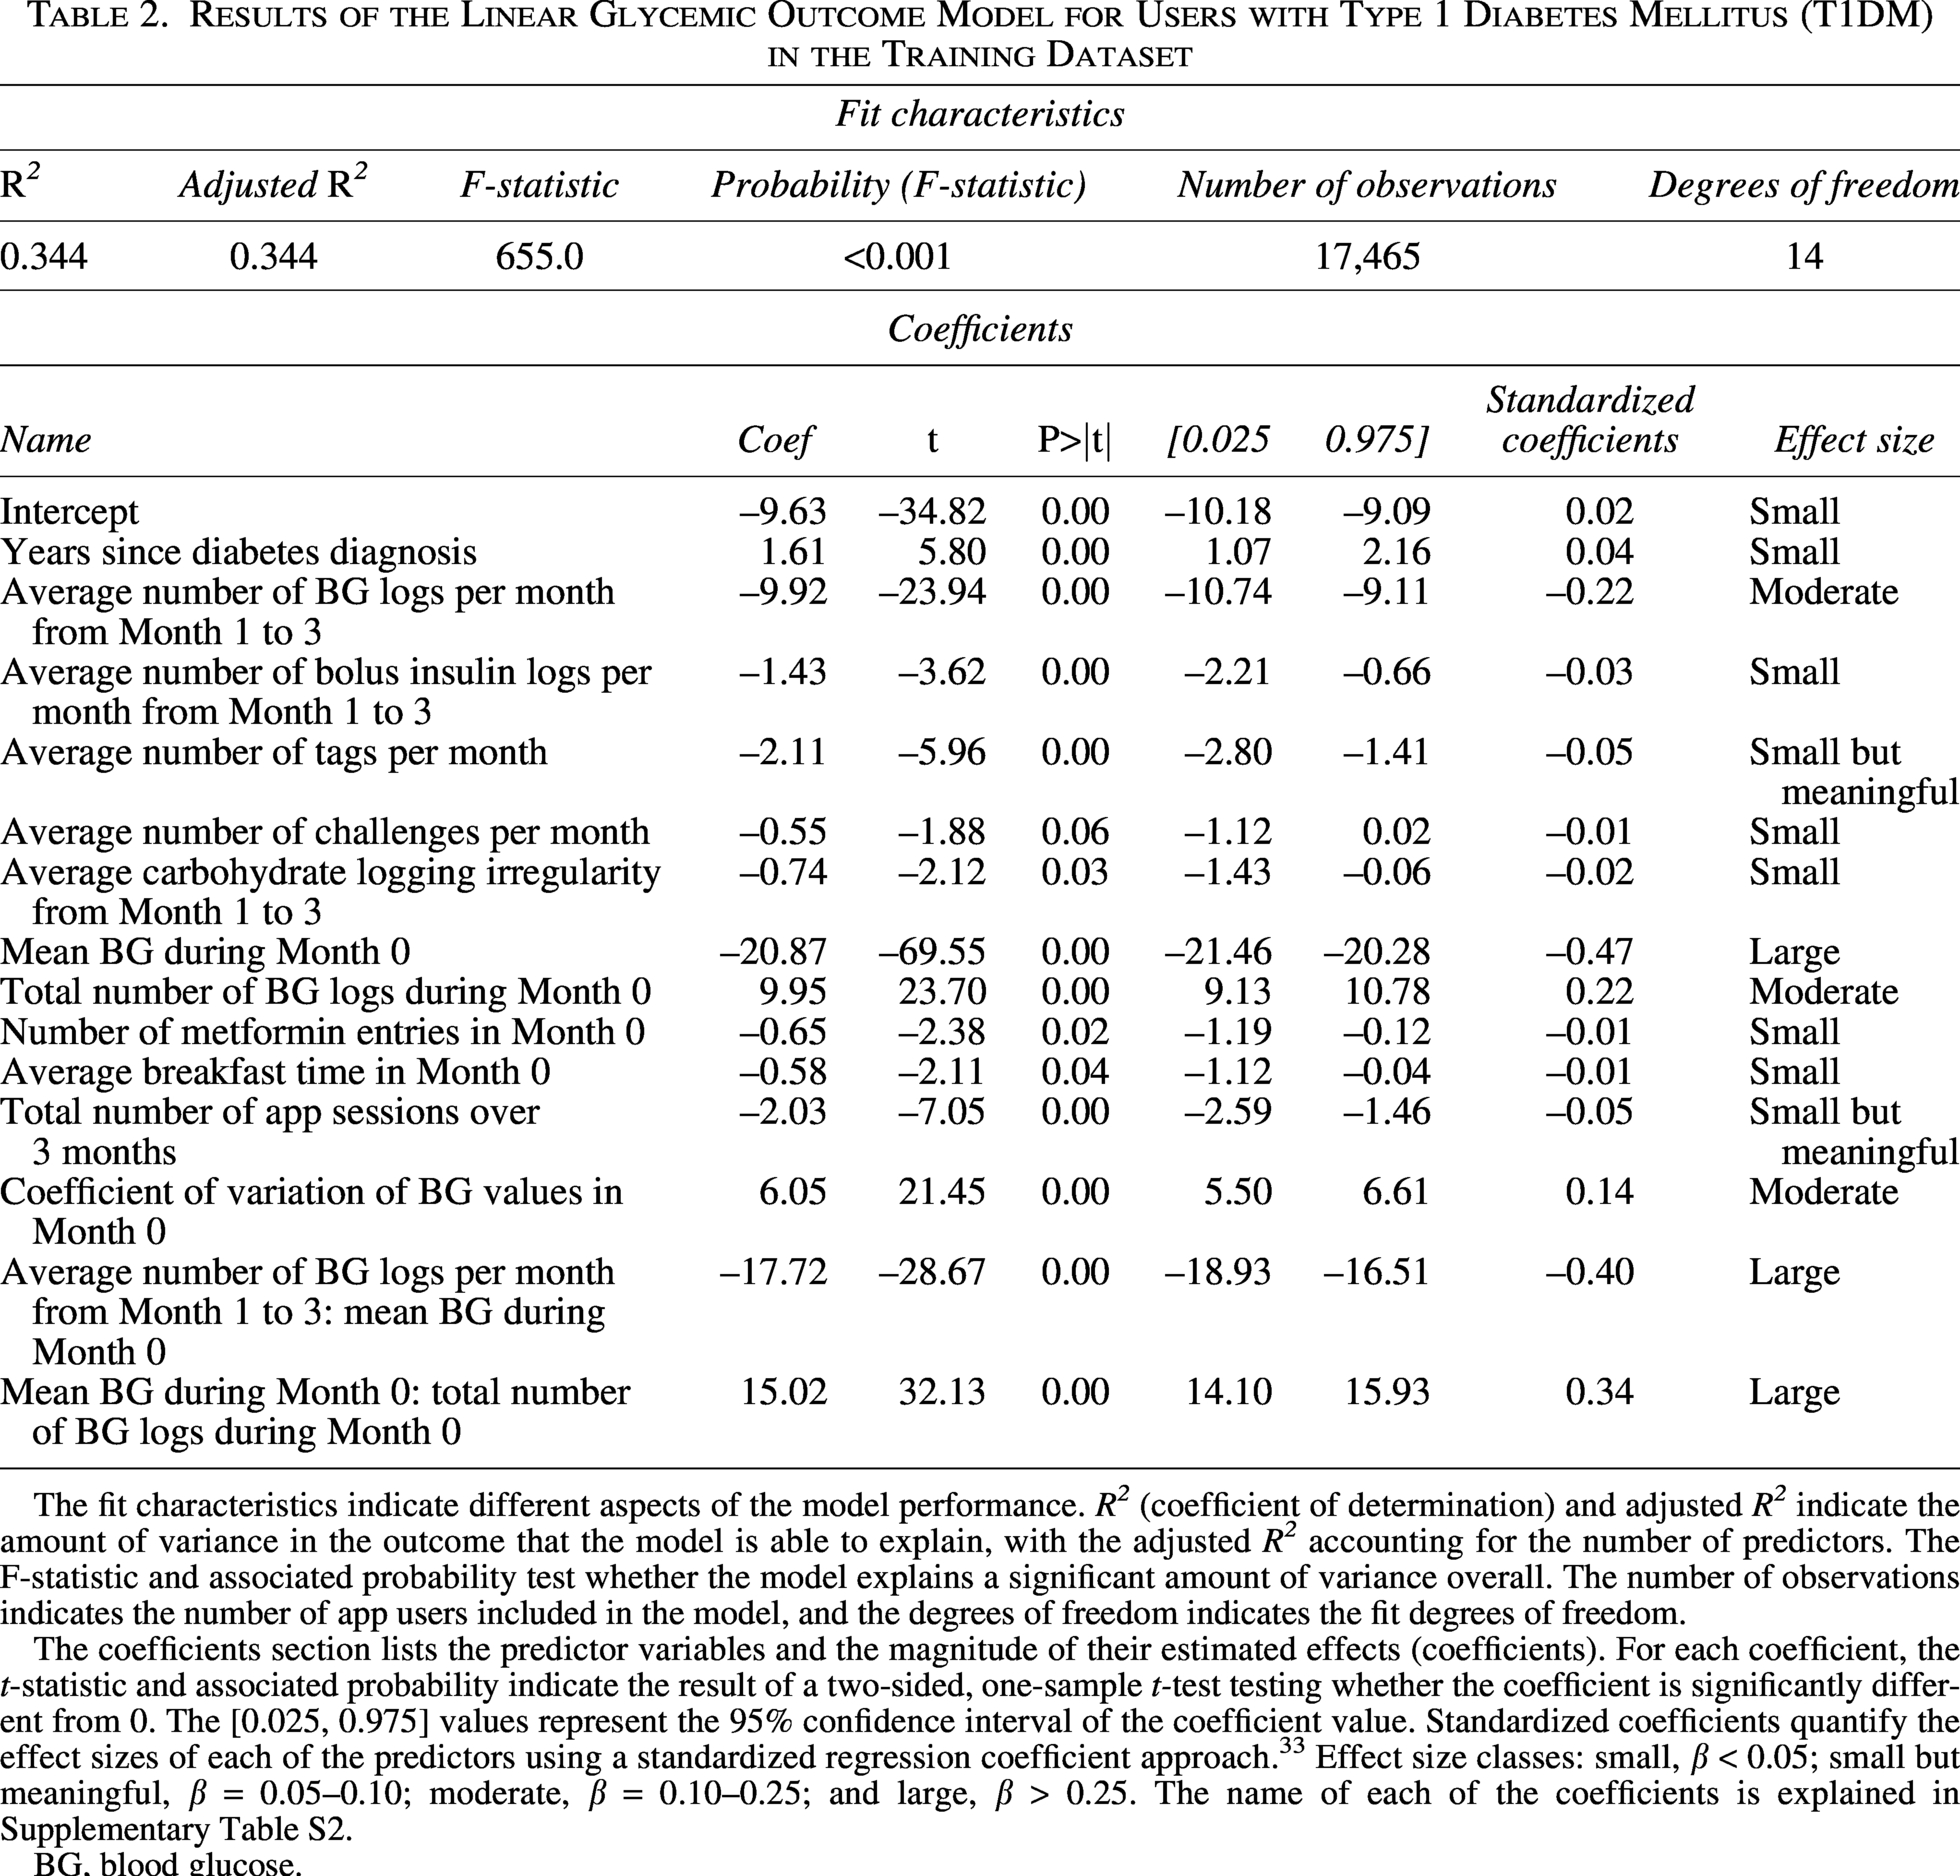
The fit characteristics indicate different aspects of the model performance. R2 (coefficient of determination) and adjusted R2 indicate the amount of variance in the outcome that the model is able to explain, with the adjusted R2 accounting for the number of predictors. The F-statistic and associated probability test whether the model explains a significant amount of variance overall. The number of observations indicates the number of app users included in the model, and the degrees of freedom indicates the fit degrees of freedom.
The coefficients section lists the predictor variables and the magnitude of their estimated effects (coefficients). For each coefficient, the t-statistic and associated probability indicate the result of a two-sided, one-sample t-test testing whether the coefficient is significantly different from 0. The [0.025, 0.975] values represent the 95% confidence interval of the coefficient value. Standardized coefficients quantify the effect sizes of each of the predictors using a standardized regression coefficient approach. 33 Effect size classes: small, β < 0.05; small but meaningful, β = 0.05–0.10; moderate, β = 0.10–0.25; and large, β > 0.25. The name of each of the coefficients is explained in Supplementary Table S2.
BG, blood glucose.
Results of the Linear Glycemic Outcome Model for Users with Type 2 Diabetes Mellitus (T2DM) in the Training Dataset
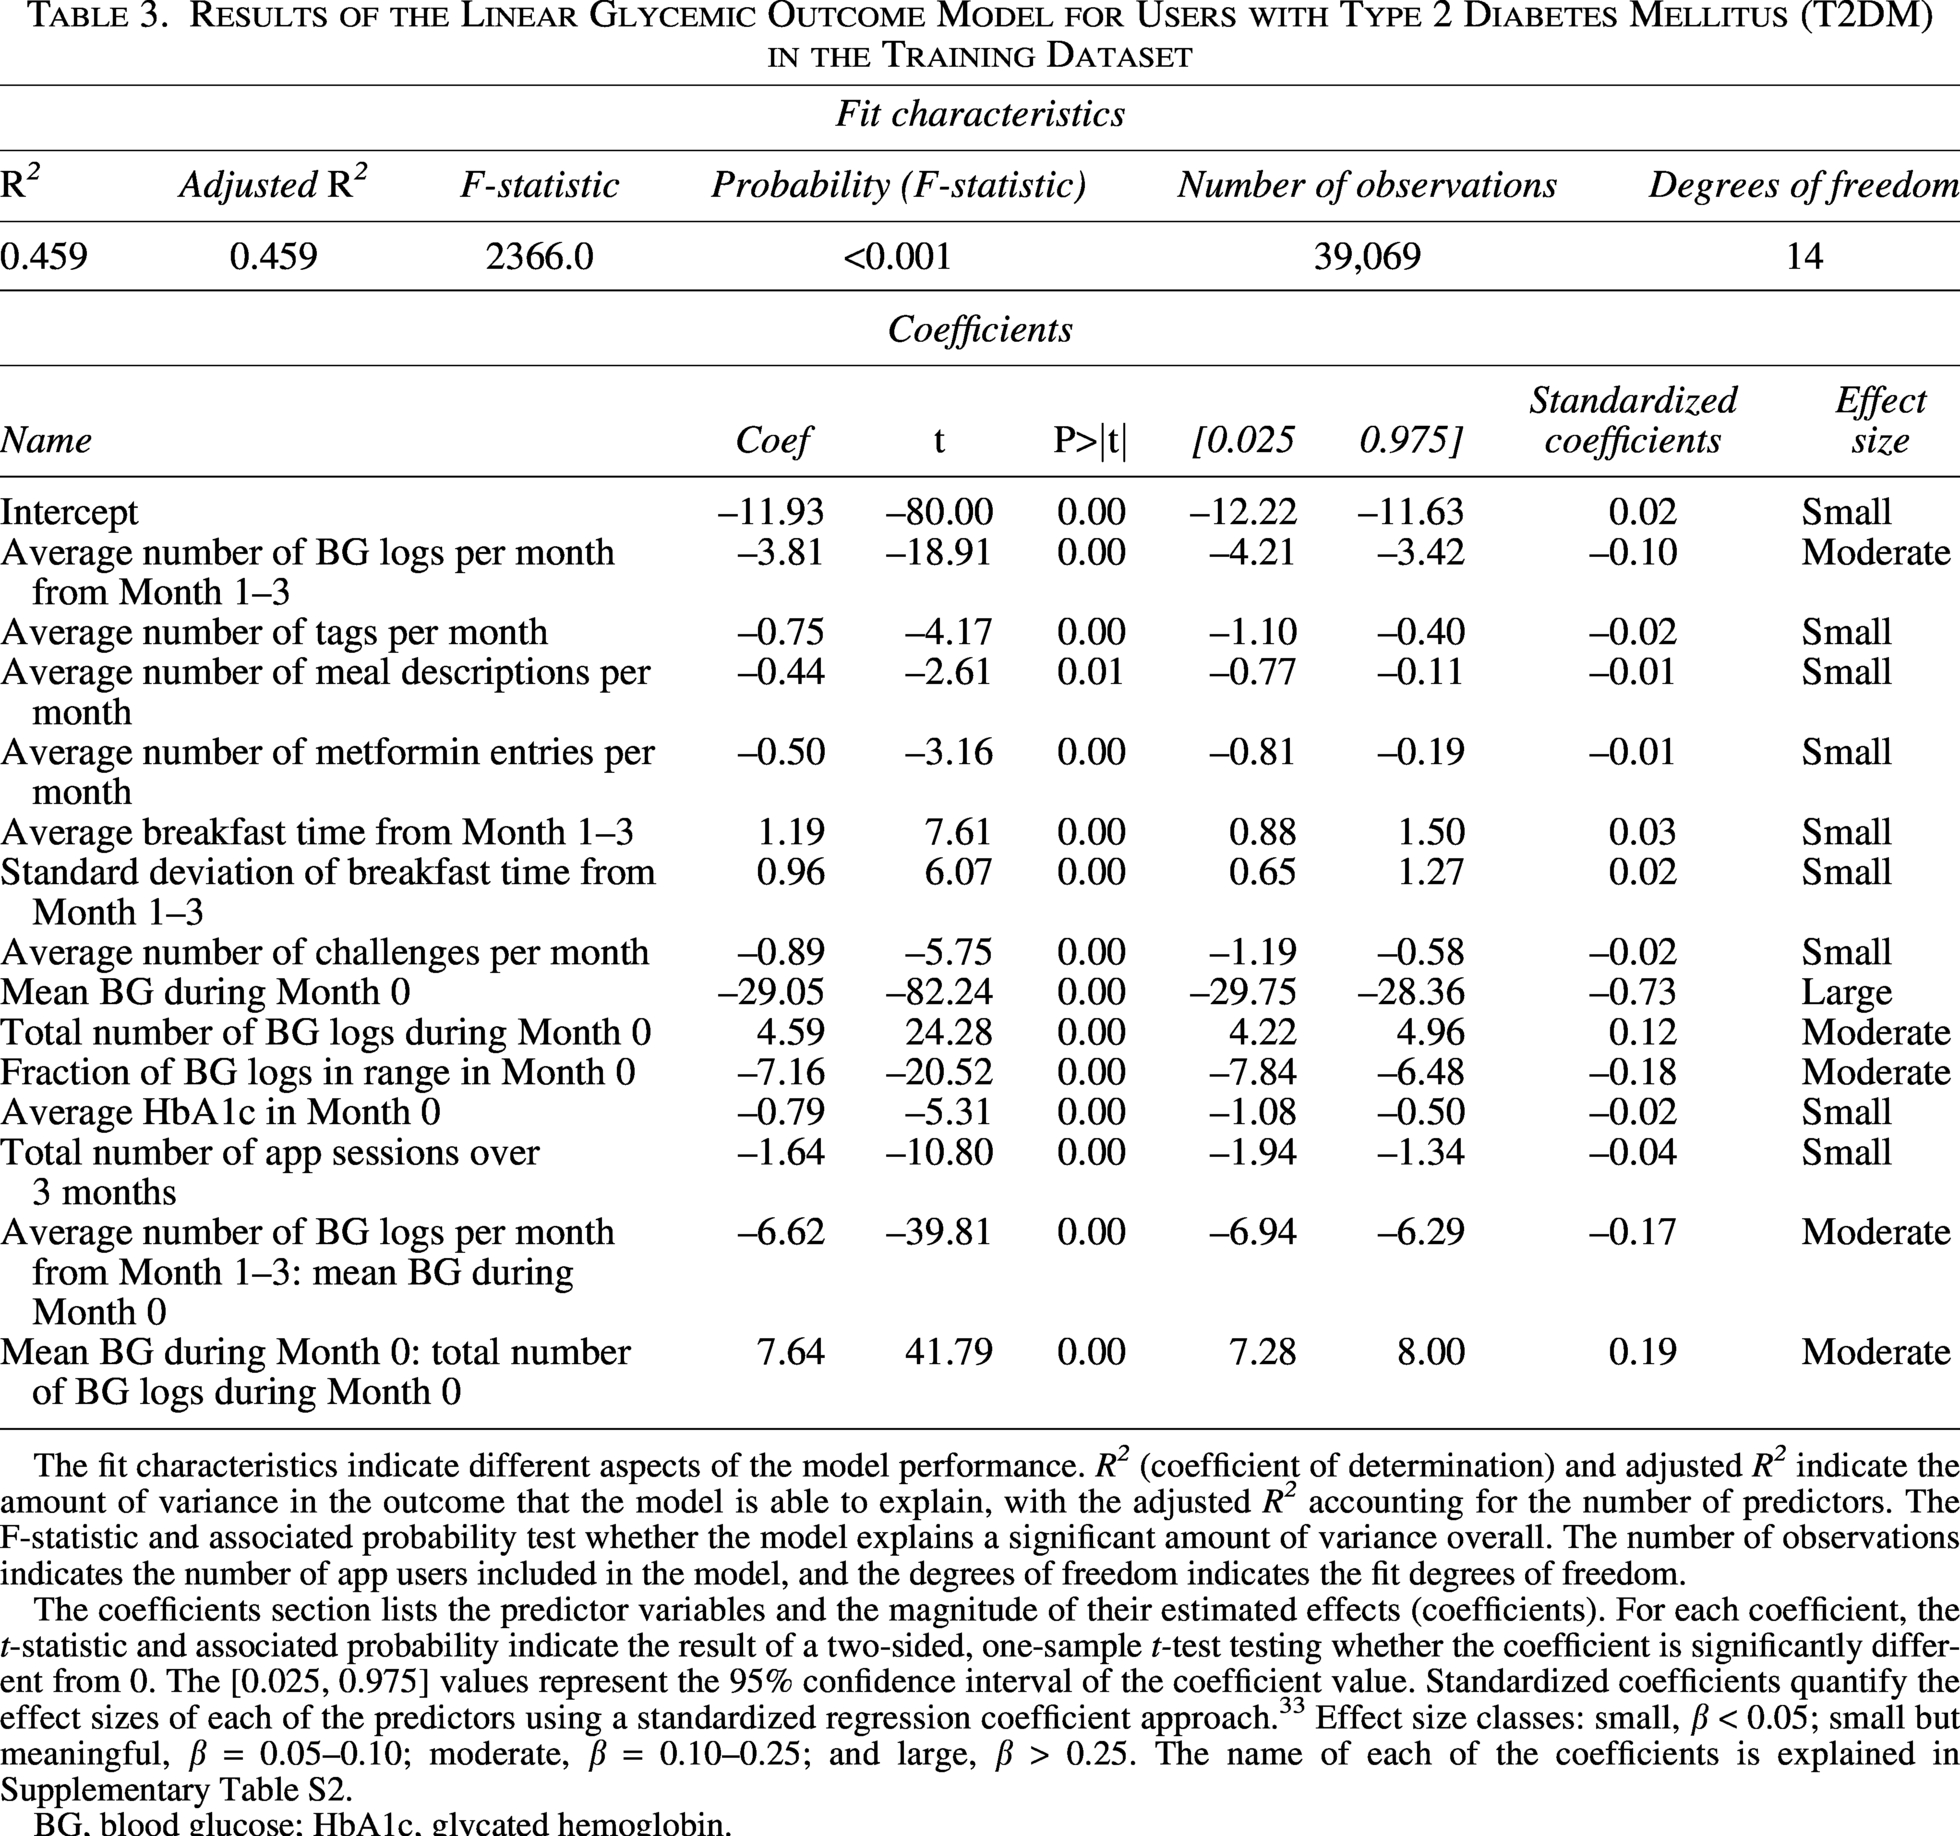
The fit characteristics indicate different aspects of the model performance. R2 (coefficient of determination) and adjusted R2 indicate the amount of variance in the outcome that the model is able to explain, with the adjusted R2 accounting for the number of predictors. The F-statistic and associated probability test whether the model explains a significant amount of variance overall. The number of observations indicates the number of app users included in the model, and the degrees of freedom indicates the fit degrees of freedom.
The coefficients section lists the predictor variables and the magnitude of their estimated effects (coefficients). For each coefficient, the t-statistic and associated probability indicate the result of a two-sided, one-sample t-test testing whether the coefficient is significantly different from 0. The [0.025, 0.975] values represent the 95% confidence interval of the coefficient value. Standardized coefficients quantify the effect sizes of each of the predictors using a standardized regression coefficient approach. 33 Effect size classes: small, β < 0.05; small but meaningful, β = 0.05–0.10; moderate, β = 0.10–0.25; and large, β > 0.25. The name of each of the coefficients is explained in Supplementary Table S2.
BG, blood glucose; HbA1c, glycated hemoglobin.
In both models, the mean BG level at Month 0, the month before the user started using mySugr, was identified as the predictor with the strongest impact on glycemic outcomes (Fig. 3a and b), with higher baseline BG levels being associated with greater improvements, which is consistent with the population analysis (Fig. 2c). Predictor effect sizes were quantified using standardized coefficients (Tables 2 and 3). Mean Month 0 BG had a large effect on glycemic outcomes for both T1DM and T2DM. The total number of Month 0 BG logs and the average number of BG logs from Month 1 to Month 3 had a moderate effect on glycemic outcomes, with a higher number of BG logs associated with better outcomes for both T1DM and T2DM. For users with T1DM, the average number of context tags used per month and the total number of app sessions over the 3 months had a small but meaningful effect on glycemic outcomes, with a higher number of tags and app sessions predicting better outcomes.
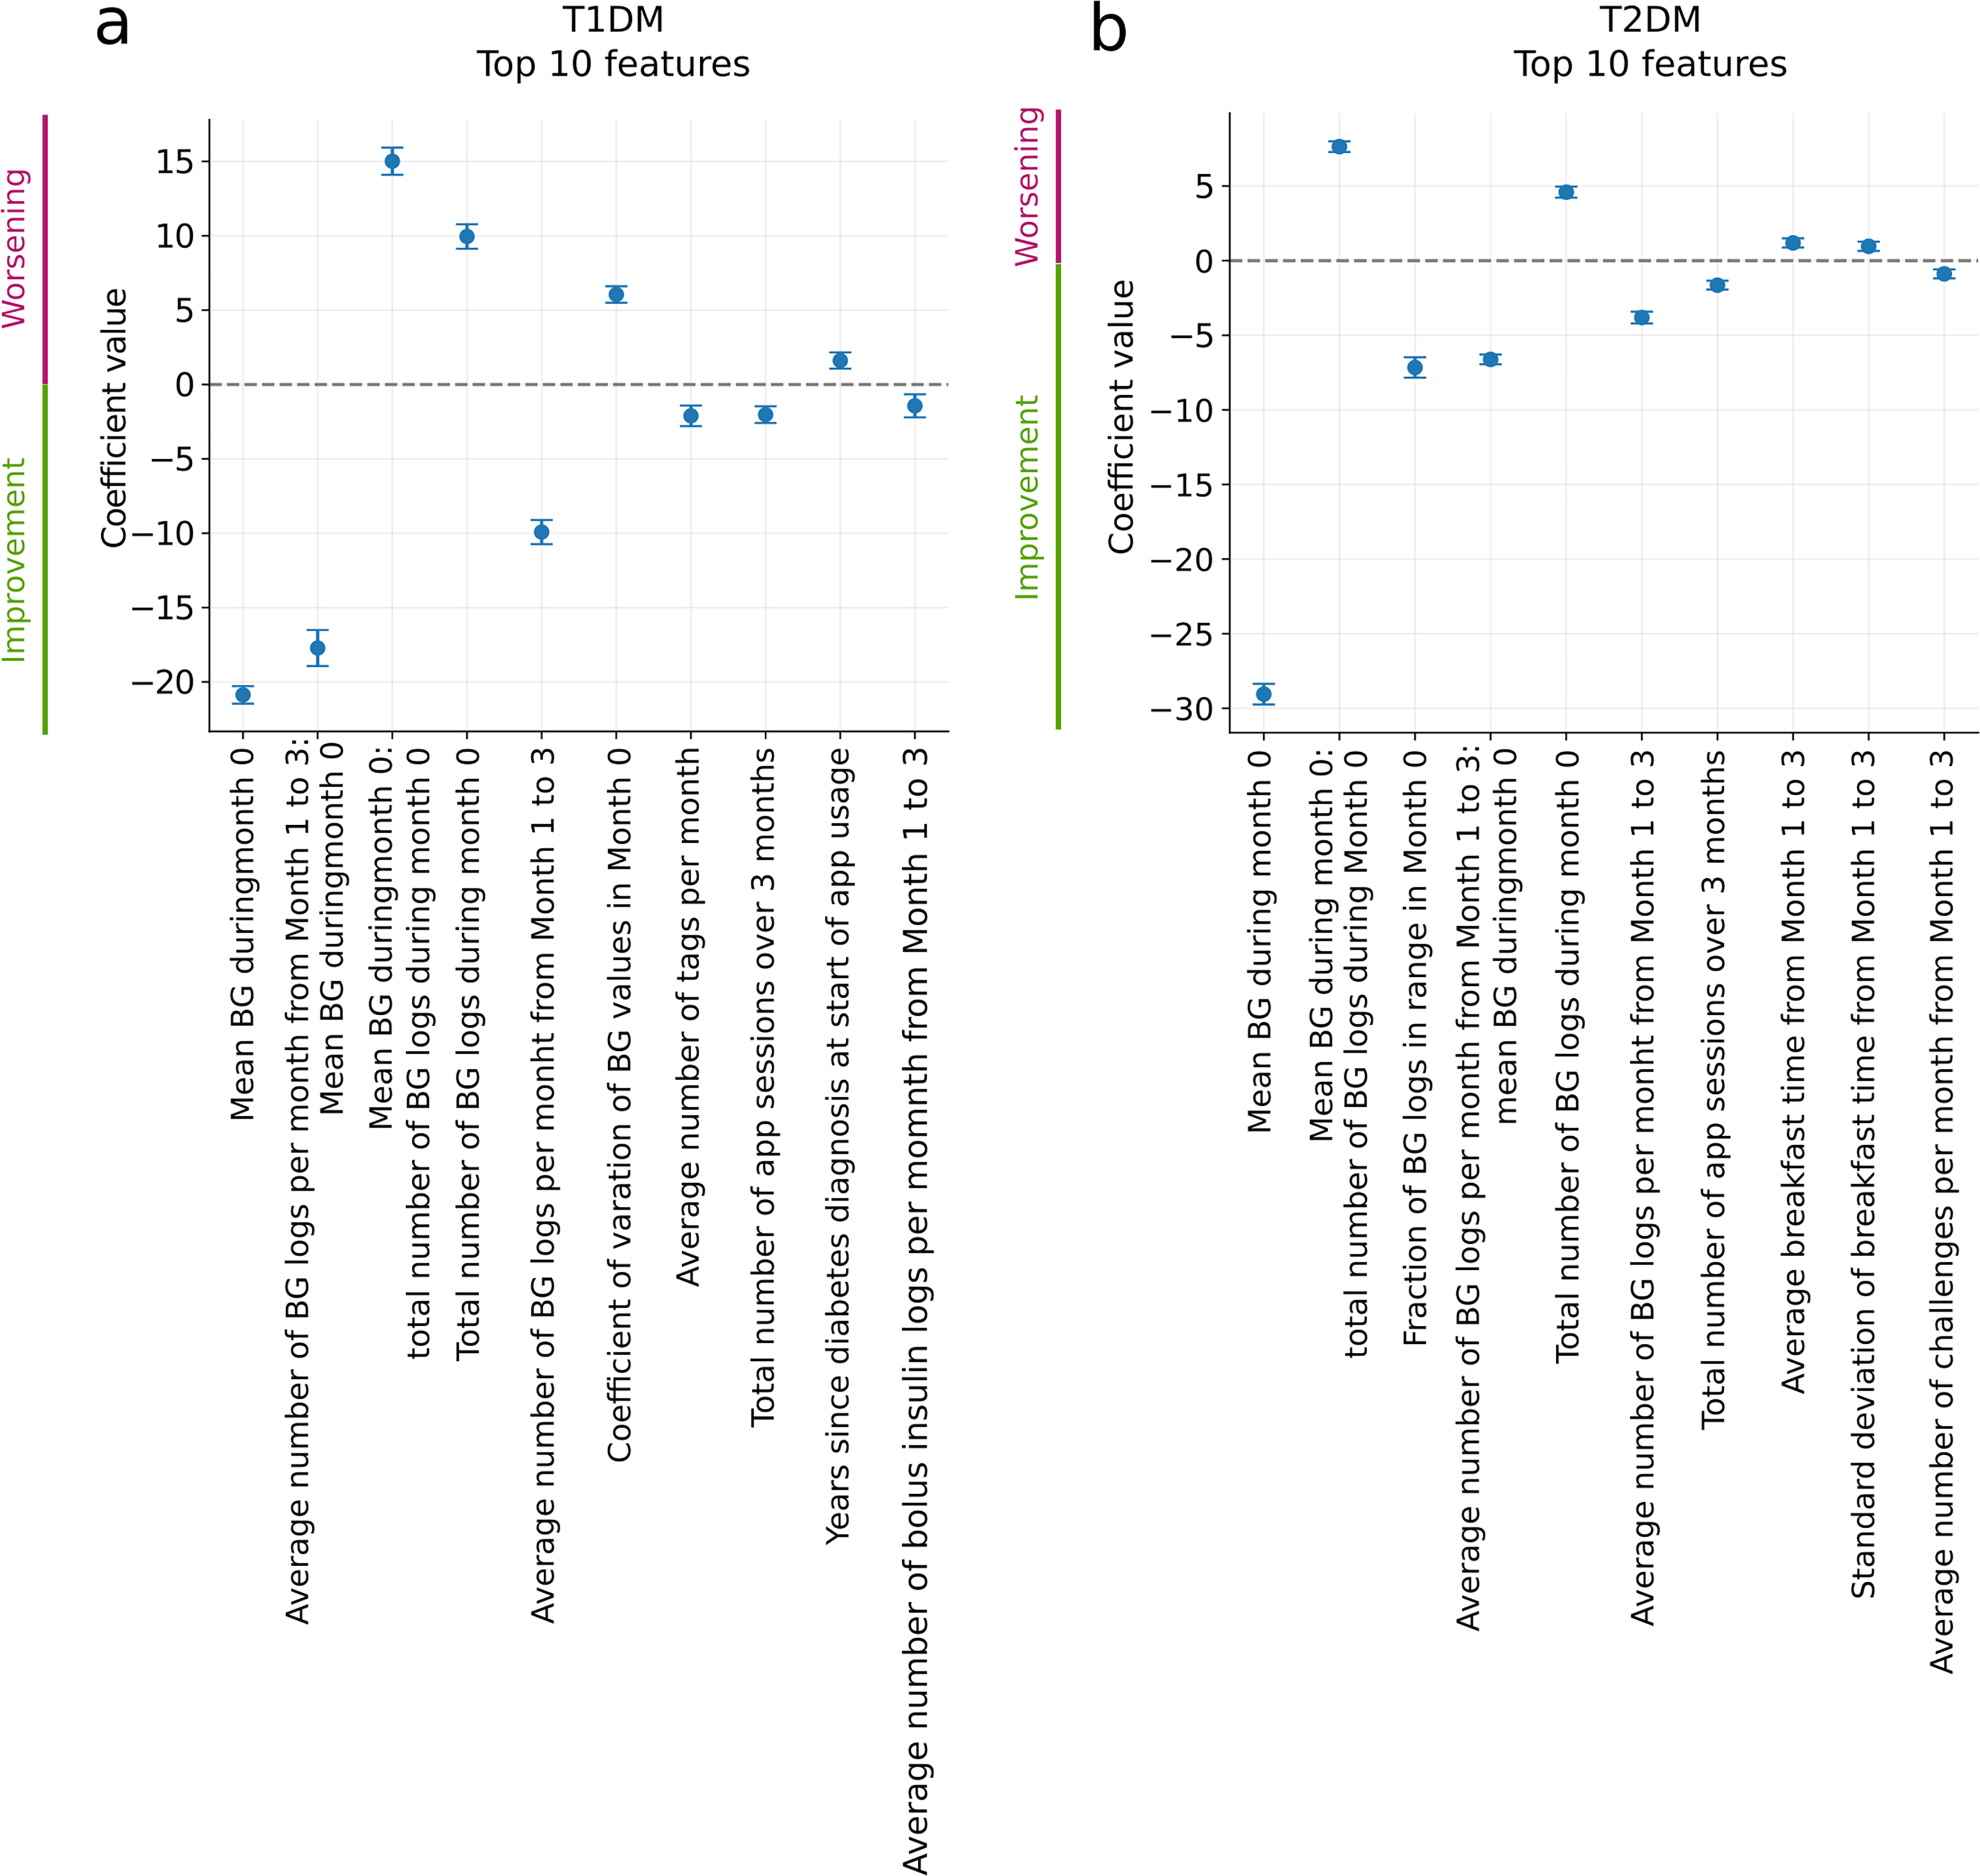
Top 10 coefficients of the linear model identified for users with T1DM
mySugr app functionalities are associated with improved glycemic outcomes over a 90-day period
To quantify the app functionalities with the greatest impact on glycemic improvement in individual users, features such as logging context tags and number of app sessions that measured different aspects of app usage were created for the linear model. The analysis revealed that increasing engagement with the app, through tags or sessions, leads to improved glycemic outcomes in both users with T1DM and T2DM (Fig. S2c and d), consistent with the population analysis.
User habits are associated with changes in glycemic control
To determine which behavioral patterns were most effective in predicting improved glycemic outcomes, log entries were analyzed to generate features within the model that reflect crucial aspects of daily diabetes management, such as BG monitoring, insulin delivery, and carbohydrate intake. Analysis of the timing, regularity, and variance of these entries revealed that the number of BG measurements was the most predictive feature for both users with T1DM and T2DM (Fig. S2e and f). A strong interaction was also observed between baseline BG control and the number of BG measurements for both user cohorts. For users with T1DM, other important behavioral features included number of bolus logs and the regularity of carbohydrate logs, whereas for users with T2DM, the second most relevant feature was breakfast timing, both in absolute terms and in terms of regularity.
Discussion
This study demonstrates that using a digital health app for diabetes management can significantly improve glycemic control over 90 days of use, which is consistent with previous findings supporting the positive impact of similar apps on glycemic outcomes of people with diabetes.19–24 The decrease of 12.5 mg/dL in mean BG levels observed in the present study, which corresponds to a change of 0.45% in the eHbA1c level, exceeded the clinically relevant threshold of 0.3%.30,34 Interestingly, the degree of reduction in mean BG correlated with the frequency of app usage, consistent with results observed with another diabetes management app in recent reports and clinical studies,19,20,23 supporting the hypothesis that adherence to mobile health interventions is associated with improved glycemic outcomes. Although the difference between the lowest (<1 sessions/day) and highest (16+ sessions/day) was relatively small (–4.2 mg/dL), this represents an average effect across a heterogeneous population, and some individuals may garner greater benefits with app engagement than others. Overall, the relatively modest incremental gain between the lowest and highest engagement categories is a positive finding: it suggests that clinically meaningful improvements in glycemic control can be achieved even with limited app use, lowering the burden on users.
Our findings can be interpreted in the context of published randomized controlled trials evaluating the effect of mySugr app on glycemic outcomes and in particular HbA1c levels. In a randomized controlled trial, 35 mySugr users (n = 32) had a lower mean HbA1c at 12 weeks than the control group, but this did not reach statistical significance. The small sample size was a key limitation of the study and limited statistical power, in contrast to the large-scale analysis of 80,044 app users presented here. Another relatively small sample size study 36 (n = 424) evaluated the effect of mySugr app and its association with reducing diabetes distress. HbA1c levels were also evaluated but only as a secondary outcome; therefore, the study was not powered to show glycemic control benefits in this design. In a secondary analysis of the same trial (n = 342), 37 the likelihood of achieving optimal glycemic control, defined as an HbA1c value ≤ 6.5% at the 3-month follow-up, was nearly doubled in the mySugr group versus the control group. Additional real-world data (n = 2861) revealed reductions in mean BG at 3 months of app usage, which were sustained over a 12-month period. 37
Although diabetes therapies have traditionally focused on glycemic control, there has been a growing emphasis on non-glycemic metrics such as weight management and patient well-being.38–42 Reduction in mean BMI in the T2DM cohort, with prevalent obesity at baseline (defined as BMI ≥ 30 kg/m2,43), indicates a potential benefit of the app for weight control in this population; however, information regarding use of weight reduction medications (e.g., glucagon-like peptide-1 receptor agonists [GLP-1 RAs], oral antidiabetic drugs) was lacking in the current study. The observed reduction in BMI in app users with T2DM is in line with two meta-analyses reporting similar effects for other digital health and diabetes management apps, respectively.44,45 Although this reduction does not reach the threshold of 5% for clinical relevance,44,46 the magnitude of change is in line with or exceeds the values reported by Cai et al., despite the meta-analysis focusing on apps that specifically target BMI reduction, 44 which is not a primary objective of mySugr. These results suggest that it is worth considering the potential positive impact of engagement with an interactive logbook app that can record weight and import data automatically from smart scales to foster motivation for weight reduction without coaching. This change may be driven by self-regulation and frequent interaction with the logbook, which allows people with diabetes to visualize glucose spikes and likely prompts immediate dietary adjustments to help stabilize variability independent of external intervention. 47 Given the rising prevalence of obesity in people with T1DM, 48 and preliminary evidence that GLP-1 RAs are effective and well tolerated in people with T1DM,49,50 suggested weight management applications of the mySugr app may be useful in this population also.
The evaluation of patient-reported outcomes (i.e., information provided directly by patients about their health status, symptoms, and the impact of medical treatments on quality of life) has recently gained momentum in diabetes management.40–42,44,51 While the mySugr app does not allow for large-scale assessments based on patient-reported outcomes, this study defined context tags as an indicator of subjective well-being. Results showed that app usage was associated with a reduction in user-reported hypoglycemia and hyperglycemia tags. We speculate that this may reduce the associated psychological burden of diabetes for users; however, absolute reductions in tags were small (0.24% for hypoglycemia and 0.05% for hyperglycemia). As no clinical guidelines exist for measuring changes in patient-reported hypoglycemic and hyperglycemic feeling, these quantifications serve as a proxy rather than a direct clinical end point. Nonetheless, they set the stage for more frequent and less intrusive appraisal of patient well-being.
Optimal diabetes management is unique to each person with diabetes: treatments are tailored based on characteristics such as age, comorbidities, disease progression, and personal preference and continually adjusted in response to factors such as diet, physical activity, work, and illness. 52 It is therefore not surprising that, while all app users in this study reported reduced mean BG levels over the 90-day observation period and the greatest reductions were recorded in users with the highest initial eHbA1c levels, individual outcomes varied considerably, even among people with a similar initial eHbA1c. Models that predict this variability with a high degree of certainty were developed in this work, but a large proportion of the variability remains unexplained. This is expected in real-world human studies considering the complexity of predicting long-term, real-world outcomes that are heavily dependent on human behavior—explaining this degree of variability, therefore, offers a valuable insight into demographic, clinical, and behavioral predictors of glycemic outcomes. The closeness of the adjusted R2 to R2 suggests that the model captured a true relationship between the predictors and the outcomes, and the predictive power of the model was also validated by its performance on previously unseen test data.
The most important feature for predicting glycemic outcomes identified by the model, in agreement with the population analysis, was baseline glycemic control. This feature has been previously associated with glycemic outcomes in studies using electronic health records as data sources,53–55 which confirms the reliability of the models developed in this study. Additionally, features associated with the active use of mySugr, such as frequency of BG level entries, number of app sessions, and context tags, were found to effectively predict improvement in glycemic control, with users with poor initial diabetes management showing greater improvements with increasing app engagement. These results are in line with earlier findings supporting that active engagement with mobile health apps can lead to improved glycemic outcomes56,57 and suggest that users with suboptimal glycemic control may be at a greater and more specific need for digital interventions.
While this study illustrated the benefits of using an app for diabetes management, there are still a few limitations that highlight opportunities for future research. First, the study remains purely observational and does not allow the conclusion of any definitive causal relationships. Second, the present analysis is limited to the behavior of the users within the scope of app usage, which might not be directly applicable to the general population. Third, this study relies on data voluntarily entered by users during regular use of the mySugr app, and part of the dataset contains inference-based data. Although the data for the analysis were collected over a long time period spanning over 13 years and the mySugr app has changed over this time, the basic functionality remains the same and our findings remain relevant to users currently engaging with the app. Fourth, use of standardized coefficients highlighted the different effect sizes associated with the predictors of glycemic outcomes, and some of these were small. Finally, while demographic data (e.g., patient sex) could have been included in the modeling, a high level of missing values precluded this.
Conclusions
Despite these limitations, this comprehensive, longitudinal analysis is mainly based on real-world data collected from the mySugr app that could potentially lay the ground for further research in follow-up randomized trials to establish causal relationships between behavioral patterns and glycemic outcomes. Moreover, the models developed for this analysis predicted glycemic outcomes with high confidence and in future could be applied to identify individuals who would benefit from early intervention and behaviors that could hinder or help their glycemic outcomes, for example, breakfast timing or regularity of their carbohydrate logging. Ultimately, this may lead to improved self-management of diabetes in the long term while enhancing the efficiency of health care delivery systems.
Authors’ Contributions
M.M., B.R., D.T., E.C., R.M., and S.S. developed the ideation of the article and the real-world data study design. M.M., B.R., and J.Z. performed the analyses, statistical modeling, and figure design. M.M., B.R., J.Z., D.T., E.C., C.N., M.L., M.P., and K.S. wrote the article. All authors contributed to the data interpretation, read and critically reviewed the article, and approved the final draft for submission.
Ethics Committee Approval
All app users provided consent for the use of their data for research purposes, including the context of this publication. The research protocol for the present study was submitted to an independent institutional review board, which waived the requirement for ethics committee review. The study complies with the RECORD (REporting of studies Conducted using Observational Routinely-collected health Data) guidelines for adequate reporting and reproducibility.
Data Sharing Statement
Anonymized data, without any demographic identifiers, underlying the results and analysis can be made available to researchers upon reasonable request to the corresponding author after publication. A data access agreement needs to be signed in advance.
Code Availability
The code used for all analyses performed in this publication will be made available on GitHub upon publication.
Footnotes
Acknowledgments
The authors would like to thank Ines Wiesner for her support during the initial phase of the project; Monika Ambramczuk, Valerie Eichinger, Kasia Malenczyk, Annette Moritz, Ruth Schübel, and Johanna Kober for the review of the article. MYSUGR is a trademark of Roche.
Author Disclosure Statement
All authors declare financial competing interests and are employees or freelancers contracted by Roche Diabetes Care GmbH (Mannheim, Germany) at the time of writing the article. E.C. is a doctoral candidate at the Medical University of Graz. M.P. is the founder and CEO of CATALYST SCIENTIFIC GmbH, Wien, Austria. All authors declare that they have no nonfinancial competing interest.
Funding Information
This analysis was funded by
Supplemental Material
References
Supplementary Material
Please find the following supplemental material available below.
For Open Access articles published under a Creative Commons License, all supplemental material carries the same license as the article it is associated with.
For non-Open Access articles published, all supplemental material carries a non-exclusive license, and permission requests for re-use of supplemental material or any part of supplemental material shall be sent directly to the copyright owner as specified in the copyright notice associated with the article.