
Abstract
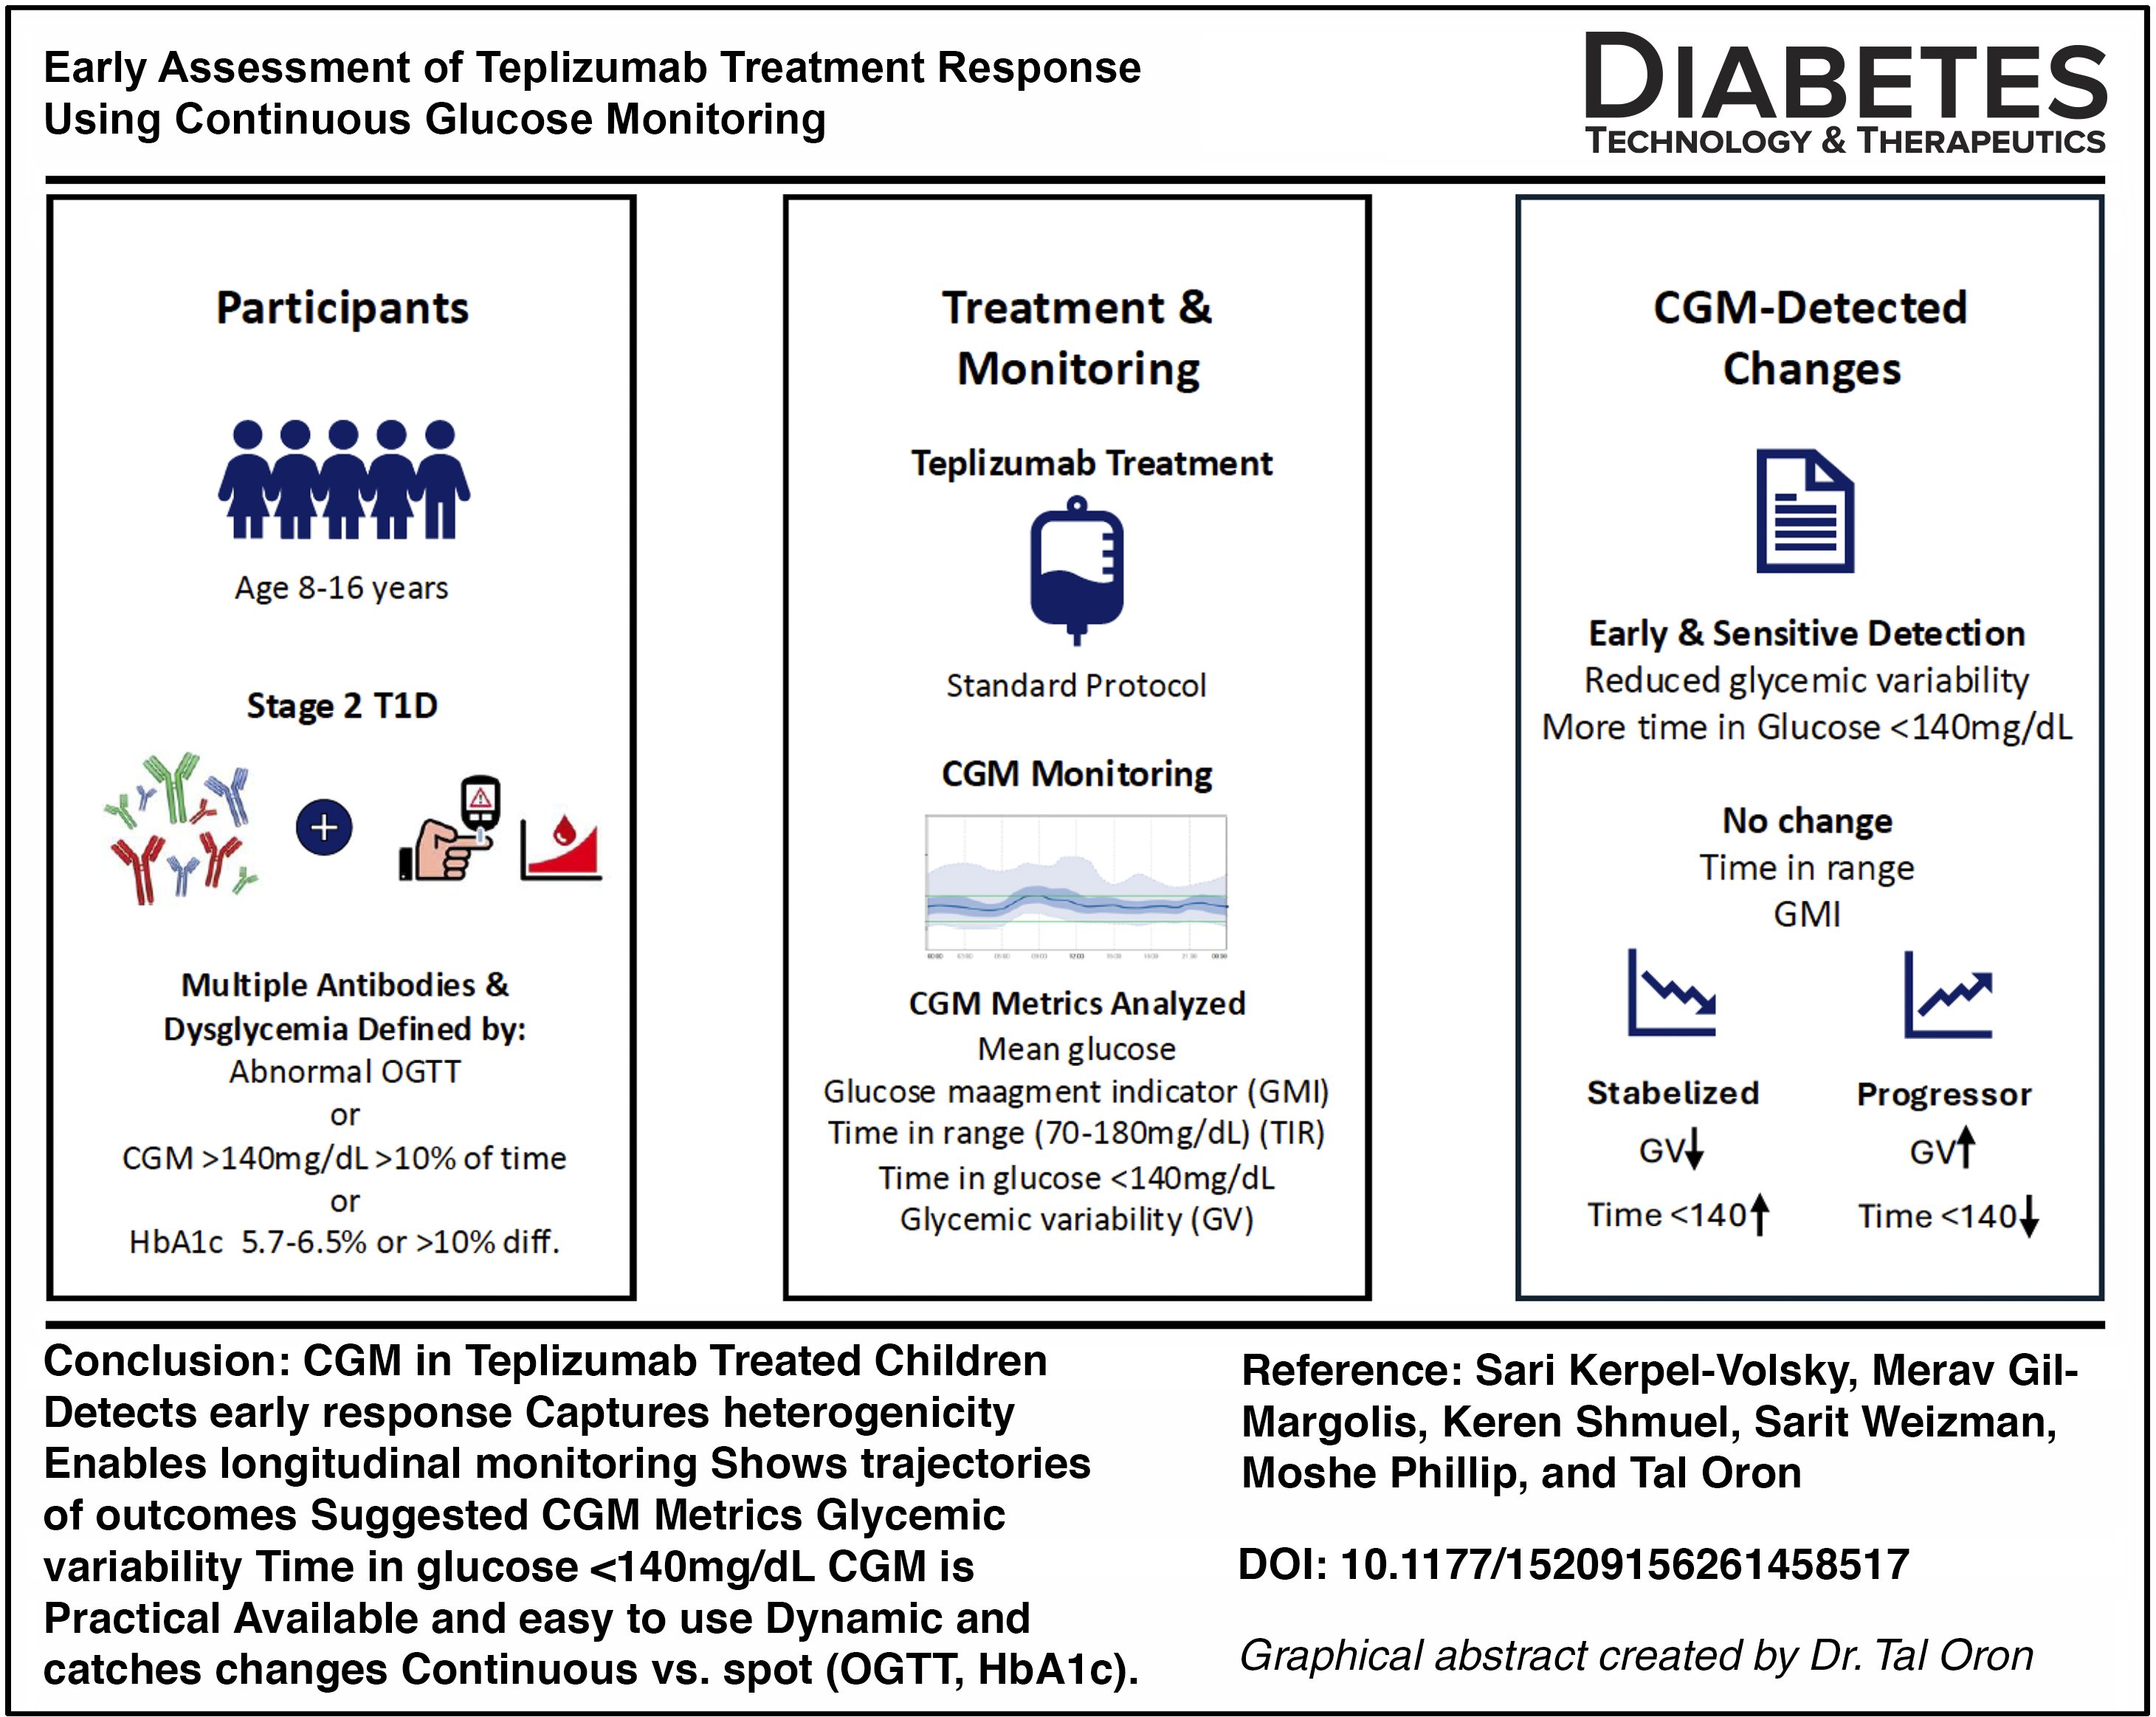
We describe continuous glucose monitoring (CGM) trajectories in five children with stage 2 type 1 diabetes treated with teplizumab in a real-world setting. Participants were followed longitudinally using CGM metrics, including glycemic variability (GV) and time above 140 mg/dL. Over 8–19 months of follow-up, four participants remained in stage 2, while one progressed to stage 3 diabetes within 4 months of treatment. CGM-derived metrics demonstrated heterogeneous trajectories. Most participants showed stabilization or improvement in GV and time above 140 mg/dL within 3–6 months, whereas the progressor exhibited increasing variability and worsening glycemic excursions over time. These changes were detectable early and were not paralleled by substantial changes in glycated hemoglobin. These observations suggest that CGM may capture early directional changes in glycemic dynamics following immunomodulatory therapy and may provide a practical approach for longitudinal monitoring. Findings should be interpreted as hypothesis-generating and require validation in larger cohorts.
Keywords
Introduction
Type 1 diabetes (T1D) is a chronic, progressive autoimmune disease that begins years before clinical presentation.1,2 Longitudinal natural-history studies have established a staging framework for T1D, in which stage 1 is defined by the presence of ≥2 islet autoantibodies with normoglycemia, stage 2 by ≥2 islet autoantibodies with dysglycemia, and stage 3 by hyperglycemia meeting American Diabetes Association diagnostic criteria for diabetes. Dysglycemia is defined by abnormalities in glucose metabolism, including impaired fasting glucose or impaired glucose tolerance, abnormal oral glucose tolerance test (OGTT) results, glycated hemoglobin (HbA1c) of 5.7%–6.5% (39–48 mmol/mol), a ≥10% longitudinal increase in HbA1c, or continuous glucose monitoring (CGM) metrics demonstrating >10% of time above 140 mg/dL (>7.8 mmol/L) over a 10-day monitoring period.3–6 Parallel advances in population-based screening have demonstrated that early-stage T1D can be identified reliably in both the general population and at-risk cohorts, with important clinical benefits, including reduced rates of diabetic ketoacidosis, lower HbA1c at diagnosis, and preservation of endogenous insulin secretion.7–10
However, early detection introduces a new clinical challenge: how to monitor individuals with stage 1 and stage 2 disease, particularly in the context of emerging disease-modifying therapies. Traditional monitoring strategies, including OGTT and intermittent laboratory measurements of glucose and HbA1c, are burdensome, poorly scalable, and limited in their ability to capture dynamic glycemic changes. OGTT-based classifications, while central to staging, may fail to fully reflect the continuous and heterogeneous progression of dysglycemia, particularly during the transition from stage 2 to stage 3 disease. 11 In contrast, CGM provides a minimally invasive, high-resolution assessment of glucose dynamics and has been shown to detect early dysglycemia, improve risk stratification, and predict progression beyond OGTT-defined categories.12,13 These limitations become more pronounced when repeated assessments are required to evaluate disease progression or treatment response.
The recent introduction of teplizumab, an immune-modulating therapy shown to delay progression to clinical T1D, further highlights the need for sensitive and practical tools to monitor early metabolic changes. 14 While preservation of β-cell function can be assessed using stimulated C-peptide, the proinsulin-to-C-peptide ratio, and other emerging biological markers of β-cell stress, this approach is not well suited for frequent clinical longitudinal follow-up and may fail to detect subtle early changes in glycemic regulation.15–17 Thus, there is a critical unmet need for sensitive, scalable tools to capture subtle metabolic changes following immunomodulatory therapy. CGM-derived metrics offer a high-resolution, patient-friendly approach to assessing glucose dynamics in real time.5,18,19
In this report, we describe a real-world series of children with stage 2 T1D treated with teplizumab and followed longitudinally using CGM. We focus on individual CGM trajectories to explore potential early changes in glycemic dynamics following immune-modulating therapy and to illustrate the possible role of CGM in longitudinal clinical follow-up.
Methods
Study design and participants
This study describes real-world observations of children aged 8–16 years with stage 2 T1D treated with teplizumab at a single tertiary pediatric center.
Stage 2 T1D was diagnosed according to established consensus criteria by OGTT in four participants and by CGM in one when OGTT was not available.4,5 Baseline C-peptide levels were obtained under random, nonfasting conditions as part of routine clinical care. Serial C-peptide measurements were not systematically performed during follow-up, as they are not part of routine longitudinal monitoring in this setting.
Treatment protocol
All participants received teplizumab according to the standard clinical protocol. 20 Premedication was administered before infusion and included a nonsteroidal anti-inflammatory drug (ibuprofen), an antiemetic agent (ondansetron), and an antihistamine (loratadine). All patients completed the full course of treatment.
CGM monitoring and outcomes
Participants were monitored longitudinally using the Dexcom G7 (Dexcom, Inc., San Diego, CA, USA) or FreeStyle Libre (Abbott Diabetes Care, Alameda, CA, USA) CGM systems as part of routine clinical care. Four participants had CGM data available prior to treatment initiation and throughout follow-up, while one participant initiated CGM monitoring after treatment onset. CGM data were collected at baseline (pretreatment) and at multiple posttreatment time points, including early follow-up (approximately 3–5 months), intermediate follow-up (6–8 months), and longer-term follow-up (up to 12–19 months). CGM-derived metrics were calculated using data from the 30 days preceding each assessment time point. The following CGM-derived metrics were analyzed: mean glucose; glucose management indicator (GMI); time in range (TIR; glucose 70–180 mg/dL); time below/above glucose 140 mg/dL [including time in tight range (TITR; glucose 70–140 mg/dL), and time below range (glucose <70 mg/dL)]; glycemic variability (GV), defined as the coefficient of variation of sensor glucose values, calculated as the standard deviation divided by the mean glucose and expressed as a percentage.
Statistical analysis
Given the small sample size, analyses were primarily descriptive. Continuous variables are presented as individual values and, where appropriate, as medians. Longitudinal changes in CGM-derived metrics are described at the individual level and summarized using median trends across participants who remained in stage 2. No formal statistical hypothesis testing was performed. The institutional review board approved the study. Given the retrospective, observational nature of the study and the use of deidentified clinical data, the requirement for informed consent was waived.
Results
Five children were treated with teplizumab and followed longitudinally. Baseline characteristics, including clinical, immunological, and metabolic data at diagnosis before teplizumab treatment, are presented in Table 1. At baseline, HbA1c ranged from 5.4% to 6.1%. C-peptide levels ranged from 0.70 to 3.27 ng/mL, consistent with preserved β-cell function in stage 2 disease.
Baseline Characteristics of the Children Treated with Teplizumab with Stage 2 Type 1 Diabetes and Longitudinal Continuous Glucose Monitoring Metrics and Glycemic Parameters Before and After Treatment
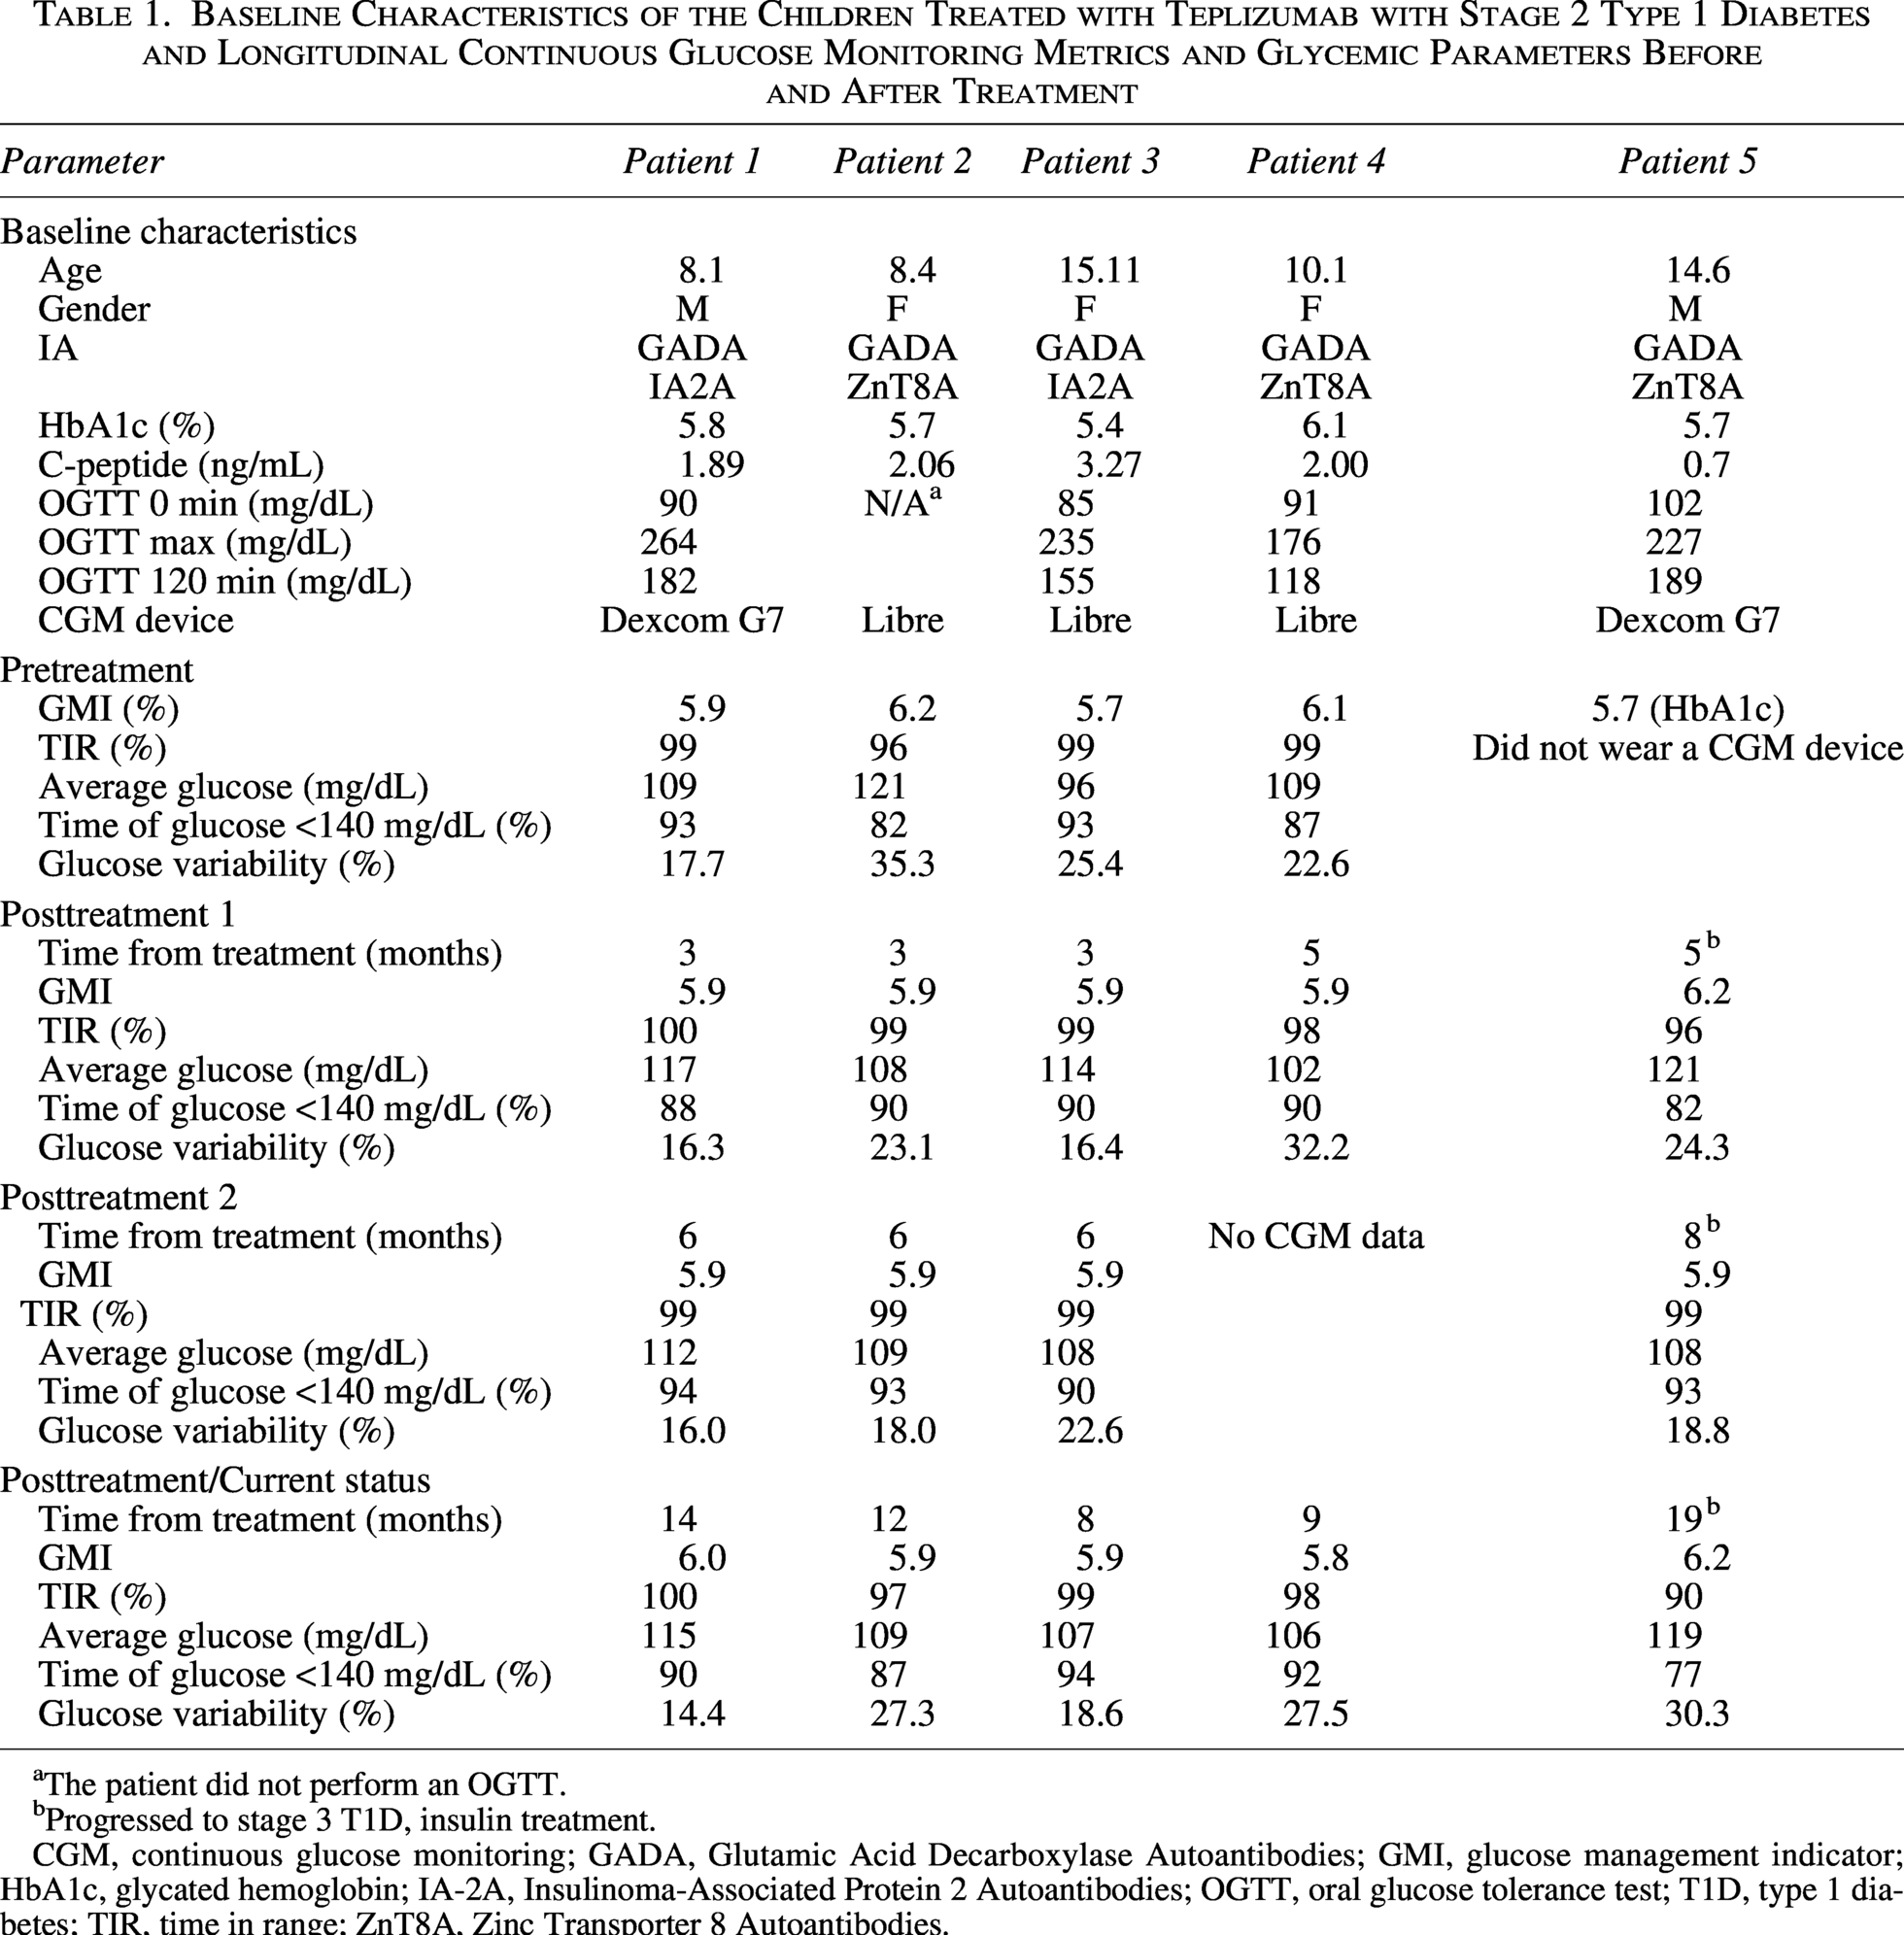
The patient did not perform an OGTT.
Progressed to stage 3 T1D, insulin treatment.
CGM, continuous glucose monitoring; GADA, Glutamic Acid Decarboxylase Autoantibodies; GMI, glucose management indicator; HbA1c, glycated hemoglobin; IA-2A, Insulinoma-Associated Protein 2 Autoantibodies; OGTT, oral glucose tolerance test; T1D, type 1 diabetes; TIR, time in range; ZnT8A, Zinc Transporter 8 Autoantibodies.
During follow-up, one participant progressed to stage 3 T1D approximately 4 months after treatment initiation. This participant had the lowest baseline C-peptide level in the cohort (0.70 ng/mL). The remaining four participants did not develop clinical diabetes over a follow-up period ranging from 9 to 14 months.
Changes in CGM-derived metrics following teplizumab treatment are summarized in Table 1. Individual longitudinal trajectories of time above 140 mg/dL and GV are presented in Figure 1.
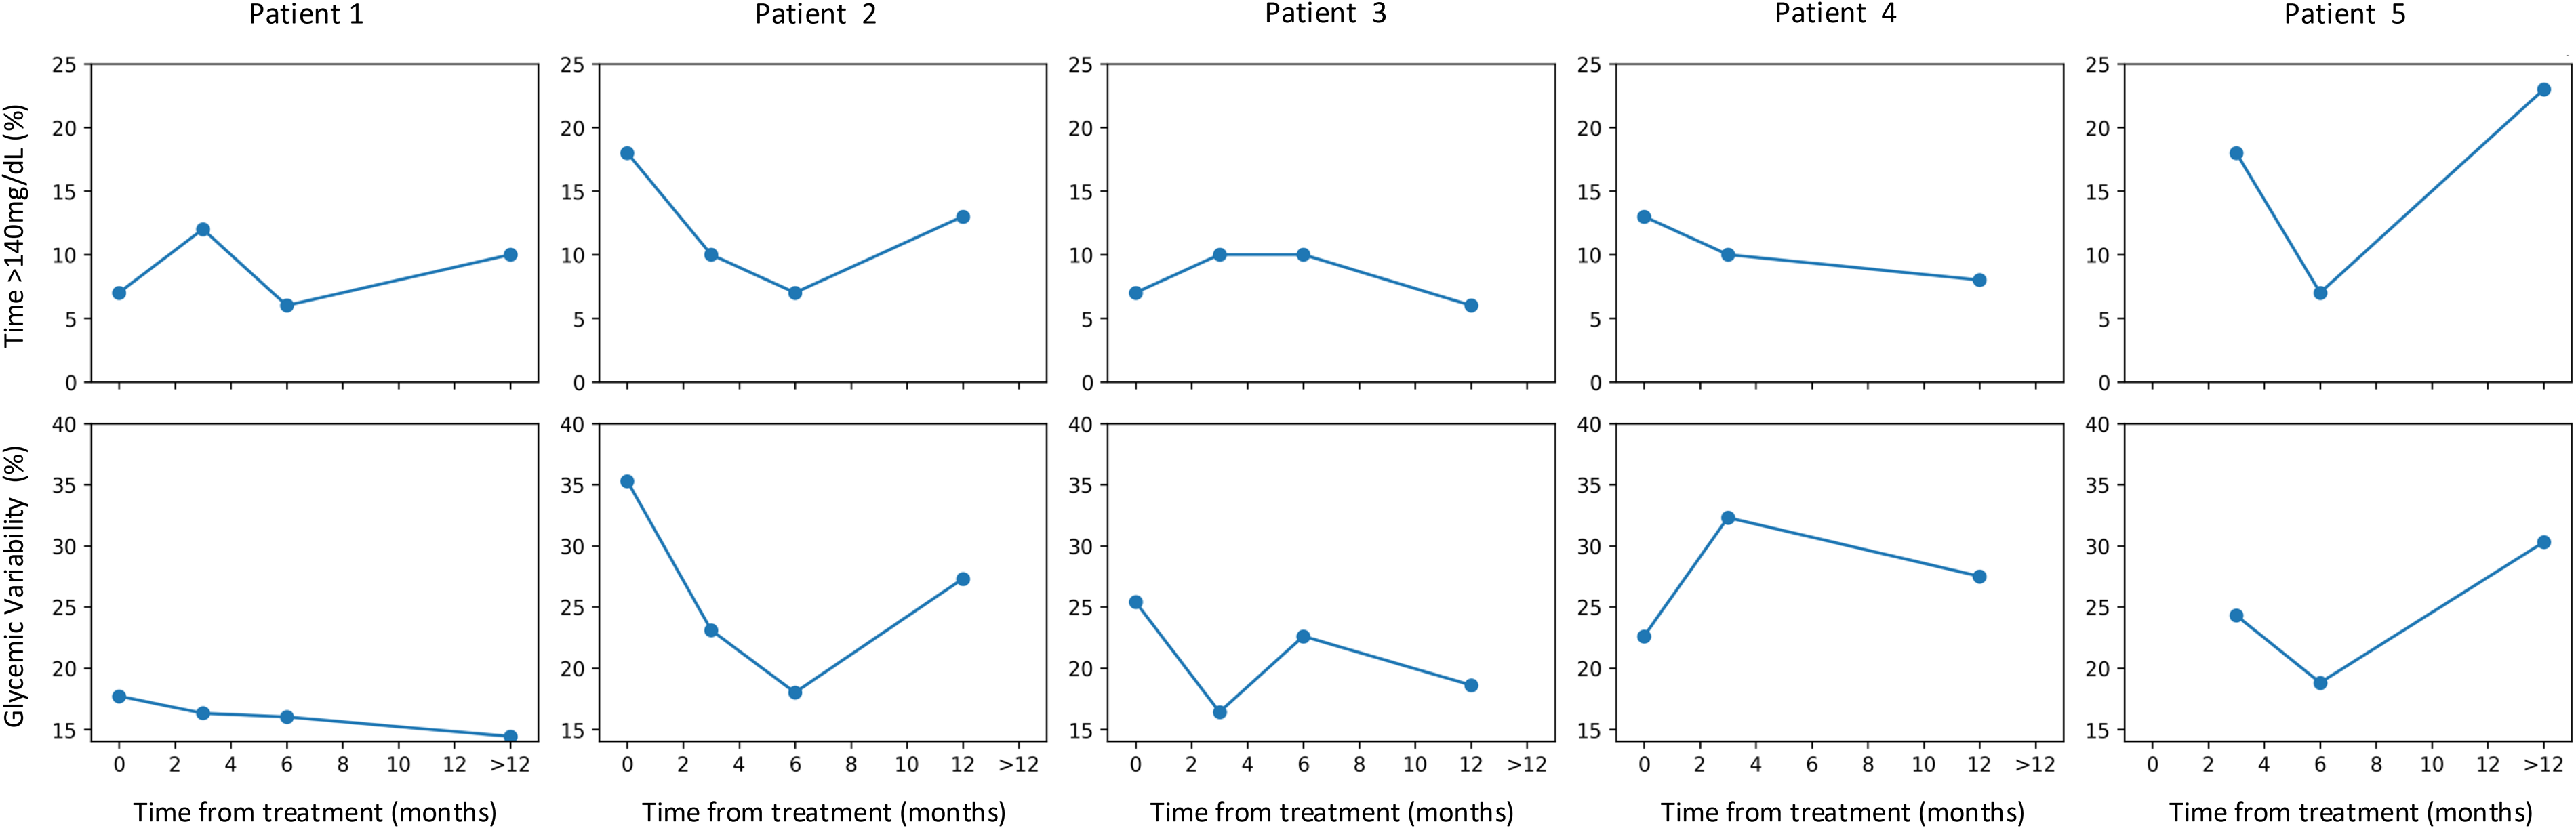
Individual CGM trajectories following teplizumab treatment. Time above 140 mg/dL (upper panels) and glycemic variability (lower panels) are shown longitudinally for each participant. Follow-up beyond 12 months was grouped into a single time point (>12 months). Patient 5 progressed to stage 3 type 1 diabetes during follow-up.
TIR (70–180 mg/dL) and mean glucose levels remained largely unchanged throughout follow-up. Time <140 mg/dL showed heterogeneous individual responses, increasing in three of the four patients who remained in stage 2, demonstrating relative stability at the group level. GV decreased in three of the four patients who remained in stage 2, with the most pronounced reduction observed in the participant with the highest baseline variability (from 35.3%–23.1% at 3 months and to 18.0% at 6 months).
The participant who progressed to stage 3 T1D demonstrated a distinct CGM trajectory, characterized by higher GV and reduced TITR during follow-up compared with the other participants.
Discussion
In this real-world observation of children with stage 2 T1D treated with teplizumab, we demonstrate that CGM captures early and clinically meaningful changes in glycemic dynamics that are not reflected by conventional measures. While HbA1c (reflected by GMI) remained within a narrow range, CGM-derived metrics, particularly GV and time below 140 mg/dL, revealed distinct, patient-specific trajectories following treatment.
Real-world data on teplizumab use in stage 2 T1D are emerging but remain limited. Prior reports have focused on safety, patient experience, and conventional metabolic outcomes, including protocol-driven studies in younger children and survey-based assessments of treatment experience.21,22 A recent pivotal real-world cohort integrating metabolic and immunological data demonstrated early improvements in OGTT, HbA1c, and CGM-derived measures of hyperglycemia burden, particularly time above 140 mg/dL. In these studies, CGM has primarily been used to quantify overall glycemic exposure. 23 Our observations emphasize individual CGM trajectories and GV, which may provide complementary insight into early changes in glycemic dynamics following immunomodulatory therapy.
Most of the participants in our series exhibited stabilization or improvement in GV within the first 3–6 months following treatment, with sustained patterns during follow-up. In contrast, one participant progressed to stage 3 T1D and demonstrated a clearly divergent CGM trajectory, characterized by increasing variability and rising time above 140 mg/dL. Notably, this participant had the lowest baseline C-peptide level, suggesting more advanced β-cell dysfunction. Although limited by sample size, this pattern supports the concept that CGM may identify individuals at higher risk of progression despite immunomodulatory therapy.
The changes observed in CGM metrics were detectable early after treatment initiation. This temporal sensitivity highlights a potential advantage of CGM over traditional tools such as the OGTT, which provides only intermittent, static assessments and is less feasible for repeated monitoring in clinical practice.11–13,15
Our findings are consistent with emerging evidence supporting the role of CGM in early-stage T1D. Recent studies have shown that CGM metrics can identify early dysglycemia and track progression in islet autoantibody-positive individuals, even before clinical onset.11–13,23,24 These observations reinforce the concept that CGM captures dynamic metabolic changes that are not fully reflected by conventional staging tools. In this context, our data extend these findings by suggesting that CGM may also be informative in monitoring response to immunomodulatory therapy.
The use of CGM in this setting aligns with recent consensus recommendations emphasizing its role in monitoring individuals with stage 2 T1D.5,19 Beyond its practicality and patient acceptability, CGM provides high-resolution data that allow characterization of GV and subtle excursions, potentially serving as early markers of β-cell stress or recovery. The ability to distinguish between stable, improving, and deteriorating trajectories, as illustrated in our cohort, suggests that CGM could complement and reduce reliance on OGTT in longitudinal follow-up or even replace it completely.
As additional disease-modifying therapies emerge, there will be an increasing need to guide longitudinal management and determine whether further intervention is warranted. A range of immunomodulatory strategies, including T-cell-targeted therapies, B-cell depletion, costimulation blockade, and cytokine-directed approaches, are under active investigation and have demonstrated the potential to preserve β-cell function at different stages of disease.25,26 In this evolving therapeutic landscape, CGM offers a feasible and high-resolution approach to monitoring, enabling continuous assessment of glycemic trajectories in real-world settings. By capturing early changes in glycemic stability, CGM may help identify individuals who are responding to therapy versus those showing early signs of deterioration, thereby supporting more informed and timely treatment decisions.
This observational study has several limitations. The sample size is small, and findings should be interpreted as exploratory or hypothesis-generating. The observational design without a control group limits causal inference regarding the effects of teplizumab. In addition, OGTT was not performed in all participants or conducted serially, limiting the assessment of glucose tolerance and comparison with CGM-derived metrics, while C-peptide measurements were not systematically repeated during follow-up, limiting assessment of longitudinal β-cell function. Furthermore, follow-up duration was relatively limited, and longer-term data will be required to determine the durability of the observed metabolic patterns and their relationship to clinical outcomes. Nevertheless, the study’s strength lies in the detailed longitudinal CGM data, which enable high-resolution assessment of metabolic trajectories following treatment.
In conclusion, our observations suggest that CGM may provide a useful view of glycemic patterns in children with stage 2 T1D treated with teplizumab. CGM-derived metrics, particularly GV and time above 140 mg/dL, may offer sensitive indicators of early changes in glycemic dynamics during follow-up. These results should be considered hypothesis-generating, and further studies in larger cohorts are needed to better define the role of CGM as a monitoring tool in this setting.
Authors' Contributions
T.O., S.K.V., and M.G.M. conceived and designed the study, participated in manuscript writing, and critically reviewed the manuscript. K.S.Z., S.W., and M.P. critically reviewed the manuscript. All authors approved the final version of the manuscript and agree to be accountable for the content of the work.
Author Disclosure Statement
The authors declare that there is no conflict of interest regarding the publication of this article.
Footnotes
Funding Information
This research received no specific grant from public, commercial, or not-for-profit funding agencies.