
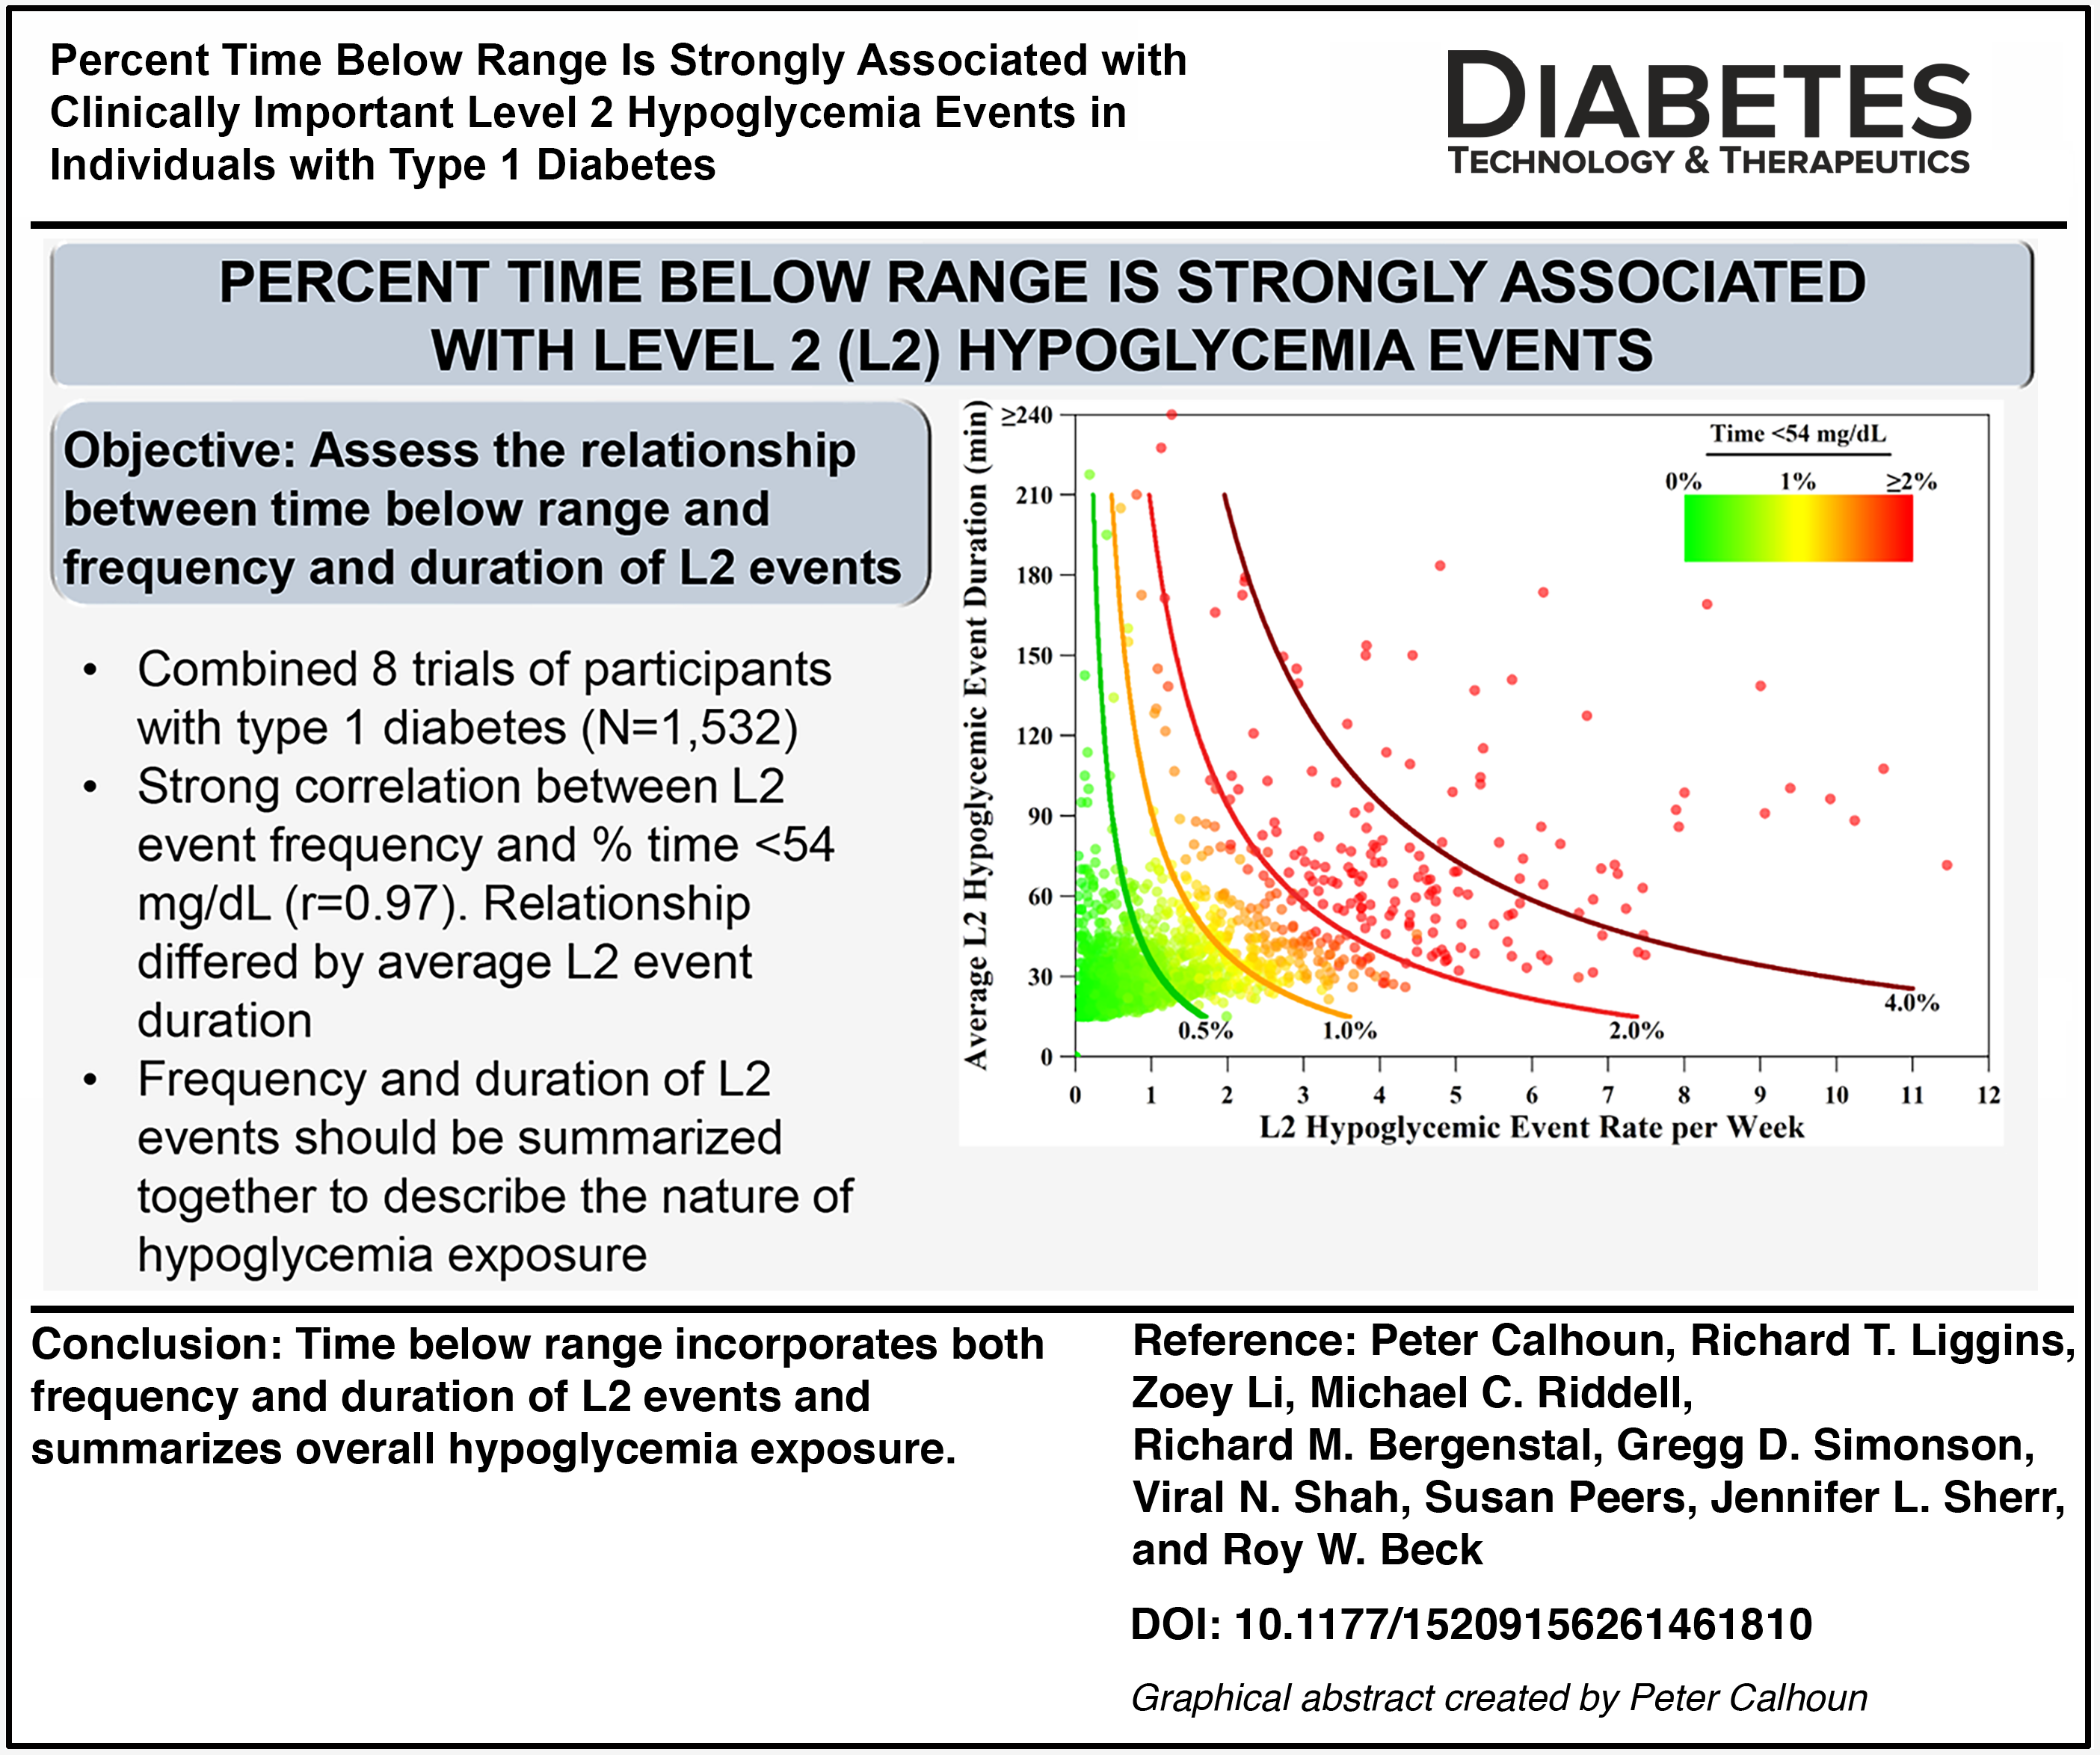
Abstract
Objective:
To evaluate the relationship between continuous glucose monitoring (CGM)-measured % time <54 mg/dL (%T < 54) and level 2 hypoglycemic events (L2 events; ≥15 min <54 mg/dL) in individuals with type 1 diabetes (T1D).
Methods:
These analyses examined the associations between CGM-measured %T < 54 and L2 events from eight clinical trials over 3–6 months in participants with T1D.
Results:
Data from 1532 participants with T1D were analyzed (mean age 37 ± 21 years; 72% adults): 43% using automated insulin delivery (AID), 43% CGM users not using AID (34% multiple daily injections [MDI]; 66% standard pump), and 14% self-monitoring blood glucose (SMBG) users not using CGM (58% MDI; 42% standard pump). There was a strong correlation between %T < 54 and L2 event rate (r = 0.97), but the relationship differed by the average duration of L2 events. For those with 1% T < 54, the predicted L2 event rate per week was 2.4 events for those with short L2 events (average <30 min), 1.9 events for those with medium duration of L2 events (average 30–60 min), and 1.2 events for those with long L2 events (average >60 min). Those meeting hypoglycemic targets (<1% T < 54) had on average 0.6 L2 events per week, irrespective of technology use. Those not meeting targets (≥1% T < 54) had on average 2.9 L2 events per week, but this differed based on technology use and observed %T < 54.
Conclusions:
L2 event frequency and %T < 54 are strongly correlated, but the relationship differs by L2 event duration. Therefore, both frequency and duration of L2 events should be reported together. Time-below-range metrics incorporate both aspects and are core CGM endpoints that summarize overall amount of hypoglycemia exposure.
Keywords
Introduction
Hypoglycemia is a common problem for individuals with type 1 diabetes (T1D). Standards of care 1 and consensus guidelines 2 recommend using continuous glucose monitoring (CGM) and using time spent with glucose <54 mg/dL (%T < 54) and <70 mg/dL (%T < 70) for clinical care and treatment evaluation, with goals for most adults with diabetes being <1% and <4% time, respectively. Indeed, the ambulatory glucose profile (AGP), which is a standardized report for CGM data visualization, highlights these metrics. Despite the benefits of this approach and the ability to capture hypoglycemia exposure, it may be more clinically important to consider CGM-measured level 2 (L2) hypoglycemic events, defined as ≥15 consecutive minutes with a CGM value <54 mg/dL. 3
The burden of experiencing hypoglycemia symptoms and their associated impact on quality of life, including responding to symptoms and CGM alarms, as well as the fear associated with potential future severe hypoglycemia (SH) events, is likely more influenced by hypoglycemic event rates than a percentage of time below range, although the two metrics may indeed be linked.4–7 An individual’s preference for avoiding hypoglycemia may also be driven by a desire to reduce the number of hypoglycemia events experienced, 8 and hypoglycemia events are important for clinical management as recommended by standards of care. 1 Supporting the notion of importance of L2 hypoglycemia events, the recent draft guidance from the U.S. Food and Drug Administration (FDA) 9 suggests that a composite primary endpoint incorporating the incidences of both L2 hypoglycemia events (defined as blood glucose levels <54 mg/dL) and SH episodes, defined as severely altered mental and/or physical functioning requiring the assistance of another person, may be used to assess hypoglycemia exposure with drug treatments.
While CGM-measured %T < 54 and L2 event rate are intuitively understood to be closely related, it is unknown which factors may influence this relationship. The duration of L2 hypoglycemic events is rarely reported, yet this would naturally complement the frequency of L2 hypoglycemic events. Understanding how long L2 events last can improve clinical care by finding treatment options to minimize their duration.
The purpose of this article was to better understand the relationship between time-below-range metrics, frequency of L2 events, and duration of L2 events and to assess the frequency and duration of L2 events and SH event rate for those meeting and not meeting time-below-range clinical targets.
Methods
This analysis utilizes data from eight different randomized controlled trials that ran from 2014 to 2021 and includes participants with T1D using various insulin delivery modalities and glucose monitoring technologies (Table 1). Glucose was measured by CGM in either blinded or unblinded mode, and up to 6 months of follow-up, CGM data and SH events were collected from each study.
Study and Cohort Characteristics
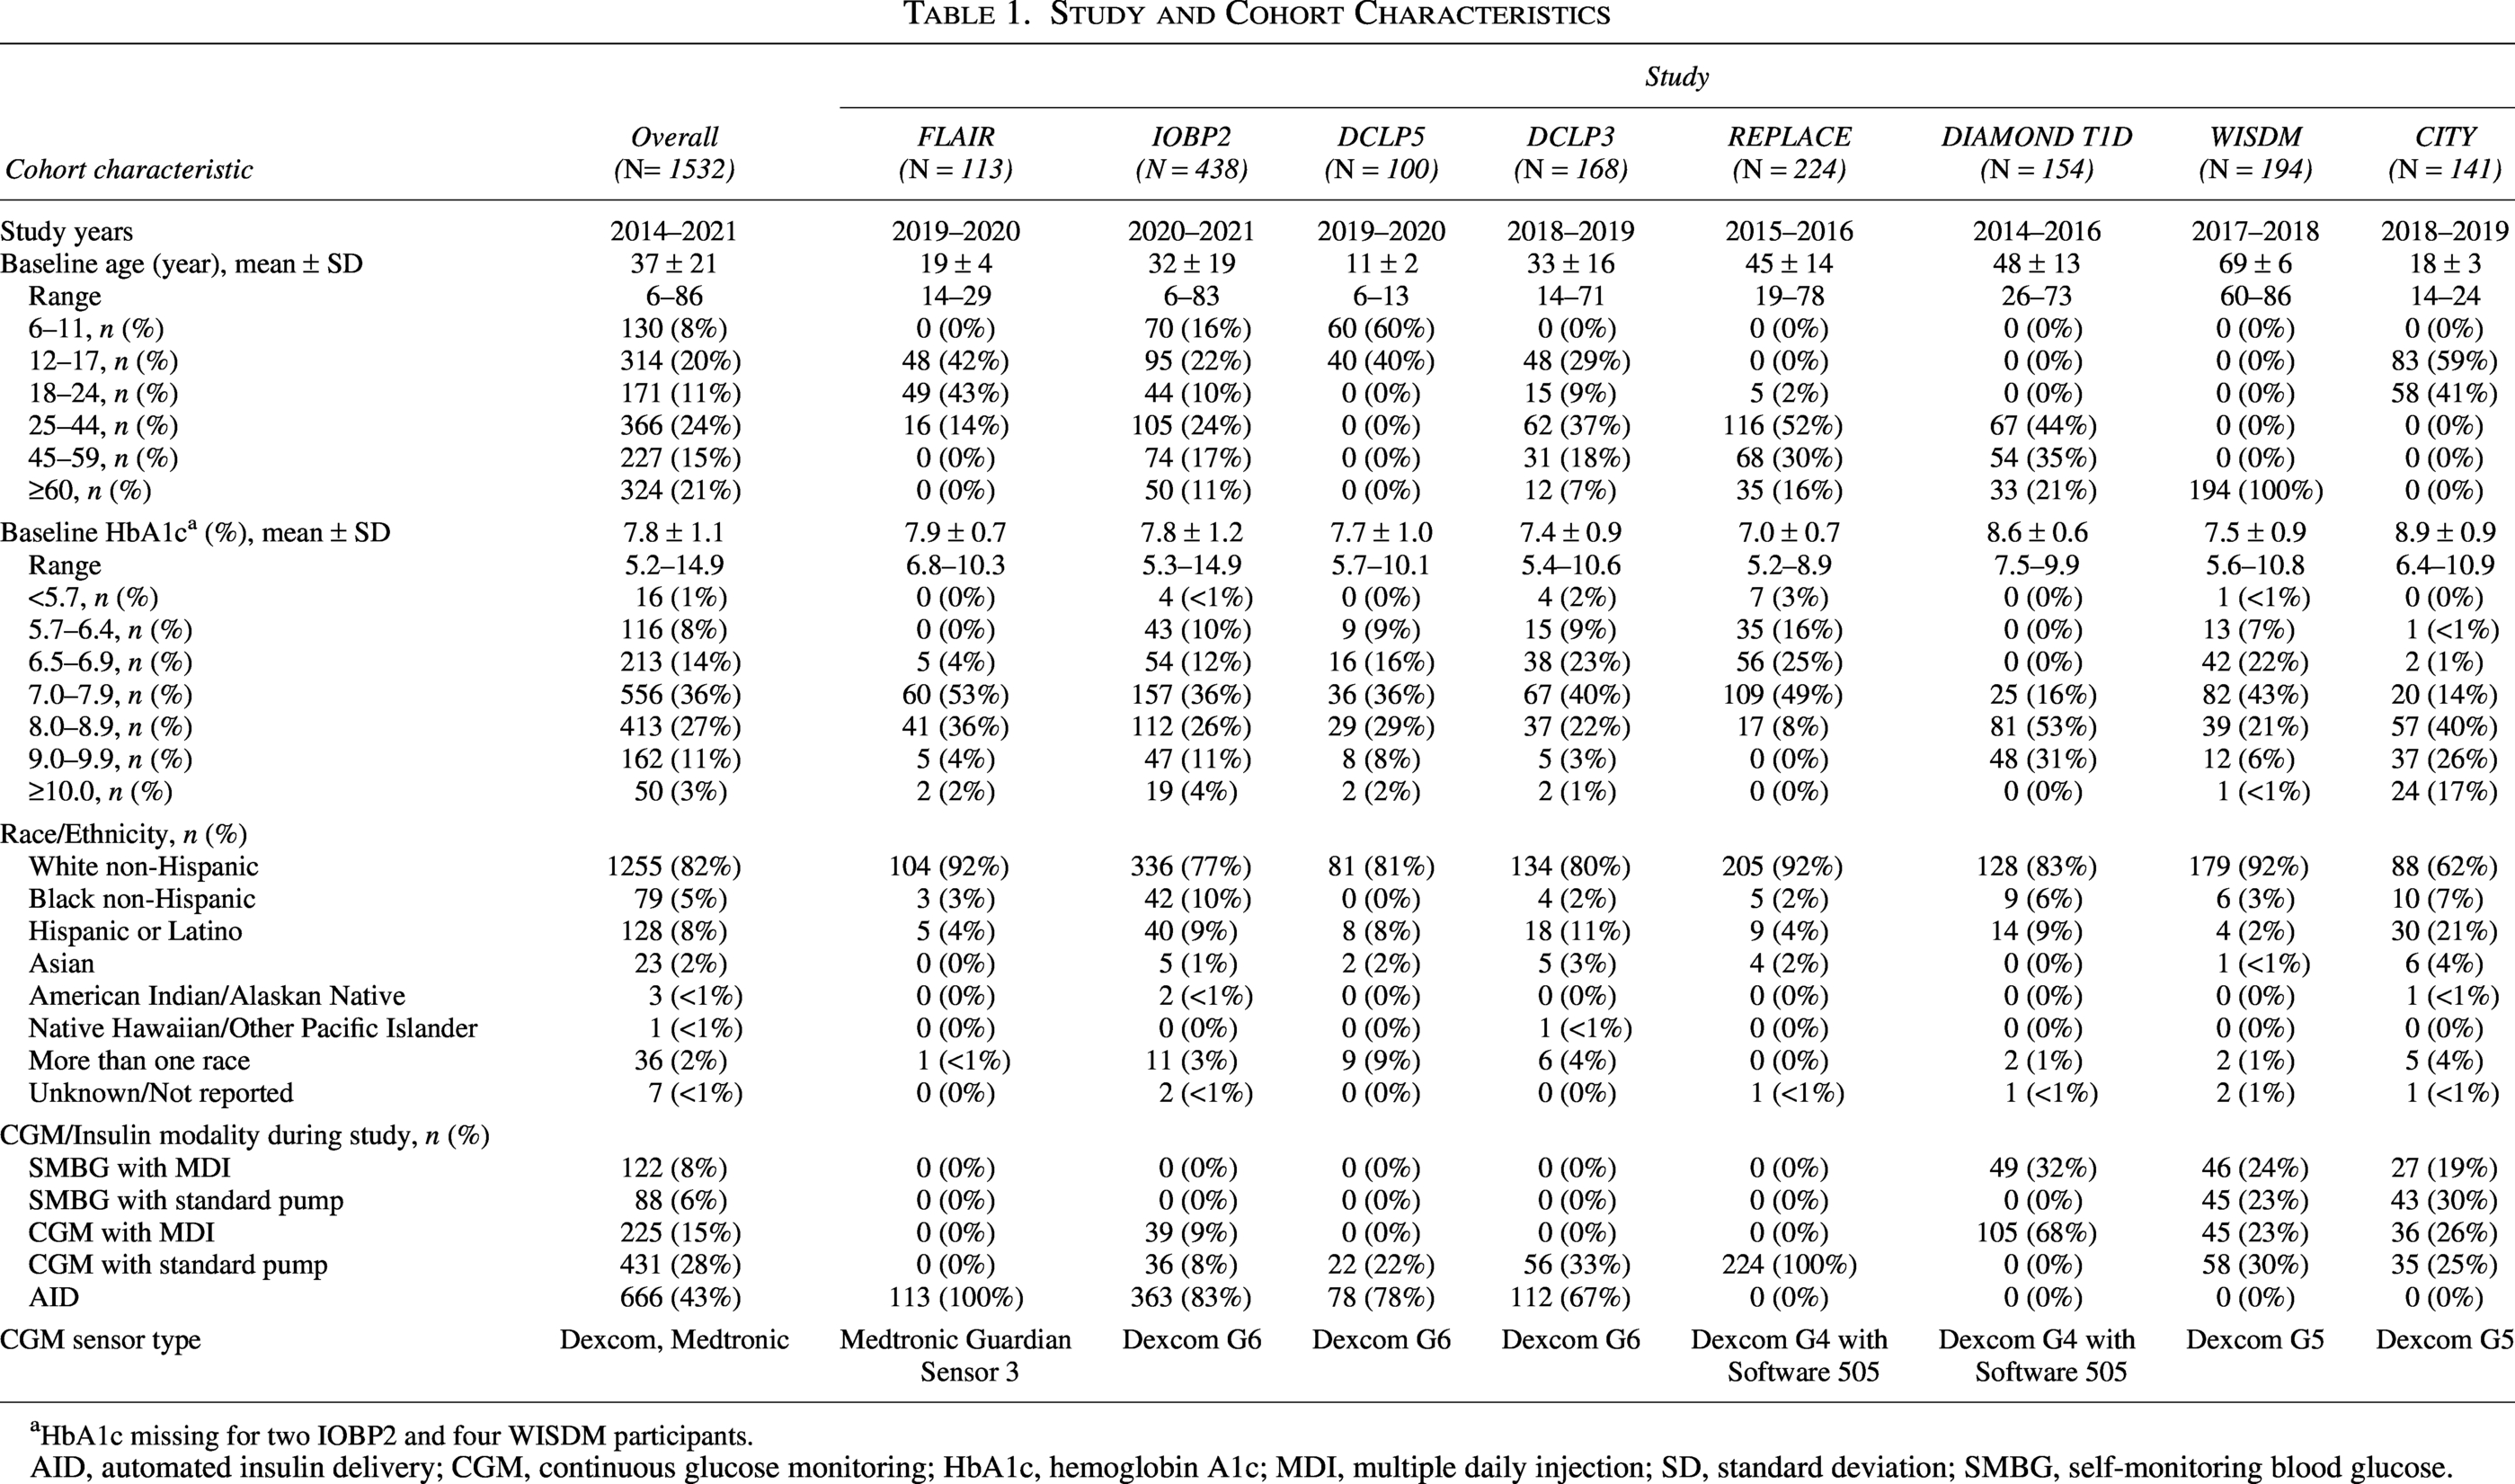
HbA1c missing for two IOBP2 and four WISDM participants.
AID, automated insulin delivery; CGM, continuous glucose monitoring; HbA1c, hemoglobin A1c; MDI, multiple daily injection; SD, standard deviation; SMBG, self-monitoring blood glucose.
Participants were grouped into three categories on the basis of their insulin delivery modality and technology use: (1) self-monitoring blood glucose (SMBG) without use of real-time CGM with multiple daily injections (MDI) or standard insulin pump, (2) real-time CGM with MDI or nonautomated pump, or (3) automated insulin delivery (AID) system. SMBG users wore a blinded CGM intermittently throughout their specific study follow-up. SH events were restricted to days with CGM available to adequately assess the relationship between CGM metrics and SH events during the same time frame.
Statistical Methods
For each participant with at least 240 h (10 days) of follow-up CGM data, %T < 54, L2 event rate per week, and average L2 event duration were calculated. An L2 hypoglycemic event was defined as ≥15 consecutive minutes <54 mg/dL. The event ended when there were ≥15 consecutive minutes ≥70 mg/dL, at which point the participant became eligible for another L2 hypoglycemic event. The L2 hypoglycemic event duration was defined as the % time <54 mg/dL during the event (see Supplementary Fig. S1). Further details of the L2 hypoglycemic event definitions are explained in Supplemental Material.
The relationships among %T < 54, frequency of L2 events, and duration of L2 events were summarized. Spearman correlations among the CGM-measured hypoglycemic metrics were assessed. The probability of having ≥1, ≥2, and ≥3 L2 events per week based on %T < 54 was estimated from a logistic regression model. Additionally, the probability of having ≥1 L2 event lasting ≥60 min and ≥120 min per week based on %T < 54 was estimated from a logistic regression model. A smoothing spline was used to estimate the frequency of L2 events based on the %T < 54, allowing for nonlinear relationships. A linear regression line was fitted to estimate the %T < 54 based on the frequency and duration of L2 events with an interaction term.
Differences in frequency of L2 events and duration of L2 events between those meeting versus not meeting the %T < 54 target were assessed using linear regression models adjusting for age and technology use as fixed effects with a compound symmetry covariance structure. Differences in SH incidence rate between those meeting and not meeting the %T < 54 target were assessed using a similar Poisson model. The difference in median %T < 54 by technology use was assessed using a linear regression model adjusting for age as a fixed effect and study as a random effect. Due to skewness, CGM-measured hypoglycemic metrics were transformed using van der Waerden rank-based transformations.
Cohort characteristics were summarized by mean ± standard deviation (SD). Frequency statistics were reported as count and percent of total, and hypoglycemia metrics were summarized by median and interquartile range (IQR). SH event rates were summarized as incidence rate per 100 person-years. Analyses were performed with SAS software, version 9.4 (SAS Institute).
Results
A total of 1532 participants with T1D from eight studies were included in the analysis (Table 1).10–18 The mean ± SD age was 37 ± 21 years (28% pediatric participants <18 years), and mean baseline glycated hemoglobin A1c was 7.8 ± 1.1%. The overall cohort was 82% White non-Hispanic. Dexcom CGMs were used in seven out of the eight clinical studies (G4 with software 505, G5, or G6); a Medtronic Guardian Sensor 3 was used in one study. Technology use included 43% using CGM with an AID system, 43% using CGM without AID (34% MDI and 66% standard pump), and 14% using SMBG without real-time CGM (58% MDI and 42% standard pump). Participants using AID, CGM without AID, and SMBG had a median of 87, 136, and 18 days of CGM data, respectively. As noted above, those using SMBG had fewer days of CGM data because a blinded CGM was only worn intermittently in the associated clinical studies.10–18
There was a strong correlation between L2 event rates and %T < 54 overall (r = 0.97), but the relationship differed by L2 event duration (Fig. 1). For those with 1% T < 54, the predicted L2 event rate per week was 2.4 events for those with short L2 events (average duration <30 min), 1.9 events for those with medium duration of L2 events (30–60 min), and 1.2 events for those with long L2 events (>60 min).
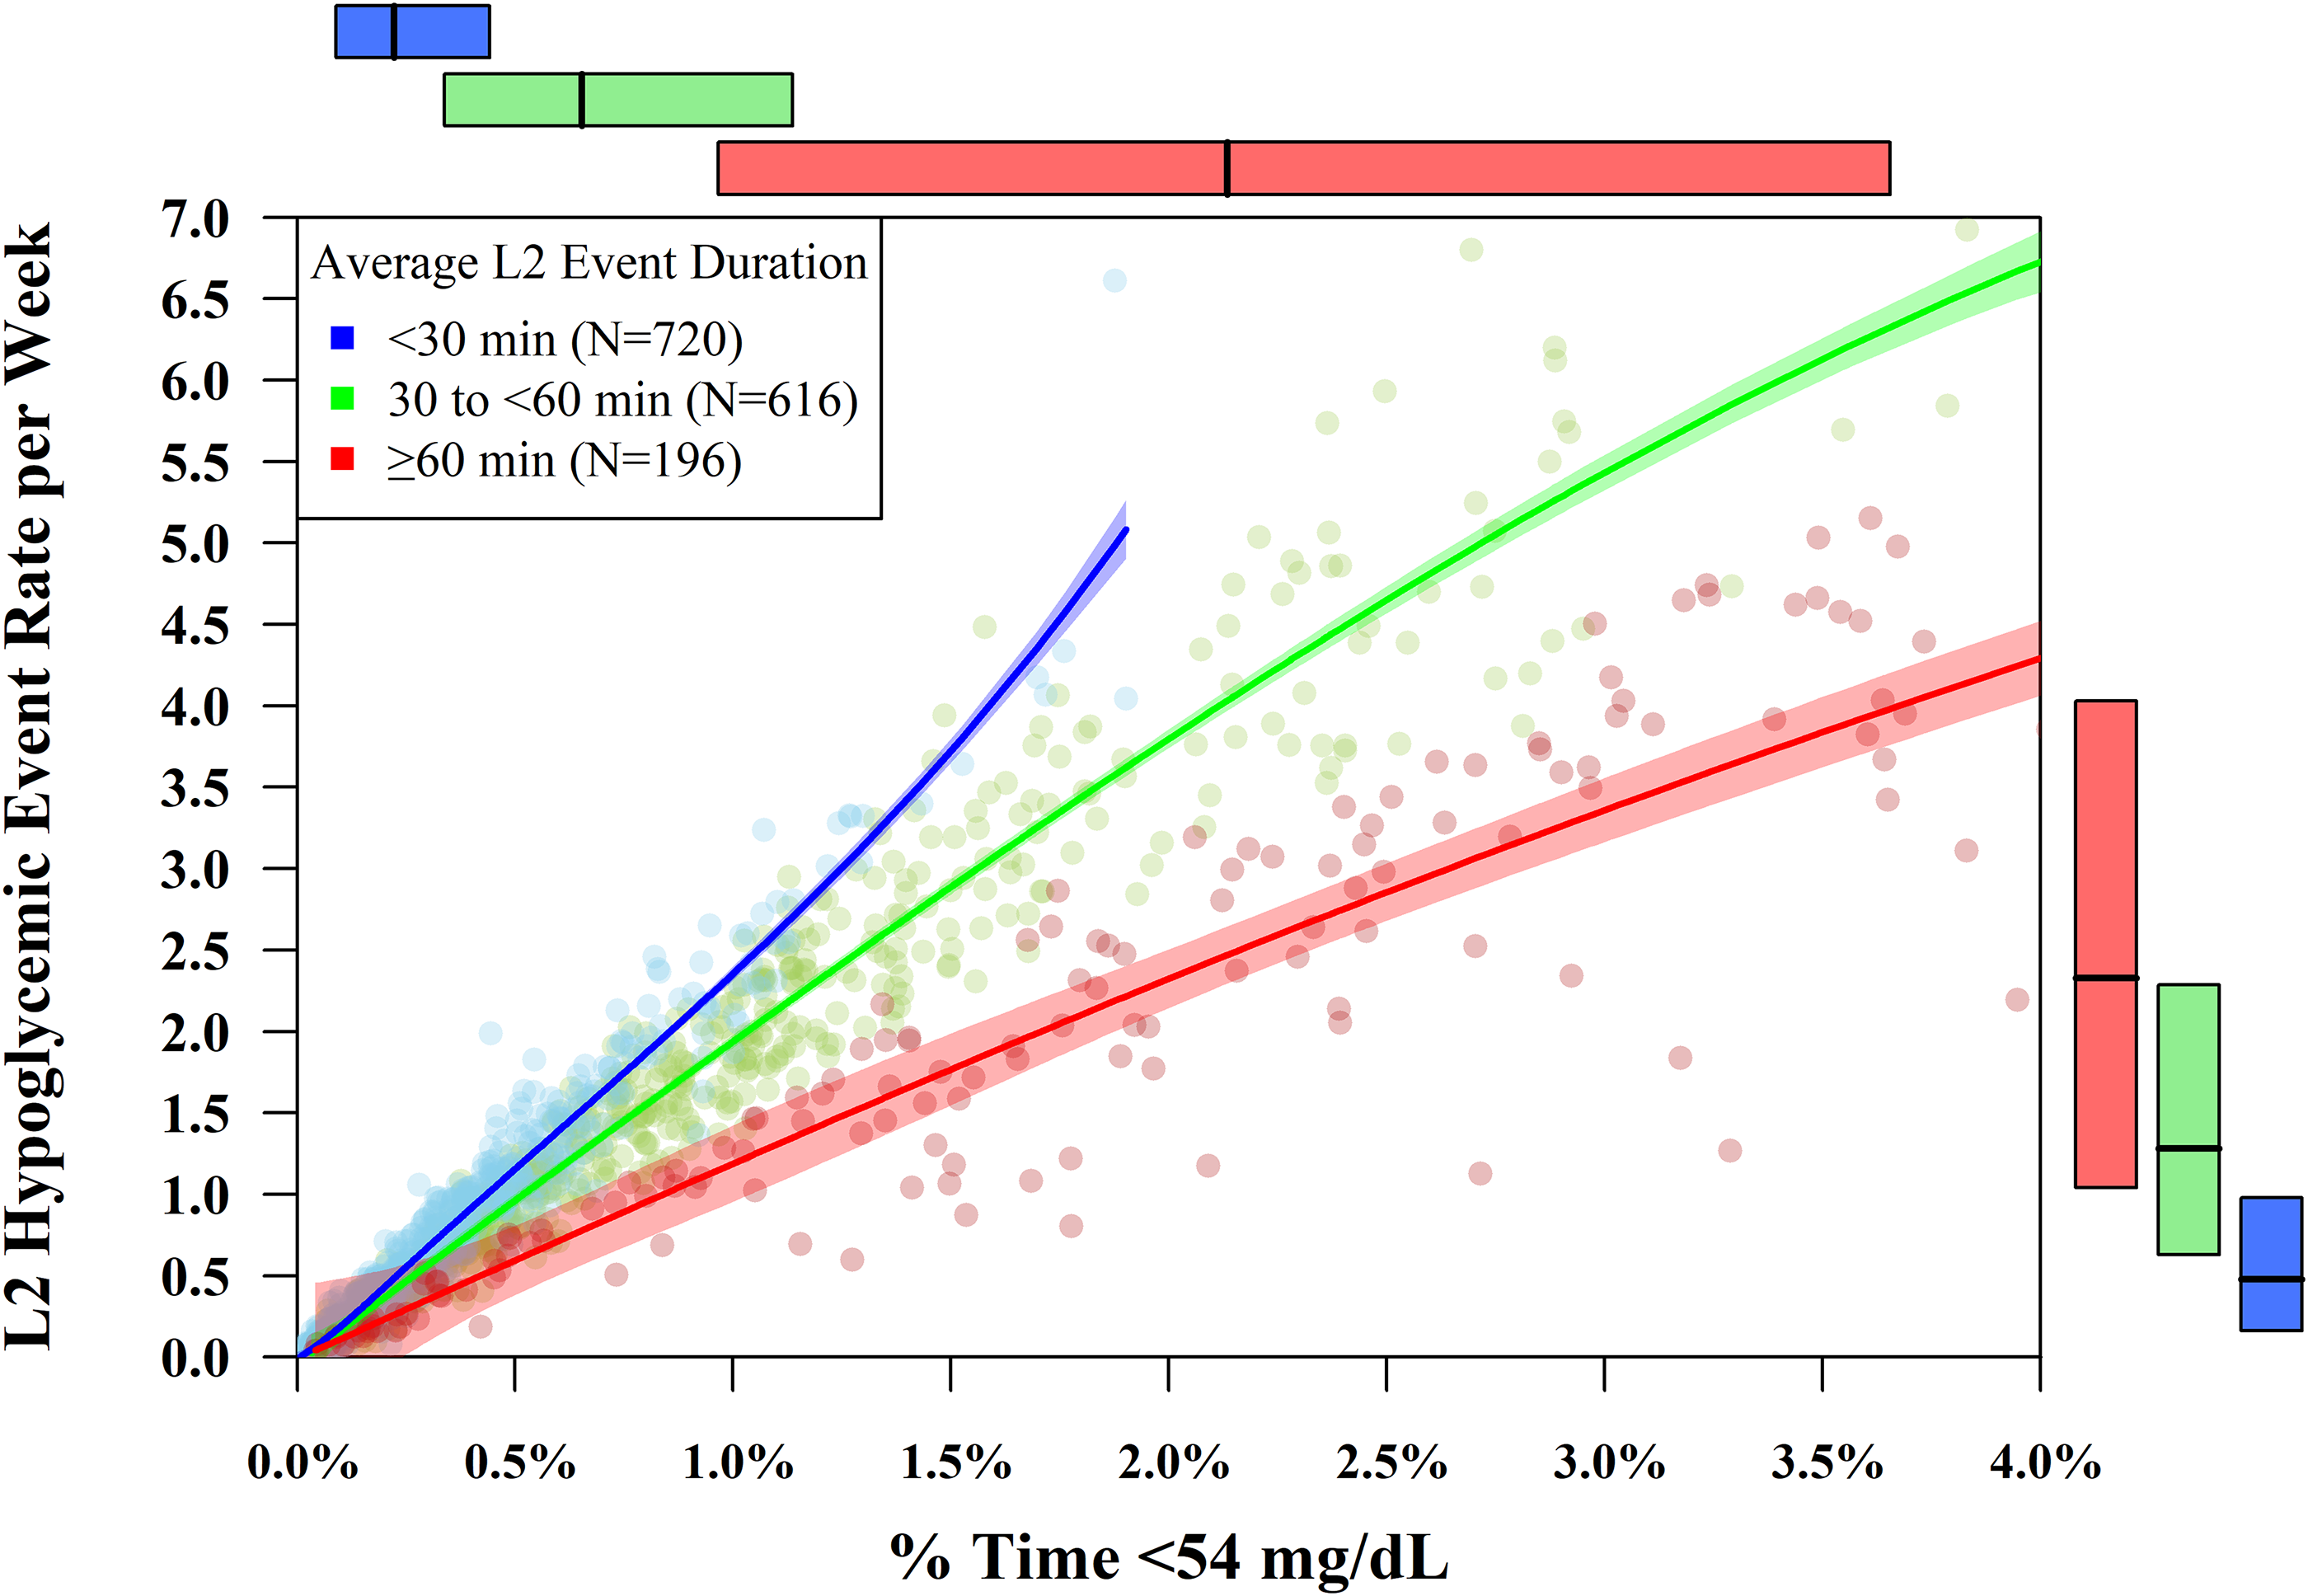
Relationship between %T < 54 and frequency of level 2 (L2) events by duration of L2 events. Inside the boxed plot area: Points represent the original data points; curved lines represent the fitted splines for each average L2 event duration category; shaded bands behind the lines represent the 95% confidence interval around the fitted splines. Outside the boxed plot area: Boxplots of % time <54 mg/dL (across the top) and L2 hypoglycemic event rate per week (along the right side) by average L2 event duration. Colored boxes span the 25th–75th percentile. Lines in the middle of the colored boxes represent the median.
%T < 54 is mostly a combination of the frequency and duration of L2 events, as shown in Figure 2 (model parameters to generate curves are given in Supplementary Table S1). Importantly, among the participants with high %T < 54 are individuals having few L2 events with long durations and individuals having many L2 events with short durations, as well as a subset who had many L2 events with long durations. Thus, %T < 54 captures overall hypoglycemia exposures but loses granularity on the type of hypoglycemia exposure.
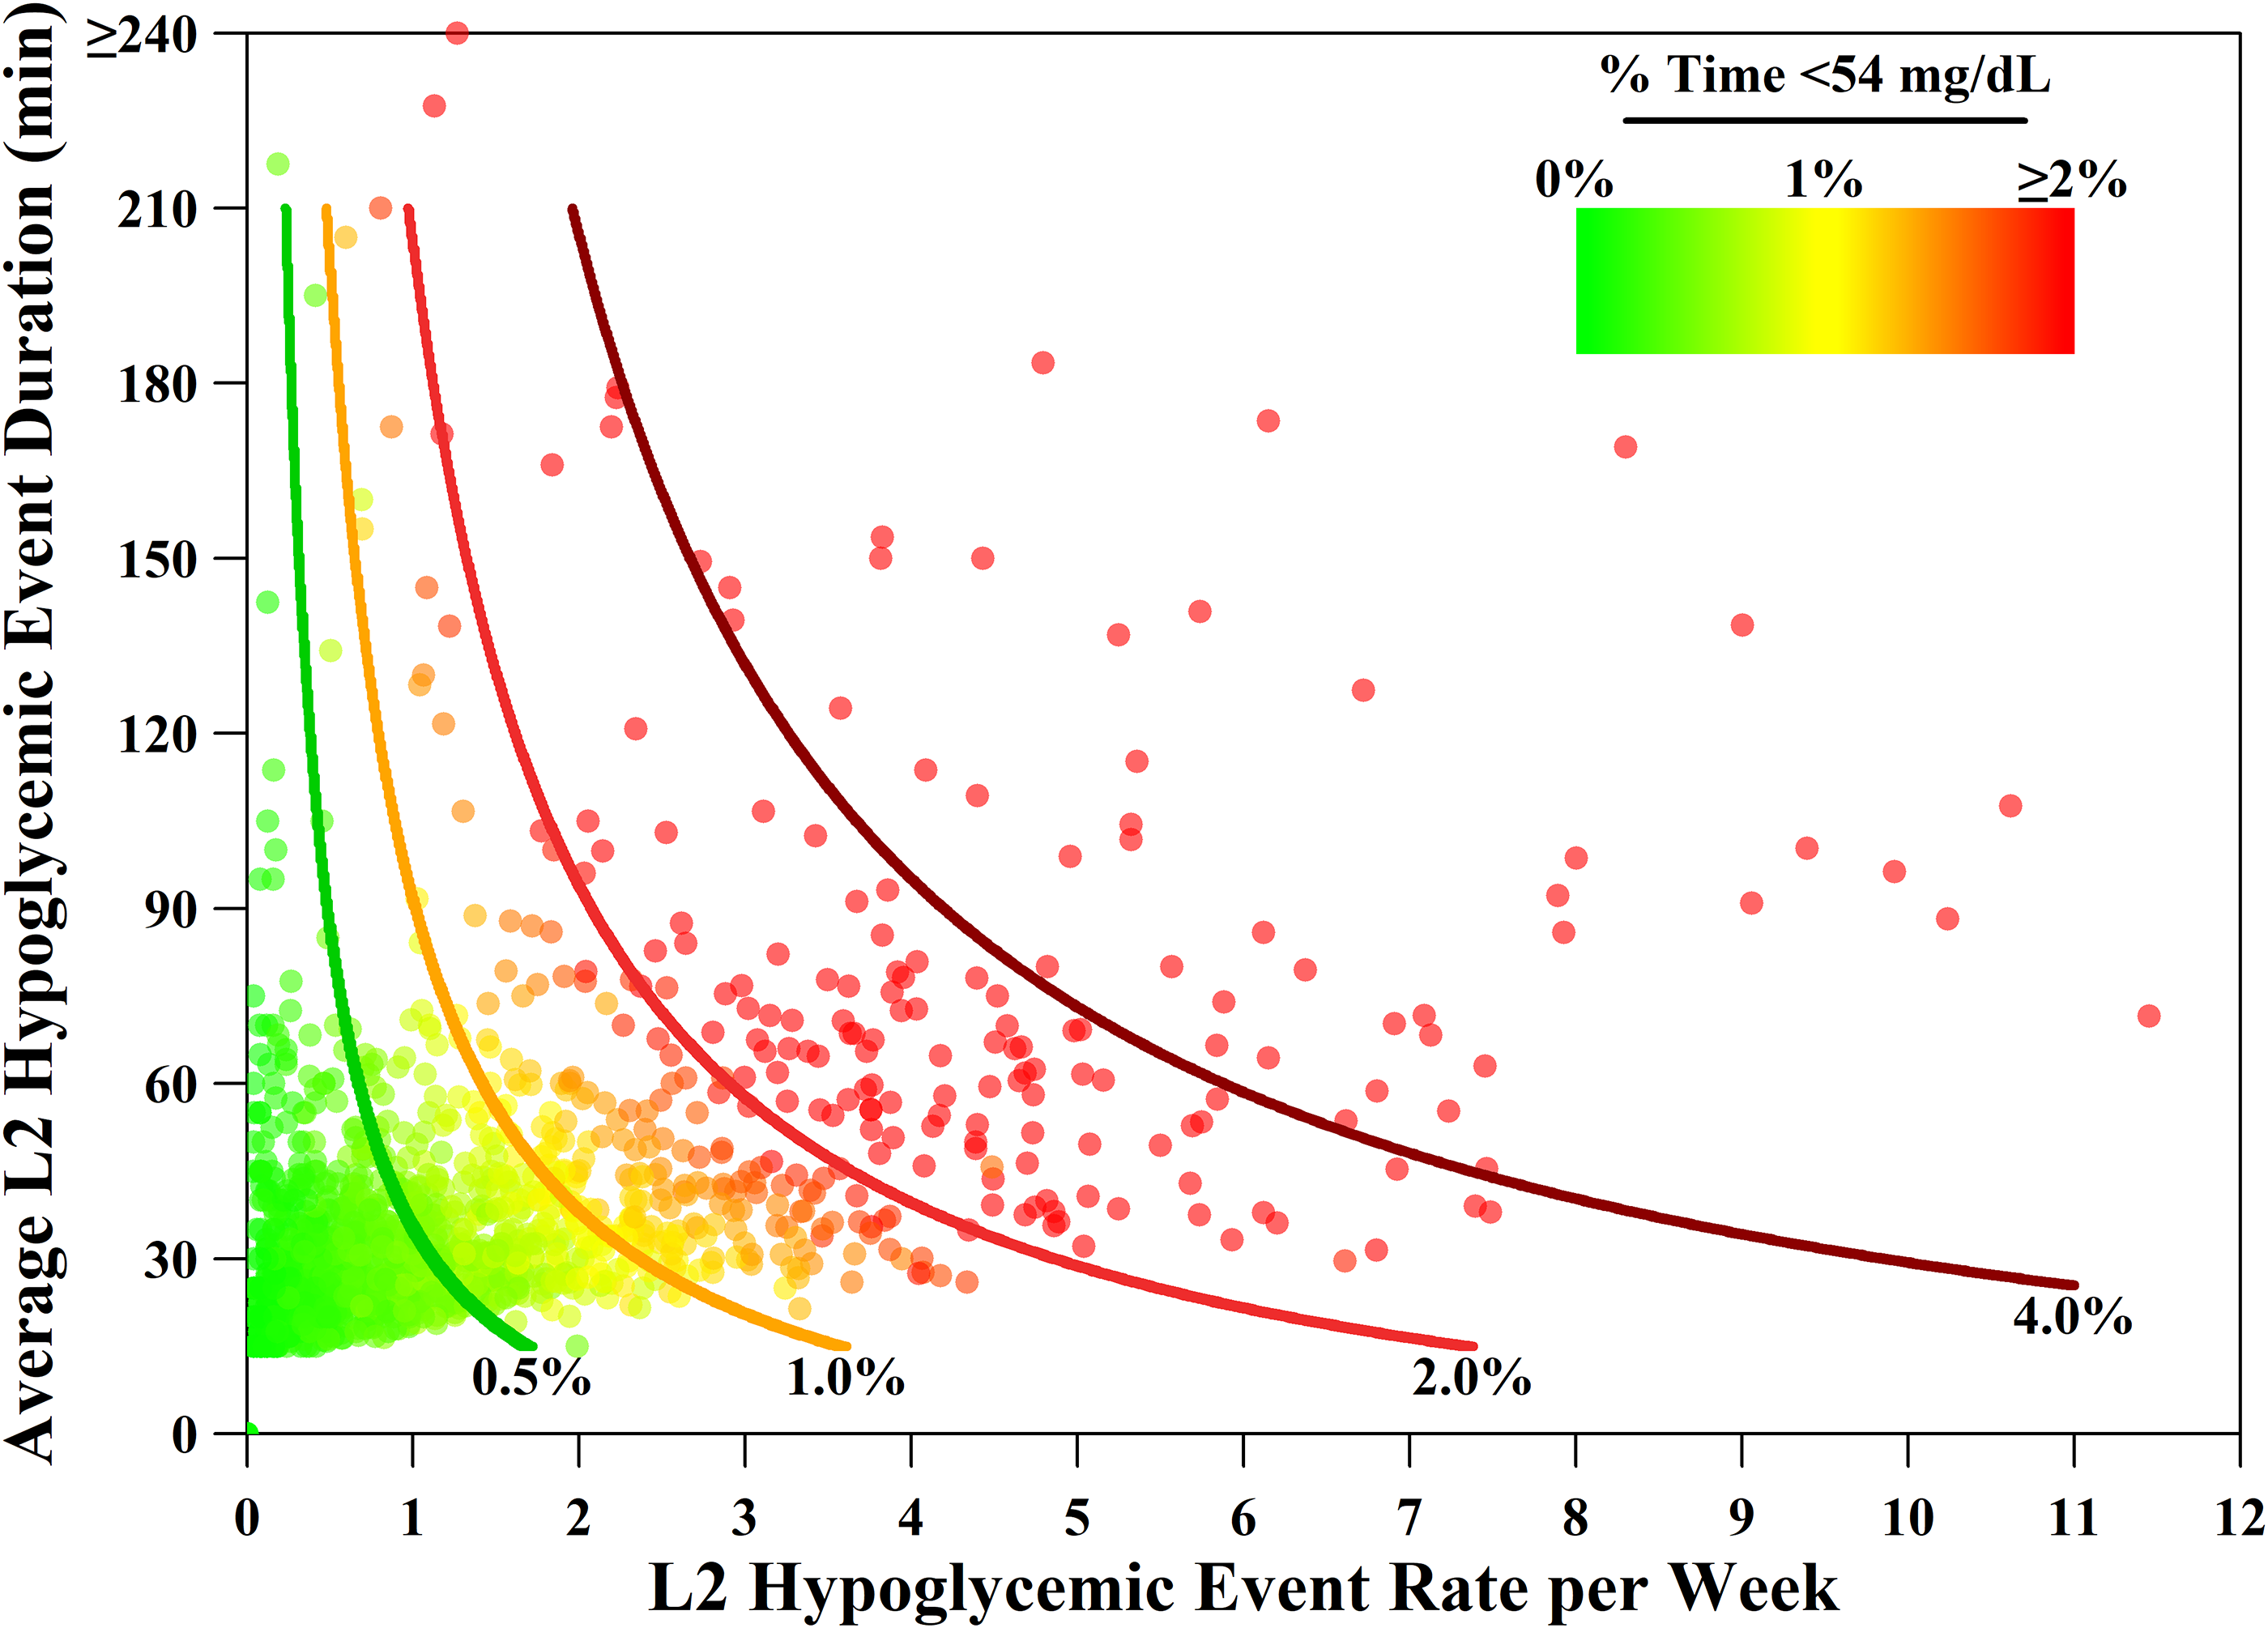
Estimated % time <54 mg/dL based on frequency and duration of L2 events. Each point represents an individual’s L2 hypoglycemic event rate and average L2 hypoglycemic event duration color coded by their % time <54 mg/dL. The curves display the estimated % time <54 mg/dL based on the L2 event rate and duration using a linear regression with an interaction term. The model parameters used to generate the curves are listed in Supplementary Table S1.
The variance of %T < 54 explained by the L2 event rate was 93% and increased to 96% when adding the duration of L2 events. This still leaves some unexplained variance of %T < 54, and this is due to %T < 54 also including glucose readings <54 mg/dL that are not occurring in an L2 event (i.e., exposure to <54 mg/dL for <15 min). The proportion of %T < 54 contributing to an L2 event is shown in Figure 3. Overall, 82% of CGM values <54 mg/dL (i.e., 82% of the %T < 54) occurred in an L2 event, whereas the other 18% of CGM values <54 mg/dL were short episodes that would not constitute an L2 event. However, this proportion depended on technology use where a smaller percentage of CGM values <54 mg/dL occurred in an L2 event for AID users (72%) and a higher percentage of CGM values <54 mg/dL occurred in an L2 event for CGM without AID (84%) and SMBG users (95%). AID users also had a smaller percentage of CGM values <54 mg/dL occurring in long L2 events (≥120 min) compared to CGM without AID users and SMBG users (6% vs. 17% vs. 53%, respectively).
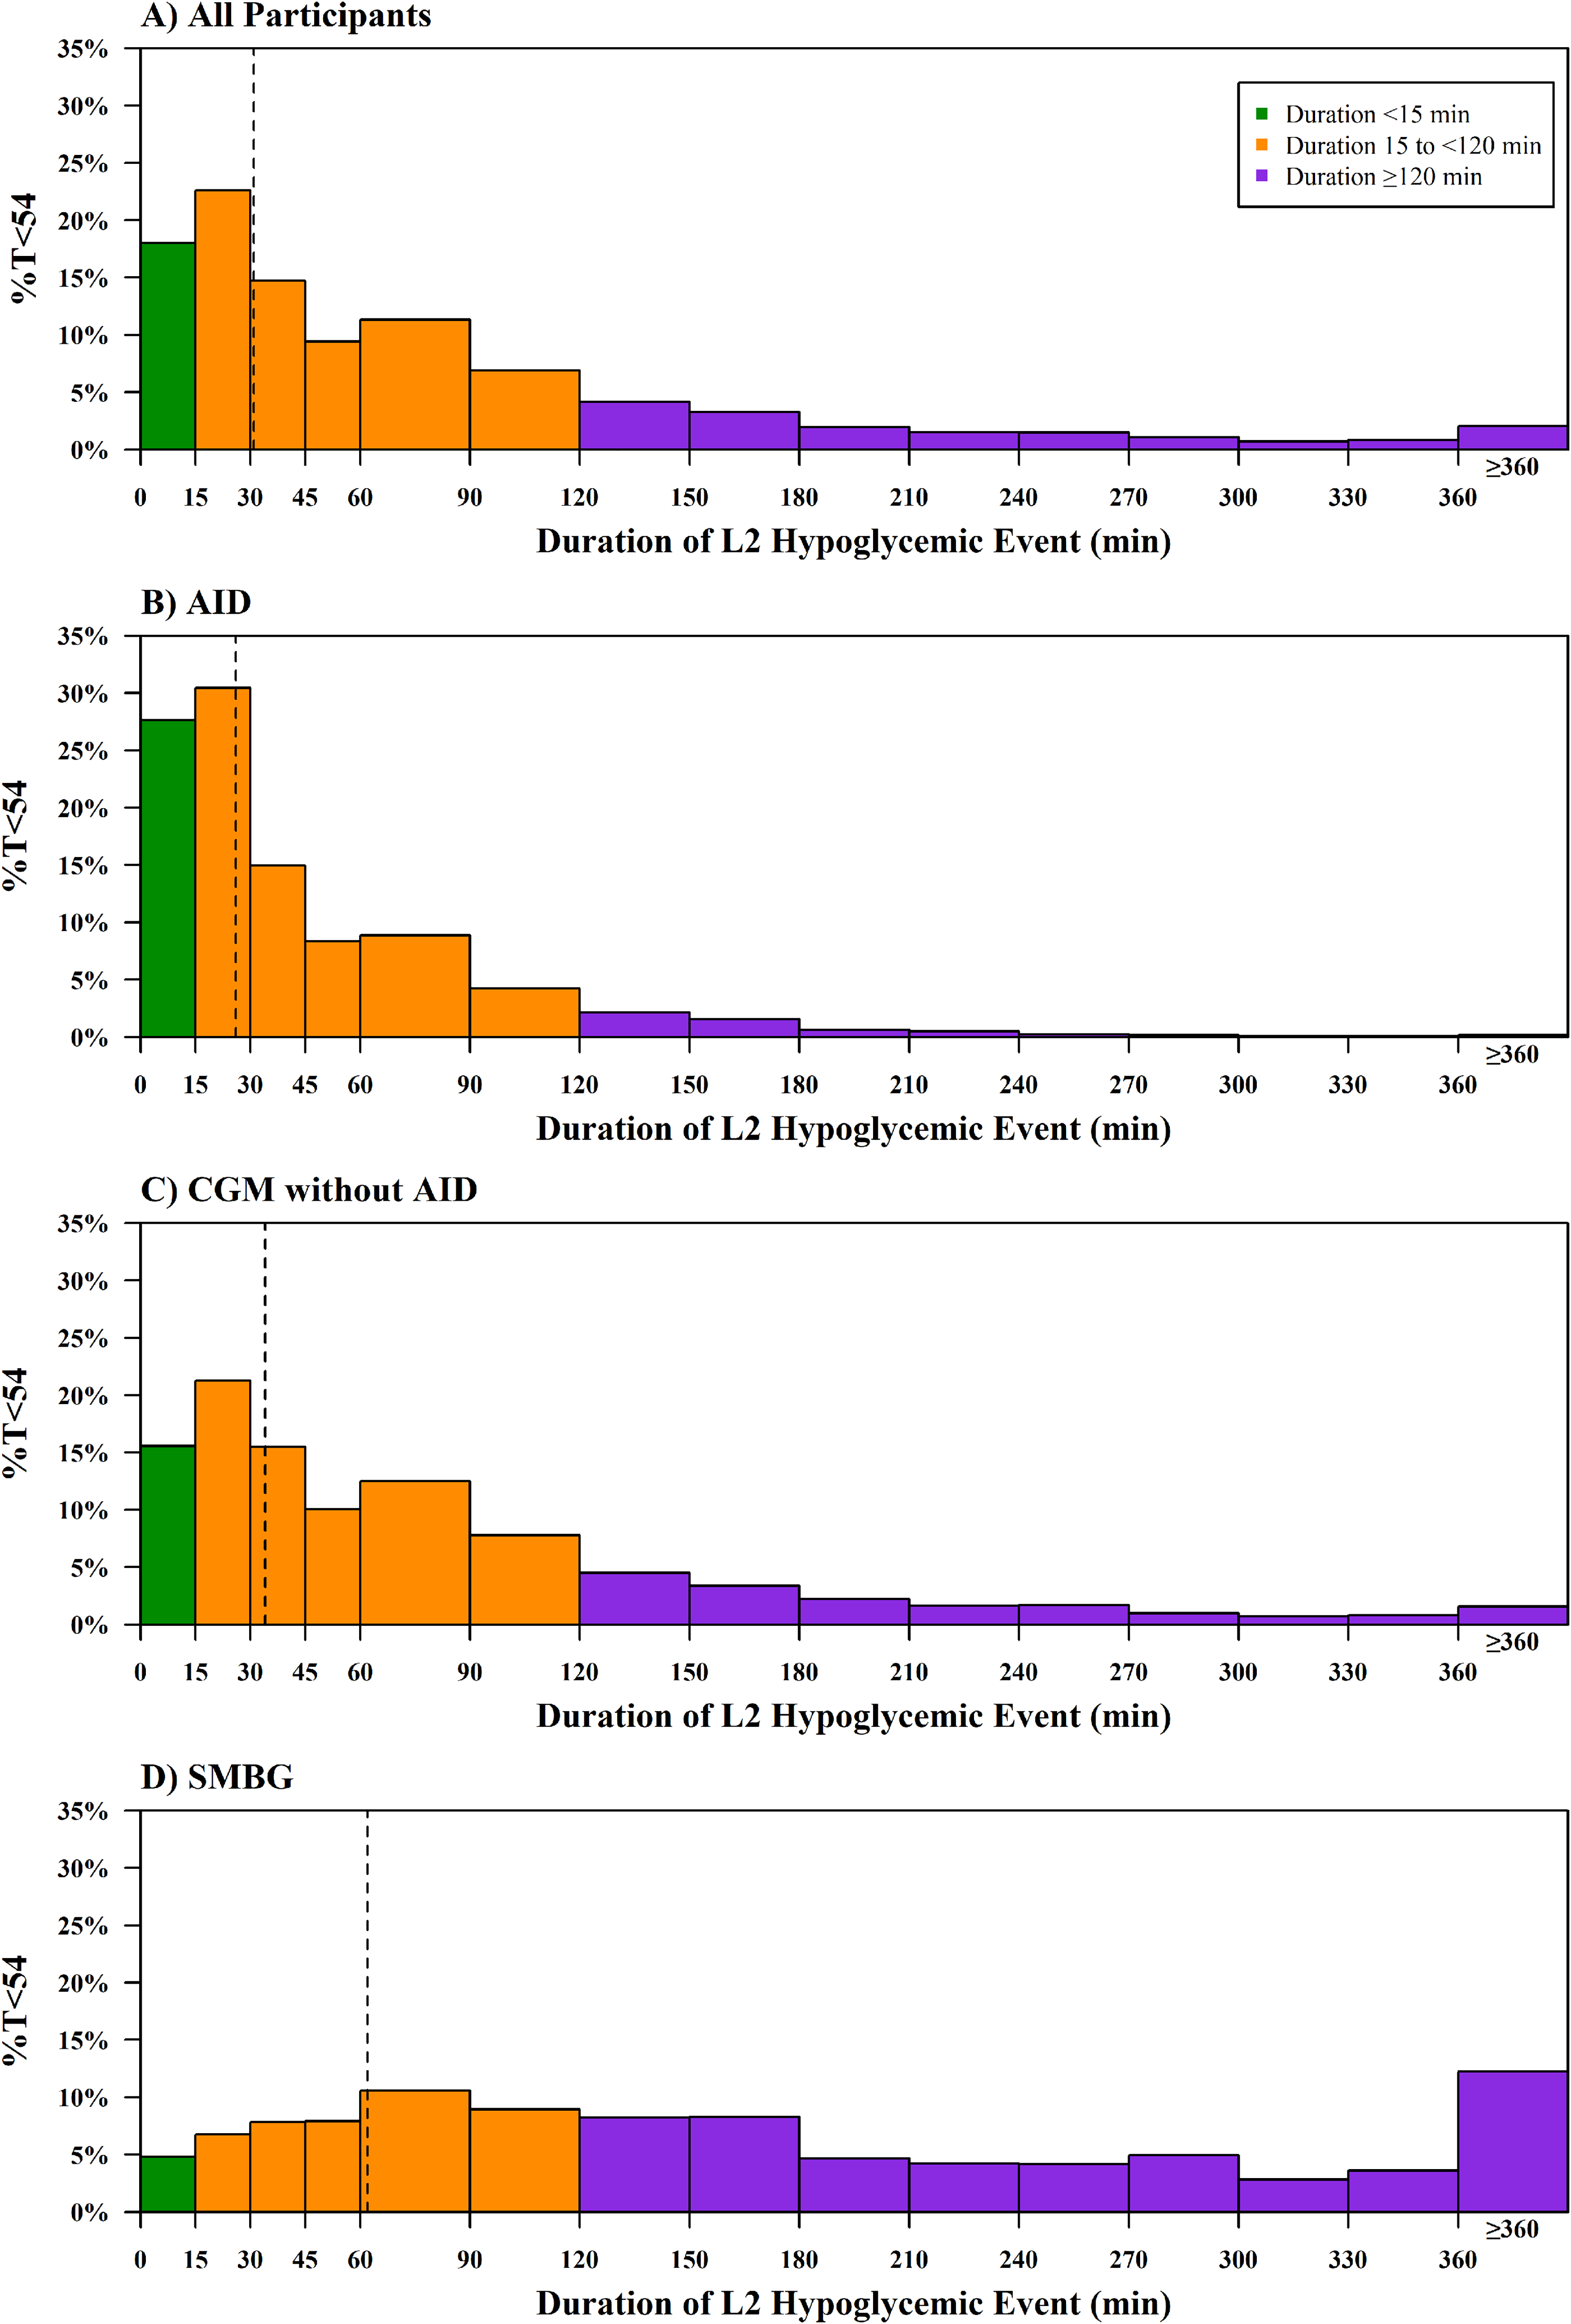
The proportion of %T < 54 contributing to hypoglycemic events. Colored bars represent the % of all CGM readings <54 mg/dL attributed to each L2 hypoglycemic event duration. Dashed vertical lines represent the median L2 hypoglycemic event duration in each category.
AID users and CGM without AID users had less hypoglycemia exposure than SMBG users (median %T < 54 = 0.3%, 0.5%, and 1.5%, P < 0.001). The proportion of participants meeting the %T < 54 clinical targets differed by technology use (90% for AID users, 72% for CGM without AID users, and 39% for SMBG users). Those meeting the clinical target of %T < 54 < 1% experienced a median of 0.6 (0.2, 1.1) L2 events per week, with approximately 28% experiencing at least one L2 event per week and only 2% having two or more L2 events per week (Table 2). The median L2 event average duration was 27 min. The SH incidence rate was only 3 events per 100 person-years. The frequency and duration of L2 events and SH event incidence rates were similar by technology use for those meeting hypoglycemic targets. Thus, participants meeting hypoglycemic targets had few L2 hypoglycemic events, short L2 event durations, and few SH events irrespective of technology use.
Continuous Glucose Monitoring-Measured and Severe Hypoglycemic Event Rate, Overall and by Cohort
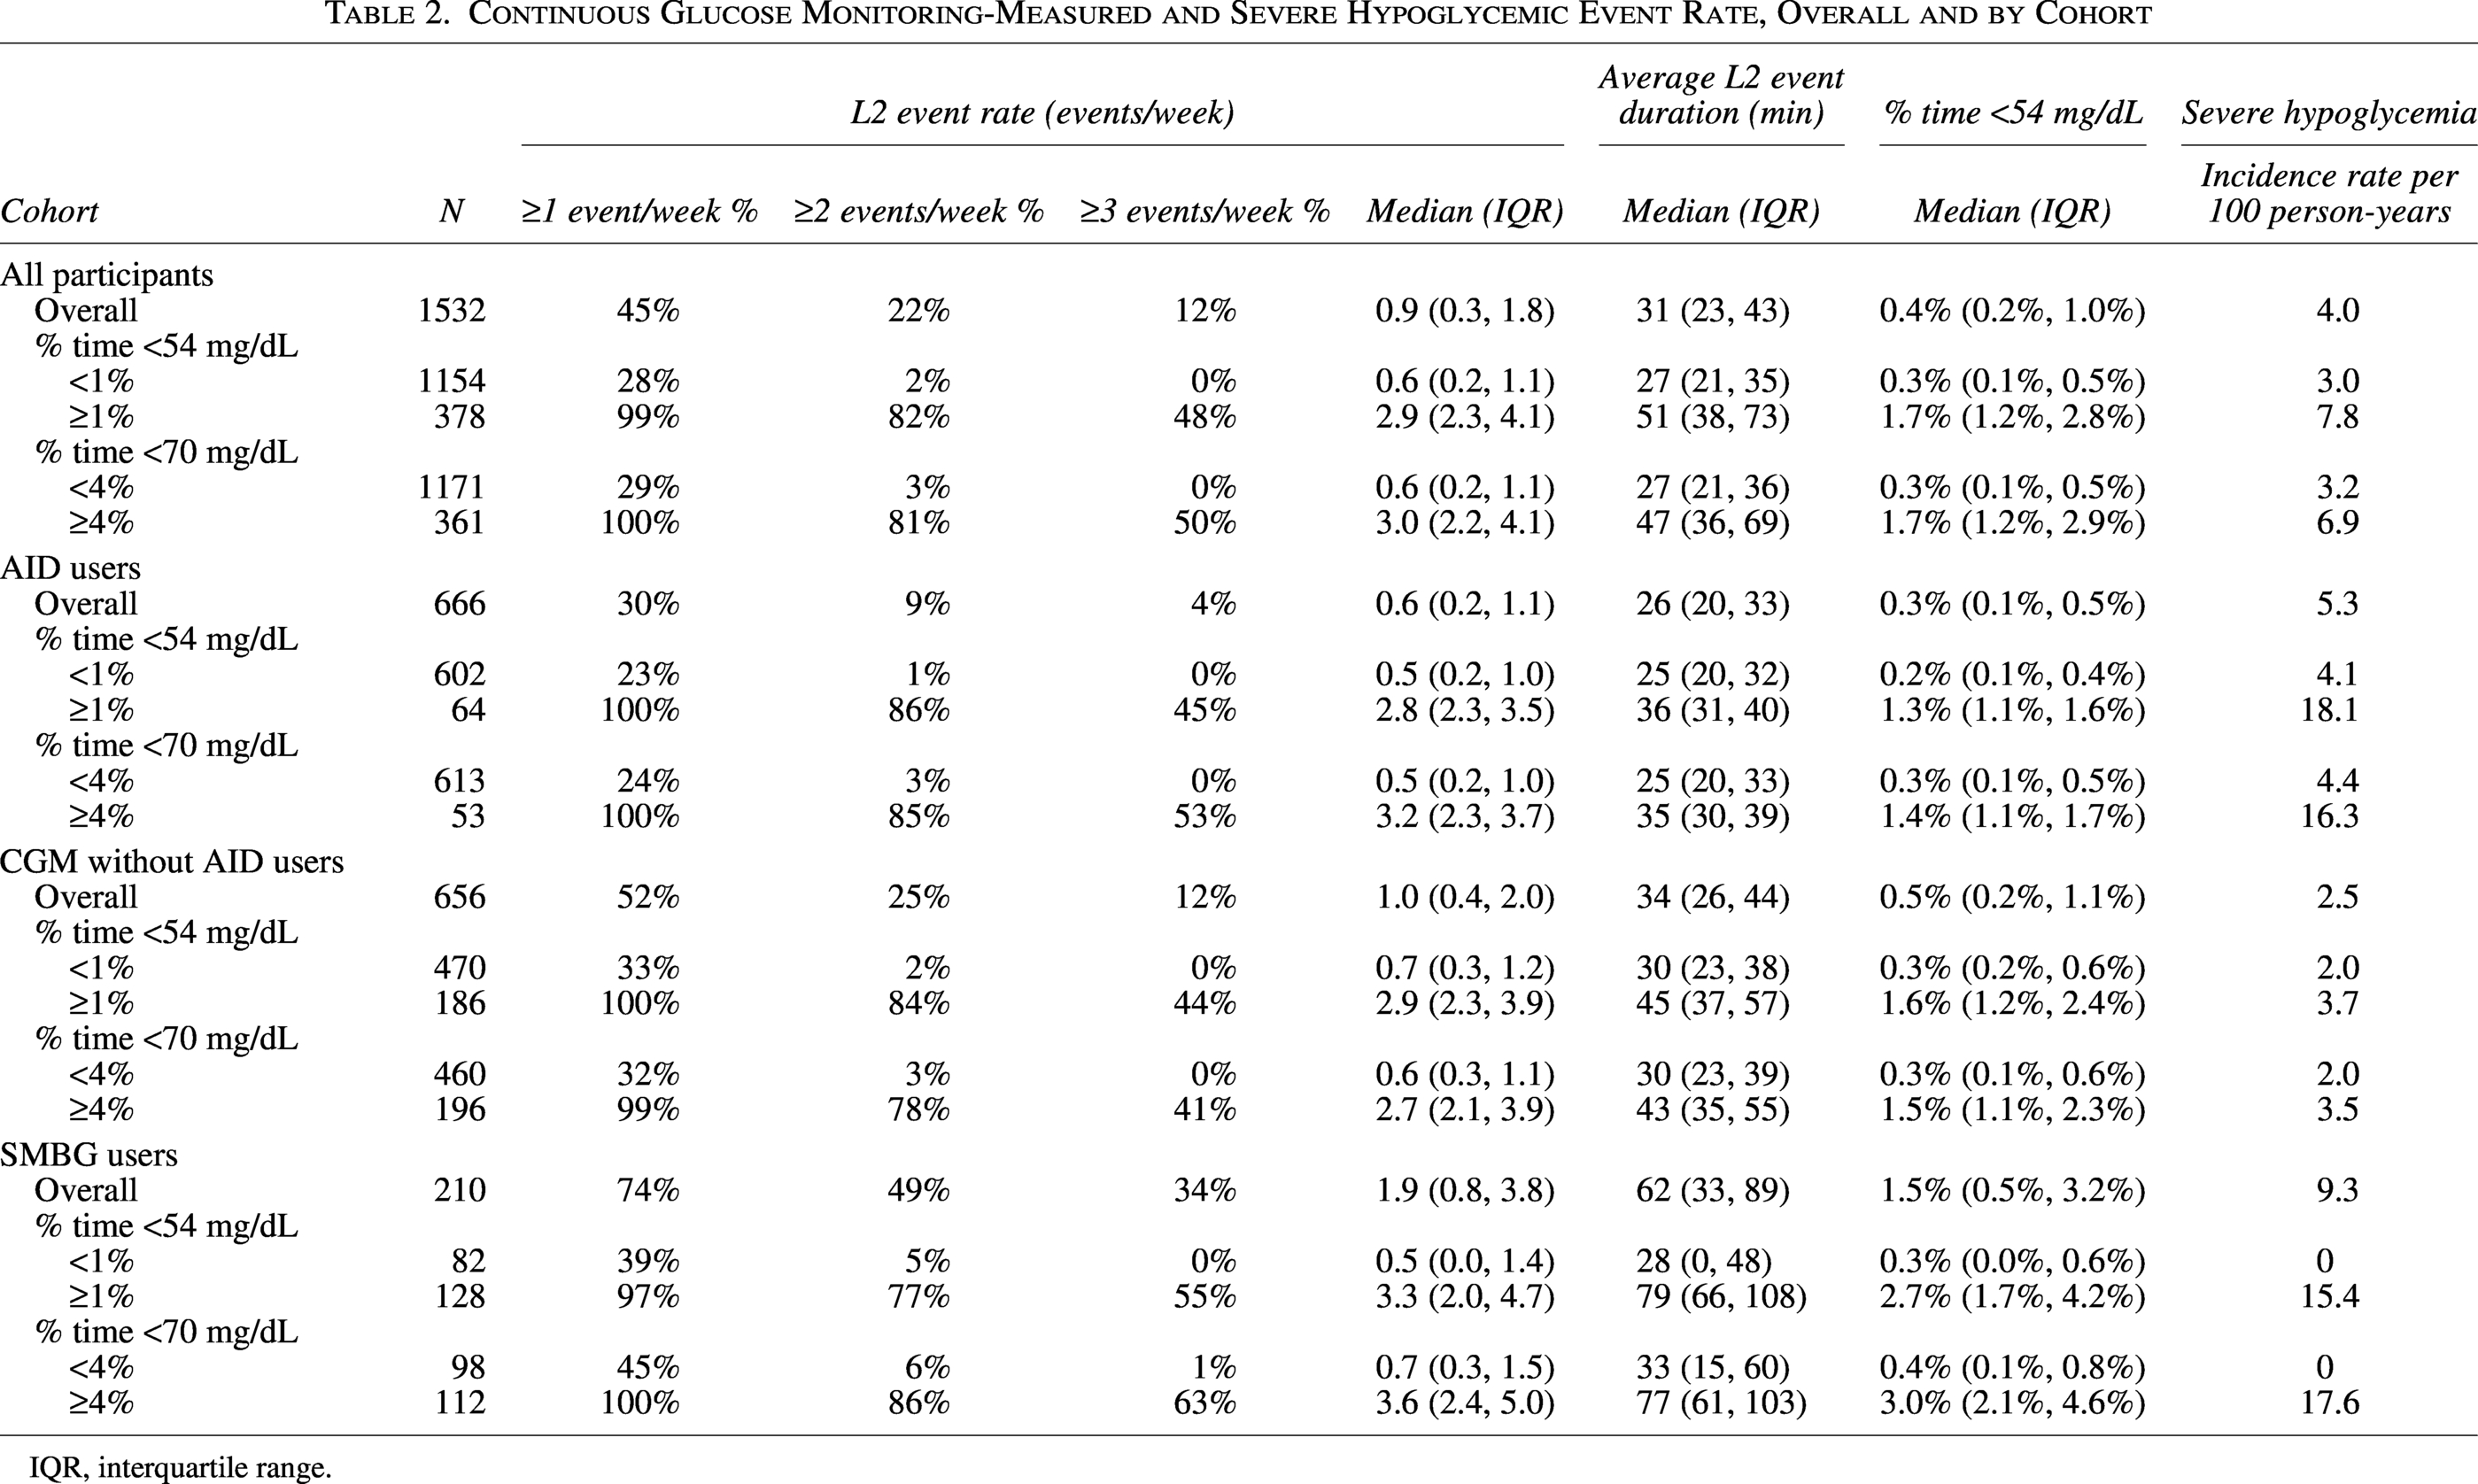
IQR, interquartile range.
In contrast, participants not meeting hypoglycemic targets had significantly more L2 events (P < 0.001), longer L2 event durations (P < 0.001), and more SH events (P = 0.008), although the magnitude of the increase depended on technology use and the observed %T < 54. For those not meeting the clinical target of %T < 54 < 1%, the median L2 hypoglycemic events per week were 2.8 for AID users, 2.9 for CGM without AID users, and 3.3 for SMBG users, and the median L2 event average duration was 36, 45, and 79 min, respectively. The SH event rate was 18.1, 3.7, and 15.4 events per 100 person-years. Similar results were seen for meeting and not meeting the clinical target of %T < 70 < 4%.
The relationship between frequency and duration of L2 events and %T < 54 did not differ by type of CGM (data not shown). The minimum %T < 54 based on the frequency and duration of L2 events is shown in Supplementary Figure S2. The minimum %T < 54 would occur if every CGM measurement <54 mg/dL occurred in an L2 event. An individual with 1% T < 54 over a 1-week period could, during that period, experience a single 100-min-long L2 event or have as many as six L2 events, each with an average duration of 17 min. Analyses were further explored by considering ending the event when there were ≥15 consecutive minutes ≥54 mg/dL, rather than ≥70 mg/dL, but this had a negligible effect overall (Supplementary Table S2). Additional analyses also considered defining the duration as simply the time between the start and end of the L2 event without subtracting the time ≥54 mg/dL, but this also had a negligible effect overall: median L2 event average duration increased from 31 min (IQR: 23–43 min) using the original definition to 33 min (IQR: 24–47 min) using the alternative definition. The conclusions were the same using either definition to end the L2 event and using either definition for the duration of the L2 event.
The estimated probability of experiencing ≥1, ≥2, or ≥3 L2 hypoglycemic events per week increased as %T < 54 increased (Fig. 4A). At the minimally acceptable threshold of 1% T < 54, the likelihood of having ≥1 versus ≥2 L2 events/week was >99% versus 26%, and each 0.1% increase in %T < 54 multiplied the odds of ≥2 L2 hypoglycemic events by 1.7. The estimated probability of experiencing ≥1 L2 hypoglycemic event lasting ≥60 or ≥120 min also increased as %T < 54 increased (Fig. 4B). At the minimally acceptable %T < 54 threshold (1%), the likelihood of having ≥1 L2 event lasting ≥60 min per week was 1.2% and was 0.2% for ≥1 L2 event lasting ≥120 min per week.
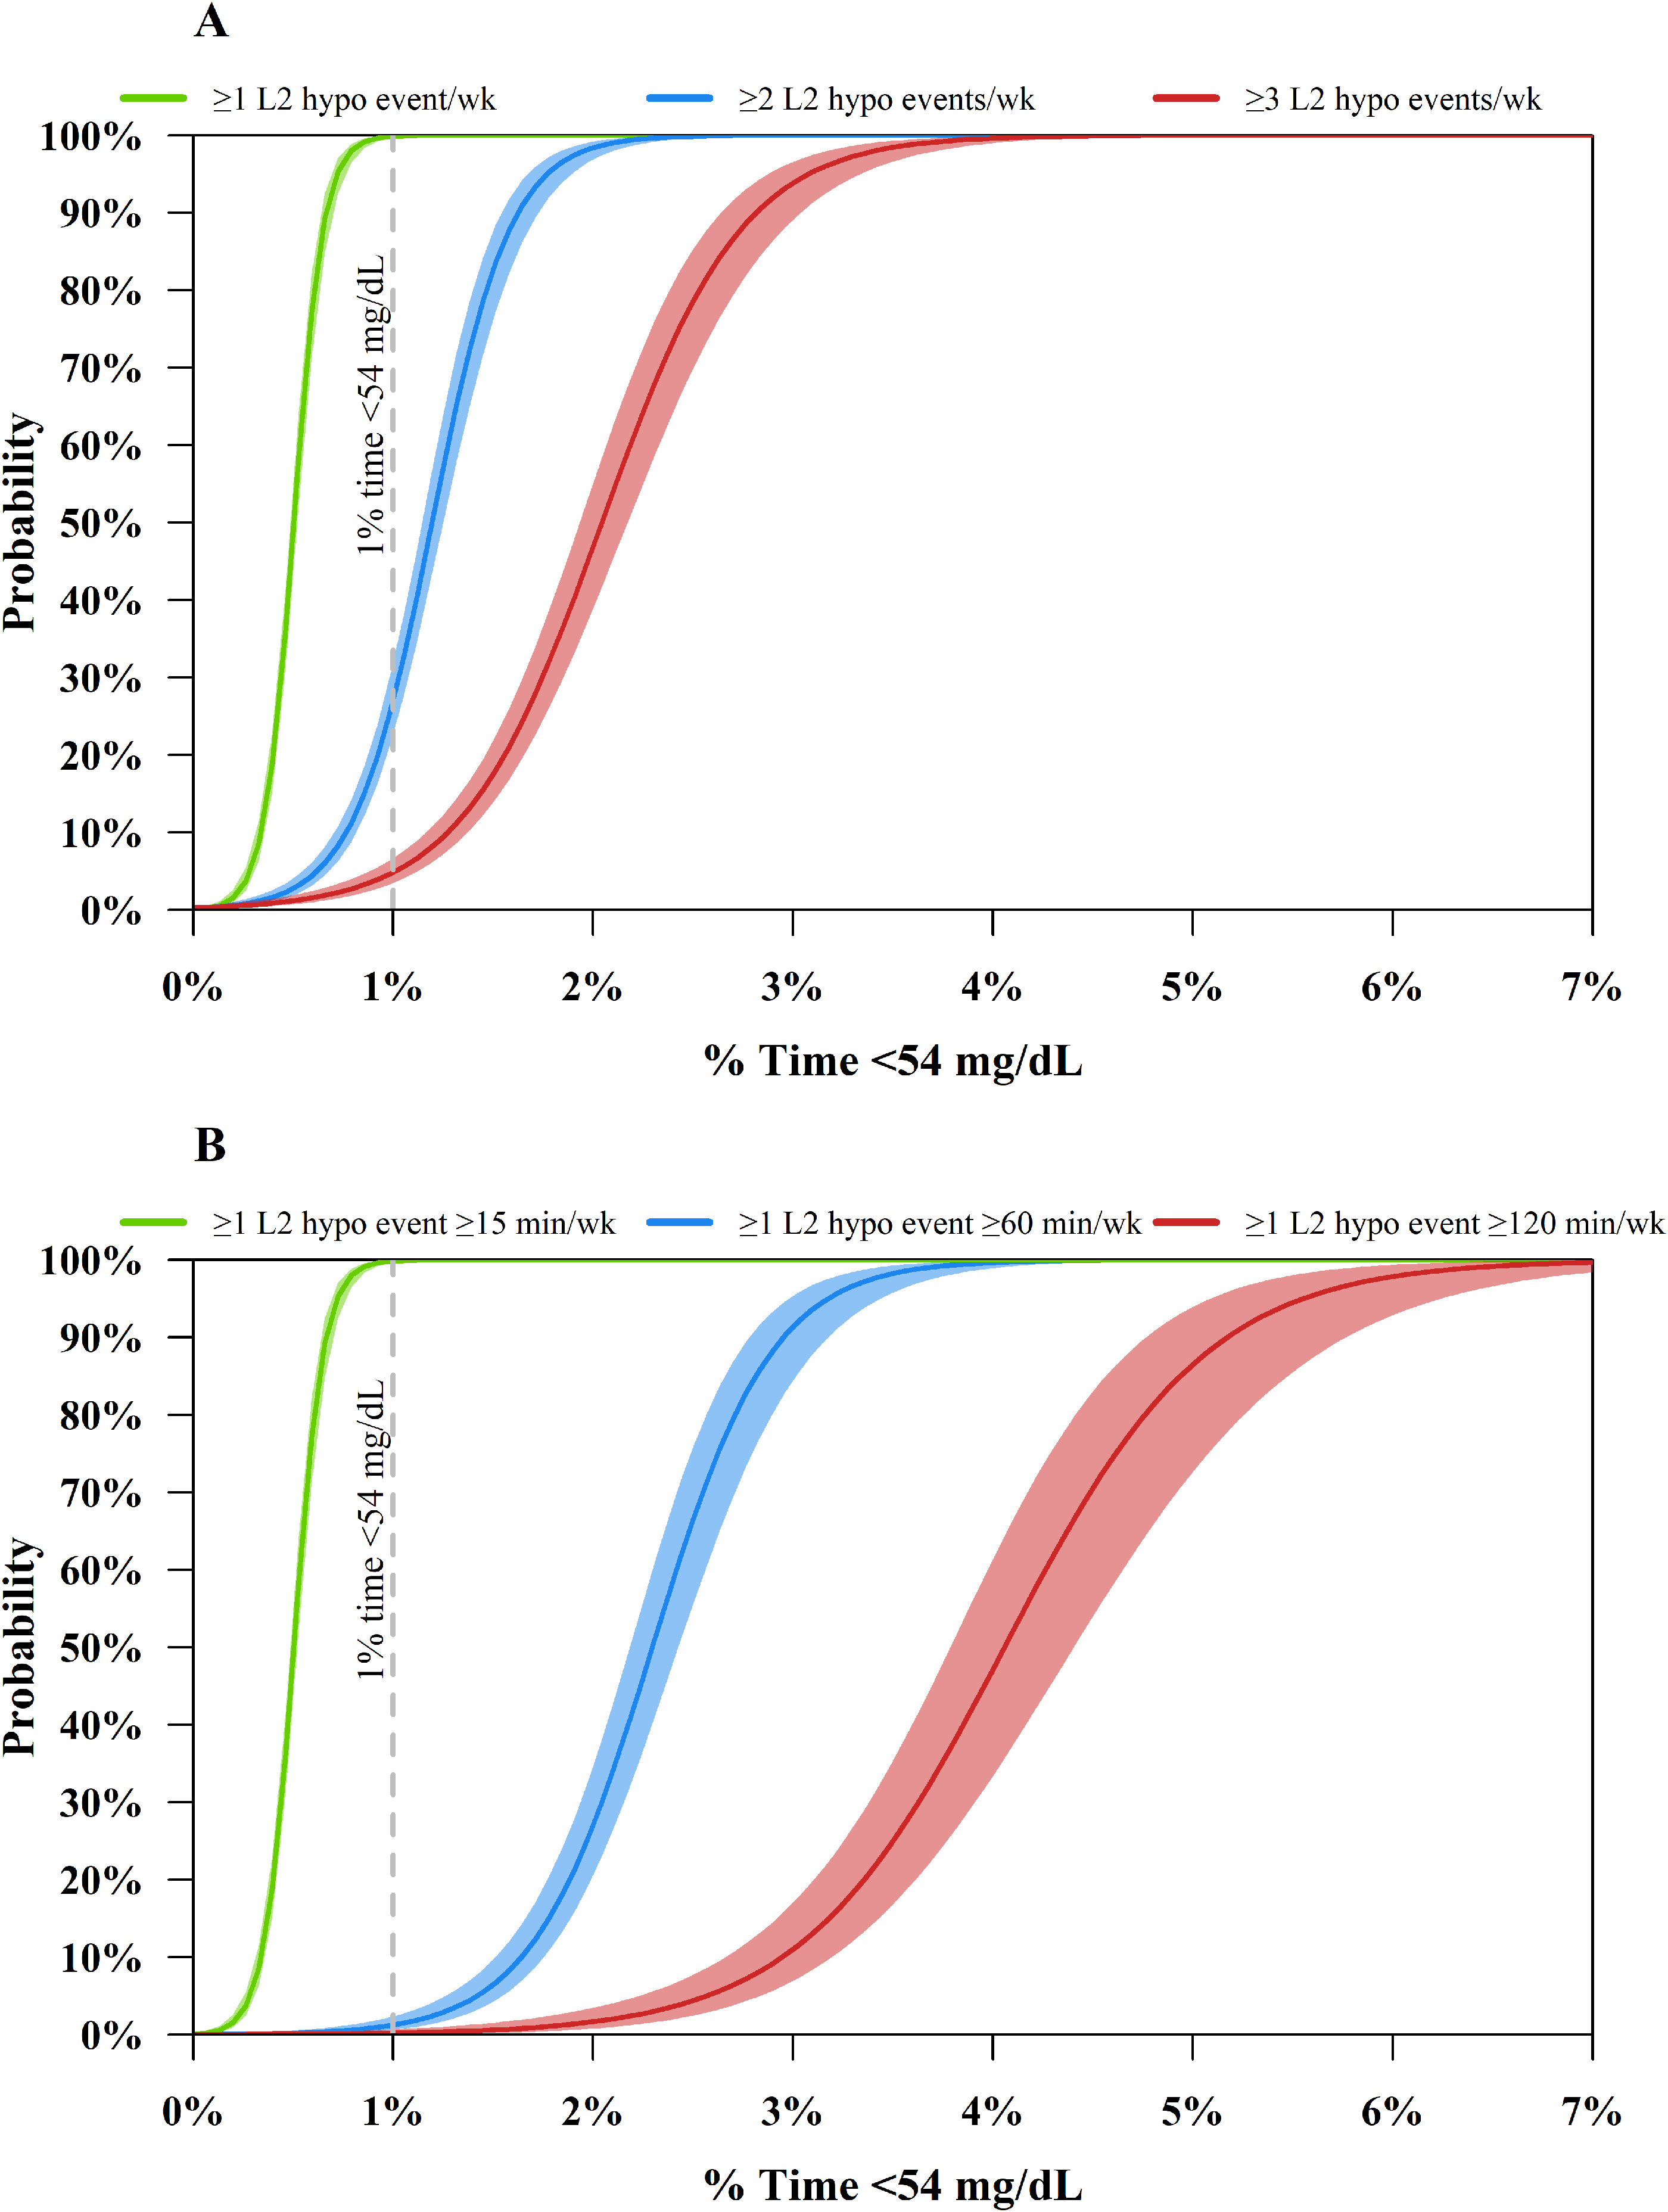
Estimated probability of experiencing
Discussion
This analysis demonstrates that there is a strong relationship between time-below-range metrics and frequency of L2 events in persons with T1D, but this relationship differed by the average L2 event duration. This suggests that the frequency of L2 hypoglycemic events by itself is insufficient to summarize the amount of exposure to hypoglycemia. Specifically, to be clinically meaningful, the duration of L2 hypoglycemic events should also be summarized in conjunction with the frequency of L2 events. Conversely, time-below-range metrics incorporate both aspects.
Summarizing the duration of L2 hypoglycemic events can be difficult as some individuals may not have any L2 events detected during a prespecified time period (e.g., duration of study participation). CGM metrics are summarized on the participant level giving equal weight to each participant, but there is uncertainty around handling participants without an L2 event. Specifically, calculating the average L2 event duration for each participant would naturally exclude those without any L2 events, which could yield biased results when assessing a treatment effect. Another approach is to summarize the frequency of prolonged L2 events (i.e., L2 events lasting ≥120 min). While prolonged L2 events dichotomize the L2 event duration, this endpoint could be calculated for all individuals and is useful for treatment evaluation when hypoglycemia is of primary interest. The frequency of all L2 events and prolonged L2 events in combination would mostly incorporate the frequency and duration of L2 events. However, each metric alone does not sufficiently summarize overall amount of hypoglycemia exposure.
While current time-below-range metrics are valuable for assessing treatment options and provide useful clinical targets that associate with fewer SH events, they are limited in what they may reveal. For example, one downside of time-below-range metrics is that by incorporating both the frequency and duration of L2 events, the metric loses granularity on the type of hypoglycemia exposure. Two participants with the same %T < 54 can have vastly different L2 event rates: one may have few events each lasting hours, whereas the other may have many events each lasting a much shorter duration (e.g., 15–30 min). The treatment solution may differ depending on the scenario and the timing of the hypoglycemia, so a further perusal of the type of hypoglycemia exposure is needed. The beneficial outcome of treatment may also vary, as average L2 event duration, or L2 event rate, or both may be reduced by a given treatment solution. %T < 54 is helpful to summarize the overall amount of hypoglycemia exposure and a useful measure for clinical targets, as the guidelines recommend, 2 while L2 event rate and prolonged hypoglycemia event rate may be valuable for understanding the type of hypoglycemia exposure.
Participants meeting hypoglycemic targets (<1% T < 54 and <4% T < 70) experienced fewer L2 events, had shorter L2 event durations, and had fewer SH episodes compared to participants not meeting hypoglycemic targets. Those meeting hypoglycemic targets had similar rates of L2 events across technology use, while those not meeting hypoglycemic targets had varying rates of L2 events that depended on technology use and their % time <54 mg/dL. Participants at the minimally acceptable hypoglycemia threshold (%T < 54 = 1%) almost always had at least 1 L2 event per week, but only a 26% chance of having at least 2 L2 events per week, and only rarely had any L2 event lasting ≥60 min. Thus, consensus targets are aligned with allowing one short L2 hypoglycemic event per week but not allowing two or more L2 hypoglycemic events per week or a prolonged L2 hypoglycemic event per week. Importantly, even for participants meeting hypoglycemic targets, a lower %T < 54 was associated with a lower frequency of L2 events.
There was a strong relationship between meeting hypoglycemia clinical targets and fewer SH events, but a more in-depth analysis is needed to better understand the relationship between CGM metrics and SH events. The recent Montaser et al. article found %T < 54 to have limited predictive value for SH, 19 and there are likely other CGM metrics that are more predictive of SH events.20,21 There are also other CGM-measured hypoglycemia metrics that incorporate the frequency, duration, and magnitude of the hypoglycemia event and could be beneficial for patients and clinicians. However, as %T < 54 is a core CGM endpoint used to define clinical targets 2 and incidence of L2 hypoglycemia is recognized as a surrogate endpoint for neuroglycopenia-related adverse events by the FDA, 9 summarizing %T < 54 and corresponding L2 event rate and L2 event duration are critical for treatment evaluation and may improve clinical care.
The limitation of the analysis is that the studies used an older generation of CGMs, and the relationship could theoretically differ using newer CGMs. The relationship between time below range and frequency and duration of L2 events was similar across types of CGM, suggesting the association may generalize well to newer CGMs. However, the association between CGM-measured hypoglycemia metrics and frequency of SH events could be stronger with more accurate CGMs.
The strength of the analysis is that the pooled studies include a large sample size with different types of technology use and a wide range of demographics. The large sample size allowed us to further explore how the relationship between CGM-measured hypoglycemia metrics differed by various factors.
While consensus exists to define the start of L2 hypoglycemic events, there is some ambiguity regarding the end of the L2 events or the duration of the L2 events. For example, according to a recent consensus document, 3 the end of an L2 event is defined as ≥15 consecutive minutes with a glucose ≥54 mg/dL, while an earlier statement uses ≥15 consecutive minutes with a glucose ≥70 mg/dL. 22 Others have proposed using a more sophisticated statistical approach to define the end of the L2 event. 23 While using a ≥54 mg/dL threshold to end the L2 event would inherently include more events with shorter durations compared with a ≥70 mg/dL threshold, this had a negligible effect on the results presented in this article.
The duration was defined as the % time <54 mg/dL during the L2 event. This definition differs from simply taking the difference in time between the start and end of the L2 event, as it excludes time with intermediate glucose values ≥54 mg/dL, but the alternative definition yielded the same conclusions. Importantly, we propose reporting L2 event duration with the L2 event frequency to possibly improve patient care and best understand the impact of new therapies and technologies on hypoglycemia exposure. Therefore, further standardization of the definition of L2 event duration is warranted. The present approach could easily be adopted in future research studies and possibly into the AGP report as it continues to evolve.
Conclusions
L2 event frequency and %T < 54 were strongly correlated, but the relationship differed by the L2 event duration. Therefore, to most accurately capture the clinical implications of hypoglycemia exposure, both frequency and duration of L2 events should be jointly summarized. Time-below-range metrics are composite measures that inherently reflect both duration and frequency of crossing a threshold of interest and represent core endpoints to summarize the overall amount of hypoglycemia exposure.
Authors’ Contributions
P.C.: Writing—original draft. R.T.L., M.C.R., R.M.B., G.D.S., V.N.S., S.P., J.L.S., and R.W.B.: Writing—review and editing. Z.L.: Writing—original draft and formal analysis.
Footnotes
Data Availability Statement
Data will not be made publicly available.
Author Disclosure Statement
P.C. reports no personal financial disclosures but reports that his current employer has received consulting payments on his behalf from Beta Bionics, Dexcom, and Zucara. R.T.L. and S.P. are employees of Zucara Therapeutics. Z.L. reports no personal financial disclosures but reports that her current employer has received consulting payments on her behalf from Beta Bionics, Tandem Diabetes Care, and Zucara. M.C.R. reports speaker fees from Novo Nordisk, Insulet Corporation, and Dexcom Inc; has received consultant fees from Insulet Corporation, Eli Lilly, Zucara Therapeutics and Dexcom Inc.; and is founder and shareholder in Zucara Therapeutics. R.M.B. has received research support, has acted as a consultant, or has been on the scientific advisory board for Abbott Diabetes Care, Amgen, CeQur, Dexcom, Eli Lilly, Insulet, Luna Health, Medtronic, Novartis, Novo Nordisk, Roche-Genentech, Sanofi, Sequel, Tandem Diabetes Care, United Healthcare, Vertex Pharmaceuticals, and Zealand Pharma. R.M.B.’s employer, HealthPartners Institute, contracts with the listed companies for his services, and no personal income from any of these services goes to R.M.B. G.D.S. reports no personal financial disclosures but reports that his institution has received education grants and consulting fees from Abbott Diabetes Care and Dexcom. V.N.S.’ institution has received research support from Dexcom, Medtronic, Eli Lilly, Enable Bioscience, Alexion, Zucara Therapeutics, Cystic Fibrosis Foundation, DEKA Research, Breakthrough T1D, and National Institutes of Health (NIH). V.N.S. has received honoraria from Sanofi, NovoNordisk, Eli Lilly, Dexcom, Insulet, Tandem Diabetes Care, Medtronic, Sequel Med Tech, Biomea Fusion, Embecta, Roche, and T1D Scout, outside of this submitted work. J.L.S. institution has received research support from Abbott Diabetes, Dexcom, Breakthrough T1D, Insulet, Medtronic, NIH, Provention Bio, and the T1D Exchange; she consults for Abbott Diabetes, Insulet, Medscape, Medtronic Diabetes, Vertex, and Ypsomed; and served on an advisory board for Cecelia Health, Insulet, MannKind, Medtronic Diabetes, Sequel Med Tech, StartUpHealth T1D Moonshot, and Vertex; has received research support from Abbott Diabetes, Dexcom, JDRF/Breakthrough T1D, Insulet, Medtronic, NIH, and Provention Bio. R.W.B. reports no personal financial disclosures but reports that his institution has received funding on his behalf as follows: grant funding, study supplies, and consulting fees from Insulet, Tandem Diabetes Care, and Beta Bionics; grant funding and study supplies from Dexcom; grant funding from Bigfoot Biomedical; study supplies from Medtronic, Ascencia, and Roche; consulting fees and study supplies from Eli Lilly and Novo Nordisk; and consulting fees from Embecta, Sequel Med Tech, Vertex, Hagar, Ypsomed, Sanofi, and Zucara.
Funding Information
Research reported in this publication was supported by
Supplemental Material
References
Supplementary Material
Please find the following supplemental material available below.
For Open Access articles published under a Creative Commons License, all supplemental material carries the same license as the article it is associated with.
For non-Open Access articles published, all supplemental material carries a non-exclusive license, and permission requests for re-use of supplemental material or any part of supplemental material shall be sent directly to the copyright owner as specified in the copyright notice associated with the article.