
Abstract
Background:
Cross-sectional associations between continuous glucose monitoring (CGM) metrics and diabetic kidney disease (DKD) have been reported, but evidence based on longitudinal CGM metrics collected over extended periods has remained limited.
Objective:
To evaluate the relationship between longitudinal CGM metrics and albuminuria in diabetes.
Methods:
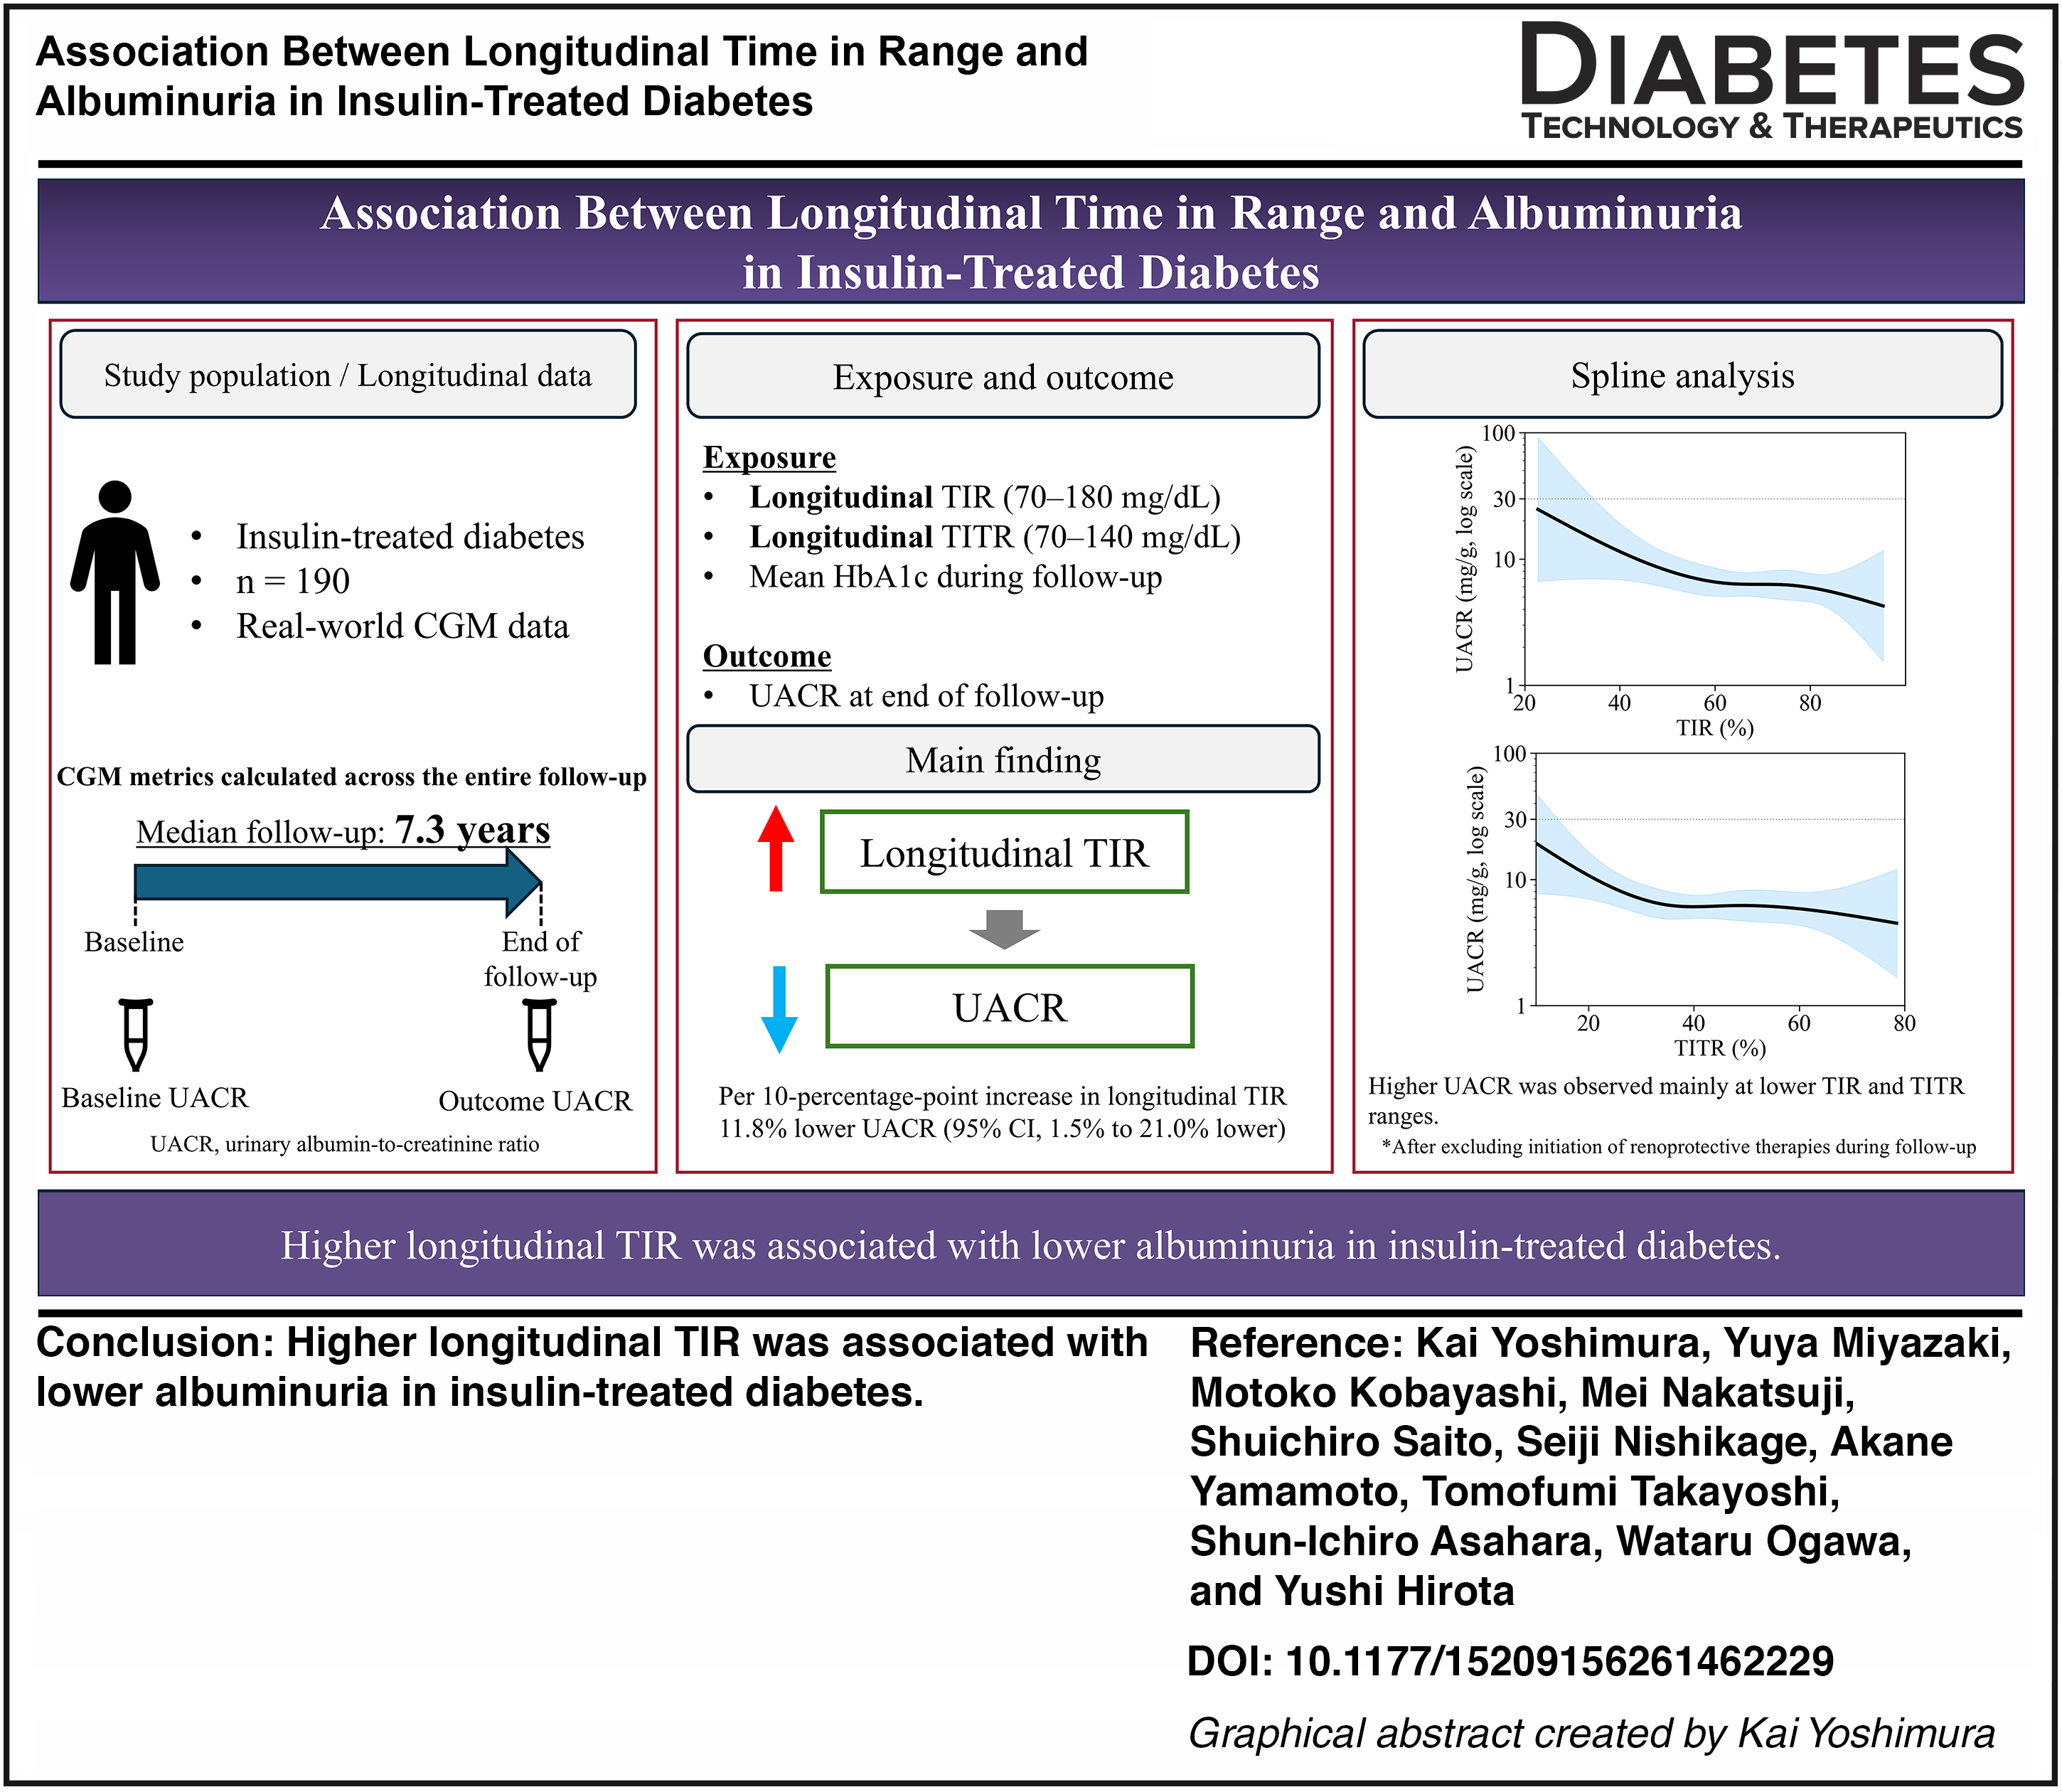
A single-center, retrospective, longitudinal observational study was conducted for 190 individuals with insulin-treated diabetes who had at least 3 years of CGM data. The primary exposure was time in range (TIR) across follow-up, with secondary exposures being time in tight range (TITR) and mean glycated hemoglobin (HbA1c) level. The primary outcome was the urinary albumin-to-creatinine ratio (UACR) measured closest to the end of follow-up. Multivariable linear regression and restricted cubic spline analyses were performed.
Results:
Over a median follow-up of 7.3 years, each 10-percentage-point increase in TIR was associated with an 11.8% decrease in UACR (95% confidence interval [CI], 1.5%–21.0% decrease). TITR showed a similar direction of association, but this association was not statistically significant. Each 1-percentage-point decrease in mean HbA1c level was associated with a 21.0% decrease in UACR (95% CI, 4.4%–34.6% decrease). Restricted cubic spline analysis suggested possible nonlinear associations for TIR and TITR, although these patterns were attenuated in sensitivity analyses.
Conclusions:
Longitudinal CGM metrics, in particular TIR, were associated with albuminuria in diabetes, providing support for their clinical relevance for DKD.
Introduction
Diabetic kidney disease (DKD) is responsible for many cases of end-stage renal disease. 1 Prevention of diabetes-related complications, including DKD, remains a major challenge in diabetes care, but is essential for the prolongation of healthy life expectancy in individuals with this condition. Achievement of good glycemic management is important for the prevention of the onset and progression of DKD,2,3 with continuous glucose monitoring (CGM) having recently become widely adopted as a tool for detailed assessment of such management. 4 CGM provides a comprehensive glycemic profile, and target ranges for its metrics have been proposed. 5 However, given that the use of CGM metrics is relatively new, the evidence linking them to diabetes-related complications remains less well established than that for glycated hemoglobin (HbA1c). Several cross-sectional studies have reported associations between CGM metrics measured over periods ranging from several days to several weeks and diabetes-related complications.6,7 Given the chronic nature of these complications, however, studies based on longitudinal CGM metrics are needed for better evaluation of such associations, and evidence based on such longitudinal data remains limited. Among studies that have attempted to address this gap, an analysis based on seven-point fingerstick blood glucose measurements from the Diabetes Control and Complications Trial found that time in range (TIR) derived from the seven-point glucose profile was inversely associated with the development of retinopathy and microalbuminuria. 8 Longitudinal associations between retinopathy and CGM-derived TIR, as well as other CGM metrics, have also been reported.9,10
As far as we are aware, no study to date has examined the relationship between DKD-related complications and CGM metrics on the basis of longitudinal CGM data collected over several years. We therefore here evaluated the association between longitudinal CGM metrics and albuminuria, a key clinical marker of DKD, 11 in individuals with diabetes and available longitudinal CGM data.
Materials and Methods
Study design and participants
We performed a single-center, observational, longitudinal retrospective study. The primary objective was to evaluate the association between albuminuria and longitudinal TIR calculated across the entire follow-up period. Secondary objectives were to evaluate the association of albuminuria with longitudinal time in tight range (TITR) and with mean HbA1c level during the follow-up period. Eligible participants were individuals with diabetes aged ≥20 years who attended Kobe University Hospital between April 1, 2010, and June 30, 2025, and who had used CGM for ≥3 years. Individuals who declined participation on the basis of the publicly available study information were excluded. Also excluded were individuals with an active CGM time of <70% across the follow-up period, those without urinary albumin-to-creatinine ratio (UACR) data, those with an estimated glomerular filtration rate (eGFR) of <30 mL min−1 1.73 m−2, those who received chemotherapy during the follow-up period, those with a urological malignancy, and those who had undergone kidney transplantation. The time point corresponding to the earliest CGM data available within the study period was defined as baseline, and that corresponding to the most recent CGM data was defined as the end of follow-up. All procedures performed in this study of human participants were in accordance with the guidelines of the Declaration of Helsinki, and the study protocol was approved by the Ethics Committee of Kobe University Graduate School of Medicine (approval no. B250157; approval date, November 7, 2025). The ethics committee approved an opt-out consent approach via the hospital website, given the low risk to participants. The results are reported in accordance with the Strengthening the Reporting of Observational Studies in Epidemiology guidelines. 12
Outcomes
The primary outcome was the UACR measurement obtained closest to the end of follow-up. UACR (mg of albumin/g of creatinine) was determined from spot urine samples, with urinary albumin and creatinine being measured by immunoturbidimetry and an enzymatic method, respectively.
Exposures
Several measures of glycemic control were adopted. The primary exposure was longitudinal TIR, defined as the percentage of all available sensor glucose values between 70 and 180 mg/dL across the entire follow-up period. Two additional secondary exposures were longitudinal TITR, defined as the percentage of all available sensor glucose values between 70 and 140 mg/dL across the entire follow-up period, and the mean HbA1c level during follow-up. Mean sensor glucose was also calculated as an additional CGM-derived glycemic exposure. CGM metrics were calculated from all available CGM readings over the entire follow-up period, with data from multiple devices being pooled. Periods without available CGM readings were not imputed. Active CGM time was defined as the proportion of time with available CGM readings during the follow-up period, and all included participants had an active CGM time of ≥70% across follow-up. HbA1c was measured by high-performance liquid chromatography with an automated analyzer (ADAMS A1c HA-8190V or HA-8180T; ARKRAY, Kyoto, Japan). HbA1c values are reported in National Glycohemoglobin Standardization Program units (%).
Covariates
Covariates included sex, baseline age, baseline body mass index (BMI), baseline systolic blood pressure, baseline smoking status, follow-up duration, baseline eGFR, baseline ln(UACR), use of an angiotensin-converting enzyme inhibitor, angiotensin II receptor blocker, or mineralocorticoid receptor antagonist during follow-up, and use of a sodium–glucose cotransporter 2 (SGLT2) inhibitor during follow-up. Covariates were selected based on previous studies and clinical plausibility.13,14 Smoking status was categorized as current smoker, never smoker, or former smoker. The eGFR was calculated with the serum creatinine-based equation recommended for Japanese adults. 15
Clinical characteristics
In addition to the covariates described above, the presence of diabetes-related complications (neuropathy, retinopathy, and DKD) and diabetes type were assessed as clinical characteristics. Diabetic neuropathy was assessed on the basis of symptoms as well as quantitative sensory evaluations (vibration sensation and monofilament tests) and motor evaluations (patellar and ankle reflexes). 16 Diabetic retinopathy was classified as nonproliferative, preproliferative, or proliferative. 17 Type 1 diabetes was diagnosed according to the criteria of the Japan Diabetes Society.18,19
Statistical analysis
Data are presented as median values with the interquartile range (IQR). Given that the UACR was right-skewed and some values were 0, ln(UACR + 0.01) was adopted for analysis. Multivariable linear regression analysis was performed to evaluate the association of ln(UACR) with TIR, TITR, or mean HbA1c level. In an additional analysis, the association between ln(UACR) and mean sensor glucose was examined with the same unadjusted, main adjusted, and treatment-adjusted linear regression models. Pearson correlation coefficients were also calculated to evaluate the correlations of mean sensor glucose with TIR, TITR, and mean HbA1c level. For each exposure, an unadjusted model and two adjusted models were fitted. The main adjusted model included sex, age, baseline BMI, baseline systolic blood pressure, smoking status, follow-up duration, baseline eGFR, and baseline ln(UACR) as covariates. Use of an angiotensin-converting enzyme inhibitor, an angiotensin II receptor blocker, or a mineralocorticoid receptor antagonist during follow-up and the use of an SGLT2 inhibitor during follow-up were potential confounders. However, given that such use constituted a postbaseline variable, its adjustment might introduce collider bias. 20 Treatment information during follow-up was therefore not included in the main adjusted model. The treatment-adjusted model also included the treatment information during follow-up as covariates and was examined as a sensitivity analysis. For assessment of potential nonlinearity, restricted cubic spline models (degrees of freedom = 4) were fitted for TIR, TITR, and mean HbA1c level, with adjustment for the same covariates as in the main adjusted model. Several sensitivity analyses were performed to assess the robustness of the findings. Restricted cubic spline analyses for TIR and TITR were repeated after excluding participants with exposure values below the 2.5th percentile or above the 97.5th percentile of each exposure distribution. To improve temporal alignment between glycemic exposure and UACR assessment, lagged exposure analyses were performed with the use of TIR and TITR calculated during the final 1 and 2 years before the end of follow-up, with the same linear regression models as the primary analysis. To assess the influence of preexisting albuminuria, the primary linear regression and restricted cubic spline analyses were repeated after restricting the study population to participants with a baseline UACR of <30 mg/g. Additional sensitivity analyses were performed after excluding participants who initiated SGLT2 inhibitors, angiotensin-converting enzyme inhibitors, angiotensin II receptor blockers, or mineralocorticoid receptor antagonists during follow-up; in this restricted population, unadjusted and main adjusted linear regression models were fitted, and restricted cubic spline analyses were repeated. The main adjusted and treatment-adjusted models as well as restricted cubic spline analyses were also repeated without baseline ln(UACR) as a covariate. Finally, to account for potential temporal changes in CGM technology, the main adjusted and treatment-adjusted models were repeated with additional adjustment for the baseline calendar year as a continuous covariate. Given the retrospective, single-center observational design of the study, the study size was determined by the number of eligible participants with available data during the study period. Multicollinearity was assessed with the use of variance inflation factors, with values of <5 considered acceptable. Effect estimates are presented with 95% confidence intervals (CIs), and a two-sided P value of <0.05 was considered statistically significant for all analyses. All data processing, including longitudinal CGM data handling, and statistical analysis were performed with Python version 3.11.
Results
Baseline characteristics of the study participants
A total of 1284 individuals with diabetes used CGM at the Kobe University Hospital during the study period. Of these individuals, 409 met all the eligibility criteria, 219 of whom were excluded according to the exclusion criteria, with the remaining 190 being included in the study (Fig. 1). The baseline characteristics of the study participants are summarized in Table 1. Women accounted for 70.5% of the cohort, the median age was 47 years (IQR, 35–62 years), and the median BMI was 21.5 kg/m2 (20.3–23.8 kg/m2). Type 1 diabetes accounted for 83.7% of the cohort. The median eGFR was 84.2 mL min−1 1.73 m−2 (71.2–94.6 mL min−1 1.73 m−2), and the median UACR was 5.9 mg/g (3.1–14.1 mg/g), indicating that most participants had preserved kidney function.
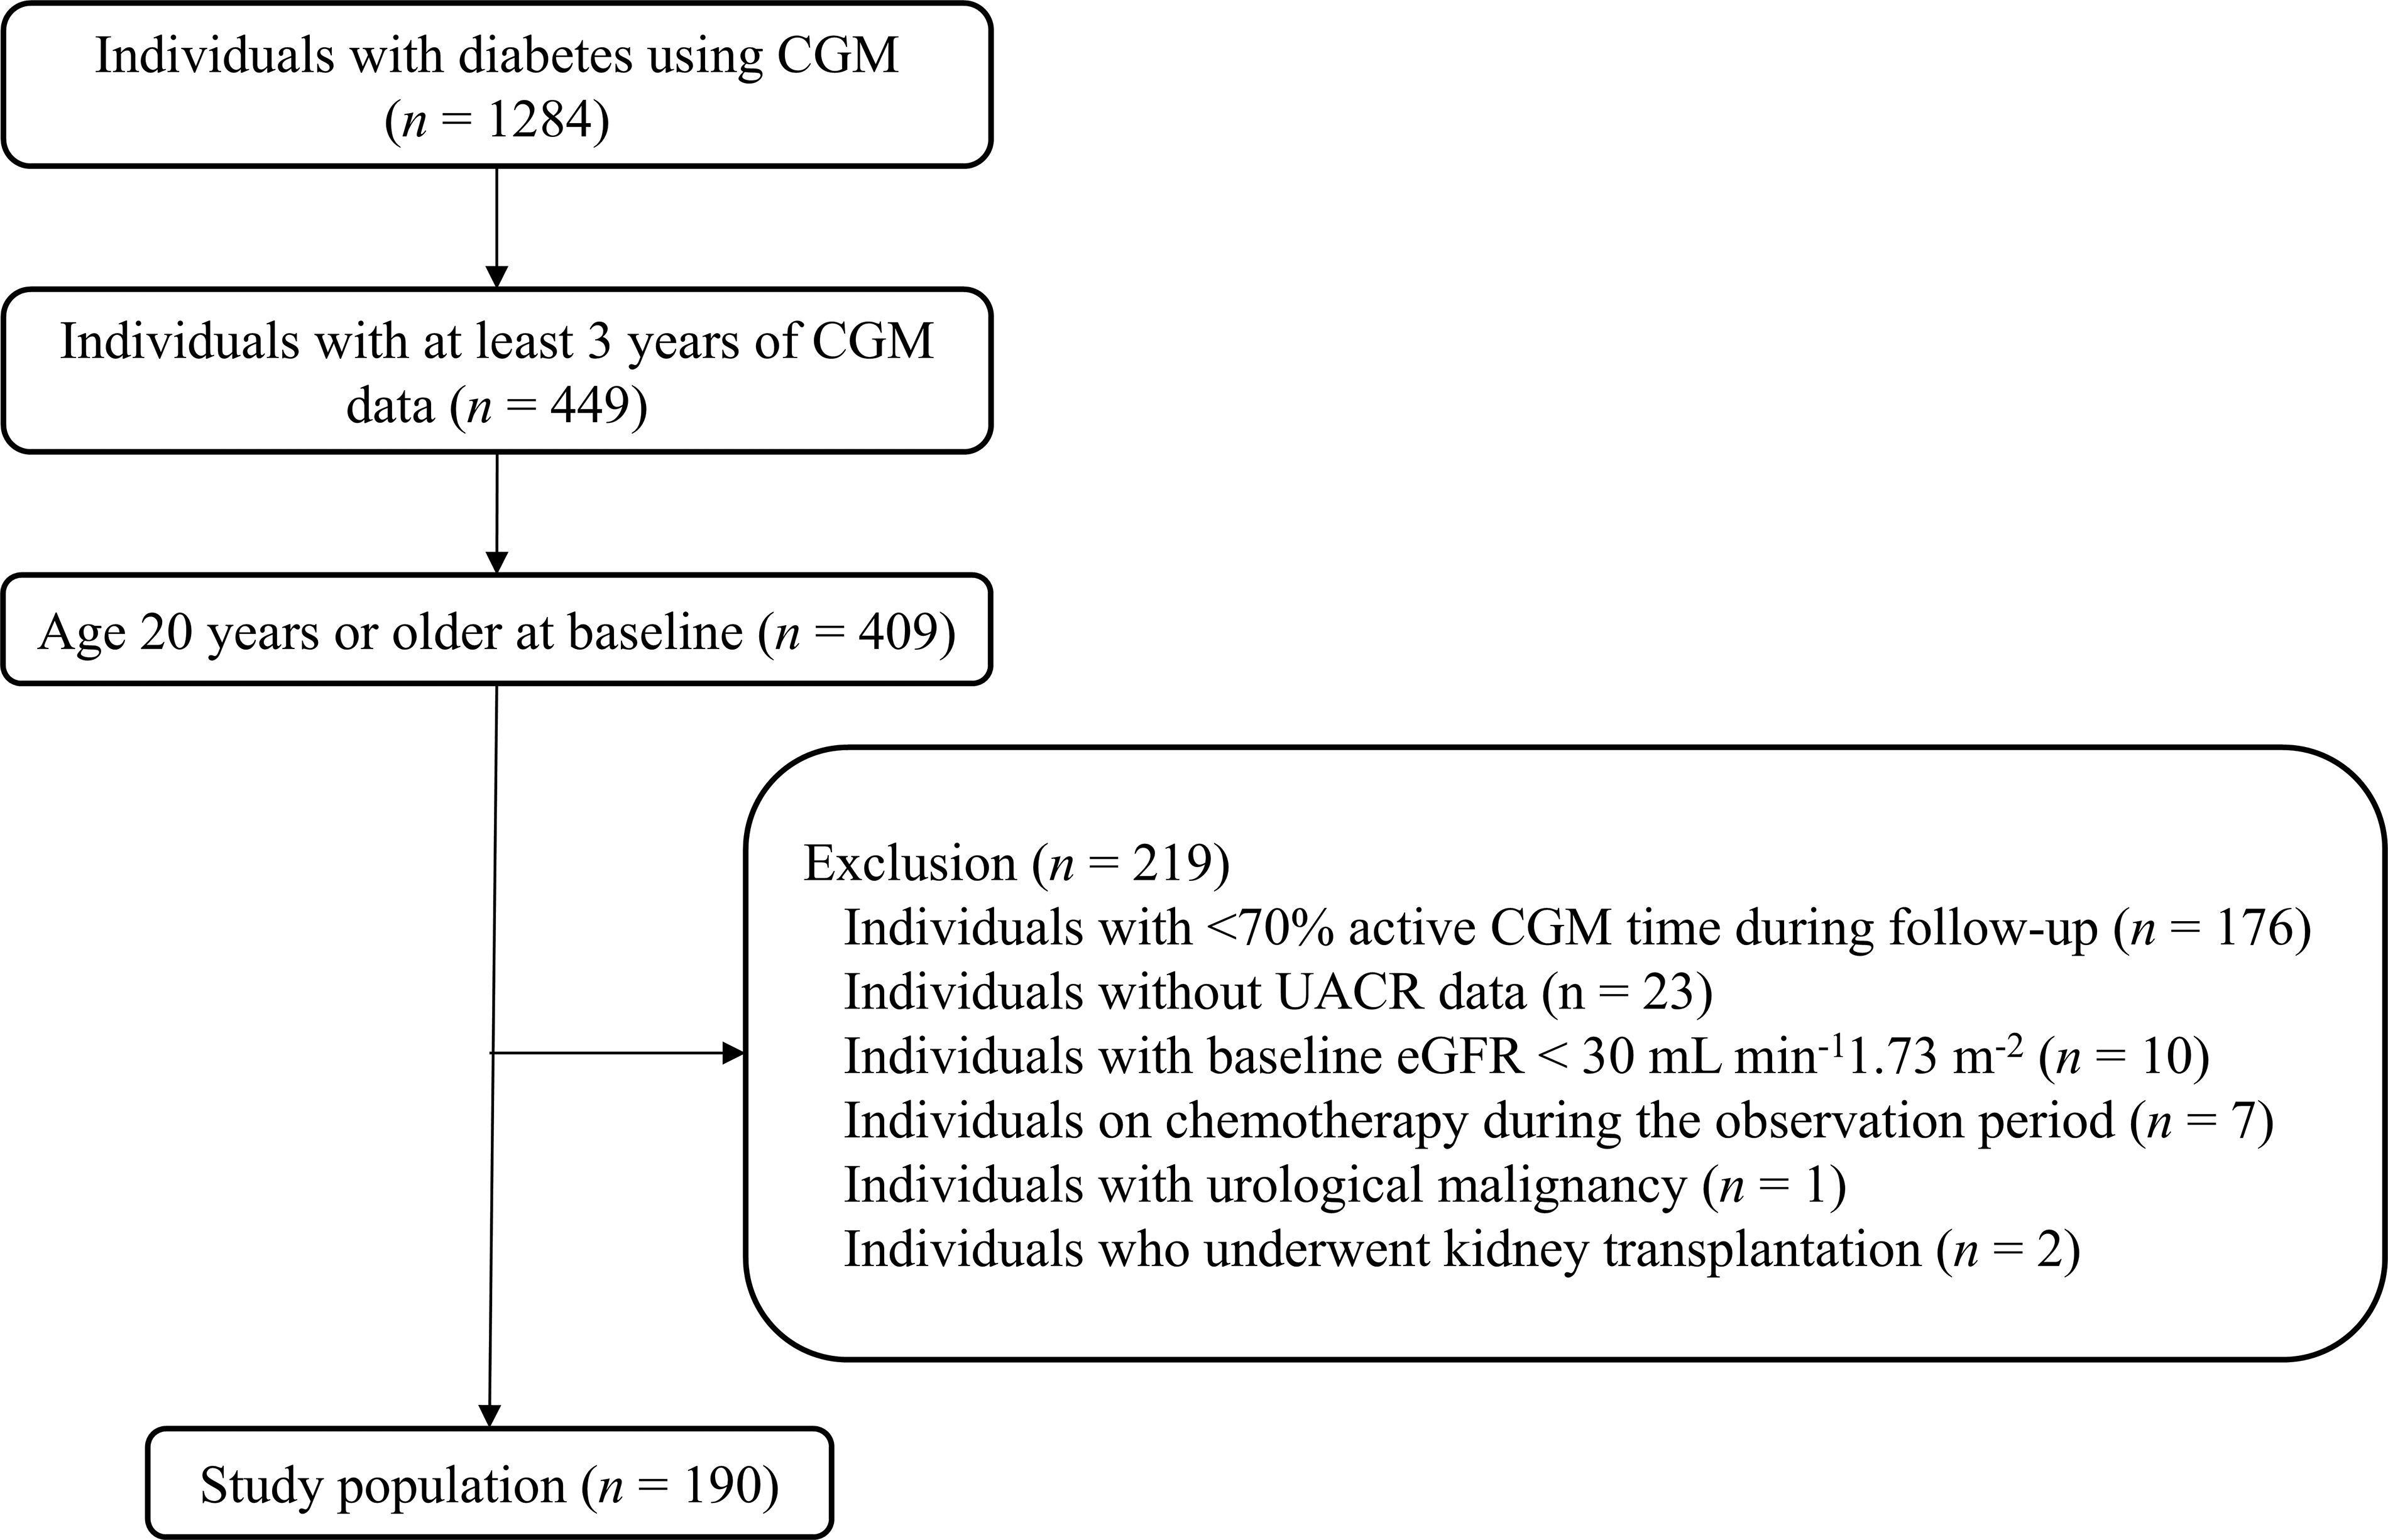
Derivation of the study population. CGM, continuous glucose monitoring; eGFR, estimated glomerular filtration rate; UACR, urinary albumin-to-creatinine ratio.
Characteristics of the Study Participants at Baseline (n = 190)
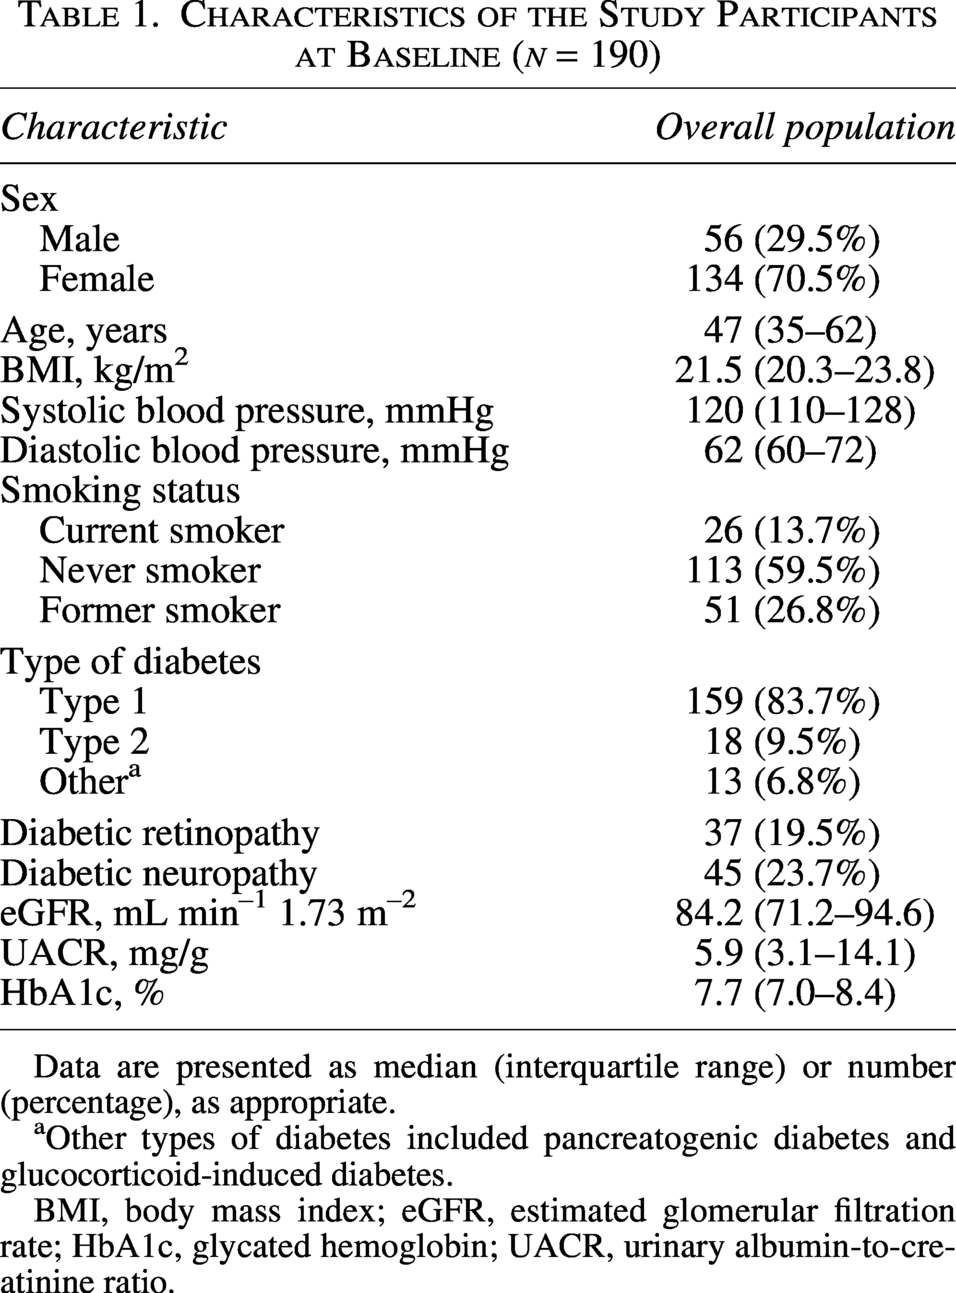
Data are presented as median (interquartile range) or number (percentage), as appropriate.
Other types of diabetes included pancreatogenic diabetes and glucocorticoid-induced diabetes.
BMI, body mass index; eGFR, estimated glomerular filtration rate; HbA1c, glycated hemoglobin; UACR, urinary albumin-to-creatinine ratio.
Follow-up glycemic, treatment, and clinical characteristics
Follow-up glycemic, treatment, and clinical characteristics are summarized in Table 2. The median follow-up duration was 7.3 years (4.6–8.1 years), and the median change in UACR was 0.3 mg/g (−3.1–5.3 mg/g). The time differences between the CGM-defined baseline and the corresponding UACR measurement, and between the end of follow-up and the corresponding UACR measurement, were 0 days (−14 to 70 days) and −87 days (−206 to 28 days), respectively. The median of the mean HbA1c values during follow-up was 7.3% (6.8%–7.7%), and the median number of HbA1c measurements was 54 (35–70). The median proportion of time with active CGM during the follow-up period was 89.4% (80.1%–95.6%), and the median TIR was 68.4% (58.4%–77.6%). Mean sensor glucose was strongly correlated with TIR, TITR, and mean HbA1c level (Supplementary Table S9). Given that the insurance coverage for CGM in Japan is limited to insulin-treated individuals, all participants used insulin during follow-up. The CGM devices used in this study were FreeStyle Libre and FreeStyle Libre 2 (Abbott); Dexcom G4, Dexcom G6, and Dexcom G7; and Guardian 3 Sensor and Guardian 4 Sensor (Medtronic).
Follow-Up Glycemic, Treatment, and Clinical Characteristics (n = 190)
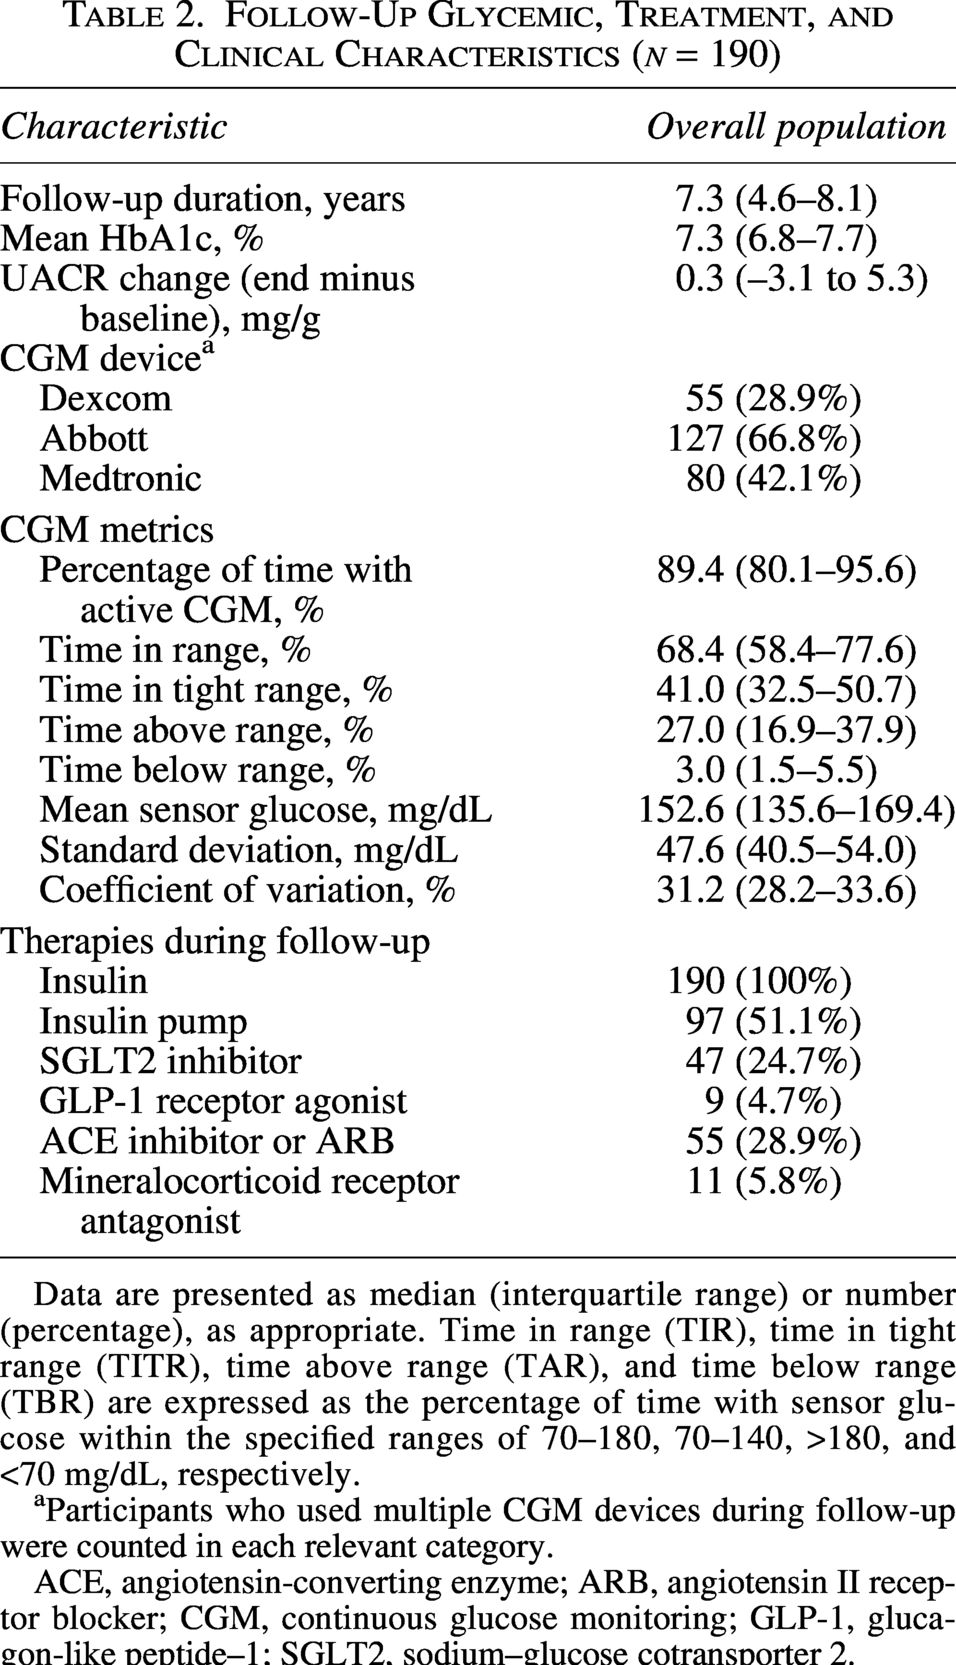
Data are presented as median (interquartile range) or number (percentage), as appropriate. Time in range (TIR), time in tight range (TITR), time above range (TAR), and time below range (TBR) are expressed as the percentage of time with sensor glucose within the specified ranges of 70–180, 70–140, >180, and <70 mg/dL, respectively.
Participants who used multiple CGM devices during follow-up were counted in each relevant category.
ACE, angiotensin-converting enzyme; ARB, angiotensin II receptor blocker; CGM, continuous glucose monitoring; GLP-1, glucagon-like peptide–1; SGLT2, sodium–glucose cotransporter 2.
Association between glycemic metrics and UACR
The relationships between UACR and glycemic metrics in the unadjusted, main adjusted, and treatment-adjusted models are shown in Table 3. Because ln(UACR) was used as the outcome, the estimates were back-transformed and are interpreted as percentage differences in UACR associated with each specified change in the exposure. There were no missing data for the exposures or covariates included in the regression models among the study participants. TIR showed little association with the UACR in the unadjusted model. In the main adjusted model, however, each 10-percentage-point increase in TIR was associated with an 11.8% decrease in UACR (95% CI, 1.5%–21.0% decrease). Also in the main adjusted model, each 10-percentage-point increase in TITR was associated with a 9.2% decrease in UACR, but in this instance, the 95% CI included the null (95% CI, 1.4% increase to 18.7% decrease). Mean HbA1c level was associated with the UACR in all models. In the main adjusted model, each 1-percentage-point decrease in HbA1c was associated with a 21.0% decrease in UACR (95% CI, 4.4%–34.6% decrease). Across all glycemic metrics, the treatment-adjusted model yielded estimates similar to those obtained with the main adjusted model. In an additional linear regression analysis, the estimates for mean sensor glucose were directionally consistent with the primary TIR analysis, although the 95% CIs included the null in the adjusted models (Supplementary Table S8). The association of glycemic metrics with UACR, modeled with restricted cubic splines and displayed on the original UACR scale using a logarithmic vertical axis, is shown in Figure 2. The P values for nonlinearity were 0.004 for TIR, 0.001 for TITR, and 0.176 for mean HbA1c level, indicative of nonlinearity for TIR and TITR. The restricted cubic spline curves revealed that UACR reached its nadir at ∼70%–80% for TIR and ∼40%–50% for TITR, and it then increased as the CGM metrics decreased below these ranges. Sensitivity analyses were performed to evaluate the robustness of these findings. Histograms showed relatively sparse observations at the tails of the TIR, TITR, and mean HbA1c distributions (Supplementary Fig. S1). After exclusion of extreme exposure values, the upward trend at higher TIR levels was attenuated, whereas the nonlinear pattern for TITR was generally preserved (Supplementary Fig. S2). In lagged exposure sensitivity analyses using TIR and TITR calculated during the final 1 and 2 years before the end of follow-up, the estimates were generally in the same direction as those in the primary analysis, although the 95% CIs often included the null (Supplementary Table S1). In analyses restricted to participants with baseline UACR < 30 mg/g (n = 166), the estimates for TIR and TITR were generally in the same direction as those in the primary analysis (Supplementary Tables S2 and S3), and restricted cubic spline analyses showed nonlinear patterns similar to those in the primary analysis (Supplementary Fig. S3). After exclusion of participants who initiated SGLT2 inhibitors, angiotensin-converting enzyme inhibitors, angiotensin II receptor blockers, or mineralocorticoid receptor antagonists during follow-up, 128 participants were included, and the corresponding estimates were generally in the same direction as those in the primary analysis (Supplementary Table S4). In restricted cubic spline analyses of this population, the upward trends at higher TIR and TITR levels were attenuated (Fig. 3). Estimates were also generally similar to those in the primary analysis when the baseline ln(UACR) was excluded from the covariates and when the baseline calendar year was additionally included as a covariate (Supplementary Tables S5, S6, and S7 and Supplementary Fig. S4).
Association of Continuous Glucose Monitoring Metrics and Mean Glycated Hemoglobin Level with the Urinary Albumin-to-Creatinine Ratio
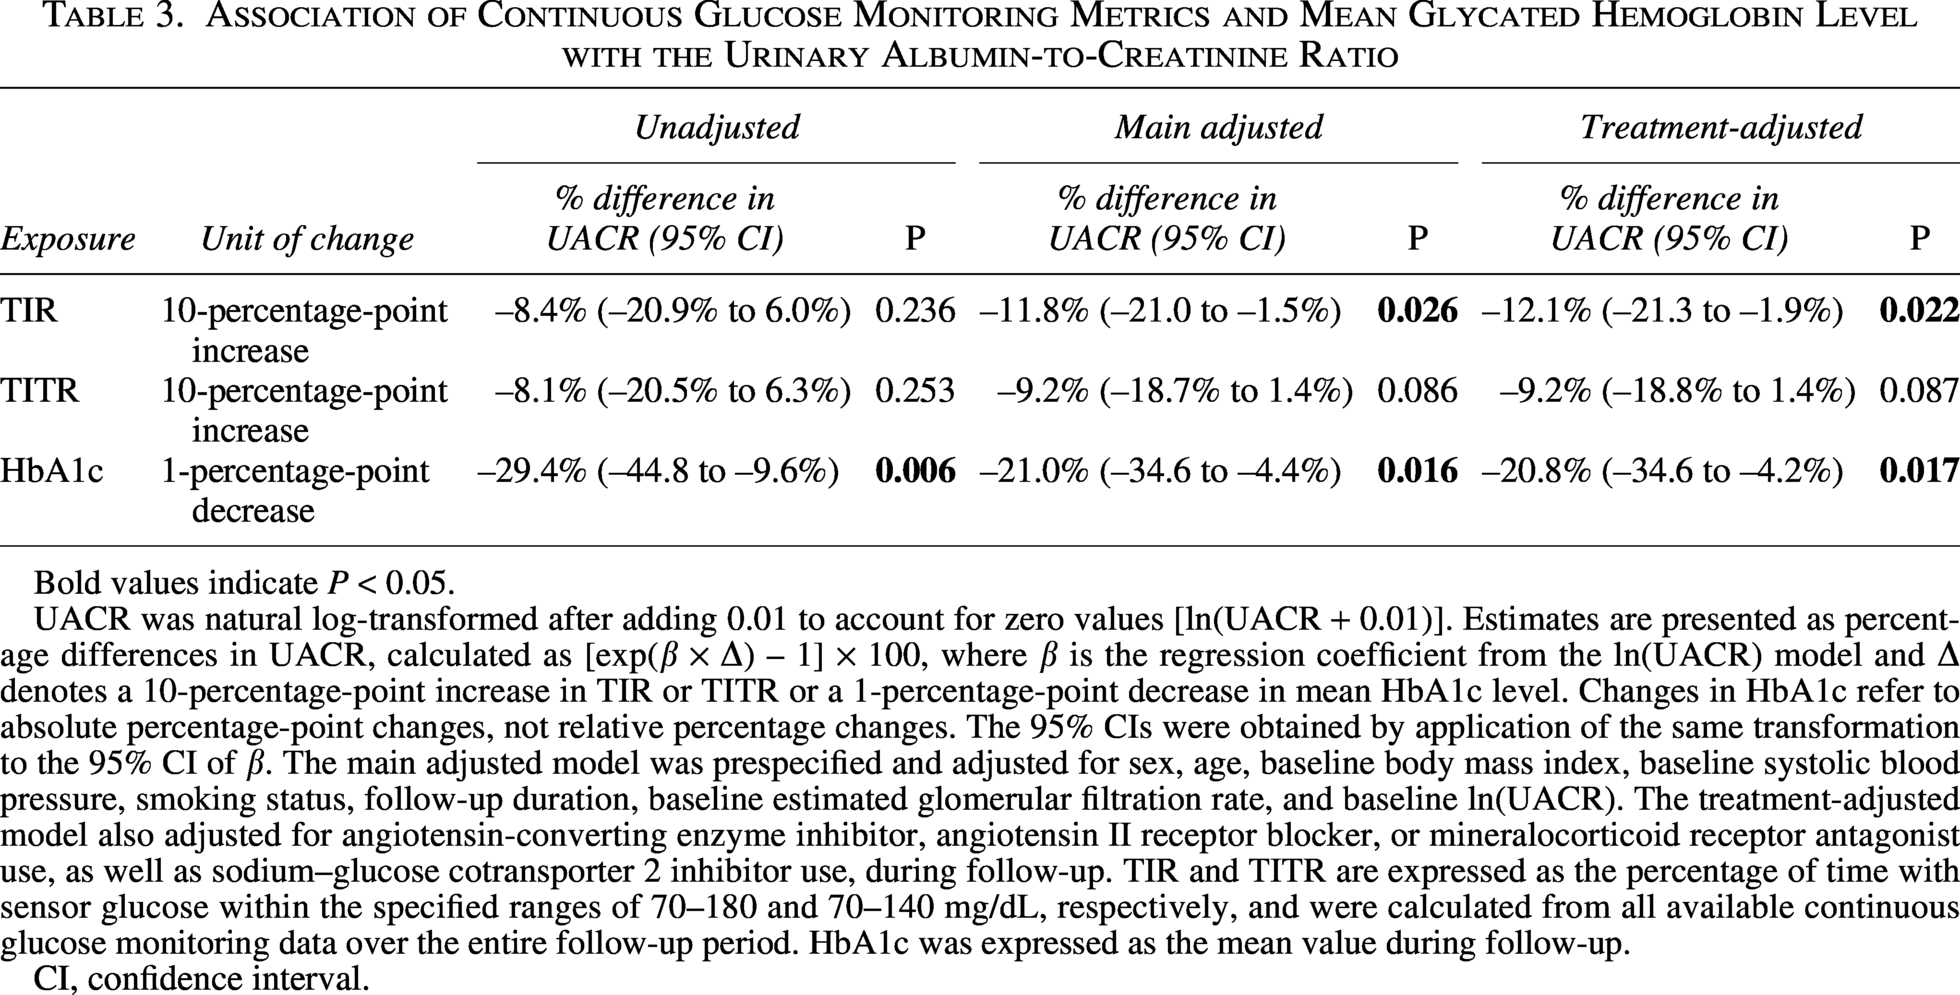
Bold values indicate P < 0.05.
UACR was natural log-transformed after adding 0.01 to account for zero values [ln(UACR + 0.01)]. Estimates are presented as percentage differences in UACR, calculated as [exp(β × Δ) – 1] × 100, where β is the regression coefficient from the ln(UACR) model and Δ denotes a 10-percentage-point increase in TIR or TITR or a 1-percentage-point decrease in mean HbA1c level. Changes in HbA1c refer to absolute percentage-point changes, not relative percentage changes. The 95% CIs were obtained by application of the same transformation to the 95% CI of β. The main adjusted model was prespecified and adjusted for sex, age, baseline body mass index, baseline systolic blood pressure, smoking status, follow-up duration, baseline estimated glomerular filtration rate, and baseline ln(UACR). The treatment-adjusted model also adjusted for angiotensin-converting enzyme inhibitor, angiotensin II receptor blocker, or mineralocorticoid receptor antagonist use, as well as sodium–glucose cotransporter 2 inhibitor use, during follow-up. TIR and TITR are expressed as the percentage of time with sensor glucose within the specified ranges of 70–180 and 70–140 mg/dL, respectively, and were calculated from all available continuous glucose monitoring data over the entire follow-up period. HbA1c was expressed as the mean value during follow-up.
CI, confidence interval.
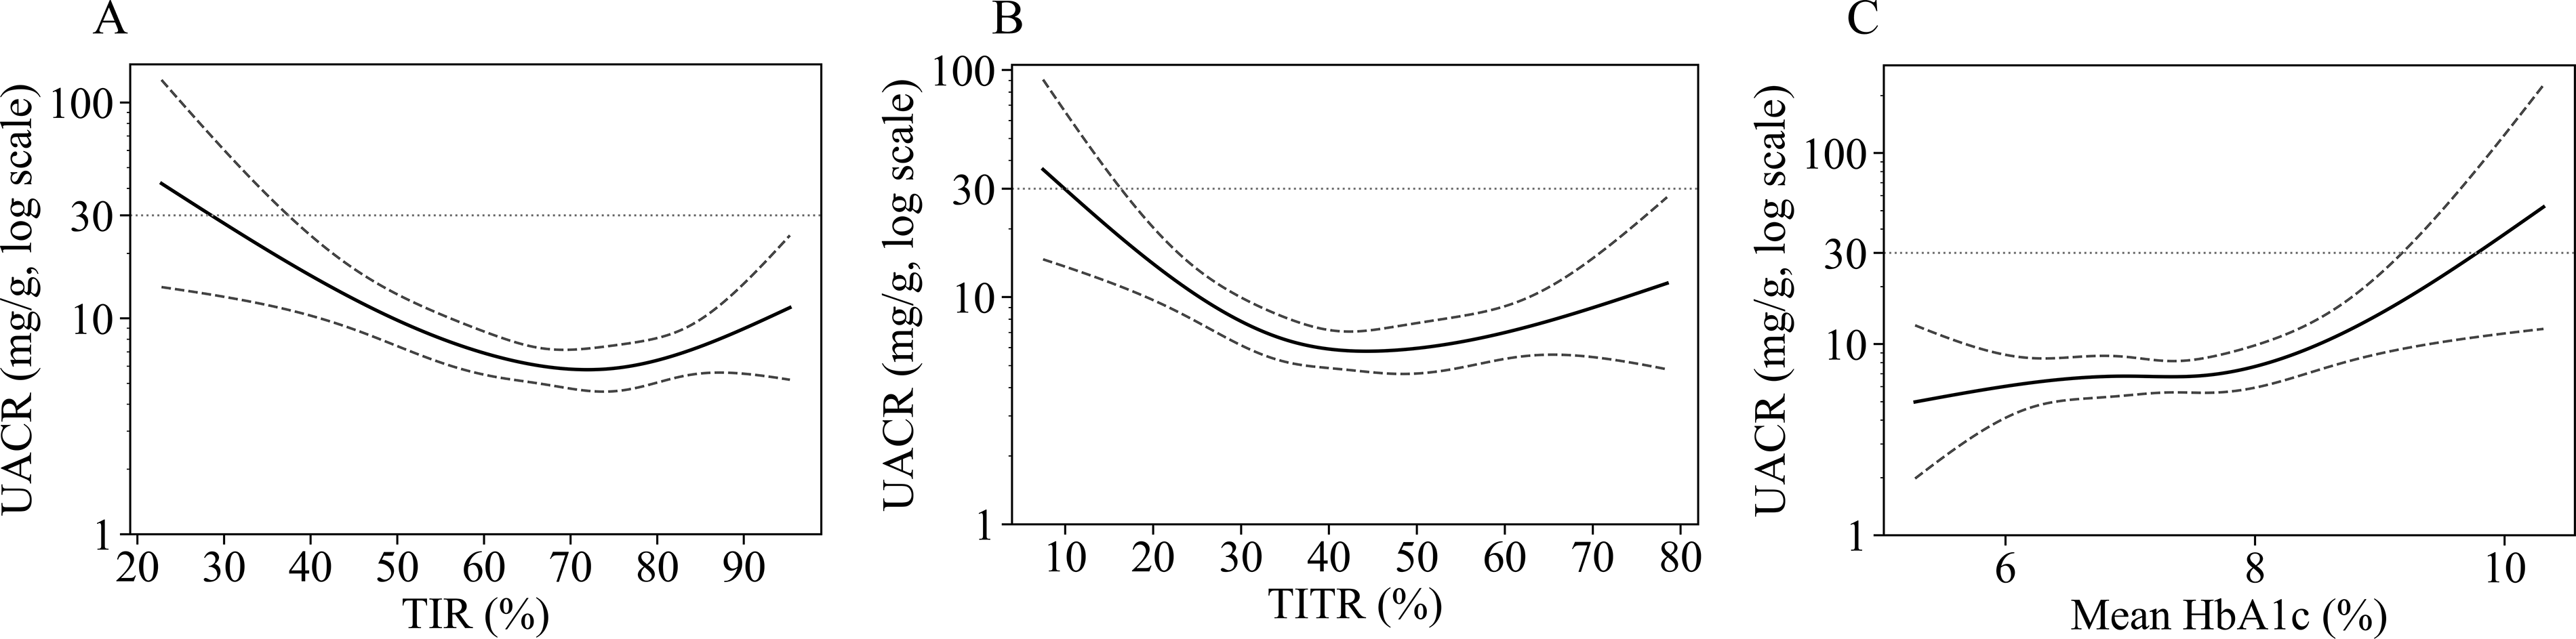
Restricted cubic spline curves for the association of glycemic metrics with UACR. Restricted cubic spline models were fitted for TIR
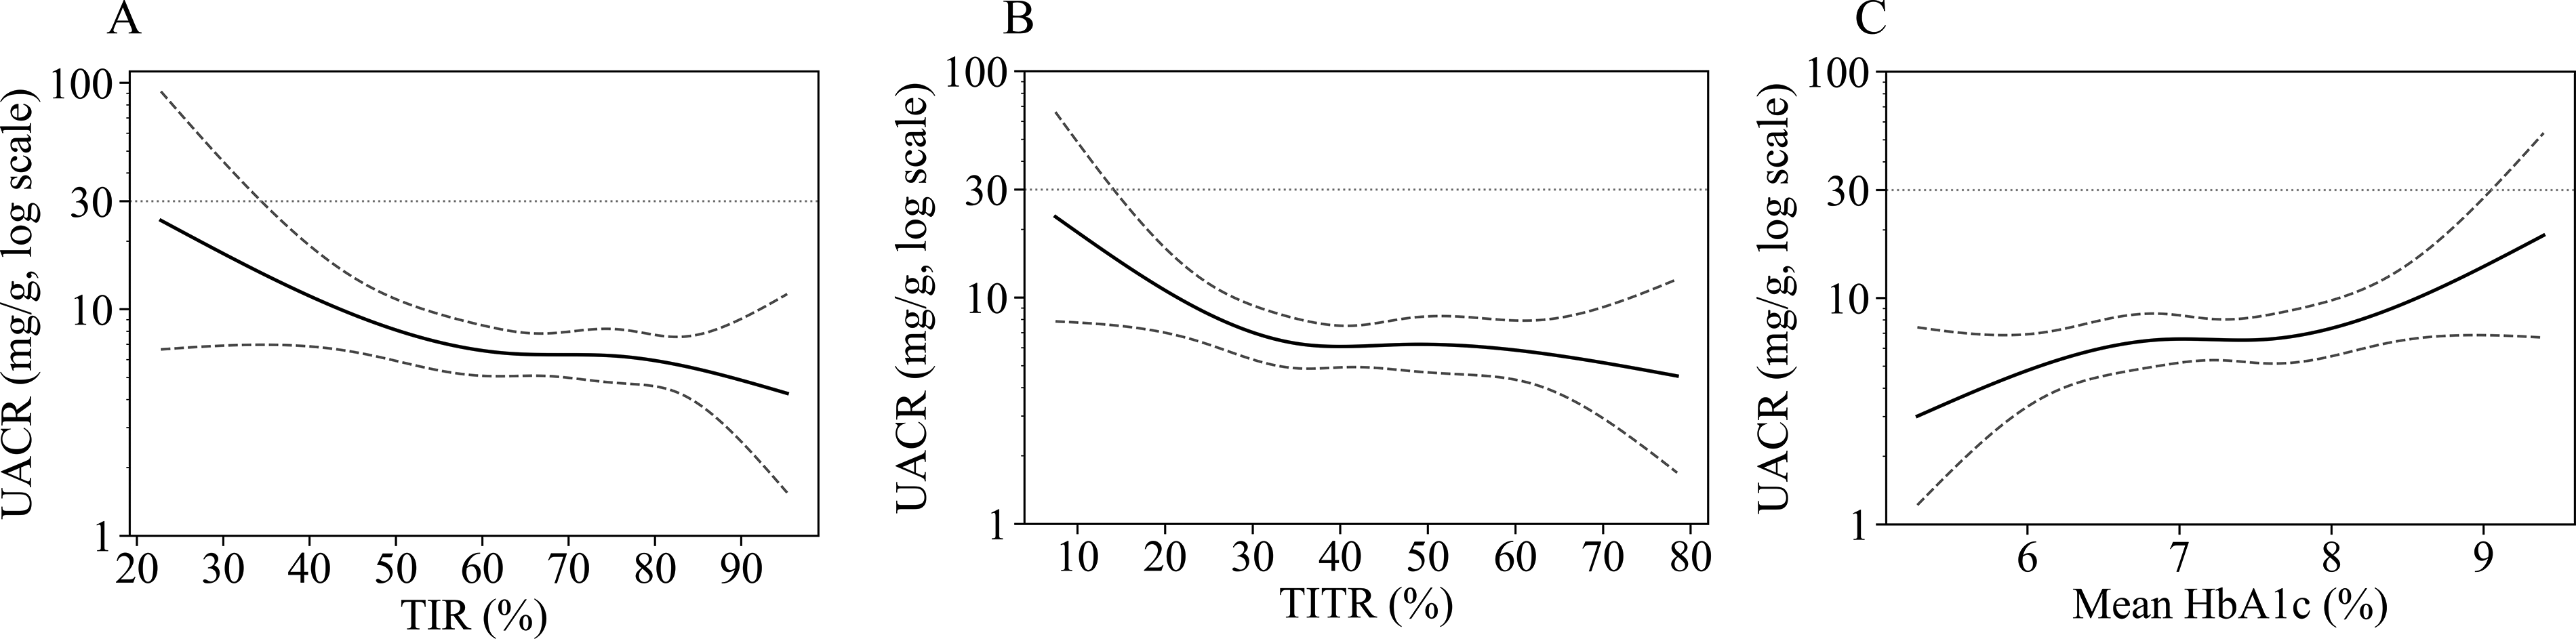
Restricted cubic spline curves for the association of glycemic metrics with UACR after exclusion of participants who initiated SGLT2 inhibitors, ACE inhibitors, ARBs, or MRAs during follow-up. Restricted cubic spline models were fitted for TIR
Discussion
As far as we are aware, this study is the first to evaluate the association between CGM metrics and albuminuria on the basis of longitudinal real-world CGM data collected over several years. In the main adjusted model, a higher TIR was associated with a lower UACR.
Previous studies have shown cross-sectional associations between CGM metrics and microvascular complications.6,7 In the case of DKD, cross-sectional studies have reported an inverse association between TIR and the incidence of albuminuria.21,22 However, assessments based on a single time point may not adequately reflect long-term exposure to hyperglycemia and make it difficult to clarify the temporal relationship between glycemic control and complications. A previous longitudinal study did examine this relationship over 1 year. Evaluation of changes in TIR and UACR in 26 individuals with type 1 diabetes, a baseline UACR of ≥30 mg/g, and treated with sensor-augmented pumps, thus revealed a significant association between increased TIR and decreased UACR. 23 However, the previous study had a relatively short follow-up period, focused on changes after the introduction of sensor-augmented pump therapy, and included only individuals who already had albuminuria. It therefore did not assess the association between albuminuria and glycemic exposure accumulated over a longer period in routine clinical practice. By adopting metrics calculated across a median follow-up of 7.3 years, the present study extends the evidence linking CGM metrics to DKD. Although TITR showed a directionally similar association with UACR, the evidence was less robust than that for TIR because the 95% CI included the null in the main adjusted model. In the present analysis, TIR appeared to capture the association with albuminuria more clearly than TITR. This finding may be physiologically plausible, given that albuminuria may be more strongly related to exposure to overt hyperglycemia than to variation within a tighter glucose range. Therefore, the association between TITR and albuminuria should be interpreted cautiously and requires further validation in larger cohorts. The restricted cubic spline analysis suggested that the association with higher UACR became stronger when TIR fell below ∼70%–80%. Of note, this range overlaps with the currently recommended target for TIR of ≥70%, suggesting that the observed pattern may be clinically coherent with existing CGM-based treatment goals. 5 At the same time, the spline curves at the extremes of the exposure distribution should be interpreted with caution. The apparent upward trends in UACR at higher TIR and TITR levels in the primary spline analyses differed from most previous reports, in which a higher TIR was generally associated with a lower prevalence or risk of albuminuria. 8 In the sensitivity analysis excluding participants who initiated renoprotective therapies during follow-up, these upward trends were attenuated, and similar attenuation was observed in some other sensitivity analyses. Therefore, the apparent increase in UACR at higher TIR or TITR levels may not necessarily indicate a biological effect of higher TIR or TITR itself, but may instead reflect treatment-related bias, sparse data at the extremes of the exposure distribution, or residual confounding. Because this study was based on longitudinal real-world CGM data, sensor glucose values obtained from multiple CGM devices were included. Although CGM technology has evolved rapidly and device accuracy has improved over time, sensitivity analyses with additional adjustment for baseline calendar year yielded estimates broadly similar to those in the primary analysis. The mean absolute relative difference reported by manufacturers for the CGM devices used in this study was generally less than ∼10% for adults. Nevertheless, because many participants used multiple CGM systems during follow-up with heterogeneous timing, direction, and frequency of device changes, device-specific effects and technological changes over time could not be fully separated from long-term glycemic exposure. Most participants in the study had preserved kidney function and low levels of albuminuria. Our findings may therefore be most relevant to individuals with relatively early-stage DKD. In addition, albuminuria has been associated with cardiovascular morbidity and all-cause mortality, and such associations have been reported even within the normoalbuminuric range.24,25 Evaluation of UACR in a population with relatively early-stage DKD, as in the present study, may therefore be of particular clinical importance.
Our study has several limitations. First, this was a single-center retrospective observational study with a modest sample size, and causal inferences cannot be drawn from the present findings. In addition, because individuals with type 1 diabetes accounted for 83.7% of the study population, most participants had relatively preserved kidney function, and most were East Asian, the generalizability of our findings to broader populations, including individuals with type 2 diabetes, advanced DKD, or other racial and ethnic backgrounds, may be limited. Second, UACR determination was based on spot urine samples and may therefore be more variable than that based on first-morning urine samples collected under standardized conditions. 26 Nevertheless, spot urine sampling is commonly used in routine clinical practice, and the use of data accumulated in real-world care settings may also be considered a strength of this study. Third, there were differences between the timing of UACR measurements and the time points corresponding to baseline and end of follow-up defined by CGM data availability, with median differences of 0 days (−14 to 70 days) and −87 days (−206 to 28 days), respectively. Although these differences were relatively small in relation to the median follow-up duration of 7.3 years, temporal misalignment between CGM-defined periods and UACR measurements cannot be completely excluded. Fourth, although albuminuria is an important marker for the management of DKD, it does not represent the entire spectrum of the disease, given that some individuals with DKD do not have albuminuria.11,27 Finally, because the study participants had a median mean HbA1c level of 7.3% (6.8%–7.7%) and a median TIR of 68.4% (58.4%–77.6%) during follow-up, the associations may not have been fully evaluated in ranges with relatively sparse data.
In conclusion, this study demonstrated the associations of longitudinal CGM metrics, particularly TIR, with albuminuria in individuals with insulin-treated diabetes. Further validation of these findings in broader and more diverse populations is warranted.
Authors’ Contributions
K.Y.: Conceptualization, methodology, software, validation, formal analysis, investigation, resources, data curation, writing—original draft, writing—review and editing, and visualization. Y.M., M.K., M.N., S.S., S.N., A.Y., and T.T.: Investigation, resources, and data curation. S.-I.A.: Conceptualization, methodology, and writing—review and editing. W.O.: Conceptualization, methodology, and writing—review and editing. Y.H.: Conceptualization, methodology, data curation, writing—original draft, writing—review and editing, supervision, and project administration.
Footnotes
Acknowledgments
K.Y., who was responsible for model development and analysis, received and completed education in data science at The University of Tokyo Chair for Global Consumer Intelligence. The article was edited by K.W. Brocklehurst, PhD, a professional scientific editor.
Ethical Considerations
This study received ethical approval from the Ethics Committee of Kobe University Graduate School of Medicine (approval no. B250157) on November 7, 2025. This retrospective study used deidentified patient data.
Consent to Participate
The requirement for written informed consent was waived by the ethics committee because of the retrospective nature of the study and the use of deidentified data. Information about the study was disclosed on the hospital website, and participants were given the opportunity to opt out.
Data Availability
The datasets generated and/or analyzed during the current study are not publicly available but are available from the corresponding author on reasonable request.
Author Disclosure Statement
K.Y. has received lecture fees from Novo Nordisk Pharma Ltd. T.T. has received lecture fees from Mochida Pharmaceutical Co. Ltd., Kowa Co. Ltd., Sumitomo Pharma Co. Ltd., Otsuka Pharmaceutical Co. Ltd., Taisho Pharmaceutical Co. Ltd., and Mitsubishi Tanabe Pharma Corp. S.-I.A. has received lecture fees from Bayer Yakuhin Ltd., Arkray Inc., Novo Nordisk Pharma Ltd., Sumitomo Pharma Co. Ltd., Sanofi, Otsuka Pharmaceutical Co. Ltd., Novartis Pharma K.K., MSD K.K., Mitsubishi Tanabe Pharma Corp., Daiichi Sankyo Co. Ltd., Nippon Boehringer Ingelheim Co. Ltd., Eli Lilly Japan K.K., AstraZeneca K.K., Ono Pharmaceutical Co. Ltd., Kowa Co. Ltd., and Sanwa Kagaku Kenkyusho Co. Ltd. W.O. has received lecture fees from Nippon Boehringer Ingelheim Co. Ltd., Sumitomo Pharma Co. Ltd., Eli Lilly Japan K.K., and Novo Nordisk Pharma Ltd., as well as research expenses (including for contracted research, joint research, and clinical trials) and grants from Eli Lilly Japan K.K., Nippon Boehringer Ingelheim Co. Ltd., Novo Nordisk Pharma Ltd., Noster Inc., Amgen K.K., and Sumitomo Pharma Co. Ltd. Y.H. has received lecture fees from Eli Lilly Japan K.K., Sanofi, Terumo Corp., Sumitomo Pharma Co. Ltd., Dexcom Japan G.K., and Novo Nordisk Pharma Ltd.; research support from Sumitomo Pharma Co. Ltd., Kyowa Kirin Co. Ltd., Nippon Boehringer Ingelheim Co. Ltd., Sanofi, and Medtronic Japan Co. Ltd.; and research expenses (including for contracted research, joint research, and clinical trials) and grants from Abbott Japan LLC. All the remaining authors declare no conflict of interest.
Funding Information
This work was supported by KAKENHI grants from Japan Society for the Promotion of Science to K.Y. (grant number 25K23972) and Y.H. (grant number 25K11805).
Supplemental Material
References
Supplementary Material
Please find the following supplemental material available below.
For Open Access articles published under a Creative Commons License, all supplemental material carries the same license as the article it is associated with.
For non-Open Access articles published, all supplemental material carries a non-exclusive license, and permission requests for re-use of supplemental material or any part of supplemental material shall be sent directly to the copyright owner as specified in the copyright notice associated with the article.