



Abstract
Objective:
To evaluate long-term trends in metabolic outcomes among people living with type 1 diabetes (T1D) within a nationwide structured care program in Belgium with full reimbursement of diabetes technologies.
Methods:
Repeated cross-sectional analyses were performed across three audit periods (2010–2011, 2017–2018, and 2023–2024). Outcomes included glycated hemoglobin (HbA1c), low-density lipoprotein (LDL) cholesterol, systolic blood pressure (SBP), and body mass index. Trends were analyzed using generalized estimating equations adjusted for age, sex, diabetes duration, insulin delivery, and glucose monitoring modalities. In 2023–2024, glycemic outcomes were compared across technology use, including hybrid closed-loop (HCL) therapy.
Results:
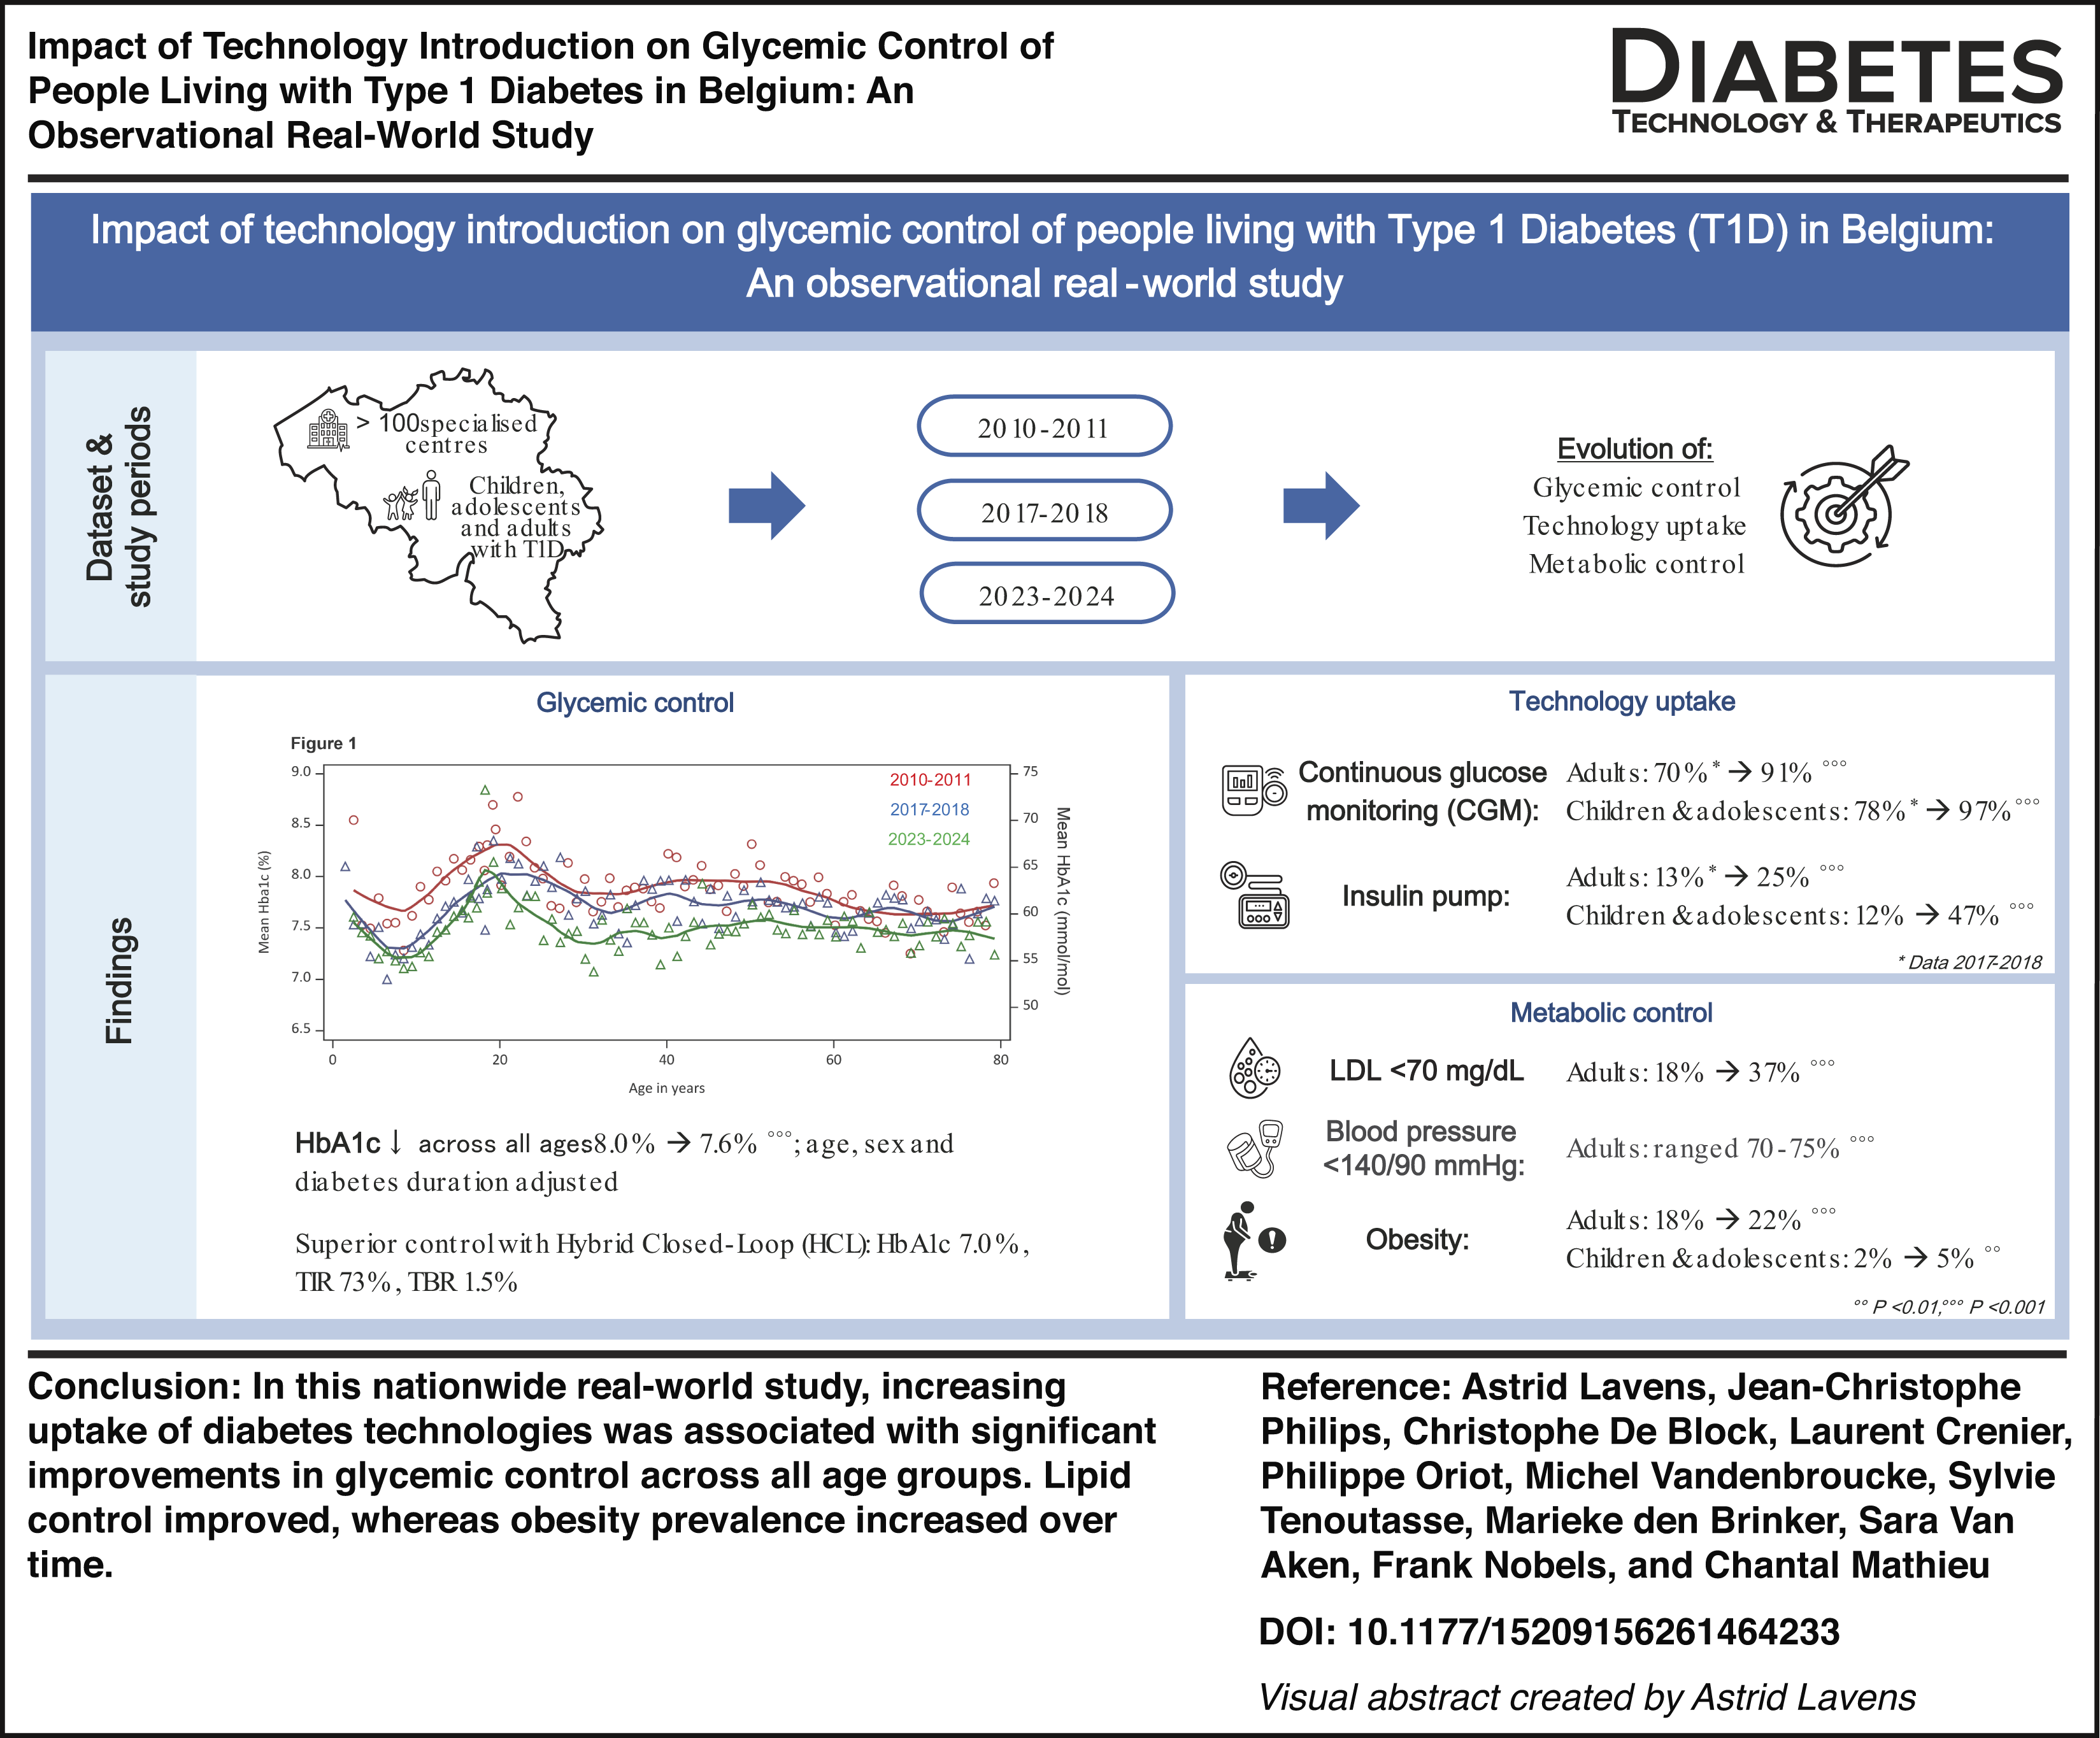
In adults, HbA1c decreased from 7.9% (62.8 mmol/mol) to 7.5% (58.5 mmol/mol, P < 0.001), with target attainment (<7%; <53 mmol/mol) increasing from 22.3% to 35.1%. In children and adolescents, HbA1c declined from 8.0% (63.5 mmol/mol) to 7.6% (59.0 mmol/mol, P < 0.01), and target attainment rose from 19.7% to 33.1% (P < 0.001). Continuous glucose monitoring (CGM) exceeded 90% by 2023–2024, while insulin pump use reached 25% in adults and 47% in younger individuals. In adults, HCL therapy was associated with lower HbA1c (7.0%; 53.5 mmol/mol), higher time-in-range (73%), and lower time-below-range (1.5%) compared with other modalities (P < 0.001). LDL cholesterol improved, with target attainment (<70 mg/dL; <1.8 mmol/L) increasing from 18.3% to 37.4% (P < 0.001), and from 15.5% to 46.5% among those with cardiovascular disease (<55 mg/dL; <1.4 mmol/L, P < 0.001). SBP remained stable. Obesity prevalence increased in all age groups.
Conclusions:
Over 14 years, glycemic and lipid outcomes improved alongside near-universal CGM use and increasing adoption of HCL therapy. However, rising obesity and persistent smoking-related risks highlight the need for targeted prevention strategies. These real-world data confirm that benefits seen in clinical trials translate into durable population-level improvements and support integrated care models for implementing diabetes technology effectively.
Introduction
Over the past decades, the management of people living with type 1 diabetes (T1D) has undergone major transformation, largely driven by advances in diabetes technology. The introduction of rapid- and long-acting insulin analogues, continuous subcutaneous insulin infusion (CSII), continuous glucose monitoring (CGM), and, more recently, hybrid closed-loop (HCL) insulin delivery systems has fundamentally reshaped therapeutic strategies. These advances have enhanced glucose sensing, enabled real-time data interpretation, and facilitated increasingly automated insulin delivery. In parallel, improvements in cardiovascular risk-factor management (including lipid and blood pressure control, weight management, and smoking prevention and cessation), along with earlier detection of complications and continuously updated evidence-based guidelines, have further strengthened modern diabetes care.
Despite these developments, achieving optimal metabolic control at the population level remains challenging. International registry data consistently show that a substantial proportion of individuals with T1D do not meet recommended glycemic targets, with marked variability observed across countries.1–5 Together, these observations suggest that technological innovation alone is insufficient to guarantee improved outcomes and emphasize the critical role of structured care models, equitable access, and systematic quality monitoring through national registries.
Since 1988, the National Institute for Health and Disability Insurance (NIHDI) has implemented a structured, nationwide health care program for individuals with diabetes requiring intensive insulin therapy, including both type 1 and insulin-treated type 2 diabetes (T2D). This Diabetes Convention framework delivers comprehensive, multidisciplinary specialist care (endocrinologists, diabetologists or pediatricians, specialized diabetes nurse educators, dieticians, psychologists, podiatrist [for adults], and social worker [for children and adolescents]) with a strong emphasis on therapeutic patient education and structured follow-up. It ensures full reimbursement of insulin preparations (including insulin analogues), insulin delivery modalities (including CSII for people with T1D since 2008 and, more recently, HCL systems), and glucose monitoring technologies. Sensor-based CGM has been reimbursed for people with T1D since 2016 (with restricted access since 2014) and, since 2023, for adults with T2D treated with multiple daily insulin injections. Consequently, the majority of people requiring intensive insulin therapy are followed in hospital-based specialist centers (100 centers for adults and 17 centers for children and adolescents) operating within this Diabetes Convention framework. In addition, the Diabetes Convention incorporates a mandatory national quality improvement initiative—the Initiative for Quality Improvement and Epidemiology in Diabetes (IQED) for adult centers and the Initiative for Quality Improvement and Epidemiology in Children and Adolescents with Diabetes (IQECAD) for pediatric centers—through which routine clinical data are collected and systematically fed back via center-level benchmarking and national reports to monitor patient characteristics, enhance quality of care, and support health care policy. Previous analyses have demonstrated that this integrated care model has been associated with progressive improvements in glycemic control, lipid and blood pressure profiles, 6 as well as reductions in retinopathy and albuminuria among individuals with T1D. 7 Despite these improvements, overweight, obesity, and combined metabolic abnormalities are increasingly being identified in people living with T1D. 8
Since our previous study, 6 the therapeutic landscape has further evolved, most notably with the widespread implementation of HCL insulin delivery systems. These systems, combining CGM with algorithm-driven automated insulin modulation, represent a major step toward automated glycemic management and have shown substantial benefits in randomized clinical trials. However, real-world data at a national level remain essential to evaluate their population-level impact within structured health care systems.
In this updated analysis, we therefore assess recent trends in metabolic outcomes and technology uptake—including HCL therapy—among people living with T1D followed within the Belgian Diabetes Convention framework, using contemporary data from the IQED and IQECAD registry.
Research Design and Methods
Data source
The IQED registry includes data on adults with T1D or T2D on intensive insulin therapy, aged 16 years or older (≥18 years between 2001 and 2015). Data have been collected cross-sectionally since 2001. Individuals with a history of pancreas or islet cell transplantation, dementia, or being pregnant at the time of data collection were not eligible for inclusion in the IQED study. Additionally, data of individuals receiving CSII therapy were not collected between 2006 and 2014. Centers conducted biennial audits, during which they retrospectively review patient records and complete a standardized electronic questionnaire for a representative 10% sample of their diabetes population, using the most recent data from the preceding year (=audit year). The 10% sample was defined by the first letter of the family name (adjusted to birth month from 2023 onward), chosen randomly at the start of each data collection period. To ensure data quality, inconsistencies are flagged, returned to the centers for verification, corrected when necessary, and reentered into the database. All data were pseudonymized. Detailed information on the parameters collected and the IQED data collection process is available online. 9
The IQECAD registry includes data on children and adolescents with T1D, aged <19 years, collected cross-sectionally since 2008. Individuals who were pregnant at the time of data collection and individuals who had not signed the informed consent were not eligible for inclusion in the IQECAD study. Centers conducted biennial audits, during which they retrospectively review patient records and complete a standardized electronic questionnaire for 100% of their diabetes population (a 50% sample prior to 2013), using the most recent data from the preceding year (=audit year). To ensure data quality, inconsistencies are flagged, returned to the centers for verification, corrected when necessary, and reentered into the database. All data were pseudonymized. Detailed information on the parameters collected and the IQECAD data collection process is available online. 10
Dataset and study period
For this study, registrations from adults with a clinical diagnosis of T1D, as recorded in electronic patient files, were selected from the IQED registry. The dataset included 12,444 registrations across three audit periods: September 2010 to August 2011 (defined as study period 2010–2011), October 2017 to September 2018 (defined as study period 2017–2018), and October 2023 to September 2024 (defined as study period 2023–2024). Individuals could contribute one registration per audit period and could therefore be represented multiple times in the dataset. Registrations with missing data on age (N = 1), diabetes duration (N = 151), insulin delivery or glucose monitoring method (N = 316), and glycated hemoglobin (HbA1c; N = 202) were excluded. Registrations from adults aged ≥80 years (N = 395) or with a diabetes duration <1 year (N = 211) were also excluded. To eliminate as much as possible misclassified T2D, registrations from adults using sulfonylureas, dipeptidyl peptidase-4 inhibitors, or glitazones were excluded (N = 60). The final dataset included 11,188 registrations.
Additionally, registrations from children and adolescents with a clinical diagnosis of T1D, as recorded in electronic patient files, were selected from the IQECAD registry. The dataset included 8046 registrations across three audit periods: January 2010 to December 2010 (defined as study period 2010), January 2017 to December 2017 (defined as study period 2017), and January 2023 to December 2023 (defined as study period 2023). Individuals could contribute one registration per audit period and could therefore be represented multiple times in the dataset. Registrations with missing data on sex (N = 1), diabetes duration (N = 34), insulin delivery or glucose monitoring method (N = 203), and HbA1c (N = 133) were excluded. Registrations from children and adolescents with a diabetes duration <1 year (N = 808) were also excluded. The final dataset included 6983 registrations.
Parameters
Data included the most recent anthropometric and biological characteristics, treatment, results of care, and complications related to diabetes registered in the patients’ medical files during the audit year. Details of the questionnaires are described in the publicly available reports of IQED and IQECAD.9,10
The low-density lipoprotein (LDL) cholesterol was measured in local labs or calculated by the Friedewald formula for the individuals with triglycerides <400 mg/dL (<4.5 mmol/L) regardless of the condition of the blood sample (fasted and non-fasted). 11
Children and adolescents (≥2 to <18 years) were classified as overweight or obese using the age- and sex-specific body mass index (BMI) (dividing weight by height squared) cutoffs reported by Cole et al. and used by the International Obesity Task Force. 12 These cutoffs lie on the centiles passing, at the age of 18, through the cutoffs for overweight (25 to <30 kg/m2) and obesity (≥30 kg/m2) for adults.
Severe hypoglycemia was defined as “Did the patient have episodes of severe hypoglycemia in the audit period?” where yes = 1, no = 0, and no answer = 9, with severe defined as semi- to completely unconscious status where the patient requires third-party assistance.
Diabetic ketoacidosis (DKA) was defined as “Was the patient admitted for ketoacidosis or for hyperosmolar hyperglycemic state (with or without ketosis) in the audit period?” where yes = 1, no = 0, and no answer = 9.
Treatment with statins as secondary prevention in adults was defined as treatment with statins in individuals with a cardiovascular disease (CVD), defined as presence of myocardial infarction, heart attack, percutaneous coronary intervention or coronary artery bypass graft, carotid revascularization (included since 2021 in the IQED questionnaire), or heart failure (included since 2021 in the IQED questionnaire).
The association between technology use and glycemic control was investigated in the adult data. Technology use was defined as use of multiple daily injections (MDI) alone, MDI in combination with CGM, CSII in combination with CGM, or HCL (included since 2023 in the IQED questionnaire). CGM metrics were based on the most recent available sensor download. Metrics were calculated only if average daily CGM use exceeded 70%, corresponding to ≥5 days per week of sensor wear. Time in range (TIR) was defined as the percentage of time over a 14–30 day period with glucose values between 70 and 180 mg/dL (3.9–10.0 mmol/L). Time below range (TBR) was defined as the percentage of time with glucose values <70 mg/dL (<3.9 mmol/L) during the same period. The coefficient of variation (CV) was calculated as the standard deviation (SD) of glucose divided by the mean glucose, expressed as a percentage, as a measure of glycemic variability.
Statistical analysis
Population characteristics are expressed as proportions for categorical variables, mean ± SD for normally distributed variables, and median (interquartile range) for nonnormally distributed variables. Statistical differences of the population characteristics between study periods were analyzed using generalized estimating equations (GEEs), using logistic regression for dichotomous outcome variables and the normal probability distribution for continuous outcome variables, with exchangeable correlation structure (diabetes center) and study period as dichotomous explanatory variable. Tukey-adjusted pairwise comparisons were performed for all group contrasts.
Data from adults, children, and adolescents from overlapping study periods were combined to analyze changes in glycemic control across the study periods. Average HbA1c by year of age was plotted for each study period. Locally Estimated Scatterplot Smoothing regression was used to fit a curve over the plotted averages. The association of HbA1c across study periods was tested by GEE as described above. The model was adjusted for age (continuous), sex, and diabetes duration (continuous). The GEE model predictions are presented with the corresponding 95% confidence intervals (CIs). The above analyses were repeated for LDL cholesterol and systolic blood pressure (SBP) using adult data only.
Age-specific treatment proportions across study periods were plotted for CSII, CGM, lipid-lowering therapy, statins, antihypertensive therapy, and angiotensin-converting enzyme (ACE) inhibitors and/or angiotensin II receptor blockers.
Among adults in the 2023–2024 study population, age, diabetes duration, HbA1c, TIR, TBR, CV, and acute complications were summarized descriptively according to technology use. Differences between technology groups were analyzed using GEE, with exchangeable correlation structure (diabetes center) and technology group as a dichotomous explanatory variable. Tukey-adjusted pairwise comparisons were performed for all group contrasts. The association between HbA1c and TIR and technology use was analyzed using GEE as described above, adjusting for sex, age (continuous), and diabetes duration (continuous). The adjusted mean HbA1c differences and corresponding 95% CIs were visualized graphically, with zero included as a reference line to indicate statistical differences between groups.
All P values were two sided. P values <0.05 were considered statistically significant. Data analyses were performed using SAS software version 9.4 (SAS Institute, Inc., Cary, NC).
Results
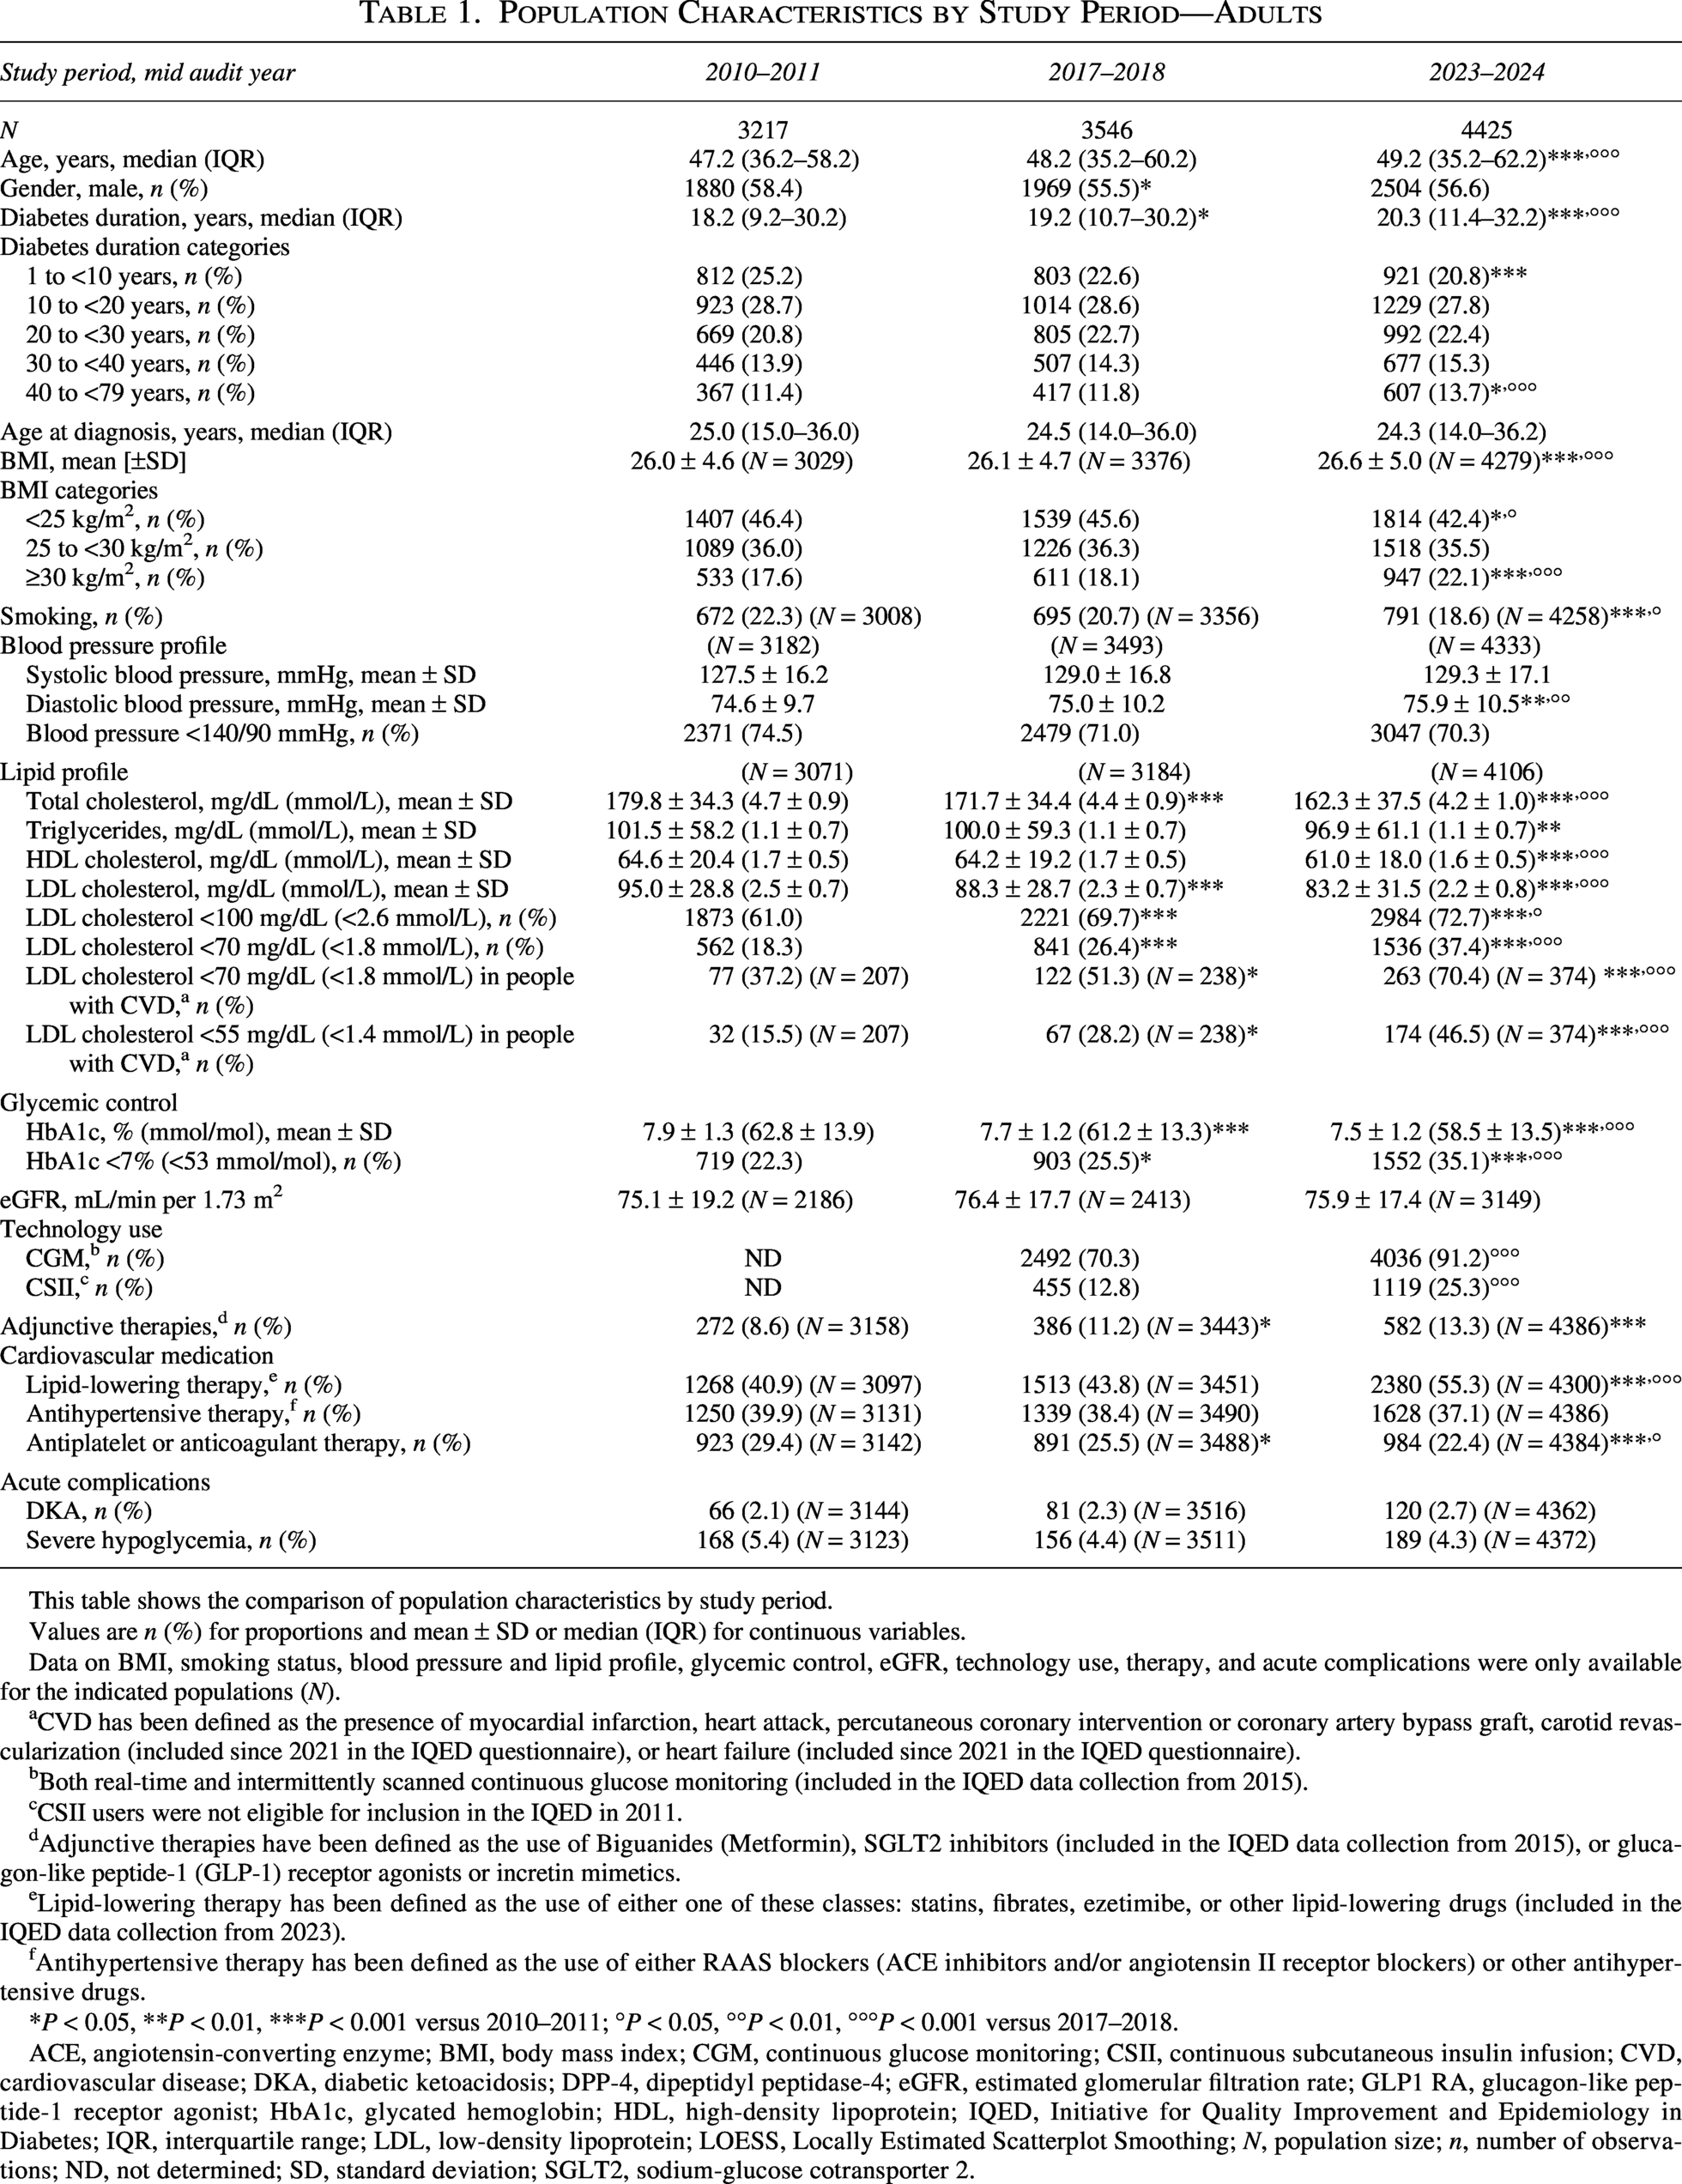
The population characteristics of the three study periods are shown in Table 1 (adults) and Supplementary Table S1 (children and adolescents). In the adult population, median age rose from 47.2 (36.2–58.2) years in 2010–2011 to 49.2 (35.2–62.2) years in 2023–2024 (P < 0.001), while the proportion of men remained stable at approximately 56%–58% (Table 1). Median diabetes duration increased from 18.2 (9.2–30.2) years to 20.3 (11.4–32.2) years (P < 0.001). Age at diagnosis remained unchanged at approximately 24–25 years. Smoking prevalence declined from 22.3% to 18.6% (P < 0.001). The prevalence of acute complications was low and remained largely stable over time, with <3% DKA across the three periods, while severe hypoglycemia was reported in 5.4%, 4.4%, and 4.3% of the adults, respectively.
Population Characteristics by Study Period—Adults
This table shows the comparison of population characteristics by study period.
Values are n (%) for proportions and mean ± SD or median (IQR) for continuous variables.
Data on BMI, smoking status, blood pressure and lipid profile, glycemic control, eGFR, technology use, therapy, and acute complications were only available for the indicated populations (N).
CVD has been defined as the presence of myocardial infarction, heart attack, percutaneous coronary intervention or coronary artery bypass graft, carotid revascularization (included since 2021 in the IQED questionnaire), or heart failure (included since 2021 in the IQED questionnaire).
Both real-time and intermittently scanned continuous glucose monitoring (included in the IQED data collection from 2015).
CSII users were not eligible for inclusion in the IQED in 2011.
Adjunctive therapies have been defined as the use of Biguanides (Metformin), SGLT2 inhibitors (included in the IQED data collection from 2015), or glucagon-like peptide-1 (GLP-1) receptor agonists or incretin mimetics.
Lipid-lowering therapy has been defined as the use of either one of these classes: statins, fibrates, ezetimibe, or other lipid-lowering drugs (included in the IQED data collection from 2023).
Antihypertensive therapy has been defined as the use of either RAAS blockers (ACE inhibitors and/or angiotensin II receptor blockers) or other antihypertensive drugs.
*P < 0.05, **P < 0.01, ***P < 0.001 versus 2010–2011; °P < 0.05, °°P < 0.01, °°°P < 0.001 versus 2017–2018.
ACE, angiotensin-converting enzyme; BMI, body mass index; CGM, continuous glucose monitoring; CSII, continuous subcutaneous insulin infusion; CVD, cardiovascular disease; DKA, diabetic ketoacidosis; DPP-4, dipeptidyl peptidase-4; eGFR, estimated glomerular filtration rate; GLP1 RA, glucagon-like peptide-1 receptor agonist; HbA1c, glycated hemoglobin; HDL, high-density lipoprotein; IQED, Initiative for Quality Improvement and Epidemiology in Diabetes; IQR, interquartile range; LDL, low-density lipoprotein; LOESS, Locally Estimated Scatterplot Smoothing; N, population size; n, number of observations; ND, not determined; SD, standard deviation; SGLT2, sodium-glucose cotransporter 2.
In children and adolescents, the median age ranged from 13.5 to 14.5 years, diabetes duration ranged from 5.0 to 5.4 years, 51.6%– 53.7% were male, and age at diagnosis ranged from 7.2 to 7.4 years (Supplementary Table S1). The prevalence of acute complications was low and remained largely stable over time, with <5% experiencing DKA and <6% hypoglycemia across the three periods.
Glycemic control
Glycemic control in adults improved between 2010–2011 and 2023–2024, with mean HbA1c declining from 7.9 ± 1.3% to 7.5 ± 1.2% (62.8 ± 13.9 to 58.5 ± 13.5 mmol/mol, P < 0.001) and HbA1c <7% (<53 mmol/mol) increasing from 22.3% to 35.1% (P < 0.001, Table 1). Use of CGM and CSII increased markedly by 2024 (from 70.3% to 91.2% and from 12.8% to 25.3%, respectively, P < 0.001). Use of (off-label) adjunctive therapy increased from 8.6% to 13.3% (P < 0.001).
We observed the same evolution in children and adolescents (Supplementary Table S1): mean HbA1c declined from 8.0 ± 1.3% in 2010 to 7.6 ± 1.2% in 2023 (63.5 ± 14.4 to 59.0 ± 13.2 mmol/mol, P < 0.01) and HbA1c <7% (<53 mmol/mol) increased from 19.7% to 33.1% (P < 0.001). In 2023, the use of CGM and CSII was 96.6% and 46.9%, respectively. Data on the use of adjunctive therapy were not available for children and adolescents.
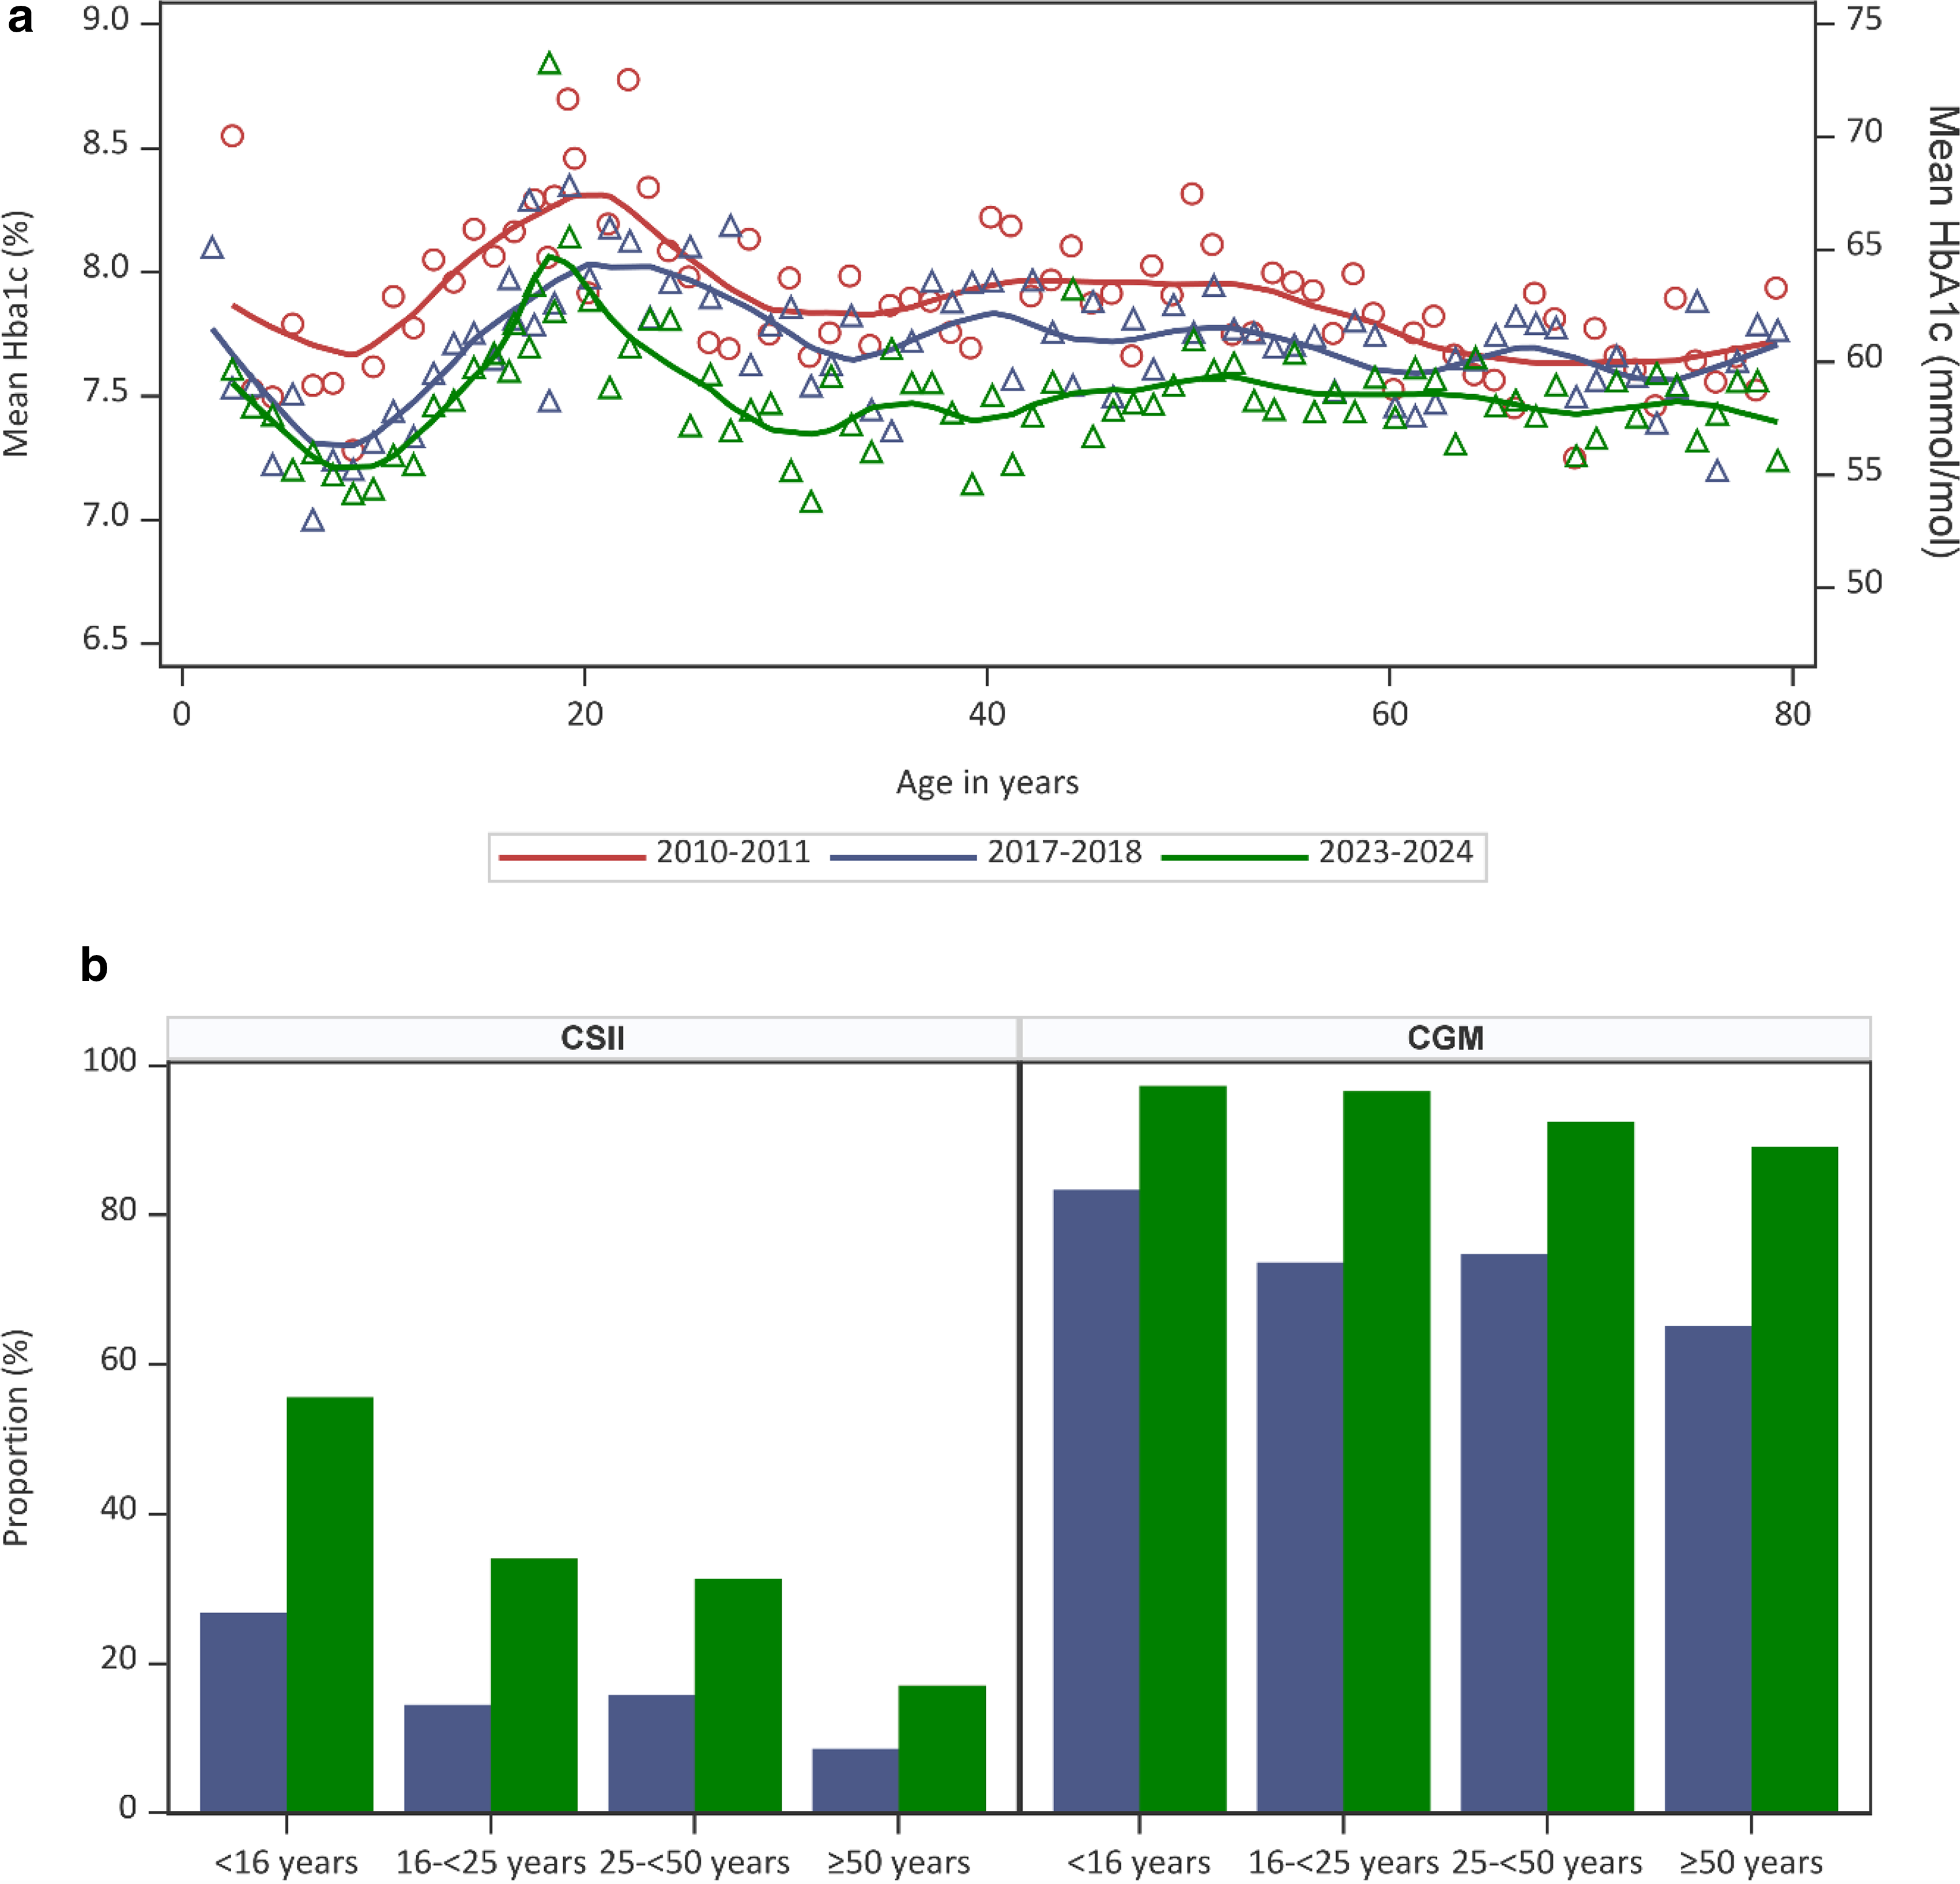
When data from overlapping study periods were combined, glycemic improvement was observed across all ages. Figure 1a shows the observed mean HbA1c by year of age across the three study periods. After adjustment for sex, age, and diabetes duration, mean HbA1c decreased significantly over time, from 8.0% (95% CI: 7.9–8.0; 63.5 mmol/mol [95% CI: 62.7–64.3]) in 2010–2011 to 7.7% (95% CI: 7.6–7.8; 60.9 mmol/mol [95% CI: 60.1–61.6]) in 2017–2018 (P < 0.001), and further to 7.6% (95% CI: 7.5–7.6; 59.1 mmol/mol [95% CI: 58.3–59.9]) in 2023–2024 (P < 0.001 vs. 2010–2011; P < 0.01 vs. 2017–2018).
When restricting the analysis to individuals treated with MDI, mean HbA1c decreased from 8.0% (95% CI: 7.9–8.0; 63.5 mmol/mol [95% CI: 62.7–64.2]) in 2010–2011 to 7.7% (95% CI: 7.7–7.8; 61.2 mmol/mol [95% CI: 60.5–62.0]) in 2017–2018 (P < 0.001), and further to 7.7% (95% CI: 7.6–7.8; 61.0 mmol/mol [95% CI: 60.1–61.8]) in 2023–2024 (P < 0.001 vs. 2010–2011), adjusted for age, sex, and diabetes duration. As data on adult CSII users were not available for 2010–2011, changes in HbA1c across CSII users could only be compared between the latter two study periods. Among those treated with CSII (with or without CGM), mean HbA1c decreased from 7.5% (95% CI: 7.4–7.6; 58.8 mmol/mol [95% CI: 57.9–59.6]) in 2017–2018 (P < 0.01) to 7.2% (95% CI: 7.1–7.3; 55.3 mmol/mol [95% CI: 54.5–56.2]) in 2023–2024 (P < 0.001), adjusted for age, sex, and diabetes duration.
Figure 1b shows the evolution in the proportion of individuals treated with CSII or CGM by age category. Between 2017–2018 and 2023–2024, the use of CSII and CGM increased in all age categories, but remained the lowest in those aged ≥50 years.
Association between HbA1c, CGM metrics, and technology group
Table 2 summarizes the median age and diabetes duration, mean HbA1c and CGM metrics among adults by technology group in the study population 2023–2024, as well as the proportion of DKA and severe hypoglycemia. Diabetes duration did not differ across technology groups. Individuals using MDI without CGM were the oldest, whereas those treated with CSII in combination with CGM and HCL were the youngest (P < 0.001). Mean HbA1c was highest among individuals treated with MDI and lowest among those using HCL (P < 0.001). Individuals using HCL also had a higher TIR, lower TBR, and lower CV compared with those using MDI with CGM or CSII with CGM (P < 0.001). There was no statistically significant difference in the proportions of DKA (including after additional adjustment for sodium-glucose cotransporter-2 inhibitor use, data not shown) and severe hypoglycemia across technology groups.
Glycemic Control Among Adults by Technology Group, Study Period 2023–2024
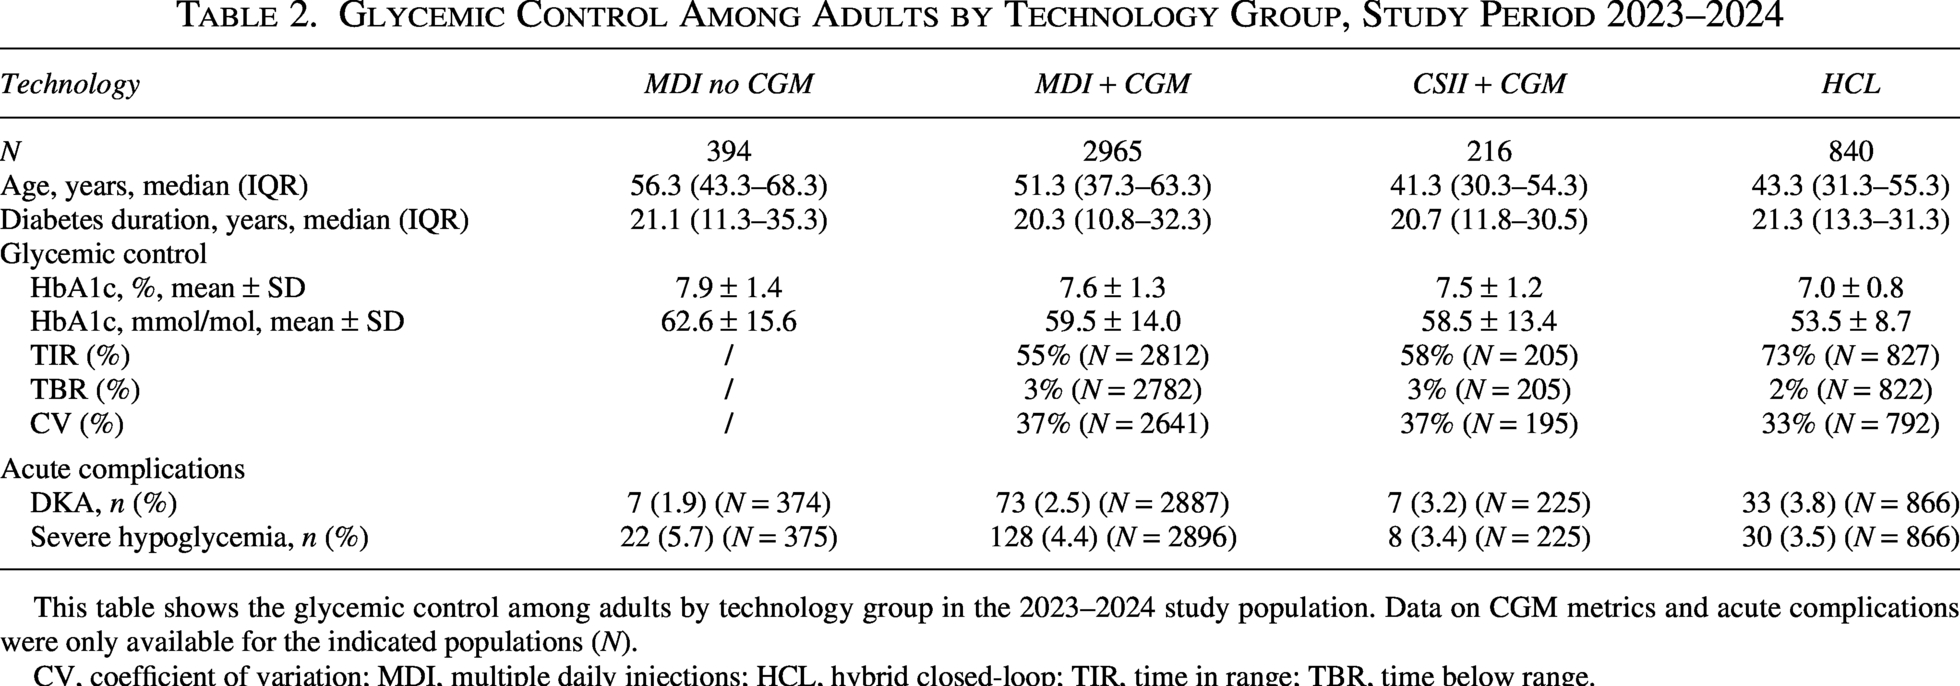
This table shows the glycemic control among adults by technology group in the 2023–2024 study population. Data on CGM metrics and acute complications were only available for the indicated populations (N).
CV, coefficient of variation; MDI, multiple daily injections; HCL, hybrid closed-loop; TIR, time in range; TBR, time below range.
After adjustment for sex, age, and diabetes duration, individuals using HCL had a lower HbA1c (7.0% [95% CI: 7.0–7.1]; 53.5 mmol/mol [95% CI: 52.7–54.3]) compared to MDI users (7.9% [95% CI: 7.8–8.1]; 63.0 mmol/mol [95% CI: 61.3–64.7], P < 0.001), MDI with CGM users (7.6% [95% CI: 7.5–7.7]; 59.7 mmol/mol [95% CI: 59.0–60.4], P < 0.001), and CSII with CGM users (7.4% [95% CI: 7.3–7.6]; 57.8 mmol/mol [95% CI: 56.2–59.5], P < 0.001). TIR was higher in HCL users (72.6% [95% CI: 71.5–73.7]) compared to MDI with CGM users (54.2% [95% CI: 53.2–55.2], P < 0.001) and CSII with CGM users (59.5% [95% CI: 56.1–62.9], P < 0.001). In line, TBR was lower in HCL users (1.5% [95% CI: 1.3–1.8]) compared to MDI with CGM users (3.1% [95% CI: 2.9–3.3], P < 0.001) and CSII with CGM users (2.7% [95% CI: 2.1–3.3], P < 0.001). Figure 2 shows the adjusted mean differences in HbA1c between technology groups and the corresponding 95% CI; model estimates are presented in Supplementary Table S2.
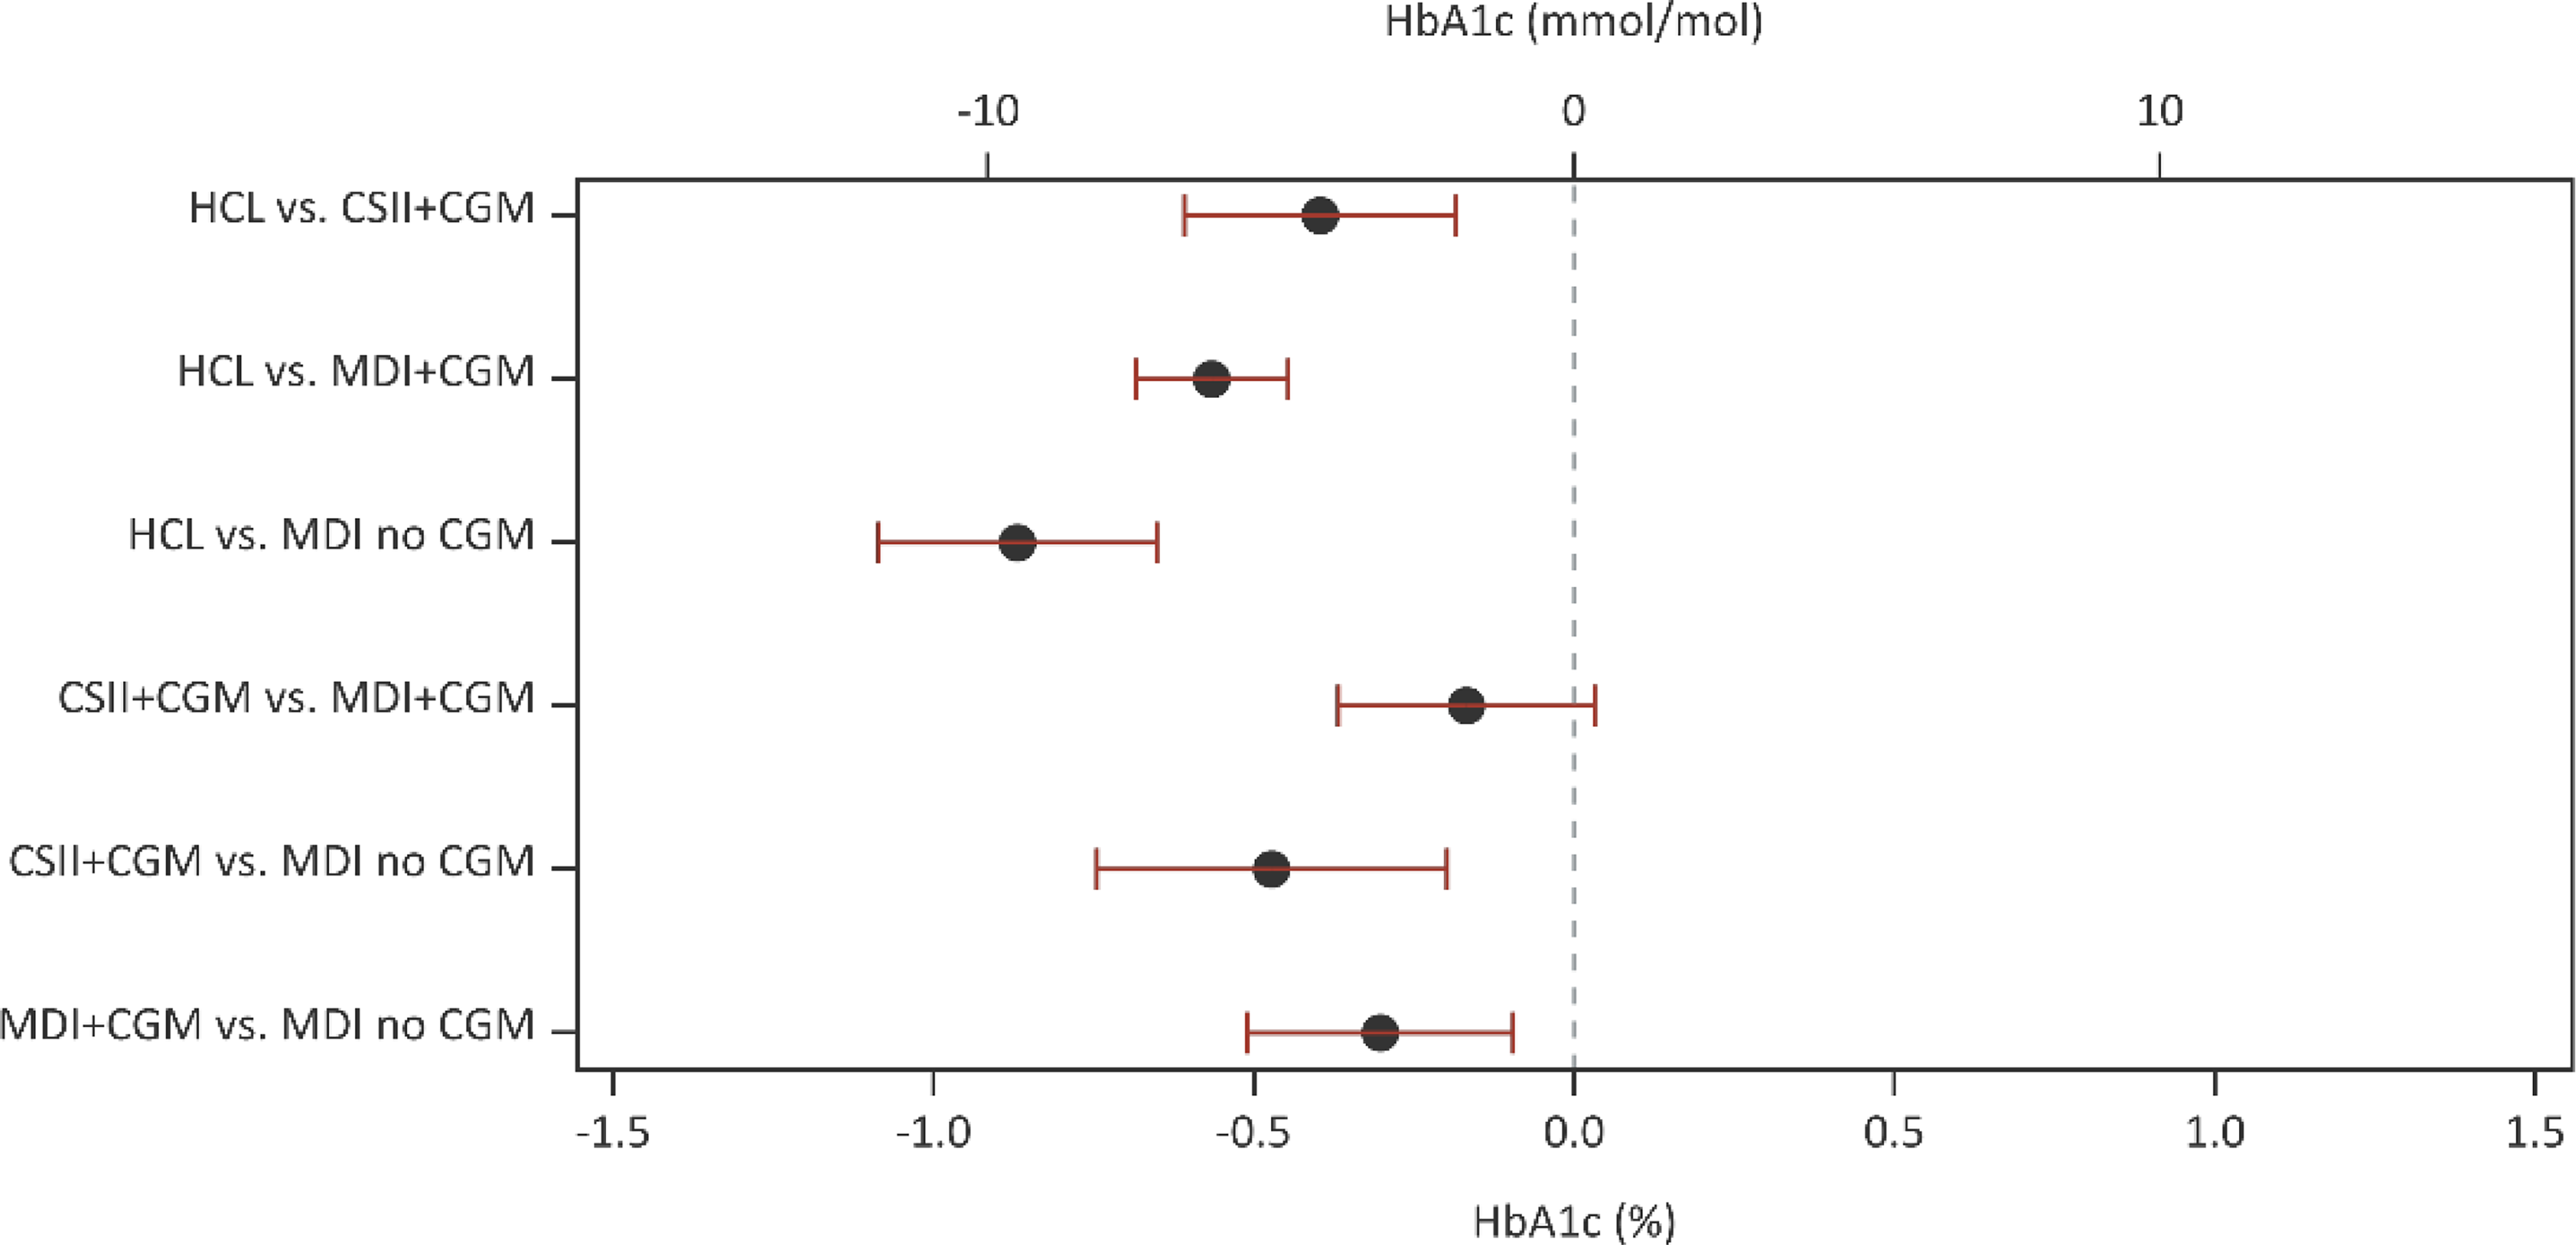
Pairwise difference of Least-squares means (Tukey adjustment) of HbA1c by technology use in adults (MDInoCGM: N = 401; MDI + CGM: N = 2978; CSII + CGM: N = 217; HCL: N = 845) (adjusted for age, sex, and diabetes duration) and the 95% confidence intervals of mean difference. Pairs whose intervals contain 0 are not significantly different upon Tukey correction. CGM, continuous glucose monitoring; CSII, continuous subcutaneous insulin infusion; HCL, hybrid closed-loop; MDI, multiple daily injections.
LDL cholesterol, SBP control, and BMI
While blood pressure levels were largely stable over time, lipid profiles improved significantly in adults (Table 1). Mean LDL cholesterol decreased from 95.0 ± 28.8 mg/dL in 2010–2011 to 83.2 ± 31.5 mg/dL in 2023–2024 (2.5 ± 0.7–2.2 ± 0.8 mmol/L, P < 0.001), and the proportion achieving LDL cholesterol <70 mg/dL (<1.8 mmol/L) increased from 18.3% to 37.4% (P < 0.001). Among those with CVD, 37.2% met the LDL cholesterol target <70 mg/dL (<1.8 mmol/L) in 2010–2011, rising to 70.4% in 2023–2024 (P < 0.001); LDL cholesterol target <55 mg/dL (<1.4 mmol/L) rose from 15.5% in 2010–2011 to 46.5% in 2023–2024 (P < 0.001). Lipid-lowering therapy became more common (40.9%–55.3%, P < 0.001), whereas antihypertensive and antiplatelet use remained stable and declined, respectively. Mean BMI increased from 26.0 ± 4.6 kg/m2 to 26.6 ± 5.0 kg/m2 (P < 0.001), with a rise in obesity prevalence (17.6%–22.1%, P < 0.001) (Table 1). In children and adolescents, blood pressure levels and lipid profiles did not vary across the study periods. Lipid-lowering and antihypertensive therapies remained rare. As observed in adults, obesity increased from 2.4% in 2010 to 4.5% in 2023 (P < 0.01) (Supplementary Table S1).
Figure 3a shows the mean LDL cholesterol in adults by year of age for the three study periods. Analysis show that the gender, age, and diabetes duration adjusted mean LDL cholesterol decreased from 95.3 mg/dL (95% CI: 93.6–96.9; 2.46 mmol/L [95% CI: 2.42–2.51]) in 2010–2011 to 89.3 mg/dL (95% CI: 87.4–91.1; 2.31 mmol/L [95% CI: 2.26–2.35]) in 2017–2018 (P < 0.001) and 85.3 mg/dL (95% CI: 83.8–86.8; 2.21 mmol/L [95% CI: 2.17–2.24]) in 2023–2024 (P < 0.001 vs. 2010–2011, P < 0.001 vs. 2023–2024). The proportion of adults treated with lipid-lowering therapy remained stable over the study periods, but increased by age: about 2%–4% of the adults aged 16 to <25 years, 27%–34% of those aged 25 to <50 years, and 64%–82% of the adults aged ≥50 years (Fig. 3b). Statins remained the primary lipid-lowering therapy, while the use of ezetimibe—with or without concomitant statin therapy—increased, particularly among individuals aged 50 years and older. Across study periods, the proportion of adults aged 25 to <50 years treated with lipid-lowering drugs as secondary prevention increased from 60% in 2010–2011 to 80% in 2023–2024, and among those aged ≥50 years from 88% to 94% (data not shown).
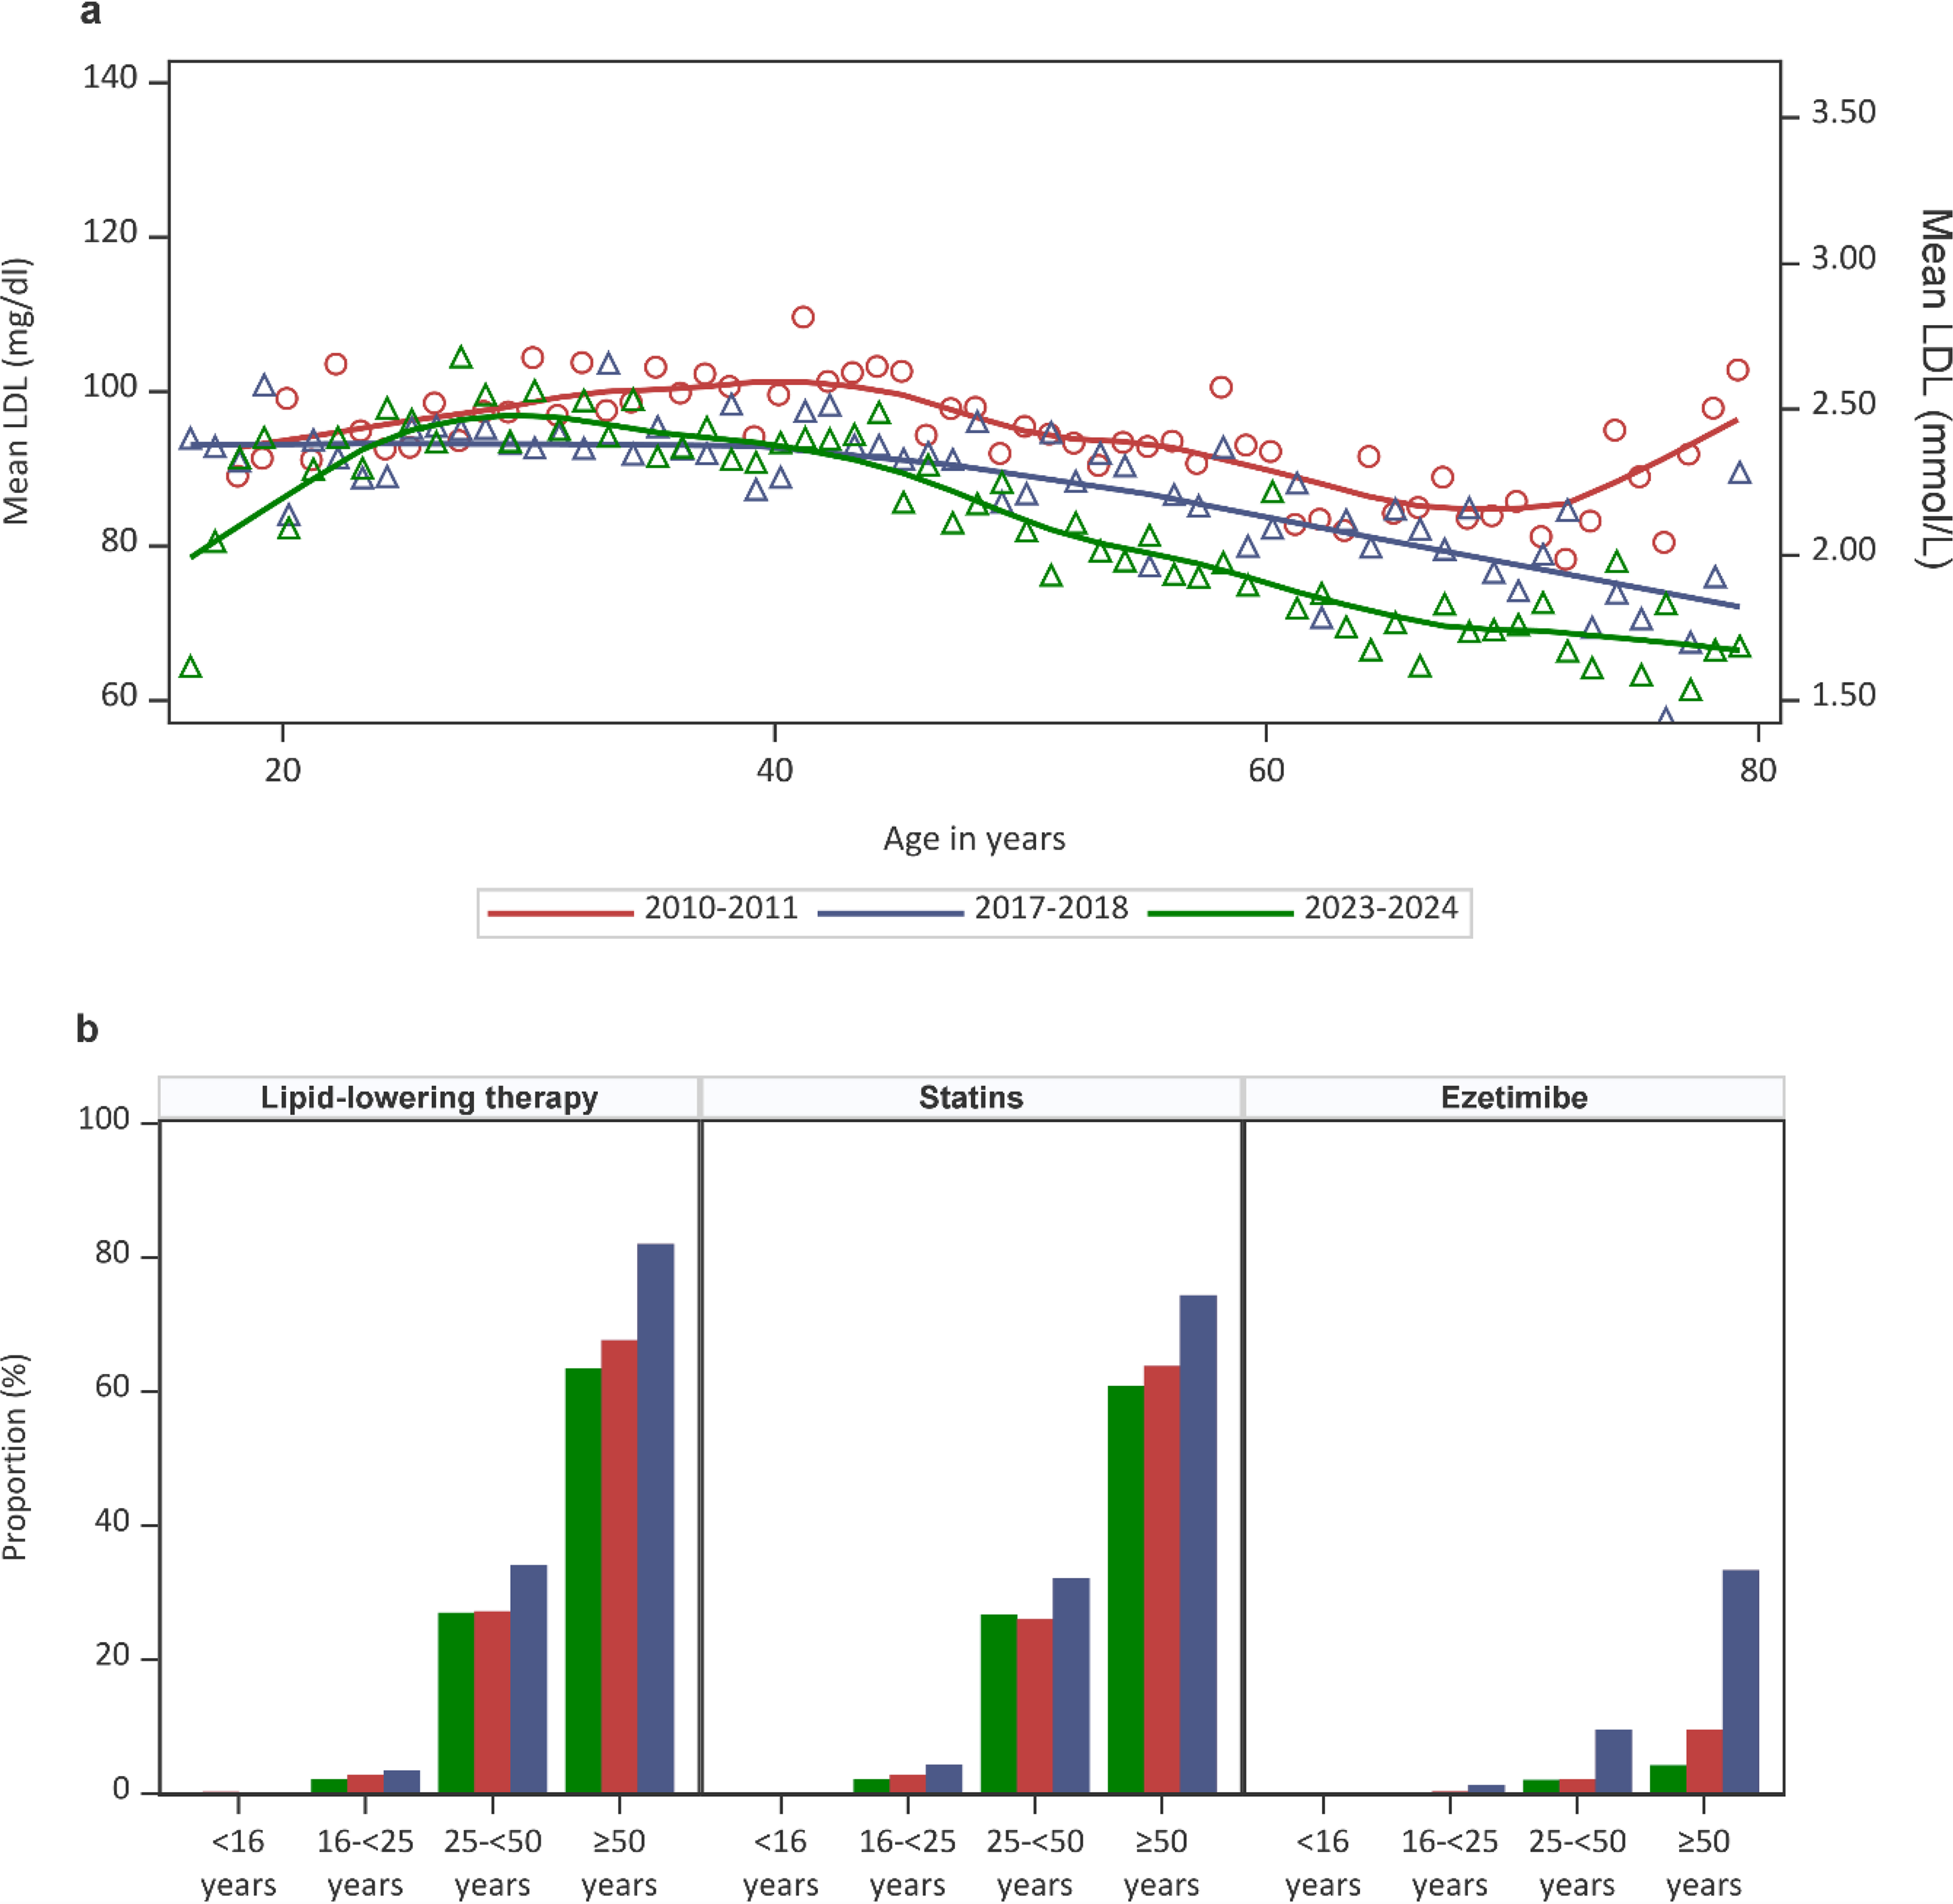
Figure 4a shows the mean SBP in adults by year of age for the three study periods. The gender, age, and diabetes duration adjusted mean SBP was 127.2 mmHg (95% CI: 125.9–128.6) in 2010–2011, 128.3 mmHg (95% CI: 127.2–129.4) in 2017–2018, and 128.0 mmHg (95% CI: 126.9–129.0) in 2023–2024. There were no significant differences between study populations. The proportion of adults receiving lipid-lowering therapy remained stable across study populations overall but increased with age. Approximately 5% of adults aged 16 to <25 years were treated. In contrast, among those aged 25 to <50 years, the proportion decreased from 24% to 15% across study populations. About 62% of those aged ≥50 years received treatment (Fig. 4b). The majority of adults were treated with ACE inhibitors and/or angiotensin II receptor blockers.
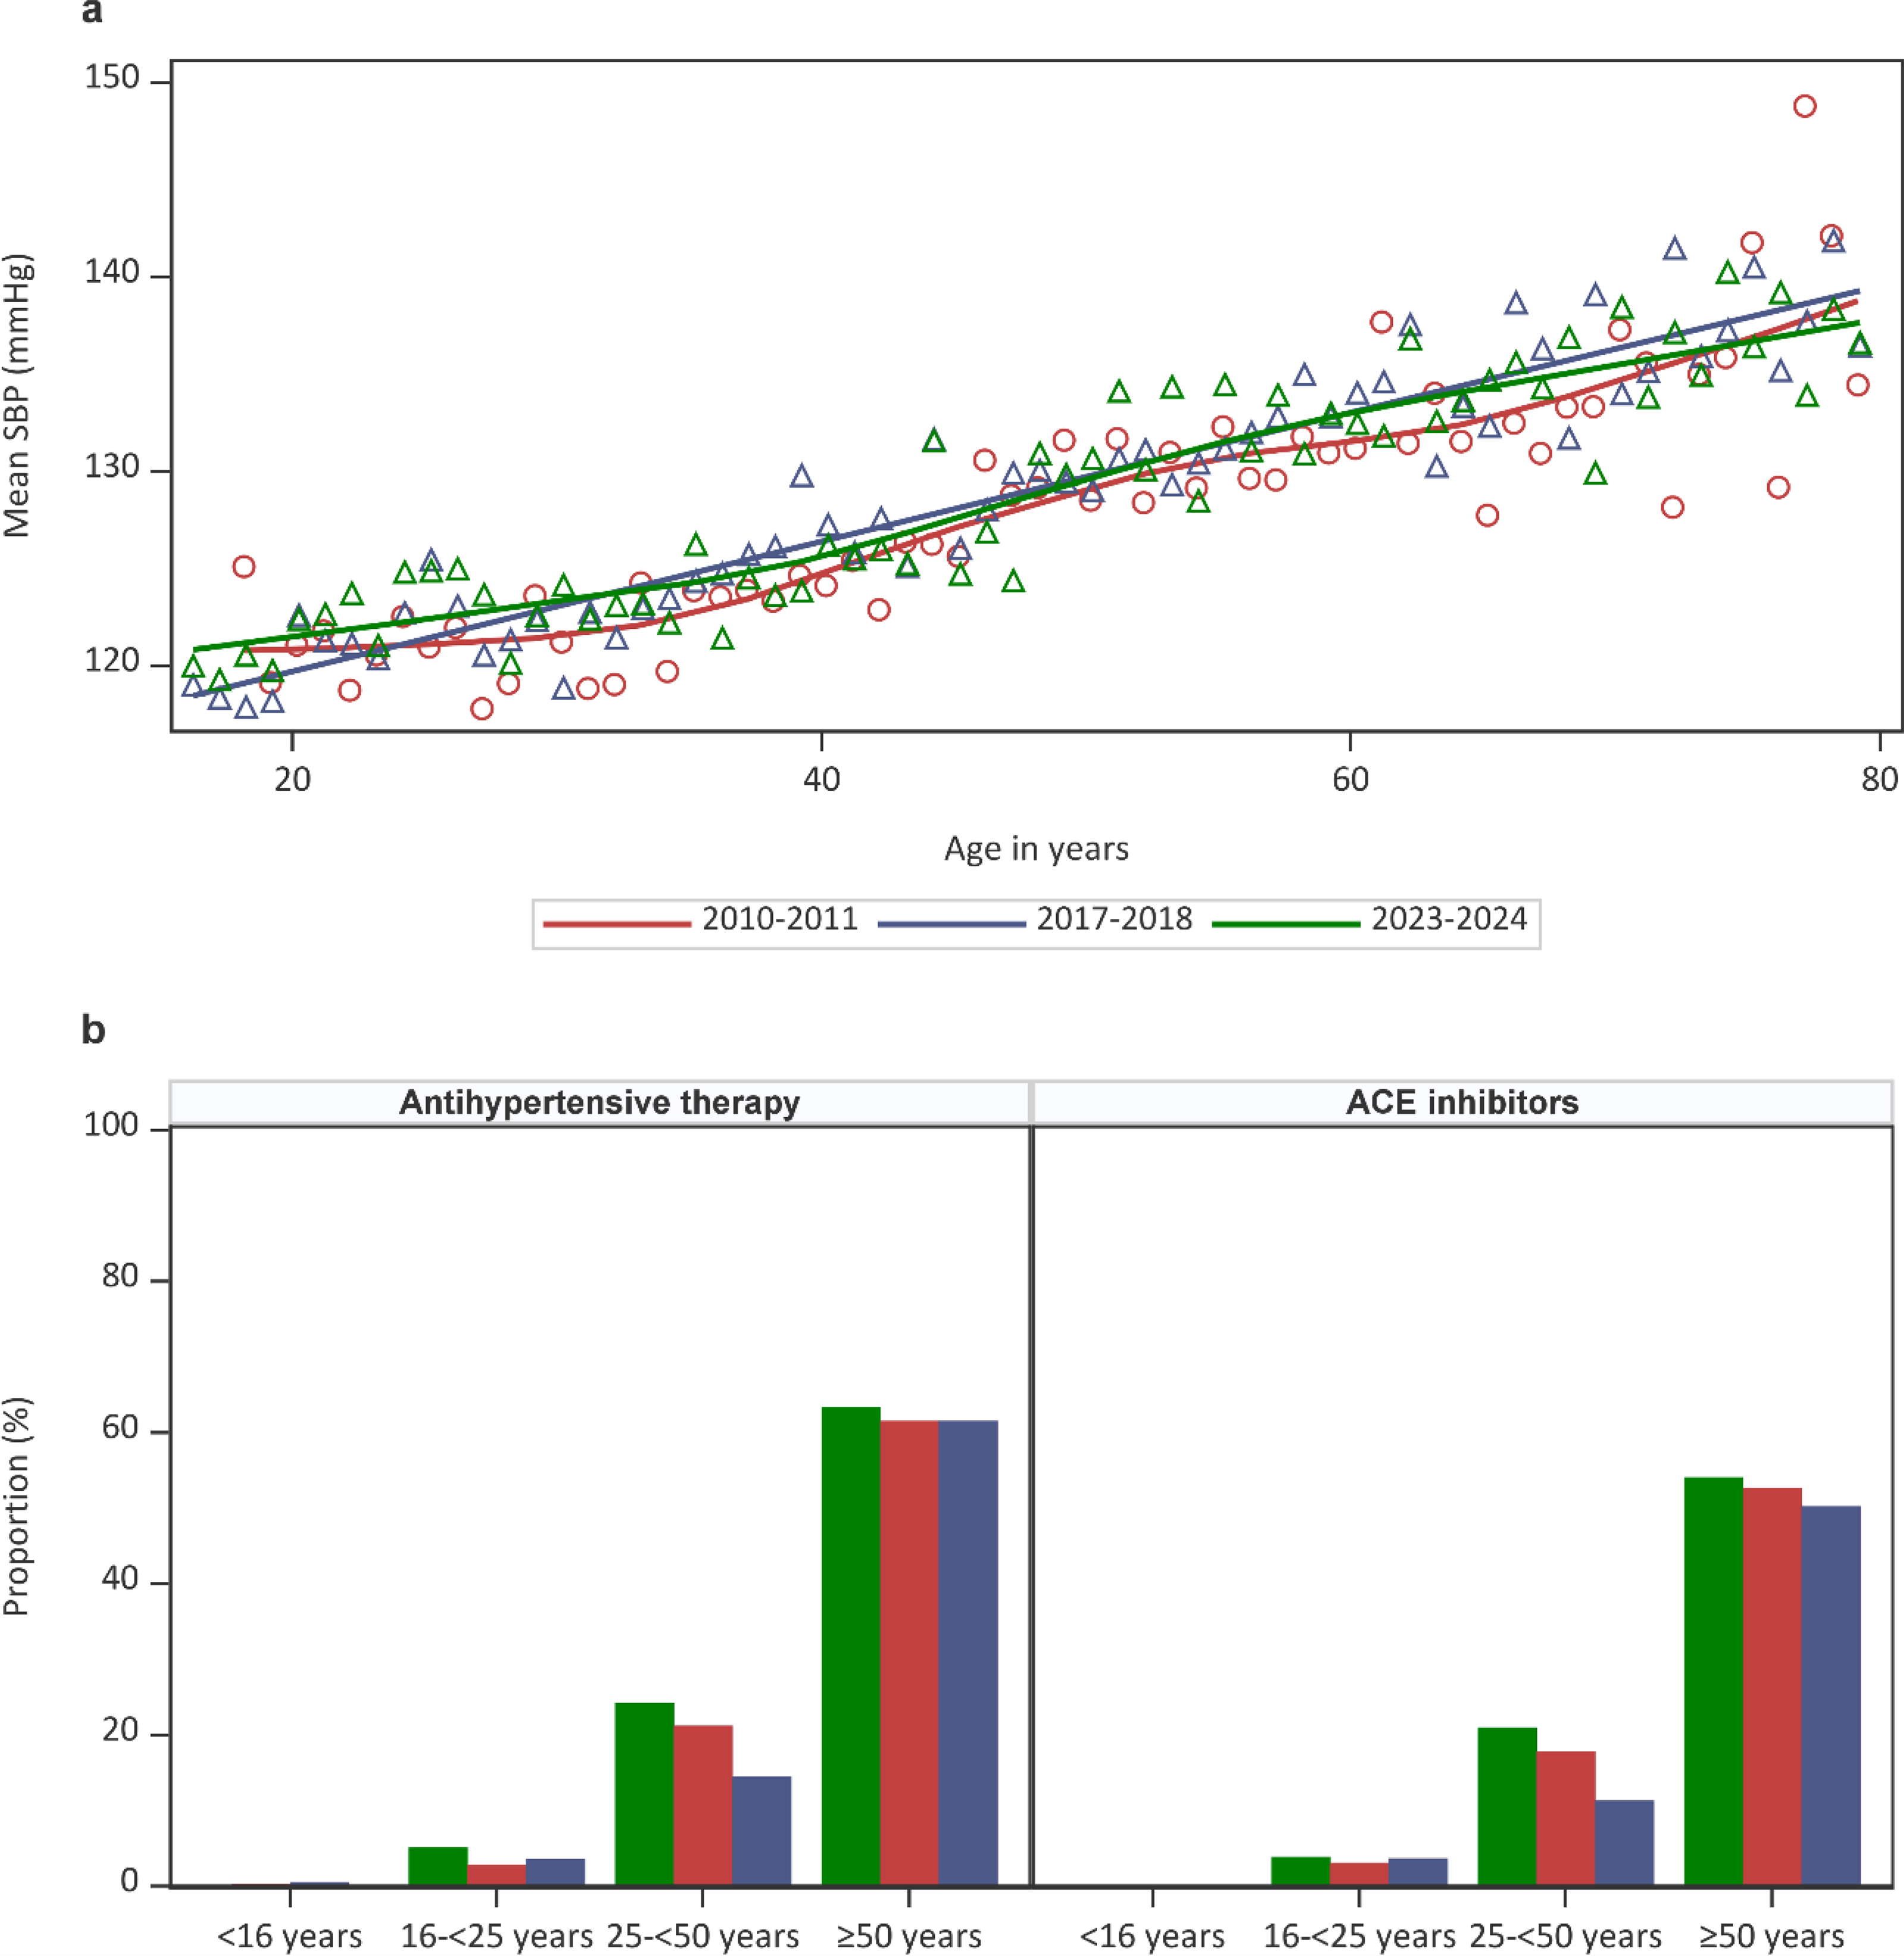
Figure 5 shows the mean BMI in adults by year of age for the three study periods. The gender, age, and diabetes duration adjusted mean BMI was 26.1 kg/m2 (95% CI: 25.8–26.3) in 2010–2011, 26.2 kg/m2 (95% CI: 26.0–26.4) in 2017–2018, and 26.6 kg/m2 (95% CI: 26.4–26.8) in 2023–2024 (P < 0.001 vs. 2010–2011, P < 0.001 vs. 2023–2024).
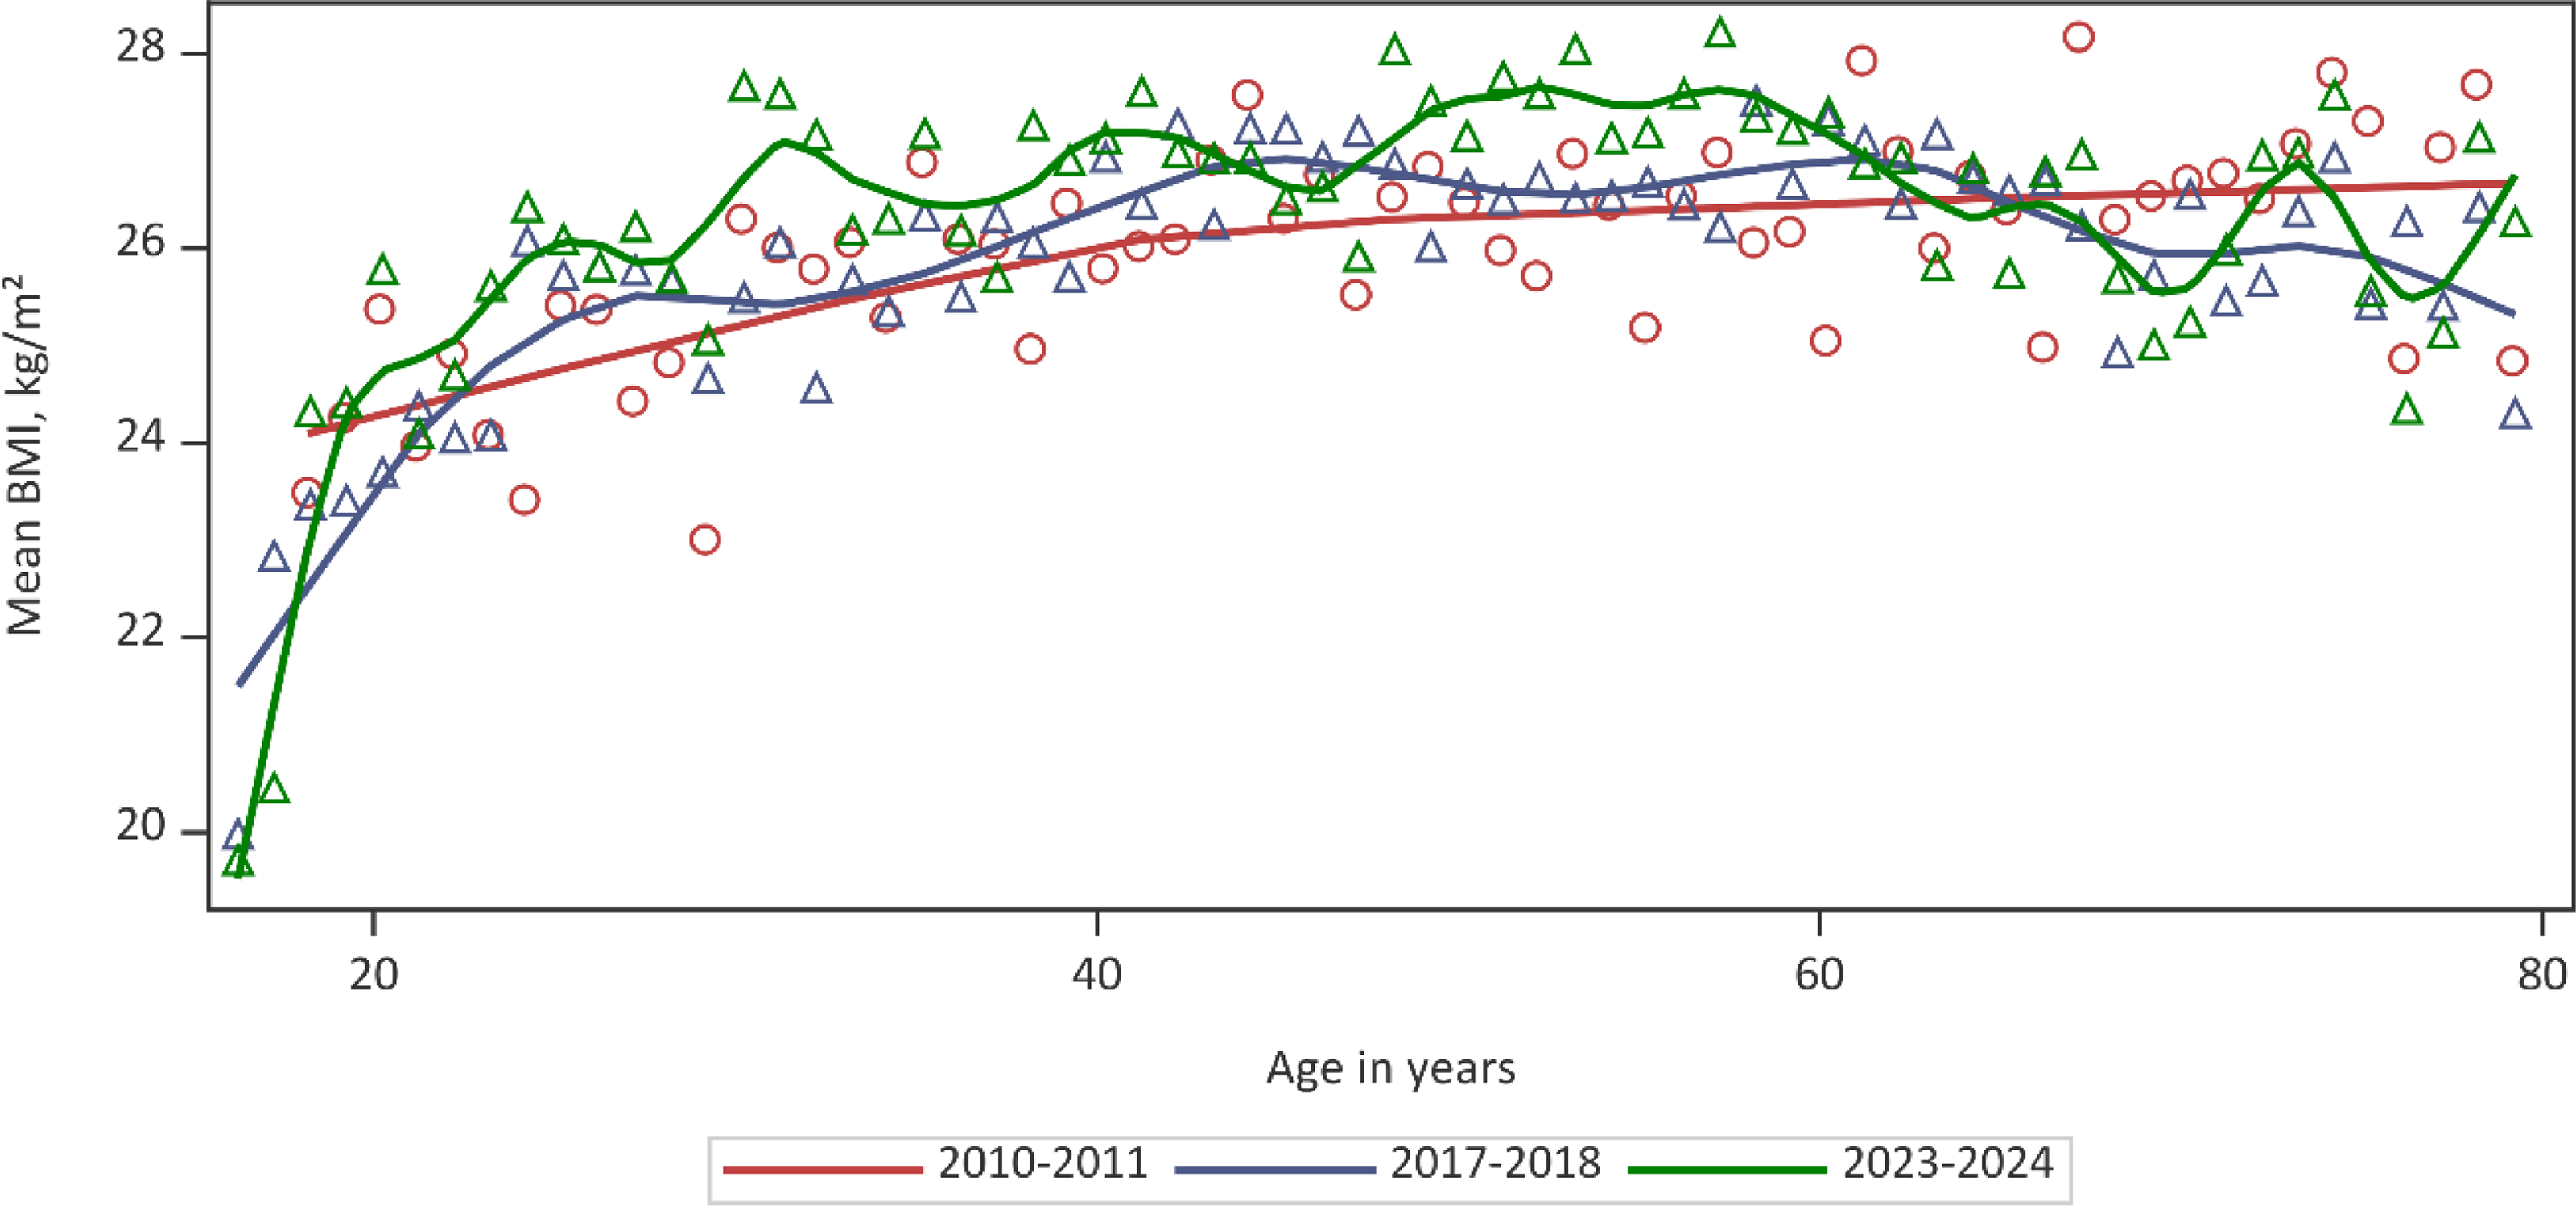
Evolution mean BMI by year of age for study period 2010–2011 (red), study period 2017–2018 (blue), and study period 2023–2024 (green), adult data only. The solid line shows the fitted LOESS curve. BMI, body mass index.
Discussion
This nationwide, real-world analysis demonstrates sustained and clinically meaningful improvements in glycemic and lipid outcomes among people living with T1D followed within the Belgian Diabetes Convention framework between 2010 and 2024. These improvements occurred in parallel with a marked expansion of diabetes technology use, particularly CGM and HCL systems.
Over the 14-year observation period, mean HbA1c decreased across all age groups by approximately 0.4% (4 mmol/mol). Even more notably, the proportion of individuals achieving an HbA1c level below 7% (<53 mmol/mol) increased by more than 50%. Although improvements in glycemic control between 2010–2011 and 2017–2018 were observed across both MDI and CSII users, our findings suggest that this progress coincided with the introduction of CGM, consistent with previous reports.13,14 The further improvements in glucose control (between 2017–2018 and 2023–2024) were primarily observed among individuals using HCL systems, following their introduction.
International registry comparisons have demonstrated substantial variability in glycemic outcomes across countries that likely reflect disparities in health care organization, access to technology, and structured education.1–3,5 Notably, earlier reports from the T1D Exchange registry have shown only modest improvements in mean HbA1c at the population level over recent years despite increased adoption of diabetes technologies, with persistent disparities by race/ethnicity and insurance type.2,4 In contrast, our data demonstrate that broad reimbursement of technologies within an integrated care system can coincide with progressive population-level improvement in glycemic control. 6
In our study, by 2023–2024, more than 90% of people living with T1D were using CGM, while CSII treatment was applied to one quarter of the adults and approximately half of the children and adolescents. The use of adjunctive therapy increased, in line with increasing obesity and combined metabolic abnormalities (central obesity, insulin resistance, dyslipidemia, and hypertension) noticed in T1D. 8 The most striking finding among adults is the superior glycemic profile among HCL users, who achieved a mean HbA1c of 7.0% (53.5 mmol/mol) and a mean TIR of 73% and TBR of 1.5% upon adjustment for age, sex, and diabetes duration. These results are consistent with randomized trials and emerging real-world evidence demonstrating the benefits of CGM2,15–23 and more recent automated insulin delivery systems, including improved glycemic control, less severe diabetes complications, and improved quality of life or higher treatment satisfaction.24–26 Importantly, uptake of CSII and CGM remained lower in individuals aged ≥50 years, indicating potential generational or behavioral differences in adoption. Addressing these gaps may represent an opportunity for further improvement.
As in our previous study, adult lipid control improved substantially. 6 Mean LDL cholesterol declined progressively, and the proportion achieving LDL cholesterol <70 mg/dL (<2.6 mmol/L) more than doubled. Among adults with established CVD, target attainment (<55 mg/dL, <1.4 mmol/L) increased to over 45% in 2023–2024. These improvements occurred alongside increased use of lipid-lowering therapy between 2017–2018 and 2023–2024, particularly in secondary prevention, suggesting effective implementation of treat-to-target strategies. In contrast, SBP remained stable over time. While hypertension prevalence among adults did not increase despite aging of the cohort, further gains in blood pressure control may be more difficult to achieve and could require additional focused interventions.
Of concern, and consistent with our previous findings, obesity increased in children, adolescents, and adults, reaching levels comparable to those in the general population (2018 data: adults—men 19.6%, women 22.6%; adolescents—boys 4.0%, girls 3.6%). 27 This confirms that obesity represents a growing public health challenge also in people living with T1D and highlights the need for strengthened preventive strategies, including greater emphasis on education and counseling aimed at weight management and avoidance of overweight. Despite some minor improvements over time, efforts should also be strengthened in the area of smoking prevention and cessation, as this remains a key modifiable risk factor for long-term cardiovascular outcomes.
The Belgian Diabetes Convention provides universal reimbursement of insulin, glucose monitoring systems, insulin pumps, and HCL systems within a structured, multidisciplinary care pathway. Importantly, centers participate in a mandatory national quality improvement program with benchmarking and feedback. Such audit-and-feedback systems have previously been shown to reduce between-center variability and improve quality of care.6,28–32 The combination of equitable access to advanced technologies, structured therapeutic education, multidisciplinary follow-up, and systematic quality monitoring likely explains the sustained improvements observed in this national cohort.
Key strengths of our study include its real-world, nationwide coverage and the use of standardized data collection within a mandatory quality-assurance framework. Thanks to the centralized organization of diabetes care in Belgium, nearly all individuals with T1D are managed in specialized diabetes centers and are therefore captured by the quality improvement programs. Unlike clinical trials, these national real-world data provide an accurate reflection of the entire T1D population and the care they receive.
Limitations include the repeated cross-sectional design of the IQED study, sampling each time a random representative 10% sample of the total T1D population, preventing longitudinal follow-up of individual patients and assessment of within-individual changes over time, as well as the retrospective nature of this analysis. Another limitation is the fact that the classification of T1D was based on clinical judgment by the reporting centers, thus creating a risk of some contamination of people with other types of diabetes.
Conclusions
Over a 14-year period, people living with T1D managed within a nationwide, structured, multidisciplinary care model experienced significant and sustained improvements in glycemic and lipid outcomes. These gains coincided with near-universal CGM use and increasing adoption of HCL therapy, which was associated with superior glycemic metrics in 2023–2024. Despite these advances, further efforts are needed to address the rising prevalence of obesity and to strengthen smoking prevention and cessation strategies. By providing nationwide real-world data on automated insulin delivery, our findings help bridge the evidence gap between randomized clinical trials and routine clinical practice, confirming that the benefits observed under controlled conditions can translate into durable population-level improvements. This integrated approach may serve as a model for health care systems seeking to convert technological innovation into sustained real-world benefit.
Authors’ Contributions
A.L., J.-C.P., F.N., and C.M. developed the concept and design of this study. Data analysis was performed by A.L. All authors made substantial contributions to the interpretation of results. A.L., J.-C.P., F.N., and C.M. drafted the article, and all authors contributed to the critical revision of the article for important intellectual content. All authors approved the final article for publication. A.L. had full access to the data and accepts the responsibility for the integrity of the data and accuracy of the data analysis.
Ethical Considerations and Consent to Participate
The IQED data collection (local reference: Deliberation No. 13/092 of October 22, 2013, last modified on February 6, 2024) and the IQECAD data collection (local reference: Deliberation No. 13/093 of October 22, 2013, last modified on December 5, 2023) were carried out in line with the Belgian privacy legislation. IQED waived the need for individual informed consent, but operates under an opt-out procedure for patients who do not wish their data to be included. IQECAD has been approved by the ethics committee of the University Hospital of Ghent (advice EC UZG 2008/710), and participation requires individual informed consent. All research involving human participants has been performed in accordance with the Declaration of Helsinki.
Data Availability
Data cannot be shared publicly because of the use of pseudonymized person-level data. Actors wanting to access (parts of the) data are required to submit a request through the Belgian Health Data Agency (https://www.hda.belgium.be/en/data_request). An approval from the Belgian Information Security Committee might be required. For more information about the access procedure, see
Supplemental Material
sj-docx-1-dtt-10.1177_15209156261464233 — Supplemental material for Impact of Technology Introduction on Glycemic Control of People Living with Type 1 Diabetes in Belgium: An Observational, Real-World Study
Supplemental material, sj-docx-1-dtt-10.1177_15209156261464233 for Impact of Technology Introduction on Glycemic Control of People Living with Type 1 Diabetes in Belgium: An Observational, Real-World Study by Astrid Lavens, Jean-Christophe Philips, Christophe De Block, Laurent Crenier, Philippe Oriot, Michel Vandenbroucke, Sylvie Tenoutasse, Marieke den Brinker, Sara Van Aken, Frank Nobels, and Chantal Mathieu
Footnotes
Acknowledgments
This article is written on behalf of the Belgian Group of Experts IQED. The members of the IQED Group of Experts are L.C., C.D.B., A.L., C.M., F.N., J.C.P., P.O., M.V., and V. Vanelshocht. The members of the IQECAD Group of Experts are D. Beckers, K. Casteels, S. Chao, N. Reynaert, S. Van de Velde, M.L. Den Brinker, E. Maris, D. Klink, M.-C. Lebrethon, A. Lemay, J. Louis, P. Lysy, N. Seret, G. Smeets, S. Tenoutasse, S. Van Aken, S. Van de Velde, M. Van Looke, J. Vanbesien, and V. Van Elshocht. The authors would like to thank the staff of all Belgian specialized diabetes centers for the data collection. They also would like to thank their data manager, N. Demeulemeester, for the support during the data collection.
Author Disclosure Statement
The authors declared no potential conflicts of interest with respect to the research, authorship, and/or publication of this article.
Funding Information
The IQED and IQECAD programs are funded by the Belgian NIHDI. However, the funders of this study had no role in study design, data collection, data analysis, data interpretation or writing of the report.
References
Supplementary Material
Please find the following supplemental material available below.
For Open Access articles published under a Creative Commons License, all supplemental material carries the same license as the article it is associated with.
For non-Open Access articles published, all supplemental material carries a non-exclusive license, and permission requests for re-use of supplemental material or any part of supplemental material shall be sent directly to the copyright owner as specified in the copyright notice associated with the article.
