
Abstract
Students are most likely to leave science, technology, engineering, and mathematics (STEM) majors during their first year of college. We developed an analytic approach using random forests to identify at-risk students. This method is deployable midway through the first semester and accounts for academic preparation, early engagement in university life, and performance on midterm exams. By accounting for cognitive and noncognitive factors, our method achieves stronger predictive performance than would be possible using cognitive or noncognitive factors alone. We show that it is more difficult to predict whether students will leave STEM than whether they will leave the institution. More factors contribute to STEM retention than to institutional retention. Early academic performance is the strongest predictor of STEM and institution retention. Social engagement is more predictive of institutional retention, while standardized test scores, goals, and interests are stronger predictors of STEM retention. Our approach assists universities to efficiently identify at-risk students and boost STEM retention.
Introduction
Retaining talented and diverse students in science, technology, engineering, and mathematics (STEM) majors is vital to building the human capital required to solve society’s largest and most complex problems. However, attrition rates are high for many STEM disciplines, and research has shown that the dropout rate is highest during the first year in college (Chen, 2013). Successful transition from high school to college is critical, and interventions that increase student engagement or involve students in learning communities can be effective at increasing students’ confidence in their ability to succeed in STEM (Wilson et al., 2012). Identifying at-risk students is especially important for universities with large enrollment so that they might offer additional support and resources to these students beyond regular advising. Tinto’s student retention model (Tinto, 1975) characterizes factors that influence a student’s decision to stay in or leave college. Examples include contextual factors such as current learning environment and experiences, academic factors including past performance, but also noncognitive factors such as self-efficacy, interests, or goals. In this study, we focus on the impact of Tinto’s factors on the retention of STEM students. We consider two forms of STEM attrition: (a) STEM students leaving a STEM major, while remaining at the institution and (b) STEM students leaving an institution altogether.
Many studies have validated different parts of Tinto’s model, applied to STEM majors. For example, English and mathematics American College Testing (ACT) subtests have been shown to be related to STEM retention (Bettinger, Evans, & Pope, 2013). Noncognitive factors, such as self-efficacy, also play a role in the decision to leave (Chemers, Hu, & Garcia, 2001) even though students’ perception of self-doubt and performance avoidance may not be correlated with objective measures of academic performance (Shedlosky-Shoemaker & Fautch, 2015). For current learning experiences, student dissatisfaction with instructional differences between high school and college faculty has been shown to be higher in STEM than in other majors, contributing to attrition (Daempfle, 2003). Further, the above factors often contribute to low grades in first-STEM courses, which in turn are strong predictors of STEM retention (Aulck, Aras, Li, L’Heureux, Lu, & West, 2017; Ehrenberg, 2010; Ost, 2010; Rask, 2010).
In this work, we describe an analytic approach for identifying at-risk STEM students early in their first semester. We use random forest methodology (Breiman, 2001) to assess the predictive value of all explanatory variables. Random forests are a popular machine learning approach, capable of strong predictive performance on high-dimensional data. The use of random forests in the education literature is limited (Aulck et al., 2017; Mendez, Buskirk, Lohr, & Haag, 2008). Although Aulck et al. (2017) found random forests less effective than logistic regression at predicting STEM retention, our results suggest that random forests grown using conditional inference trees (Hothorn, Hornik, & Zeileis, 2006) perform on par with logistic regression. An advantage of random forest methodology is the ability to measure variable importance for complex data sets (Breiman, 2003; Hapfelmeier, Hothorn, Ulm, & Strobl, 2014; Janitza, Strobl, & Boulesteix, 2013; Strobl, Boulesteix, Kneib, Augustin, & Zeileis, 2008; Strobl, Boulesteix, Zeileis, & Hothorn 2007).
Our method combines information from a wide range of factors that serve as proxies for the factors in Tinto’s model. We apply this method to estimate the probability of first-year STEM students at a large public research university in the Midwest either switching to a non-STEM major or leaving the institution altogether prior to their second year, allowing advisors to offer interventions aimed at retaining STEM students. Throughout the article, we use the phrase institutional retention to refer to a student staying at the university through the start of the second year, and the phrase STEM retention to refer to a student staying in STEM through the start of the second year, conditional upon the student staying at the university.
We made progress on two challenges: (a) the need for a method taking into account both cognitive and noncognitive factors to predict students at risk, that is, utilizing academic information along with measures of social engagement, self-efficacy, and student interests and goals and (b) the flexibility for the prediction to account for type of STEM major, gender, and ethnicity to further improve prediction.
Data and Methodology
We have data for 7,459 freshmen STEM students who enrolled at the university for the Fall 2014 and Fall 2015 semesters. Of these, 3,667 enrolled in Fall 2014 and 3,792 enrolled in Fall 2015. Transfer students are not included since the factors contributing to their retention are likely to differ from the factors influencing retention among students enrolling directly from high school. Of these students, 64.6% are men, 95% are U.S. citizens, 75.3% are White (non-Hispanic), 5.1% Hispanic, 3.4% Asian, and 2.5% Black (non-Hispanic) American students. The remaining U.S. students are either of other ethnicities or did not provide this information. Ethnicities of international students are not provided. Approximately 12% of students left the institution prior to the start of their second year. An additional 9% switched to a non-STEM major during that time. These departure rates vary by major (Table 1).
Summary of Retention by Major Type.
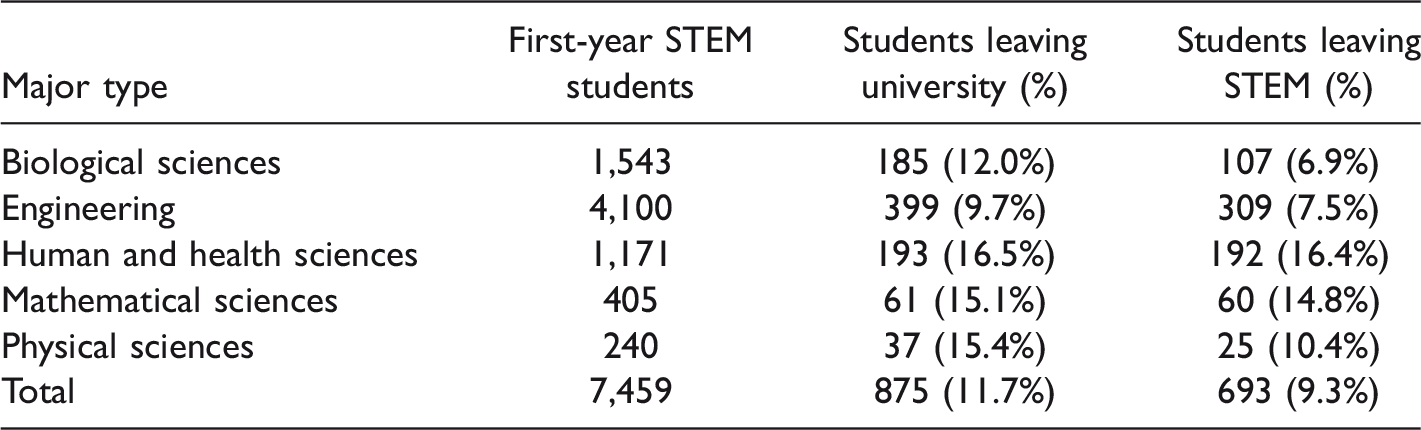
Note. STEM = science, technology, engineering, and mathematics.
Our approach uses 38 variables that serve as proxies for the factors in Tinto’s retention model and are available in the first 8 weeks of a student’s initial semester. Personal inputs include high school academic information, demographics, and standardized test scores. A student’s learning experiences are described through first-semester course enrollment, midterm grades, and learning community participation. Responses to the MAP-Works® survey (now Skyfactor®; Woosley & Jones, 2011), completed by freshmen in the first 6 weeks of the fall semester, provide insight into a student’s social engagement, proximal environment, and self-efficacy, while the ACT interest inventory (Swaney, Lamb, Prediger, & American College Testing Program, 1995) survey provides information on students’ interests and goals in their junior or senior year of high school. Considering a broad range of cognitive and noncognitive factors potentially allows universities to identify at-risk students who may not be detected by frequently used cognitive measures such as midterm grades alone. Table 2 gives the list of variables we considered, which are grouped into 15 categories of variables similar to one another.
Variables Considered.
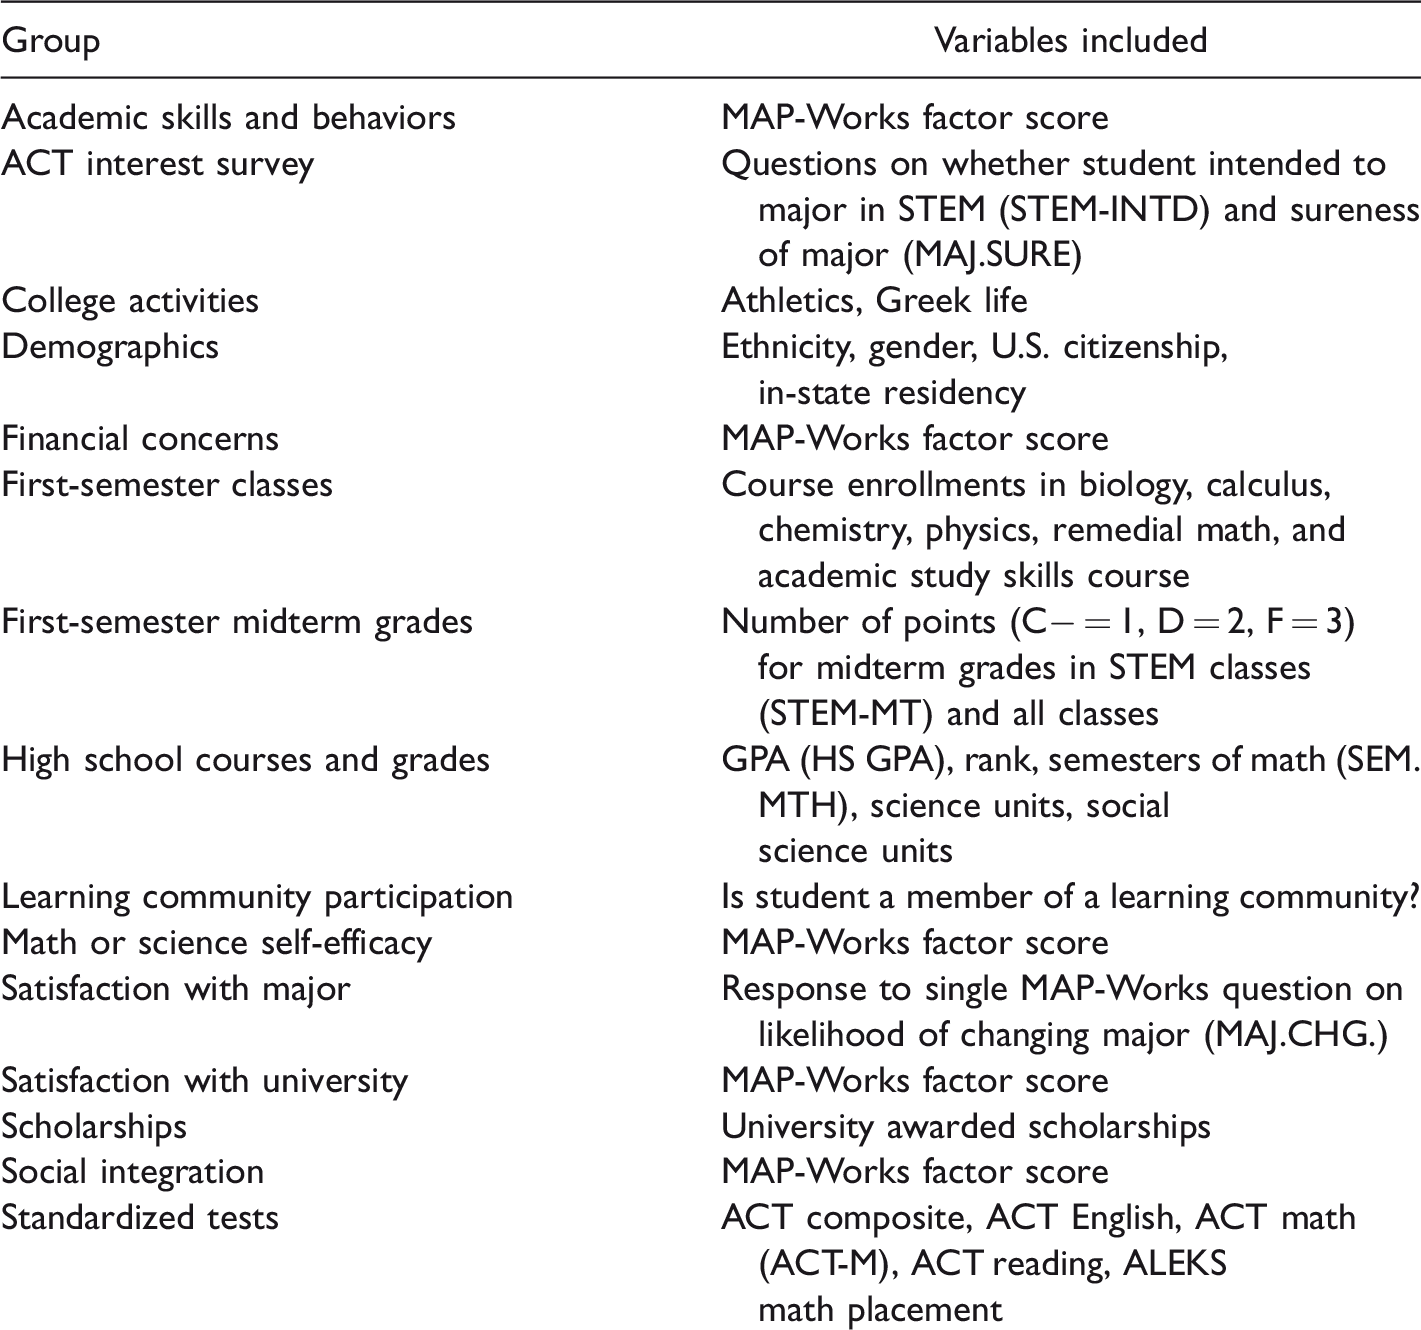
Note. Abbreviations are provided for variables referenced later. STEM = science, technology, engineering, and mathematics; ACT = American College Testing; GPA = grade point average.
Because many questions from the MAP-Works® survey are similar to one another, a factor analysis was first conducted to group together responses to highly correlated questions. Using the promax method of rotation, responses were aligned to five different factors, namely, academic skills, financial concerns, self-efficacy, satisfaction with the university, and social integration. Students’ factor scores for each of these were then used as predictor variables for retention. A MAP-Works® question about the student’s likelihood of changing majors did not align to any of these factors but was also included as a predictor variable on its own due to its potentially strong predictive ability. Other MAP-Works® questions that did not align to factors and showed little predictive value were not considered. Because students who completed the MAP-Works® survey occasionally skipped questions, missing values were imputed using the multivariate imputation by chained equations algorithm (van Buuren & Groothuis-Oudshoorn, 2010), prior to conducting the factor analysis. This was only done in situations where students completed the survey but skipped particular questions. MAP-Works® scores for students who did not take the survey were left as missing.
Random forests (Breiman, 2001) were grown using conditional inference trees, available in the party package (Hothorn, Buehlmann, Dudoit, Molinaro, & Van Der Lann, 2005; Strobl et al., 2007, 2008) in R (R Development Core Team, 2013). This approach has been shown to yield unbiased measures of variable importance for data sets containing a mix of numeric and categorical predictors (Strobl et al., 2008). Cross-validation showed that optimal prediction performance occurs when the minsplit parameter, which determines maximal terminal node size, is set to 75. We therefore used this setting, although we found variable importance measures to be largely insensitive to changes in this parameter. Breiman (2003) suggests growing large forests, consisting of many decision trees, especially when variable importance is of interest. Smaller forests can lead to unstable results due to the randomness associated with the process of growing trees. Therefore, we used random forests consisting of 1,000 trees, which we found led to highly stable variable importance results.
Our situation is an example of an unbalanced classification problem, as students stay in STEM far more frequently than they leave. In such problems, receiver operating characteristic (ROC) curves have been shown to be useful in assessing variable importance. Janitza et al. (2013) showed that a variable importance measure based on area under the curve (AUC) is preferable to one based on misclassification rate, which is typically used in classification problems. The ROC curve traces the rates of true positives (i.e., at-risk students who left) and false positives (i.e., at-risk students who stayed) as the at-risk threshold varies. AUC provides a measure of prediction quality that is independent of this threshold. A method capable of perfectly separating students who leave from those who stay would achieve an AUC of 1, while a method predicting completely at random is expected to achieve an AUC of 0.5. The fact that AUC does not depend on the at-risk threshold is advantageous since the appropriate threshold will vary based on the needs and resources of institutions and departments.
Because of the complex interrelationships between many of the variables, we grouped explanatory variables into 15 sets of closely related predictors. For example, the set of variables related to high school academic information includes high school grade point average; class rank; and the number of math, science, and social science units. Students were divided into five different groups of STEM majors: biological sciences (BIO), engineering (ENGR), human and health sciences (HH), mathematical sciences (MTH), and physical sciences (PHY). A complete list of the majors classified within each category is available upon request.
Rather than measuring the importance of predictor variables individually, we permuted the values of all variables within a set of closely related predictors at the same time. This provides a measure of the importance of each set of predictor variables. We calculated variable importance across all students and also within each type of STEM major. When analyzing STEM retention, rather than institutional retention, only the 6,584 students who remained enrolled at the university at the start of their second year were considered.
The following algorithm describes the procedure used to calculate variable importance for sets of predictor variables.
Using a simple random sample consisting of 63% of students in the data set, grow a tree using the ctree command in the party package with the settings described earlier. For each student not in the set used to grow the tree, estimate the probability of that student leaving STEM. For each type of STEM major, calculate AUC using the estimates from Step 2. For each set of predictor variables, one at a time, randomly permute the values of all variables in a given set. Repeat Steps 2 and 3 using the permuted values. For each set of variables, calculate the change in AUC when permuted values are used in place of the actual values. Repeat Steps 1 to 6 to create 1,000 trees and average the change in AUC corresponding to permutation of each group of variables. These represent variable importance scores for each set of predictor variables.
Results
First, we used random forests grown from data on all 2014 first-year STEM students to estimate the probability of each 2015 first-year STEM student leaving either STEM or the institution during their first year. Establishing a criterion for designating a student as at risk requires consideration of the benefits of correctly identifying those students who will leave, against the costs of falsely designating students as at risk when they will actually stay. Furthermore, designating too many at-risk students might make it difficult for advisors to provide helpful interventions for those most in need. We provide alerts to advisors of the 15% of students with the highest estimated probabilities of leaving the institution or STEM. Table 3 provides a breakdown of the number of students designated as at risk and the actual retention results. We see that random forests enable us to identify a subpopulation of 567 students who go on to leave STEM at a rate more than 3 times higher than other students.
Results When 15% of Students Are Classified as At Risk.
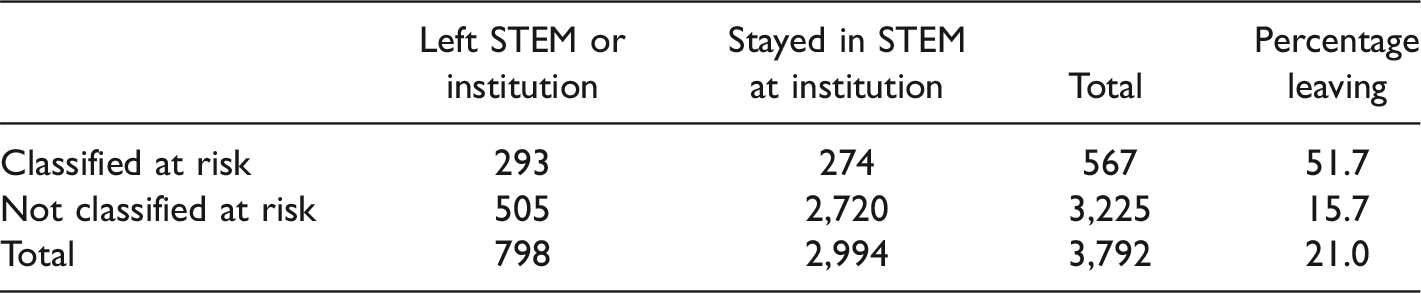
Note. STEM = science, technology, engineering, and mathematics.
Although we believe that the highest 15% threshold provides a reasonable criterion for designating at-risk students, taking into account the cost or benefit analysis and advising resources available at the institution, individual institutions or departments may wish to establish their own thresholds. Designating a higher number of students as at risk would increase the number of students correctly identified who go on to leave but also increase the false positive rate. For example, if we had designated 20% of students as at risk, we would have correctly identified an additional 72 students who went on to leave, but would have also identified 119 students who stayed, lowering the percentage of the at-risk group who actually left to 48.2%. Because it is independent of threshold, AUC provides an objective way to measure the impact of academic and social factors on STEM retention as well as institutional retention of STEM students. Figure 1 displays ROC curves for predicting STEM retention for 2015 first-year students using random forests trained on retention data from 2014 first-year students. When cognitive and noncognitive factors were used to predict STEM retention, the random forest approach achieved an AUC of 0.7326, compared with 0.7154 when only cognitive factors are used, and 0.6637 for only noncognitive factors. Thus, when both cognitive and noncognitive information is taken into account, we achieve an AUC that is 0.2326 higher than what would be expected of predictions made purely at random, compared with differences of 0.2154 and 0.1637 when only cognitive or noncognitive factors are used. For institutional retention, the random forest achieves an AUC equal to 0.7695 when both cognitive and noncognitive factors are used, compared with 0.7513 and 0.6289 for only cognitive or noncognitive factors, respectively. The fact that higher AUC’s are obtained for institutional retention than STEM retention indicates that it is easier to identify students most likely to leave the institution than those most likely to leave STEM, conditional on staying at the institution. By comparison, logistic regression models using the same cognitive and noncognitive factors achieve AUCs of 0.7267 and 0.7782 for STEM and institutional retention, respectively. Therefore, the random forest approach slightly outperforms logistic regression for STEM retention, and logistic regression is slightly preferable for institutional retention.

Receiver operating curve for predicting STEM retention combining cognitive and noncognitive factors, along with curves obtained using each type of information alone.
The structure of an individual decision tree offers insight on which explanatory variables are most important in the prediction. Figure 2 gives the first splits in a single decision tree for predicting STEM retention. Summary information on the number of students (n) and the proportion leaving STEM (y) are provided for the deepest nodes displayed in the figure. Since the first split is performed using information on a student’s first-semester midterm grades in STEM courses, we can infer that these midterm grades are an important predictor of retention. Other important factors include a student’s major, response to a MAP-Works® question about likelihood of changing major, learning community participation, semesters of high school math, high school grade point average, ACT math score, and ACT interest questions about whether the student intends to major in STEM, as well as sureness of major.
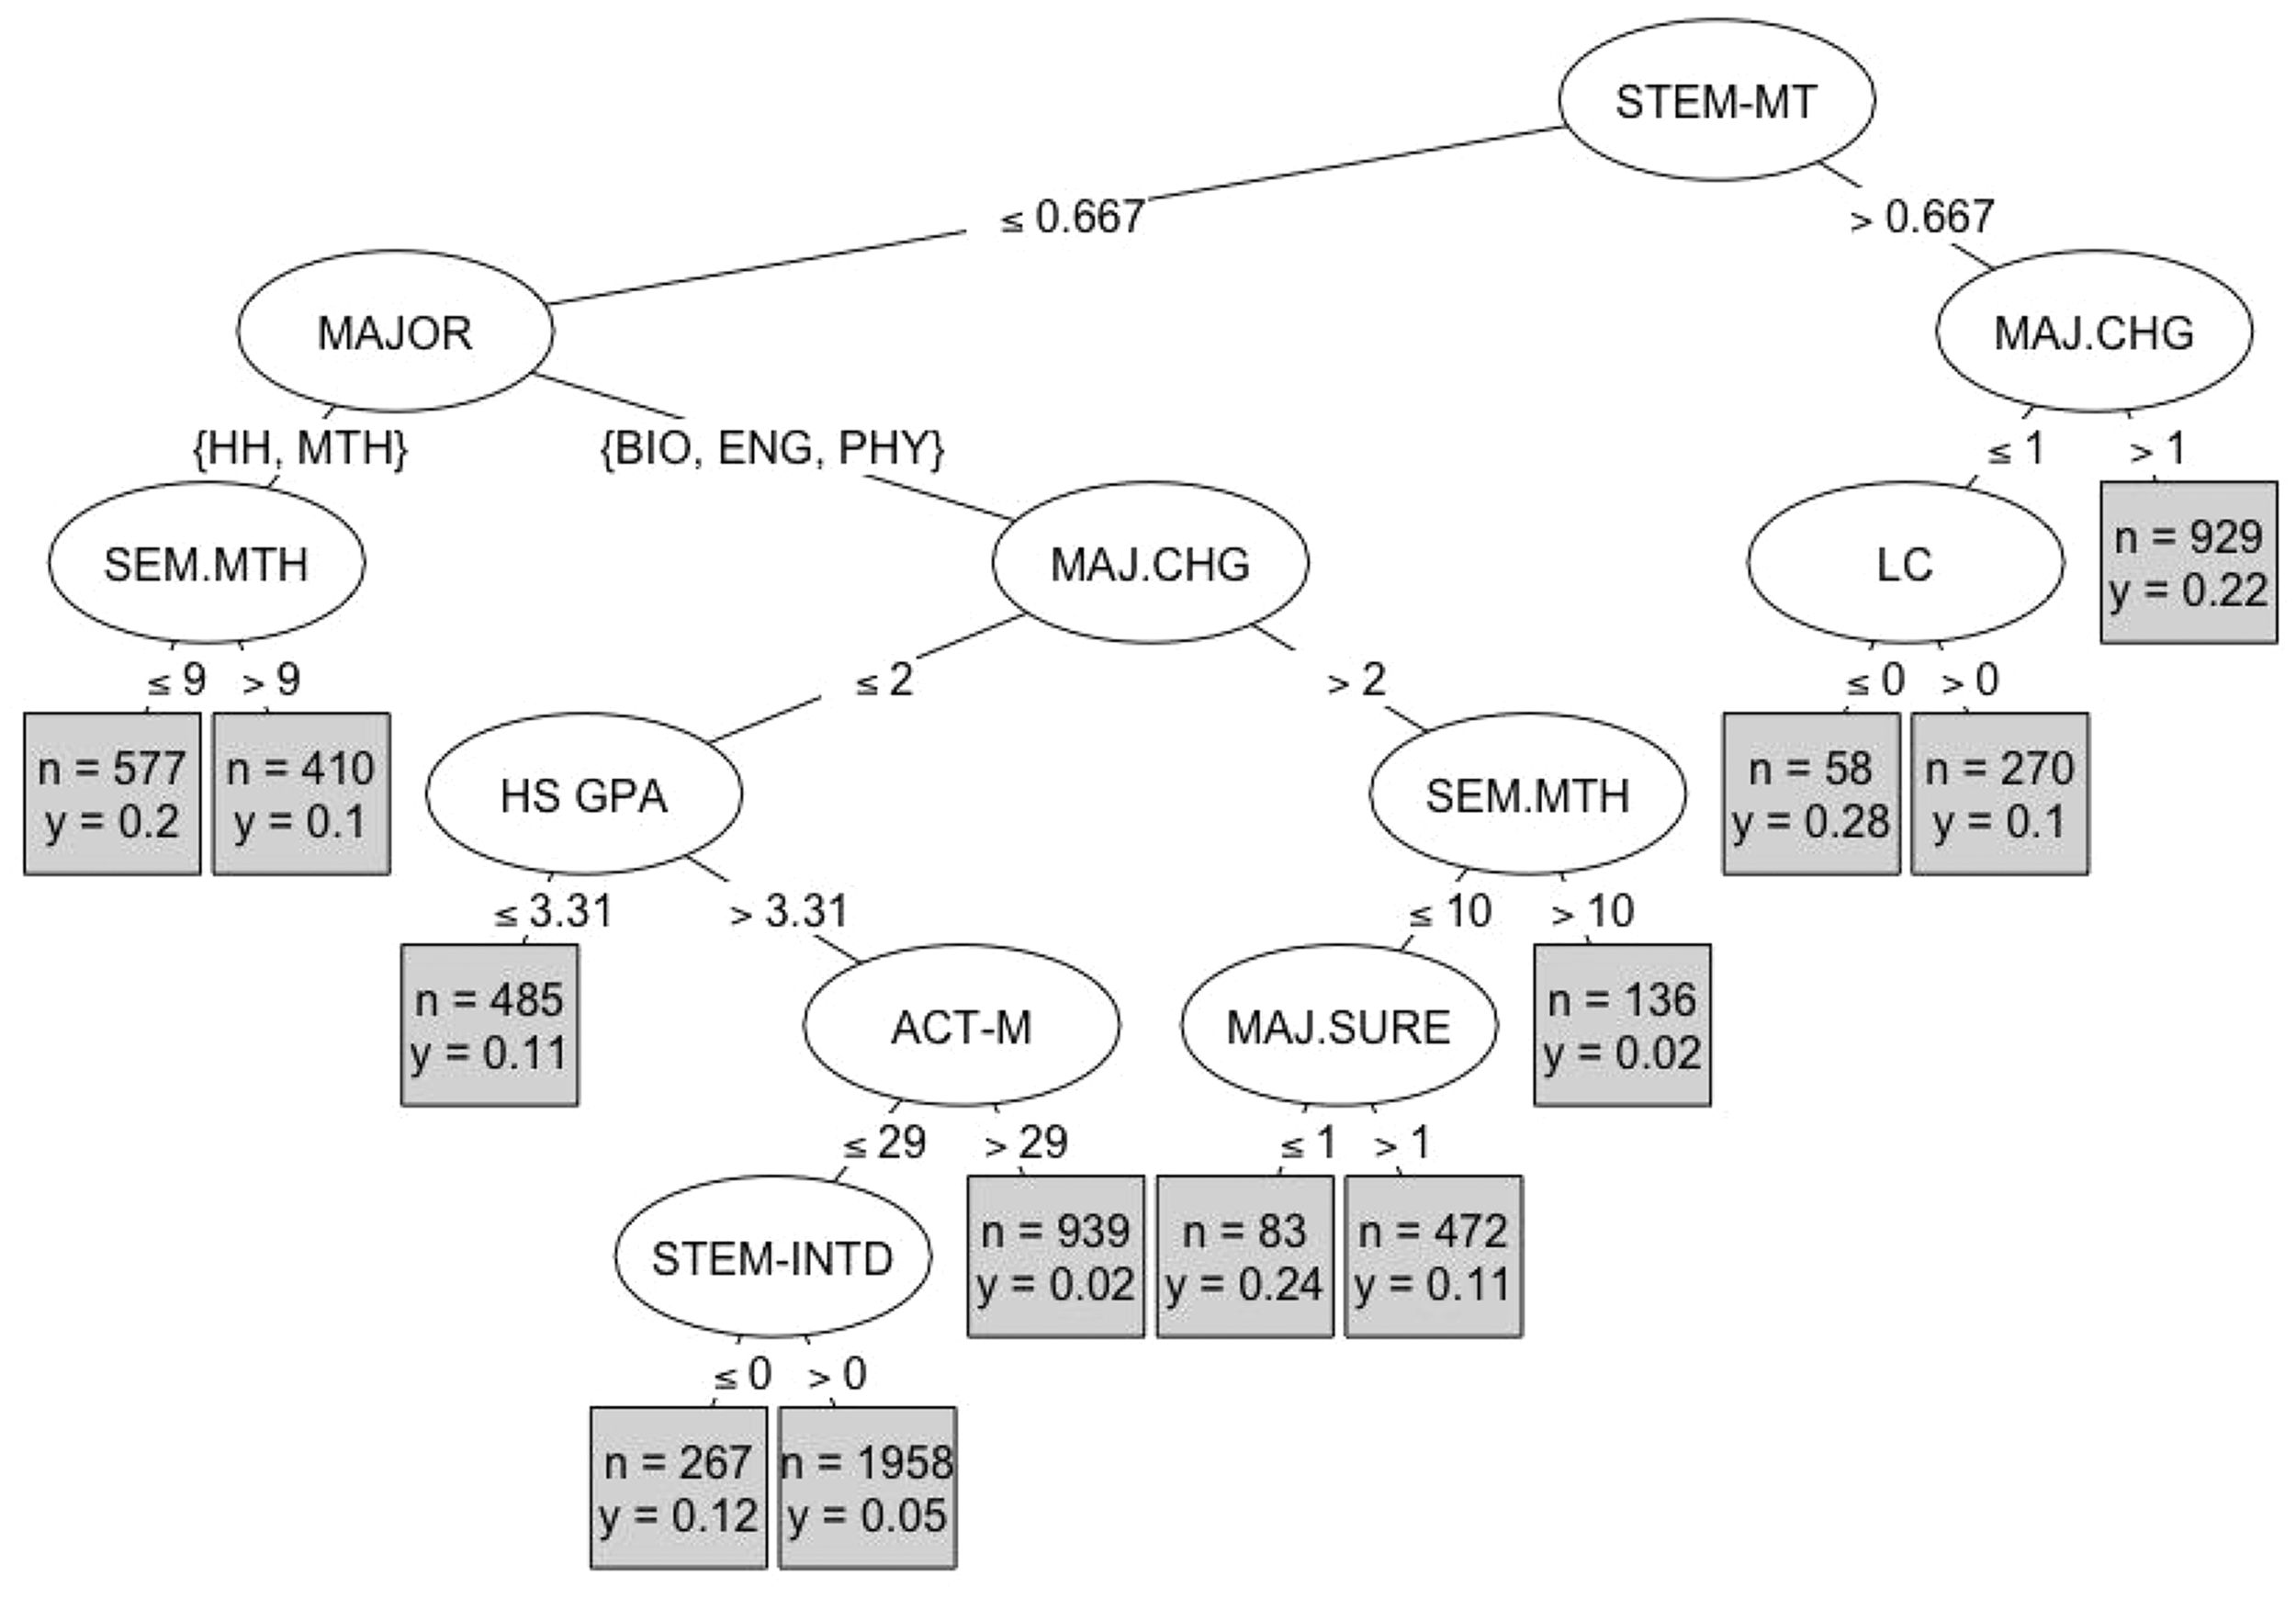
A single decision tree. See Table 2 for variable abbreviations.
Because random forests consist of a large number of trees, grown to great depths, it is difficult to discern the importance of explanatory variables visually. The algorithm discussed in the “Data and Methodology” section can be used to measure the importance of these factors. If a variable is rarely used for splitting nodes, then randomly permuting its values in Step 4 of the algorithm will have little impact. On the other hand, randomly permuting values of variables associated with variables used heavily in splitting will lead to a loss of important information and damage AUC. Table 4 gives variable importance scores that reflect the loss in AUC resulting from permutation of each group of variables divided by the total AUC loss over all groups of variables. Summaries are provided for both institutional retention and STEM retention. Figure 3 displays the results graphically and also breaks down importance scores by type of STEM major.
Relative Importance Scores for Each Category of Predictor Variables.
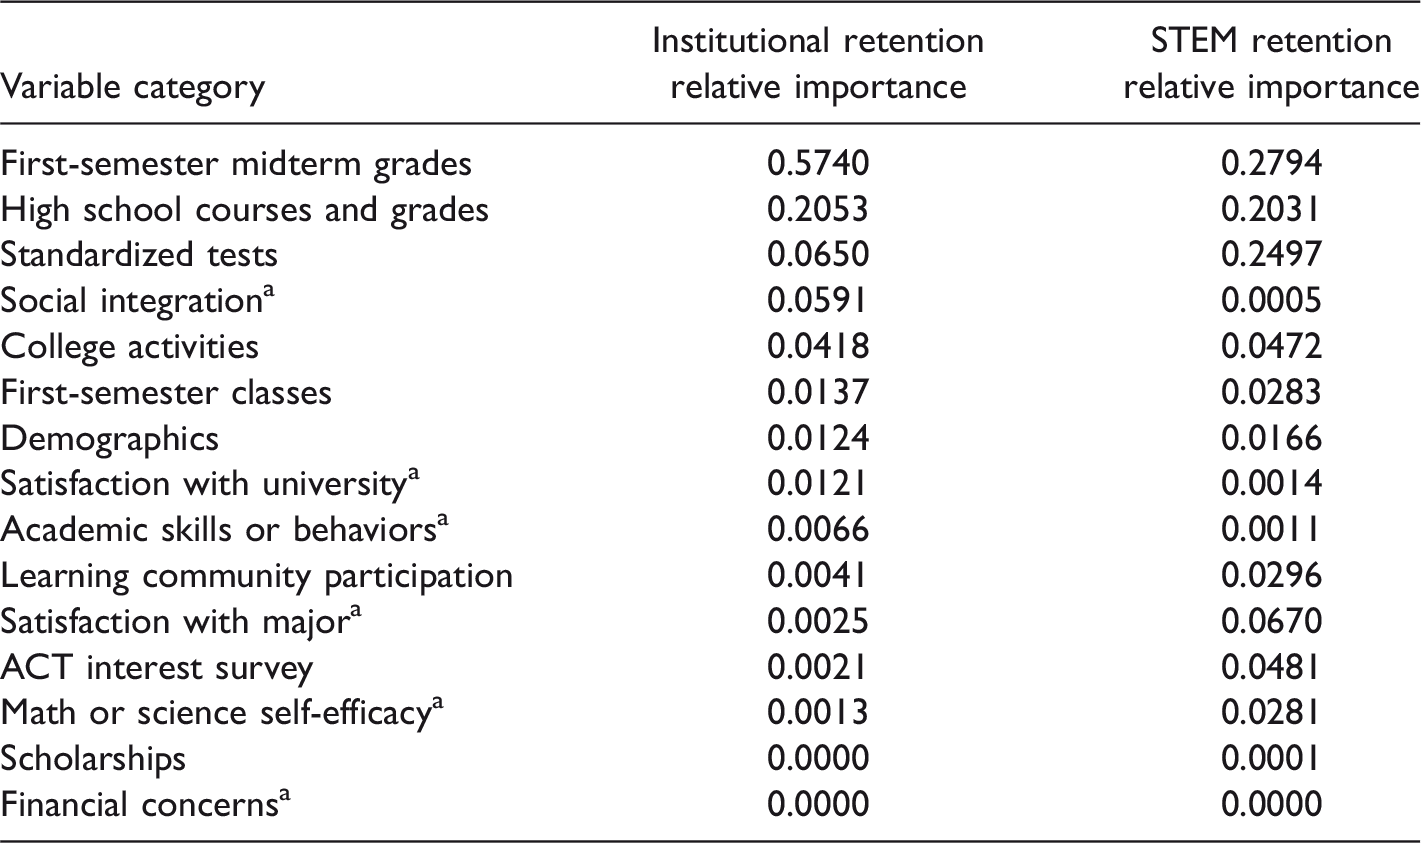
Note. STEM = science, technology, engineering, and mathematics; ACT = American College Testing.
aVariable from responses to MAP-Works® survey.
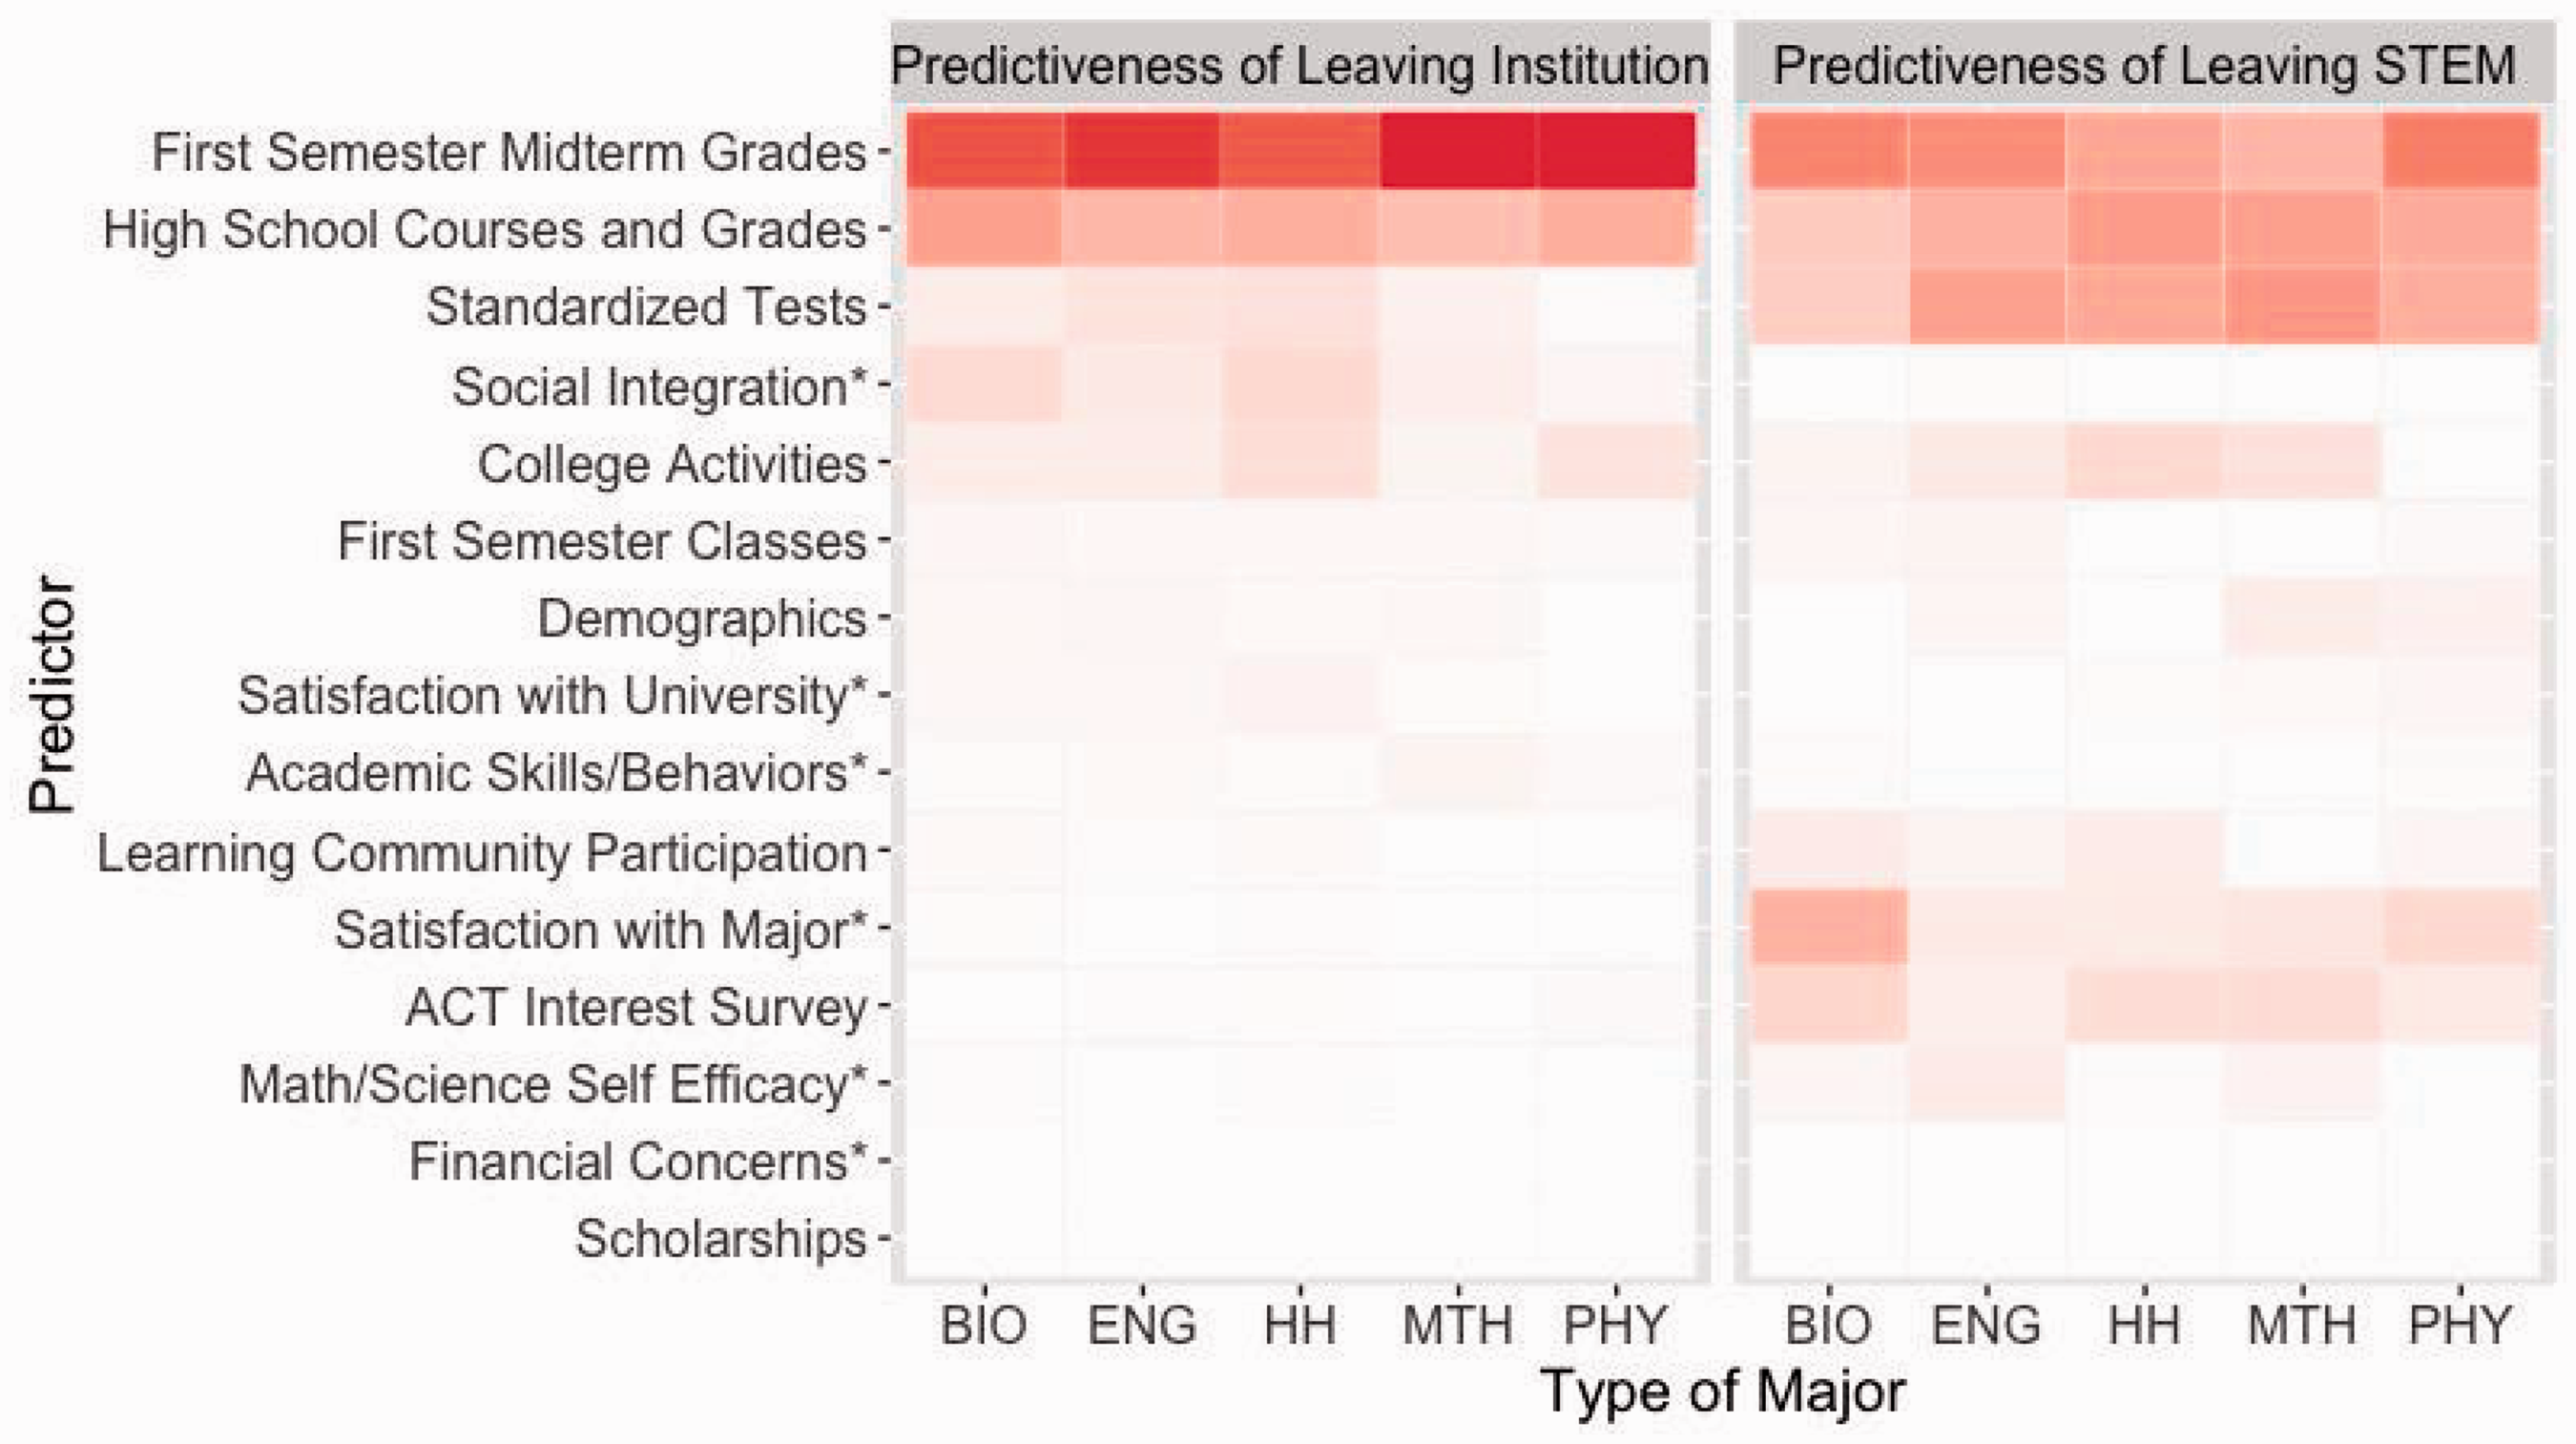
The importance of each category of predictor variable for each type of STEM major. *Variable from responses to MAP-Works® survey. STEM = science, technology, engineering, and mathematics.
For institution retention, the predictive importance of midterm grades is more than twice that of any other group of variables, with high school academics consistently ranking second. The importance of factors in the next tier of predictors, that is, social integration, participation in activities, and standardized test scores, vary somewhat across the majors but differences are small. Similarly for STEM retention, midterm grades have the most predictive importance, but a larger number of explanatory variables carry predictive value. Goals and interests, learning community participation, self-efficacy, and the MAP-Works® question pertaining to the likelihood of changing major are all stronger predictors of STEM retention than of institution retention. Table 4 and Figure 3 do not tell the direction of the impact that each type of variable has on STEM retention, only whether these sets of variables contain valuable predictive information.
We find that each aspect of Tinto’s retention model has some impact on the prediction. The variable groups of the current learning experiences (midterm grades), personal input (high school grades, test scores), and proximal environment (college activities and social integration) provide nearly all of the information needed for predicting institution retention. A student’s sense of social integration, as measured through MAP-Works®, has very little value in predicting STEM retention. The fact that a greater number of variables are valuable in predicting STEM retention than institutional retention is consistent with students changing majors for a wide variety of reasons, while students leaving the university commonly share important characteristics, making institutional retention easier to predict.
We note that variables with a large number of missing values are likely to be ranked as less important than they would be if full information was available. This is especially relevant for variables from the MAP-Works® (31% missing) and ACT interest (39.5% missing) surveys. When two or more predictor variables provide similar information, the random forest’s perceived importance of some of these variables is diminished. For example, if gender and ethnicity are strongly associated with other variables that are used, then removing both variables has little impact on predictive accuracy, even if both variables are associated with retention. Furthermore, it is possible that factors associated with retention will differ between different subgroups of students within each type of major.
Because the importance of factors differs between groups of majors, a one-size-fits-all approach to consider all STEM majors as a single group lowers predictive performance. For example, university activities contain more predictive information for health and human science majors than other kinds of STEM majors, while interests and goals are most prominent in predictions involving biological science majors (Figure 3).
Implications for Future Research
Our research is consistent with the belief that early academic performance is a strong predictor of retention both at an institution and within STEM. Future research might focus on the impact of student engagement early in their first semester of college. Measures of engagement such as the number of times a student visits a course webpage or the degree to which active learning strategies are used in a student’s courses might provide valuable information capable of improving the accuracy of at-risk predictions. Information about the number of times a student has had a one-on-one conversation with an advisor early in the first semester might also improve predictions.
Since our method is capable of identifying students who are at risk for leaving an institution, or leaving STEM, future work might investigate whether certain interventions are more helpful for one form of retention than the other. A similar approach could also be used to estimate the risk of students leaving specific majors, rather than the broader categories of majors considered here, or to predict graduate student retention.
The degree to which factors contributing to retention vary between particular subpopulations of students is an important question that requires future research. If certain factors are shown to carry particular importance in the retention of underrepresented students, then universities might use this information to improve diversity in STEM. To adequately address these questions, researchers should consider measures of integration and engagement in specific STEM courses in addition to the measures of social integration at the university overall, which were available in this study. Future research might also consider which interventions are most helpful for underrepresented students.
Conclusions
Our study sheds light on the differences between a student’s decision to leave STEM versus the institution while highlighting the importance of early academic experiences in both of these decisions. Our findings also point to places where universities could most effectively allocate resources, for example, on early academic success for both STEM- and university-wide retention. Example programs that foster skills for academic success include freshman orientation courses, learning communities, and student-centered teaching methods designed to keep students engaged (Crosling, Heagney, & Thomas, 2009; Graham, Frederick, Byars-Winston, Hunter, & Handelsman, 2013). Such programs have proven effective in increasing retention and improving diversity in STEM (Dagley, Georgiopoulos, Reece, & Young, 2016).
The alerts are an opportunity for proactive advising, which research has shown to be especially beneficial for students underrepresented in STEM (Rodgers, Blunt, & Trible, 2014). The alert provides advisers with each student’s individual risk factors, for example, a midterm grade of C− or below. Given the list of individual factors, advisors can meet with a student, guide possible interventions, and provide assurance that the student’s struggles are not unnoticed or out of the ordinary. If a student decides to switch majors, advisors can initiate a joint discussion to identify a different major better matching their interests and goals either inside or outside of STEM.
While our results are specific to the university at which the data were collected, they may be of greatest interest to similar large public universities emphasizing science and technology. The random forest approach can be tailored to other institutions with different proxies for the factors in Tinto’s model.
While early academic performance is the strongest predictor of retention both in STEM and at the university overall, social engagement, interests, and goals are also important in STEM retention. Our findings highlight the importance of offering academic support to freshmen early in their first semester. Providing advisors with major-specific information on the highest ranking factors that triggered an alert for individual students may be the most significant benefit of this early alert approach. This in turn may lead to increased STEM retention, as well as institutional retention.
Footnotes
Acknowledgments
The authors would like to thank Dan Nettleton for his suggestions on random forest methodology and Jonathan Compton and Aurelia Kollasch for their efforts in processing and providing the student data and are grateful for the suggestions of two anonymous reviewers, which helped strengthen the article.
Declaration of Conflicting Interests
The authors declared no potential conflicts of interest with respect to the research, authorship, and/or publication of this article.
Funding
The authors disclosed receipt of the following financial support for the research, authorship, and/or publication of this article: This work was supported by a grant to Iowa State University from the Howard Hughes Medical Institute through the Science Education Program.