



Abstract
Academic success is an important issue as employers are looking for individuals with a postsecondary education. But there are many important indicators of success besides grades. We conceptualized academic success at postsecondary as grade point average, acquisition of knowledge and skills, and overall satisfaction and examined how each conceptualization was predicted by student characteristics (perceived academic ability and drive to achieve) and experiences (academic and social integration). Using a 1-year longitudinal design, we found that perceived academic ability had a positive direct effect on grade point average and acquisition of knowledge and skills but not satisfaction, whereas drive had no direct relationships with the outcomes. Academic integration positively predicted all three indicators of success grades, but social integration was not associated with grades. Indirect effects were also noted. Our discussion highlights actions that postsecondary institutions can take to support students and considers how researchers should conceptualize student success.
Introduction
More than 20 million Americans were expected to attend a college or university in the Fall of 2017 (National Center for Educational Statistics, 2017). These students came to postsecondary campuses with diverse backgrounds, goals for their time, and expectations for what to anticipate in the coming year to name just a few individual differences. With these multifaceted differences across students, it is important to determine how best to support students in their academic pursuits. To provide this support, researchers, administrators, and faculty members must, at a minimum, understand the characteristics that students arrive on campus with, such as their goals and beliefs, how students experience the postsecondary environment, such has how they integrate into the academic and social systems of the campus, and how students envision academic success for themselves whether it be grade point average (GPA) or acquiring skills and competences. With these various components in mind, it quickly becomes clear that there are many factors at play when it comes to student success at postsecondary.
Not completing postsecondary education can have many consequences. Avery and Turner (2012) suggest that individuals who obtain bachelor’s degrees will earn 50% more over the course of their lifetimes than individuals who only have a high school diploma. Researchers have found that college graduates have higher job satisfaction and better health outcomes than those without a postsecondary degree (Barrow, Brock, & Rouse, 2013). Frank, Frenette, and Morissette (2015) found similar trends in Canada showing that between 2005 and 2012, individuals who graduated from postsecondary obtained higher earnings and were more likely to be employed full time than those with only a high school education. This maybe of concern for men especially as they have lower rates of attending postsecondary (U.S. Department of Education, 2017) and lower completion rates (Conger & Long, 2010). Therefore, understanding the characteristics of students and their experiences on campuses is important to support their success. The purpose of this study was to examine student characteristics and experiences as antecedents of several indicators of academic success.
Achieving Academic Success
For many people, academic success is arguably the most important outcome of postsecondary education. Yet examining postsecondary success is difficult because success can be conceptualized, defined, and measured in many ways. There is no consistent definition of academic success, and some researchers suggest that the term is used as a catch-all phrase for a wide variety of student outcomes (Krumrei-Mancuso, Newton, Kim, & Wilcox, 2013; Robbins et al., 2004; York, Gibson, & Rankin, 2015) including grades, GPA, satisfaction, and learning and developing knowledge. Variability in definitions of academic success can be seen in qualitative research studies that asked students to define academic success (Jennings, Lovett, Coba, Swingle, & Lindkvist, 2013; Osters & Roberts, 2007; Strang, 2015), resulting in various notions of academic success related to a number of criteria or indices. This lack of singularly when it comes to the definition of academic success raises questions for researchers in terms of what indicators to collect, for administrators in terms of what outcomes to support, and for students as they wrestle with making sense of internally and externally imposed indicators of success.
Borden and Holthaus (2018) comment that while there is variability in how to define student success, in quantitative research, it is largely equated to measures that are “readily available” (p. 150) which can include measures such as degree completion, credits obtained, and grades. Indeed, grades or GPAs are the most commonly utilized indicator of academic success in research (Lounsbury, Fisher, Levy, & Welsh, 2009; York et al., 2015). In fact, GPA was used to assess academic success in more than half (54.5%) of the articles included in a recent literature review of York et al. (2015). Students at postsecondary are often graded and often discuss success in terms of grades (Jennings et al., 2013; Osters & Roberts, 2007). According to this indicator, men would be considered less successful than women at postsecondary because they tend to have lower GPAs on average (Conger & Long, 2010).
Although easily accessible, grades may not be as objective as they appear. There is wide variability in how students are assigned grades (Brookhart et al., 2016), in grading policies across differences departments or disciplines (Beatty, Walmsley, Sackett, Kuncel, & Koch, 2015; Willingham, Pollack, & Lewis, 2002), in the configuration of marks for each student giving rise to grades (Kaplan, 2016), and in the meaning of grades assigned according to a curve compared with an absolute system. To the extent that there is error in grades, there is error in this indicator of success (Kaplan, 2016). Nonetheless, researchers, funders, administrators, parents, and students focus on grades because they give the appearance of being an “objective” measure of success and are highly relevant for students’ progress through postsecondary (Kaplan, 2016).
Not dismissing the relevance of grades, other indicators of success that may be considered more subjective warrant consideration (Strang, 2015; York et al., 2015). More subjective indicators can include students doing their best, achieving personal goals, satisfaction (Osters & Roberts, 2007), enjoying social and residential life, and being academically engaged (Jennings et al., 2013) among others. Focusing on this sort of broader conceptualization of success, Kuh, Kinzie, Buckley, Bridges, and Hayek (2006) identified academic success as “academic achievement, engagement in educationally purposeful activities, satisfaction, acquisition of desired knowledge, skills and competencies, persistence, attainment of educational outcomes and post-college performance” (p. 7). Building on Kuh et al. (2006), York et al. (2015) conducted a literature review on defining academic success and identified six key components of success: (a) academic achievement, (b) acquisition of skills and components, (c) attainment of learning outcomes, (d) satisfaction, (e) persistence, and (f) career success. Arguably, a number of criteria for examining academic success identified by these researchers are subjective, and we have chosen to focus on acquisition of knowledge and skills and satisfaction as two subjective indicators of academic success to investigate alongside grades.
Acquisition of knowledge and skills
Through the course of their studies, students are expected to develop knowledge and skills in their program, which can be seen in the learning objectives of their various courses. Nevertheless, there are many challenges when it comes to considering the knowledge and skills acquired by students, such as who decides which learning objectives are to be considered (Thurmond & Popkess-Vawter, 2003) and the challenge with multiple perspectives (Astin & Antonio, 2012). As such, one instructor might consider certain knowledge and skills essential to the students learning while others may not. This places subjective value on the learning outcomes to be obtained and what is considered important for students to learn. As such, we examine the acquisition of knowledge and skills from the perspective of the students who have chosen to come to postsecondary. Furthermore, assessment of knowledge and skills is a continuous process throughout the student’s degree, and therefore, we have opted to examine students’ perceptions at the end of their first semester.
Satisfaction
Satisfaction is defined as the individual’s enjoyment of their experiences as a student (Lent, Singley, Sheu, Schmidt, & Schmidt, 2007) and as such may be considered a subjective and multifaceted indicator of success. In terms of measurement, for example, the Student Satisfaction Inventory includes 11 categories of satisfaction (Bryant, 2006; Elliot & Healy, 2001), whereas common job satisfaction scales have argued for the adequacy of single items (Dolbier, Webster, McCalister, Mallon, & Steinhardt, 2005). Although course satisfaction is often positively associated with course grade, it has also been shown to be positively associated with mastery orientation (Svanum & Aigner, 2011) and previous levels of satisfaction (Grayson, 2004), suggesting that it is not simply a different perspective on grades. Perhaps more than grades or skills, students’ feelings of satisfaction may fluctuate in response to certain events in their academic life. As such, we have decided to measure satisfaction as one’s overall satisfaction and measure this construct at the end of their first year of studies. The student is able to reflect on the positives and negatives and rate their overall satisfaction.
Theoretical Framework: The Inputs–Environment–Outcomes Model
Not only are there many indicators of success, but there are countless variables that can influence students’ attainment of success. Astin suggests that “any educational assessment project is incomplete unless it includes data on student inputs … and the educational environment to which the student is exposed” (Astin & Antonio, 2012, p. 19). Based on the tenets of reciprocal determinism (Bandura, 1978), Astin developed the Inputs–Environment–Outcomes (I-E-O) model to examine these multiple components. For the purposes of this research, we operationalize outcomes in terms of the three indicators of academic success described above. Astin defines inputs as the academic or personal experiences and characteristics that students bring with them to postsecondary institutions. The environment represents the “lived experiences” of students while attending postsecondary (Astin & Antonio, 2012, p. 87). As was the case with academic success, there are many operationalizations of inputs and environments.
Researchers often use the I-E-O model to examine the experiences of students during their postsecondary studies. For example, Keup (2006) included a variety of demographic and background characteristics as inputs and a large number of variables as environment that were categorized as institutional characteristics and first-year experience and involvement. These components were used to predict academic success in terms of college GPA and self-assessed cognitive development in two regression analyses. Strayhorn (2012) also examined the I-E-O model, utilizing several fixed traits (e.g., sex and ethnicity) as inputs, and environment included various engagement items including faculty–student interactions to predict social and personal development of students in the regression analyses. Our work extends previous research by examining the I-E-O model utilizing structural equation modeling (SEM) to examine multiple dependent variables at once. This statistical approach also allowed us to examine the nuanced relationships between the components within the model. In the following, we address how we have conceptualized the components of the I-E-O model.
Student Characteristics as an Antecedent of Academic Success
The list of inputs students bring with them to postsecondary education is extensive and includes various qualities such as demographic information, educational background, degree aspirations, financial status, disability status, career choice, life goals, reasons for attending college, academic self-concept, achievement aspirations and expectancies, parental education, and goal commitment to name just a few major categories (Astin, 1993; Astin & Antonio, 2012; Sam et al., 2013; Thurmond, Wambach, Connors, & Frey, 2002). Bringing some order to this list, Robbins et al. (2004) suggest that most predictors of achievement can be classified as (a) traditional, (b) demographic, or (c) psychosocial. Traditional (e.g., high school grades, standardized test scores) and demographic (e.g., socioeconomic status, gender) predictors are the most common in research (Krumrei-Mancuso et al., 2013; Pritchard & Wilson, 2003) even though they are largely stable and long-standing characteristics that are unlikely or difficult to change (Krumrei-Mancuso et al., 2013; Robbins et al., 2004). In contrast, psychosocial predictors have proven to be malleable and, therefore, are a promising category to consider as inputs.
Even within the single category, psychosocial variables are numerous and have been shown to have different relationships with indicators of success, including grades. Robbins et al. (2004) conducted a meta-analysis to examine psychosocial and study skill factors that predicted college students’ GPA and persistence as measured by student retention. Two psychosocial predictors emerged as particularly strong. First, students’ academic self-efficacy was the strongest predictor of GPA with a large effect size even greater than that of SAT scores. Second, students’ motivation to achieve success was also an important predictor of GPA. Both of these factors also had moderate relationships with persistence, suggesting a broader relationship with indicators of student success.
Subsequently, Richardson, Abraham, and Bond (2012) found that performance self-efficacy, which was defined as the student’s ability to draw on past experiences to formulate expectations for their performance on a task, had the highest correlation with GPA. More recently, Fong et al. (2017) examined various psychosocial factors and their connection to two measures of academic success: persistence and achievement. Similarly, relationships between self-perceptions in relation to academic achievement and persistence were positive. Schneider and Preckel (2017) conducted a meta-analysis and found a large effect size for performance self-efficacy on achievement. These studies highlight the importance of self-beliefs when it comes to student success in terms of grades and persistence. Building on the importance of psychosocial variables in explaining success, we chose self-beliefs related to academic ability and drive to achieve as the student characteristics to be utilized as the inputs in our model.
Student Integration as Mediators to Academic Success
The list of variables that could be considered as part of students’ experiences with the postsecondary environment is similarly extensive. Postsecondary institutions represent a new achievement environment where students must adjust to what seems like a limitless list of things. Specifically, during the first year of college, students must learn how to navigate the rigorous pace of the academic environment as well as adjust to a new social surrounding (Budny & Paul, 2003). To examine the educational environment the student is navigating, we turn to the Tinto’s (1975, 1999, 2006) influential Student Integration Model.
Tinto’s (1975) model was developed to examine the dropout behavior of students at postsecondary. He drew from the work of Durkeim (1961) that examined suicide, and how individuals who are not sufficiently integrated into society are more likely to commit suicide. From this, Tinto considered postsecondary environments as having two systems—academic and social. Lack of integration into one or both of these systems, Tinto proposed, would result in student withdrawal (i.e., dropout) from their studies. Academic integration can include researching in the library, attending class, and interactions with faculty (Chrysikos, Ahmed, & Ward, 2017; Tinto, 1975). Overall, these components involve the intellectual development of the student (Meeuwisse, Severiens, & Born, 2010). Lack of academic integration may lead to low grades, and as a result, the student may be required to leave the institution (Tinto, 1975). Social integration can include interactions with peers, or being involved in extracurricular activities like clubs or sports (Chrysikos et al., 2017; Meeuwisse et al., 2010). Lack of social integration can lead to the student feeling disconnected from others on campus, increasing their likelihood of leaving the institution (Tinto, 1975). Tinto referred to this as voluntary withdrawal, whereas lack of academic integration would result in forced withdrawal. If the student is able to academically and socially integrate into the postsecondary environment, it is suggested that they will have higher commitment and motivation to continue with their degree (Tinto, 1975, 1999).
Of course, integration is not a perfectly linear process. The two types of integration could overlap (Beekhoven, De Jong, & Van Hout, 2002) and as with the other constructs in the current investigation that leads to methodological complexities . Nonetheless, the guidance afforded by Tinto far outweighs the complexity. Thus, for the currently study, we examine academic and social integration independently. We conceptualize academic integration as the ease of adjustment to postsecondary and social integration as sense of belonging.
Research by Woosley (2003) examined students’ social and academic experiences at postsecondary. Students were surveyed within the first 3 weeks of their first year regarding their initial social (e.g., I feel that I fit in well at [university name]) and academic adjustment (e.g., I am managing my time well). Academic success was measured based on degree obtainment within 5 years. Degree completion was significantly related to both initial social and academic adjustment, while only initial social adjustment significantly predicted degree completion. Woosley argued that academic adjustment was not significant as it would be difficult for students to determine within the first 3 weeks. More recently, Ishitani (2016) examined the impact of academic and social integration on first-year persistence. Academic integration was found to have a positive and significant effect on students’ first-year persistence while social integration was not significant. However, academic integration was measured by examining a number of items such as how often they participated in study groups and talked with faculty members outside of class which presumably could also have a social component. Also of note, Ribera, Miller, and Dumford (2017) examined sense of peer belonging (i.e., social integration) and institutional acceptance (i.e., academic integration) of first-year students. They determined that while female students reported similar levels of peer belonging as male students, the female students also reported lower levels of institutional acceptance. In contrast to this, women have been shown to have higher levels of social integration than men, and this translates into higher commitment (Jones, 2010).
The Current Study
Utilizing the Inputs–Environment–Outcomes (I-E-O) model of Astin (Astin & Antonio, 2012) as our theoretical model, we examine the connections between student psychosocial characteristics as inputs, student integration as environment, and indicators of academic success as outcomes. By design, the model suggests relationships between student characteristics and academic success are at least partially mediated by the interceding construct of student integration. Furthermore, logically, students’ characteristics are hypothesized to begin the progression because the characteristics students bring with them to postsecondary will naturally influence their integration once they arrive, and the student integration will in turn impact students’ resultant academic success (see Figure 1).
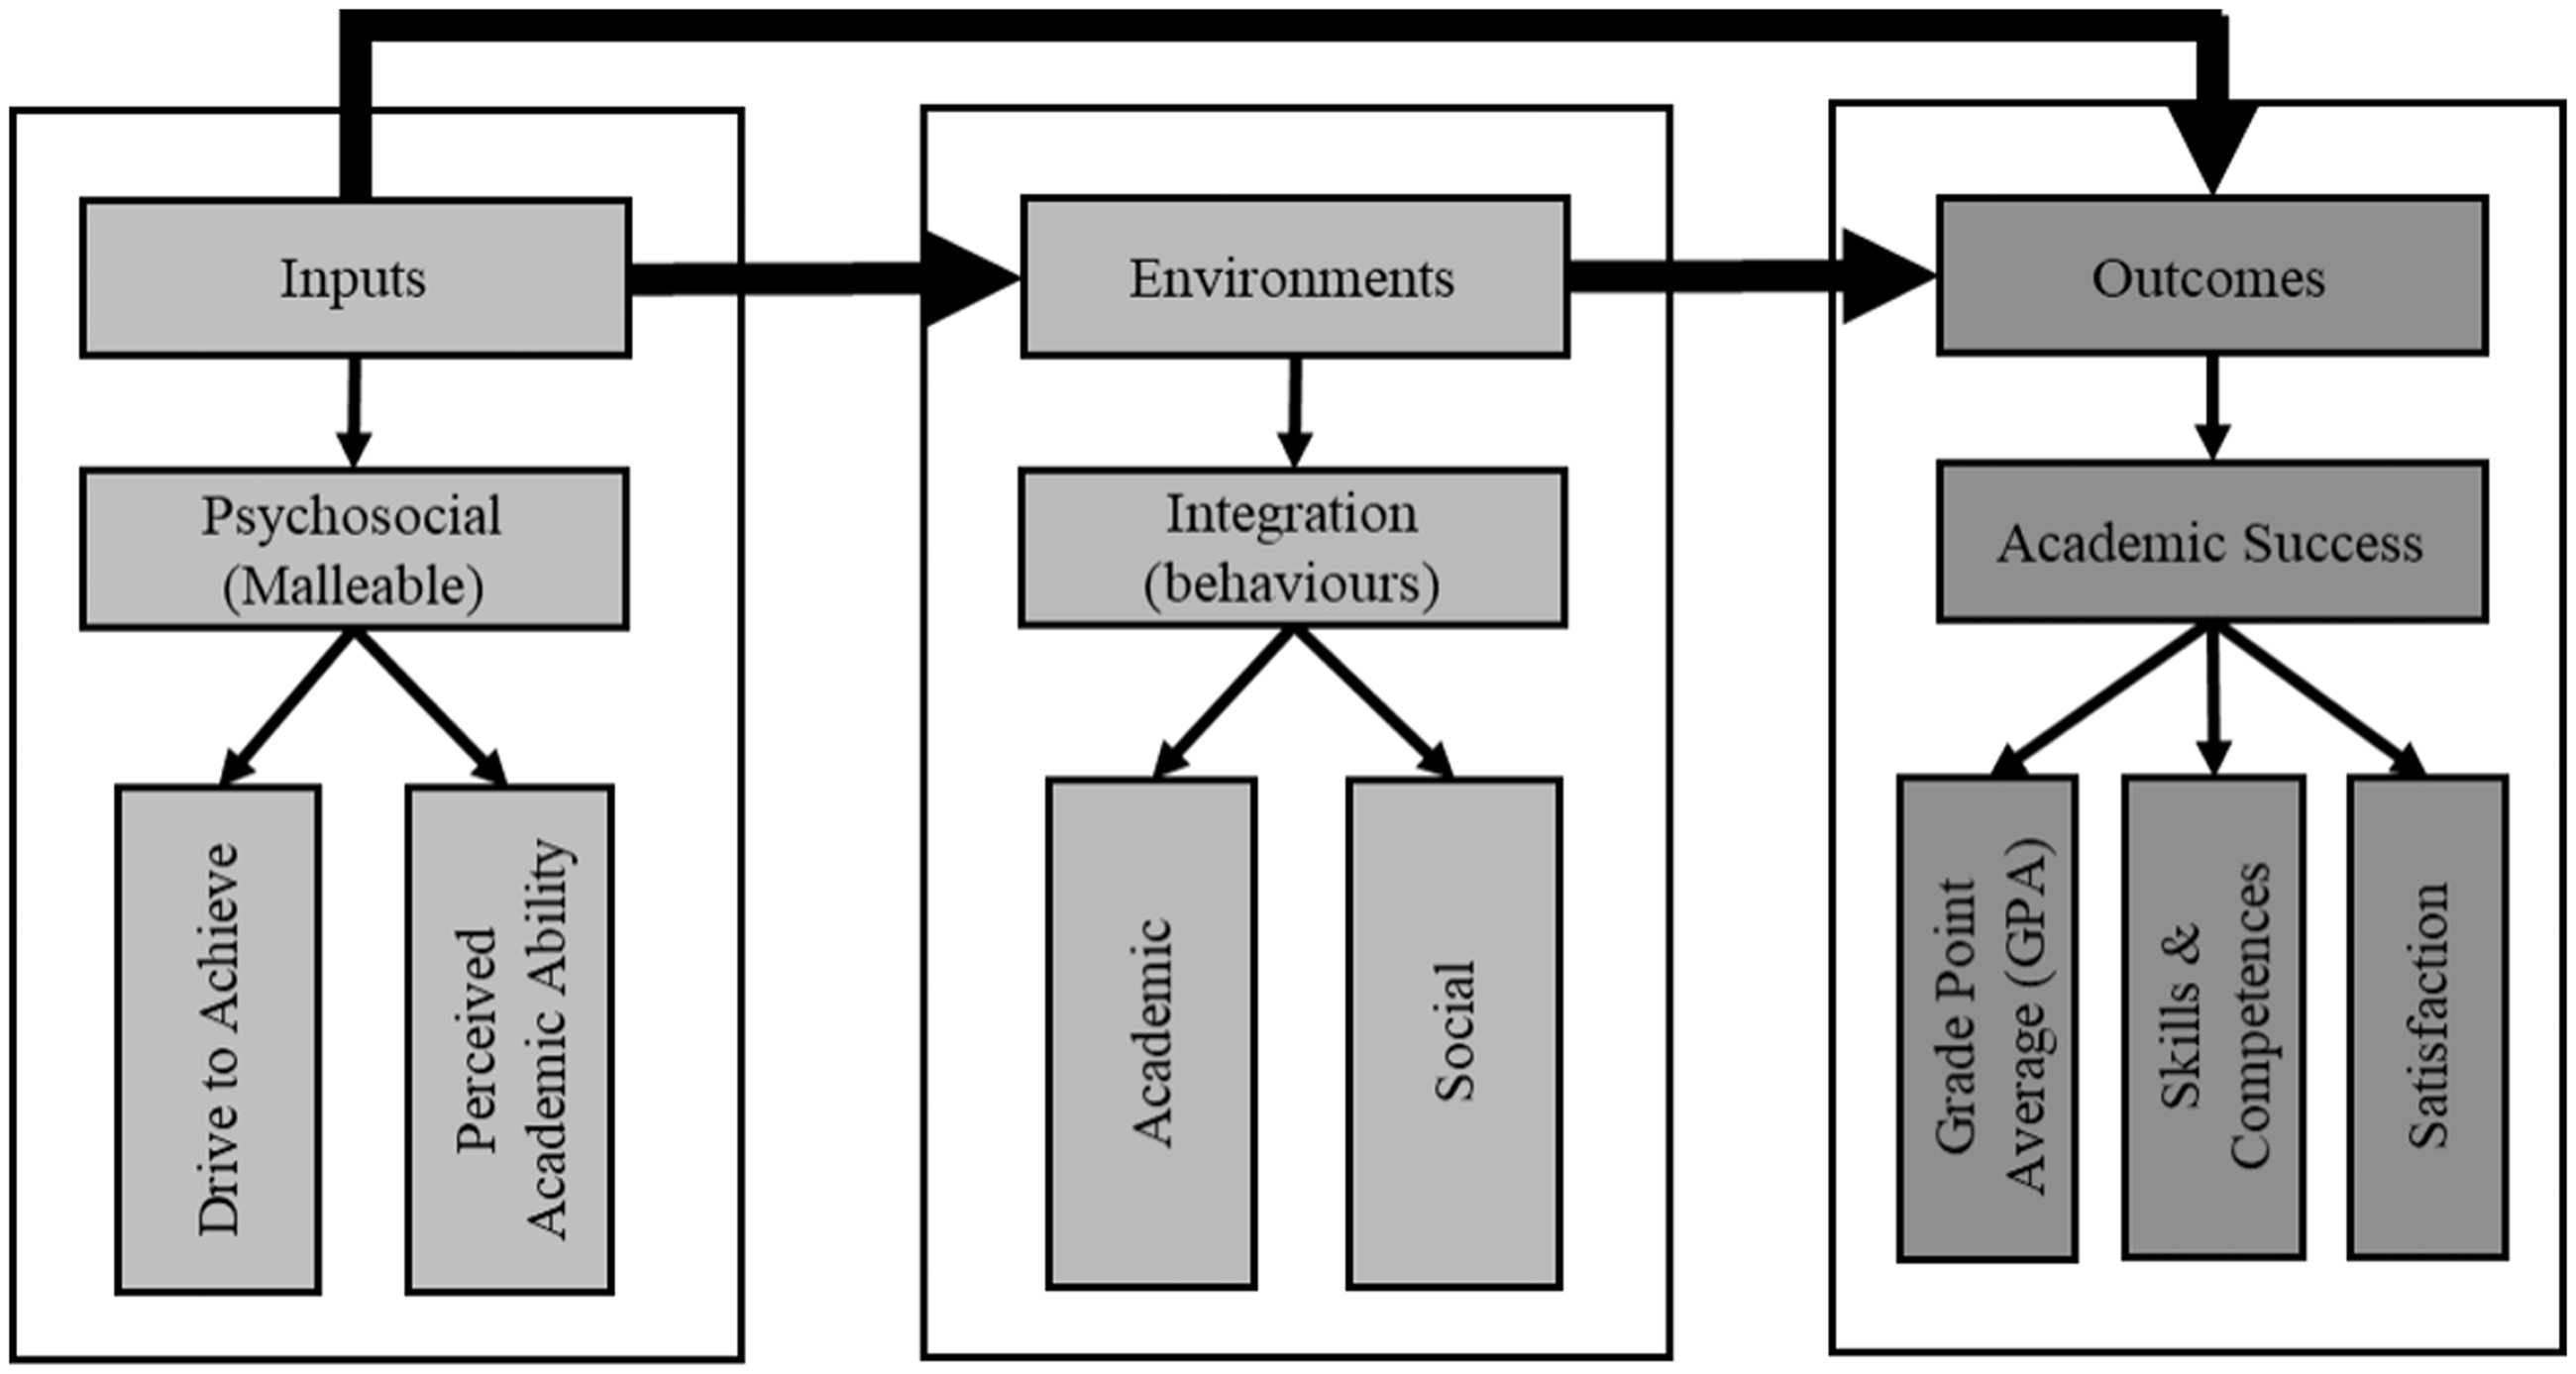
Astin’s I-E-O model conceptualized.
As such, our research questions were as follows: (a) How are student psychosocial characteristics at the start of the year (perceptions of academic ability and drive to achieve) related to three different indicators of student success (GPA, acquisition of knowledge and skills, and satisfaction) after their first year of studies? (direct effects I→O), (b) how do student academic integration (ease of adjustment to postsecondary) and social integration (and sense of belonging) relate to three different indicators of student success after their first year of studies? (direct effects (E→O), (c) to what extend does student integration mediate the relationship between the inputs and outcomes? (the indirect effects (I→E→O), and (d) are these relationships moderated by gender?
Method
In the present study, we undertook a secondary analysis of American college students’ self-reported quantitative data that were collected by the Higher Education Research Institute (HERI) through their Cooperative Institutional Research Program. HERI has been collecting data from postsecondary students for decades and allows nonaffiliated researchers to submit proposals requesting access to portions of their data. Their mission is to “inform educational policy and promote institutional improvement through an increased understanding of higher education and its impact on college students” (HERI, https://heri.ucla.edu/cirp-freshman-survey/). Annually, HERI recruits college students to complete The Freshman Survey in the fall semester and the Your First College Year survey in the winter semester of their first year. Participants’ responses to the two surveys are matched to create a longitudinal dataset spanning 1 academic year. The surveys include questions on a wide range of factors relevant to college students including but not limited to demographics (e.g., sex, age, ethnicity); school experiences (e.g., how much time do you spent during a typical week studying); aspirations (e.g., what is the highest academic degree that you intend to obtain); and opinions (e.g., the death penalty should be abolished). Participants complete the survey online/pencil and paper/in specific classes/consent procedures on an institution by institution bases. In our proposal, we requested access to specific items from the most recent surveys that we could use to operationalize various components of the Inputs–Environment–Outputs model. HERI sent us a data file of our requested items for matched participants on The Freshman Survey of 2014 and the Your First College Year survey of 2015, henceforth referred to as Time 1 and Time 2 in the present study. The University of Alberta Research Ethics board granted ethical approval for the plan of analyses (Pro00085240).
Participants
The dataset provided by HERI consisted of 6,835 students. For this study, we restricted the sample to typically developing first-year young college students. Therefore, we removed students who graduated from high school or began postsecondary in a year other than 2014 or were older than the age of 20 or if they identified as having a disability status. This left us with 5,796 students. An additional 596 students were also removed for incomplete data, and 198 students were randomly removed from the dataset and reserved for a separate analysis (see Goegan & Daniels, 2019). Therefore, the final dataset consisted of 5,002 students who provided responses at both the beginning and end of their freshman year.
Participants were from 39 postsecondary institutions across the United States. The students in this sample had an average age of 18.25, 34.8% identified as male, and 65.2% identified as female. Students came from families with an average income of between 60,000 to 74,999. When asked about their ethnicity, 67.9% identified as White/Caucasian, 19.8% Asian American/Asian, 6% African American/Black, 6% Mexican American/Chicano, 1.6% Puerto Rican, 1.5% Native Hawaiian/Pacific Islander, 1.4% American Indian/Alaska Native, 5% Other Latino, and 3.1% Other. Note that these percentages add up to greater than 100 as some individuals identified as more than one ethnicity (12.3%). Students also identified a number of intended majors, including English, Biology, Environmental Science, Accounting, Business, Finance, Marking, Management, Education, Engineering, Nursing, Chemistry, Economics, Political Science, and Psychology.
Measures
Demographics
To describe the sample, we requested access to four demographic variables collected at Time 1: age, sex, intended major, and average family income (as a measure of socioeconomic status; see Table 1). We also accessed students’ high school GPA to include as a covariate in the main analyses.
Descriptive Statistics of Study Variables (n = 5,002).
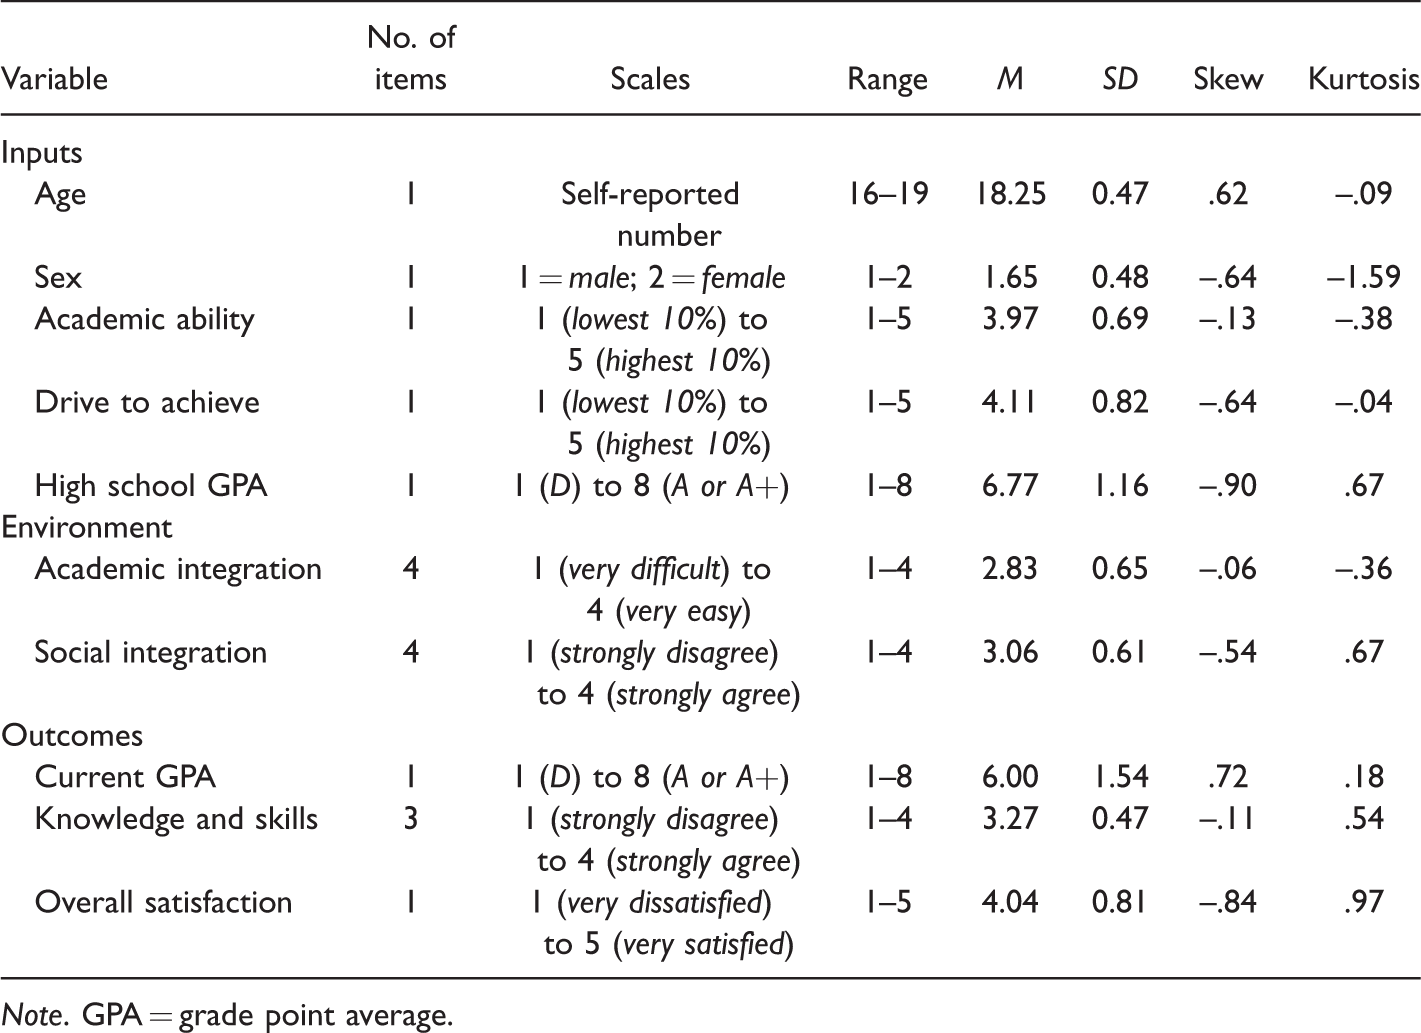
Note. GPA = grade point average.
Student characteristics: inputs
To assess the inputs component of the I-E-O model, we accessed two items from the Time 1 survey: perceived (a) academic ability and (b) drive to achieve. Participants responded to the stem: Rate yourself on each of the following traits as compared with the average person your age. We want the most accurate estimate of how you see yourself. Participants rated themselves on a scale from 1 (lowest 10%) to 5 (highest 10%) for each of these single items. Thus, higher scores indicate more perceived academic ability and drive to achieve, respectively.
Student integration: environment
We accessed eight items from the Time 2 survey and used them to create two variables related to the environment component of the I-E-O model. The first integration variable was academic integration to postsecondary education. To create the variable, we used students’ response to four items following from the prompt: Since entering this college, how has it been to (a) understand what your professors expect of you academically, (b) develop effective study skills, (c) adjust to the academic demands of college and (d) manage your time effectively. Responses were recorded on a scale from 1 (very difficult) to 4 (very easy). Scores presented in Table 1 were created by averaging participants scores across these four items (α = .82). High scores on academic integration suggest the student found it easier to adjust to postsecondary education.
The second integration variable was students’ social integration. To create the variable, we used students’ responses to four items following from the prompt: Please indicate the extent to which you agree or disagree with the following statements: (a) I see myself as part of the campus community, (b) I feel valued at this institution, (c) I feel a sense of belonging to this campus, and (d) I feel I am a member of this college. Responses were recorded on a scale from 1 (strongly disagree) to 4 (strongly agree). Scores presented in Table 1 were created by averaging participants scores across these four items (α = .89). A higher score on belonging indicated the student felt more belonging on campus.
Academic success: outcomes
We identified and accessed three relevant outcomes in the Time 2 survey: (a) current GPA, (b) acquisition of knowledge and skills, and (c) overall satisfaction. For current GPA, students were asked: What is your overall grade average (as of your most recently completed academic term)? Students responded on an 8-point scale from 1 (D) to 8 (A or A+). Thus, higher scores indicated higher academic achievement. To measure knowledge and skills, students were provided with the following instructions: Please rate your agreement with the following statements: This institution has contributed to my (a) intellectual and practical skills (including inquiry and analysis, critical thinking, and information literacy), (b) knowledge of a particular field or discipline, and (c) problem-solving skills. Scores presented in Table 1 were created by averaging participants’ scores across these three items (α = .82). Higher scores indicate more perceived obtainment of knowledge and skills at their postsecondary institution. To assess student overall satisfaction with their first year of postsecondary education, students responded to the single item: Please rate your satisfaction with this institution on each of the aspects of college life listed below, and responses were recorded on a scale from 1 (very dissatisfied) to 5 (very satisfied) to the item overall satisfaction.
Rationale for Analyses
We conducted the analyses in five steps. First, we ran preliminary analyses on the full sample that included descriptive statistics (see Table 1) and correlations among manifest study variables (Table 2). This allowed us to obtain information about the students, observe trends in the data, and assess the distribution of the variables. Second, we randomly divided the sample into two separate groups (n = 2,501 × 2). Because a random half sample is still more than adequately powered to run the analyses (Kline, 2016), the advantage of splitting the sample was that we could conduct the main analyses twice for the purposes of cross-validation. Third, with the first half of the sample, we utilized structural equation modeling with latent variables where possible in AMOS 24.0 to answer our research questions regarding direct and indirect effects. Fourth, we tested the model for gender invariance. Fifth, we repeated the analyses on the second half of the sample for the purposes of cross-validation.
Correlation Matrix of Study Variables.
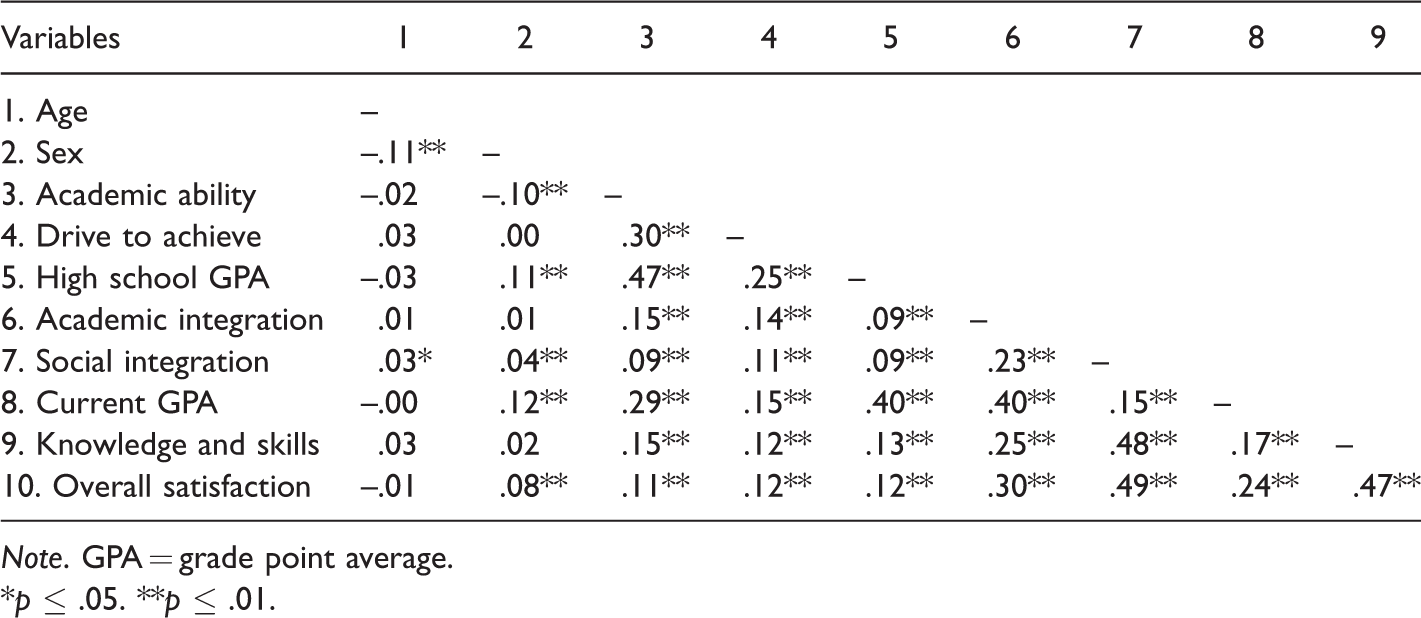
Note. GPA = grade point average.
*p ≤ .05. **p ≤ .01.
The SEM analyses were conducted on each random half sample separately as follows. First, we began the latent analysis by using confirmatory factor analysis (CFA) to assess the adequacy of the measurement model of ease of adjustment, sense of belonging, and acquisition of knowledge, and skills as latent variables. Second, we tested the structural model, which consisted of three latent variables and four manifest indicators of the remaining variables using maximum likelihood estimation. Specifically, we estimated a fully recursive model that included all possible paths between the inputs, environment, and outcome variables (Cortina, 2005). All variables were connected to all subsequent variables producing a unidirectional model (Kline, 2016). In addition, we controlled for the influence of high school GPA to current GPA. In total, we estimated 17 direct structural paths. We considered overall model fit to be adequate when chi-square is nonsignificant (Garson, 2008; Schumacker & Lomax, 2004), the comparative fit index (CFI) value is ≥.90 (Kline, 2016; McDonald & Ho, 2002), the root mean square error of approximation (RMSEA) value is <.06 (Garson, 2008; Hu & Bentler, 1999; McDonald & Ho, 2002), and standardized root mean square residual (SRMR) is <.08 (Hu & Bentler, 1999). Third, we tested the structural model for gender invariance using a chi-square difference test (Byrne, 2001) and examining direct changes in CFI (Cheung & Rensvold, 2002; Putnick & Bornstein, 2016). To do this, we constrained all structural paths to be equal between male and female participants (Byrne, 2001; Byrne & Watkins, 2003) and examined the change in goodness of fit between the unconstrained and constrained models. Any model in which the CFI changed by <.01 was considered invariant across genders (Cheung & Rensvold, 2002; Putnick & Bornstein, 2016). Fourth, we examined 6 indirect effects by running 1,000 bootstrapped estimates of the model and examining the associated confidence intervals.
Results
Preliminary Analyses
We assessed normality of the data by examining histograms for the main study variables and calculated the means, standard deviations, skewness, and kurtosis of each variable (see Table 1). All study variables appeared to have adequate normality, with the exception of sex, which was skewed slightly due to the overrepresentation of female students. However, this was acceptable as more females attend postsecondary education than males (U.S. Department of Education, 2017).
Correlations between all study variables are shown in Table 2, several of which are highlighted here. The input variables of perceived academic ability and drive to achieve were significantly positively correlated. As such, those who felt they had more academic ability also felt they were more driven. The environment variables of academic integration and social integration were also positively correlated. In addition, the outcome variables of current GPA, acquired knowledge and skills, and overall satisfaction were also all positively correlated. Associations between the categories of I-E-O were also as expected. For example, current GPA had the strongest correlations with high school GPA and academic integration, while acquisition of knowledge and skills and overall satisfaction were most strongly correlated with each other (r = .47) and sense of belonging (r = .48, r = .49, respectively). The positive associations within each category of the I-E-O model provide some evidence of validity of the constructs, while the correlations between the inputs, environment, and outcomes components of the model foreshadow important relationships.
SEM: Sample 1
Measurement models
We tested the academic integration (four items), social integration (four items), and acquisition of knowledge and skills (three items) variables together in a single CFA. The original CFA included all items outlined earlier as indicators and resulted in a good fit to the data χ2 p < .001, CFI = .97, RMSEA = .04, SRMR = .05. The standardized regression weights ranged from .55 to .84 for the academic integration items, from .74 to .88 for the social integration items, and from .68 to .84 for the acquisition of knowledge and skills items. Therefore, all items were retained in the structural analyses later.
Overall assessment of model fit and gender invariance
The estimated model (Figure 2) demonstrated good fit χ2 p < .001, CFI = .97, RMSEA = .04, SRMR = .04. Overall, this suggests that the hypothesized model adequately describes the relationships between inputs, environment, and outcomes. According to a stringent chi-square difference test, measurement weights and intercepts were invariant across genders (p >.01). Although the chi-square difference test was significant for the structural weights (Byrne, 2001; see Table 3), CFI did not change by more than .01, thereby suggesting gender invariance at the structural level as well (Cheung & Rensvold, 2002; Putnick & Bornstein, 2016). We concluded that the relationships between variables were invariant by gender and thus present the results for the full sample.
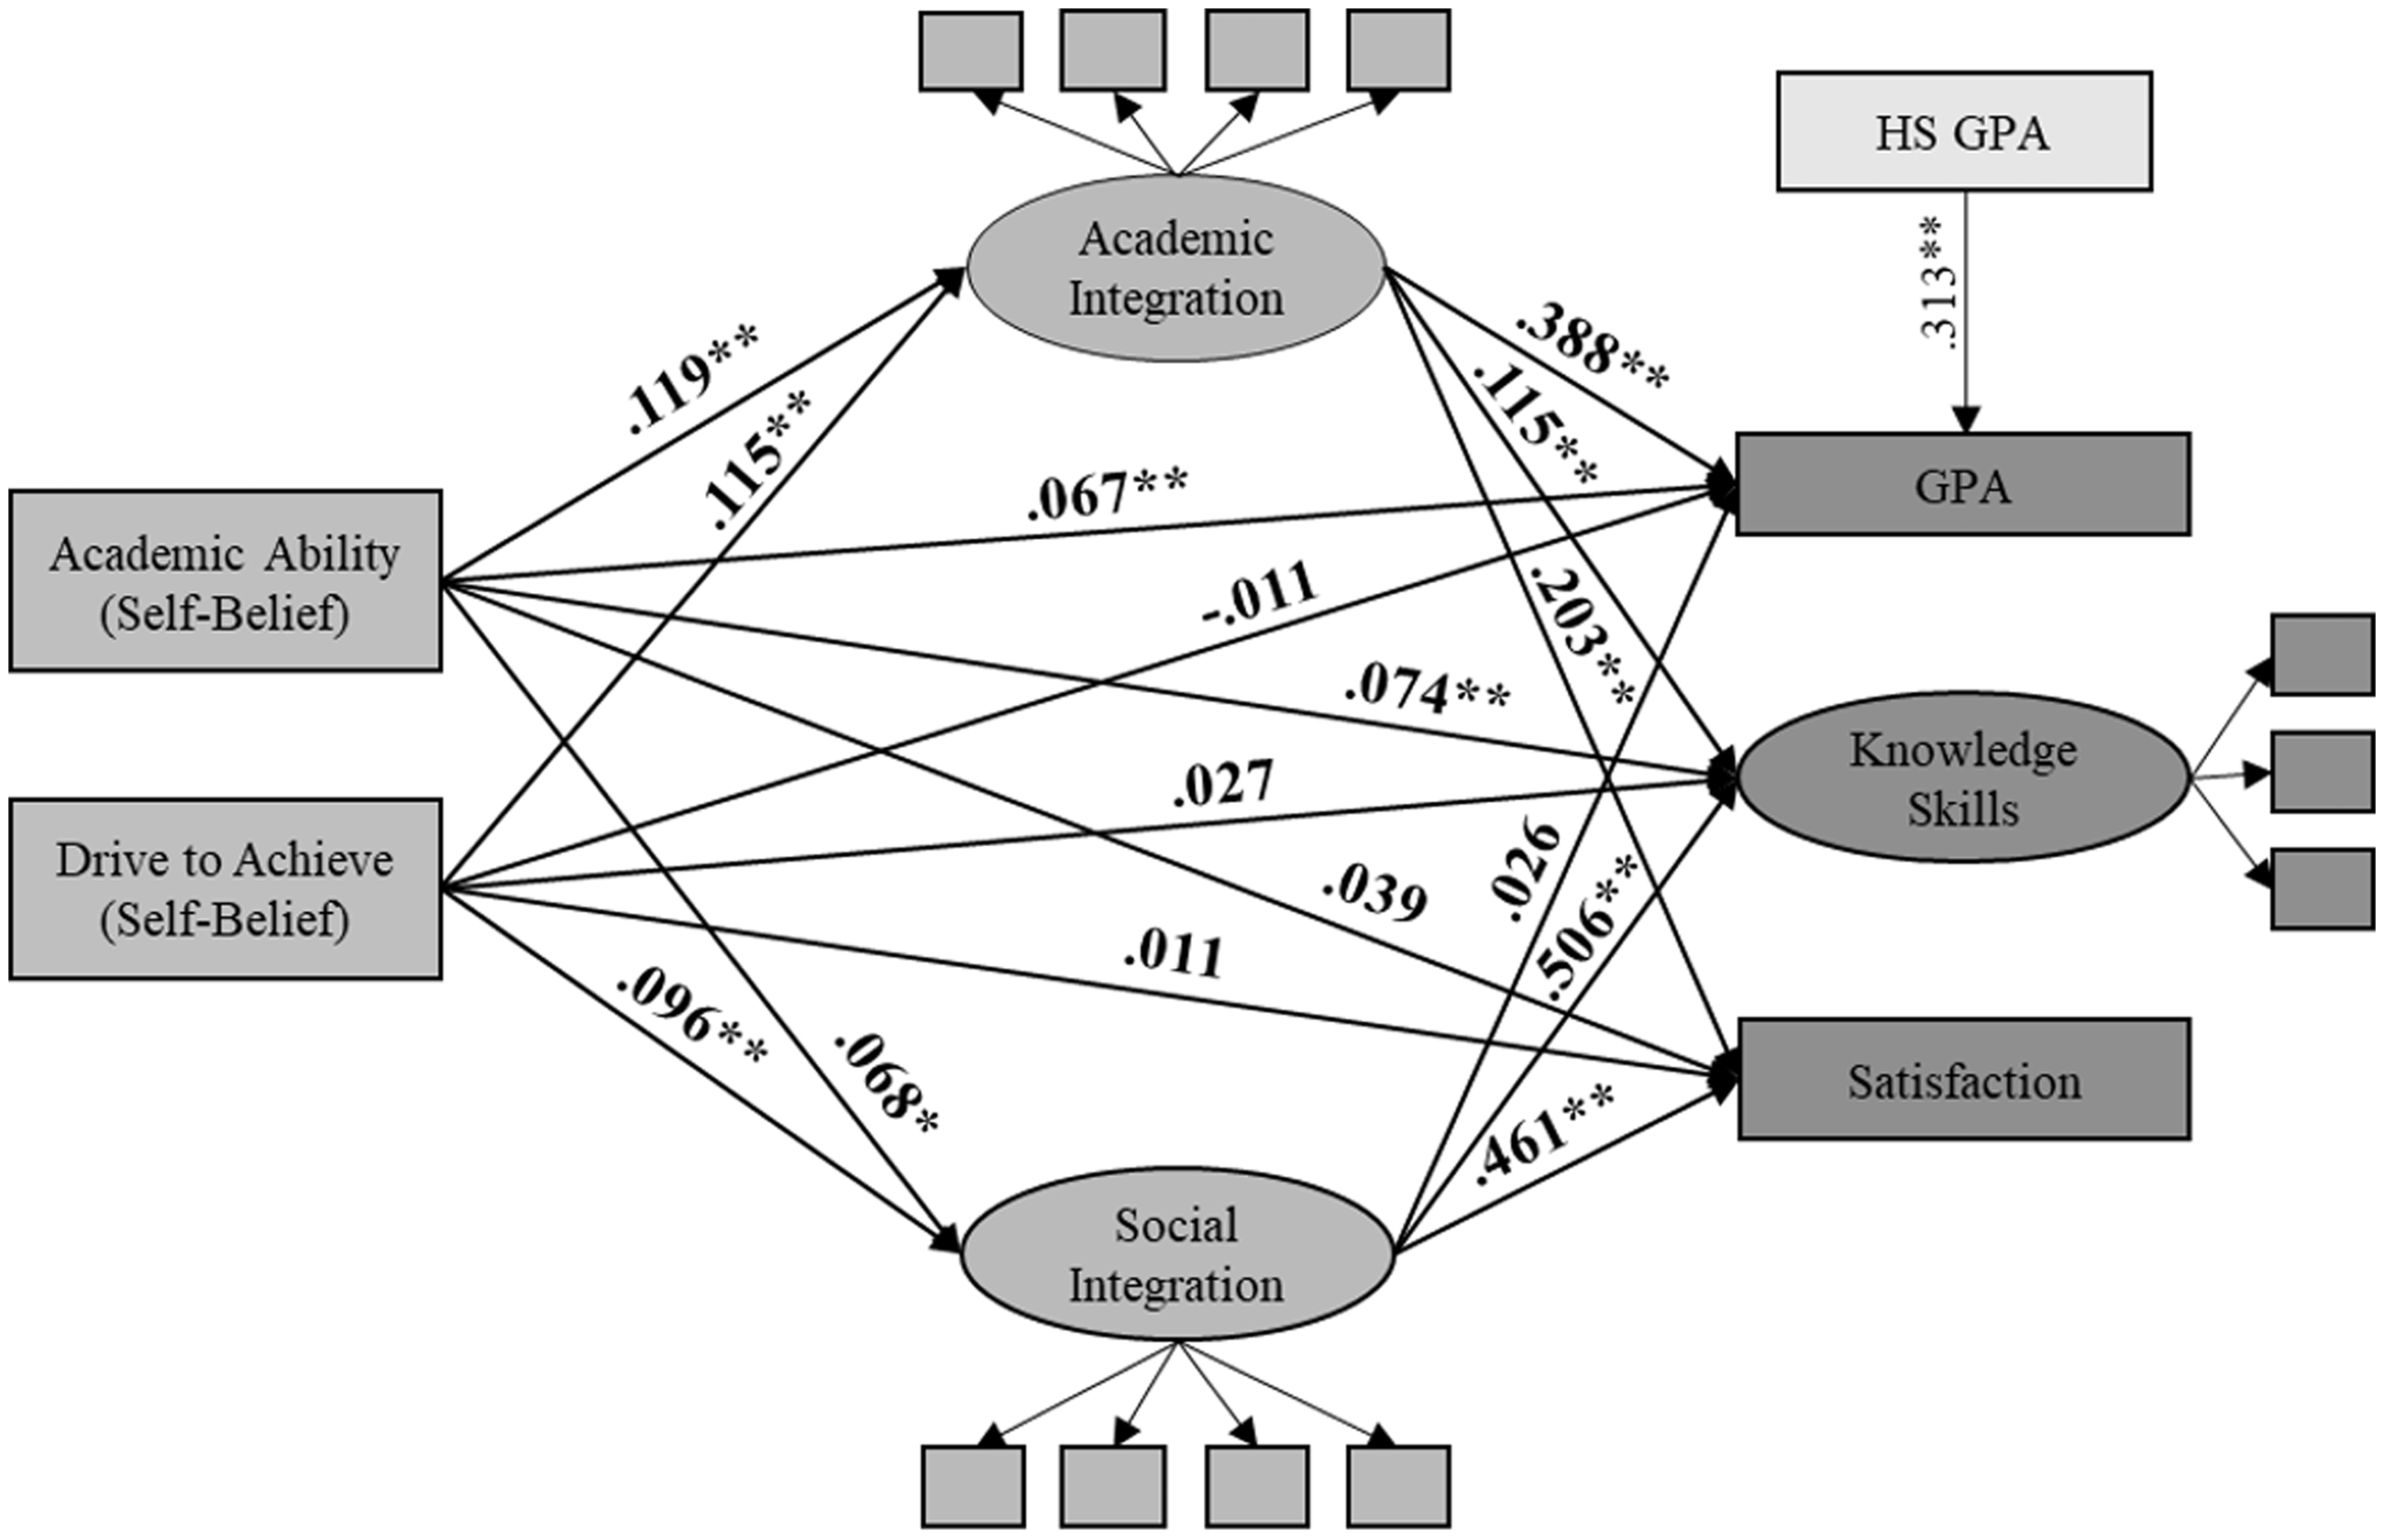
Structural model and standardized regression weights for the first sample.
Model Fit Indices, Tests of Invariance of the Measurement Models, and Structural Paths.
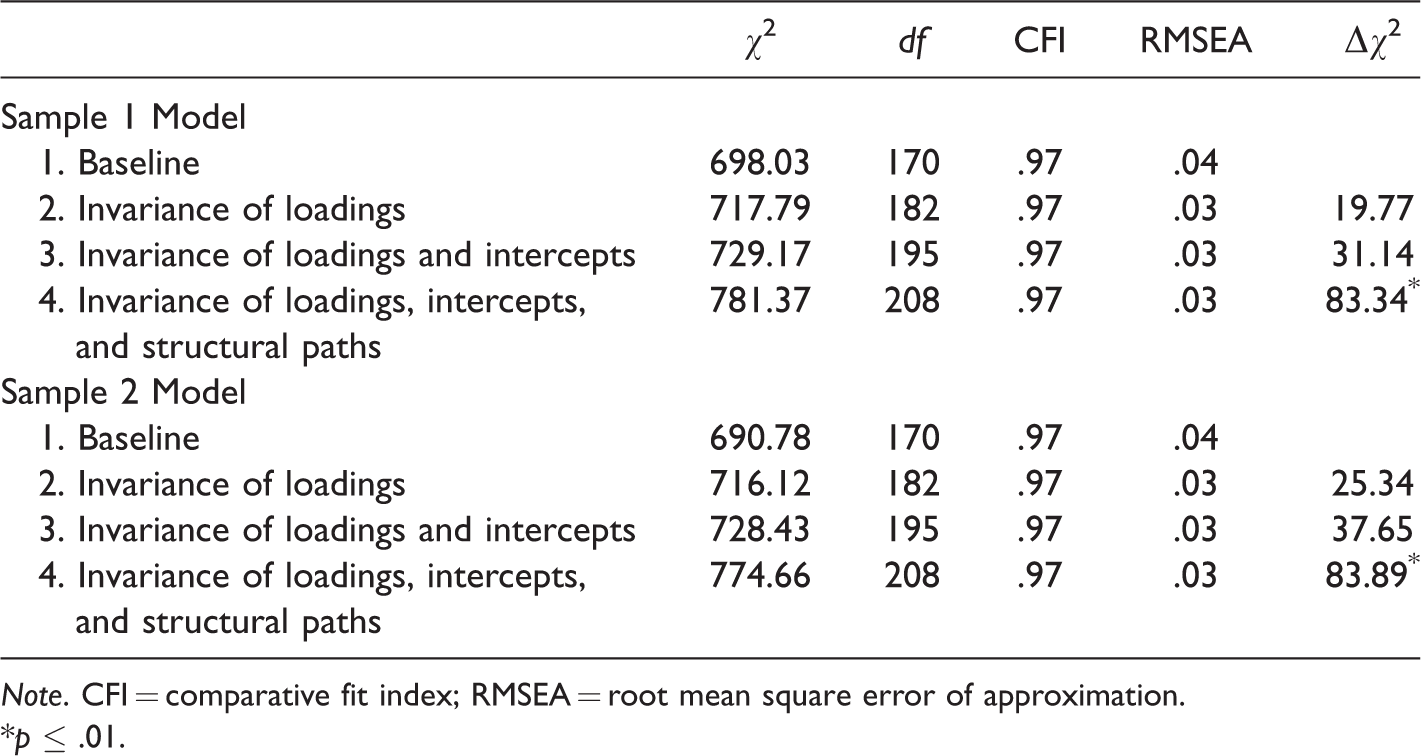
Note. CFI = comparative fit index; RMSEA = root mean square error of approximation.
*p ≤ .01.
Direct effects
The standardized path coefficients between all study variables in the model are presented in Figure 2. Perceived academic ability and drive to achieve where both significantly and positively related to academic and social integration. Perceived academic ability was positively related to GPA and knowledge and skills acquired but not students’ overall satisfaction. For drive to achieve, none of the direct effects to outcome variables were significant. From integration to outcomes, academic integration was significantly related to all outcome variables, whereas social integration was positively related to acquisition of knowledge and skills and overall satisfaction, but not GPA.
Indirect effects
The specification of the model allowed us to examine indirect effects between the inputs and the outcomes through academic and social integration. Perceived academic ability and drive to achieve both had a significant positive indirect effect on all three outcomes—students’ GPAs, knowledge and skills acquired, and overall satisfaction—through the integration variables (see Table 4). These results suggest that the inputs influenced the outcomes directly and indirectly through students’ integration resulting in a larger total effect than when the role of the integration is neglected.
Test of Significance of Mediation.
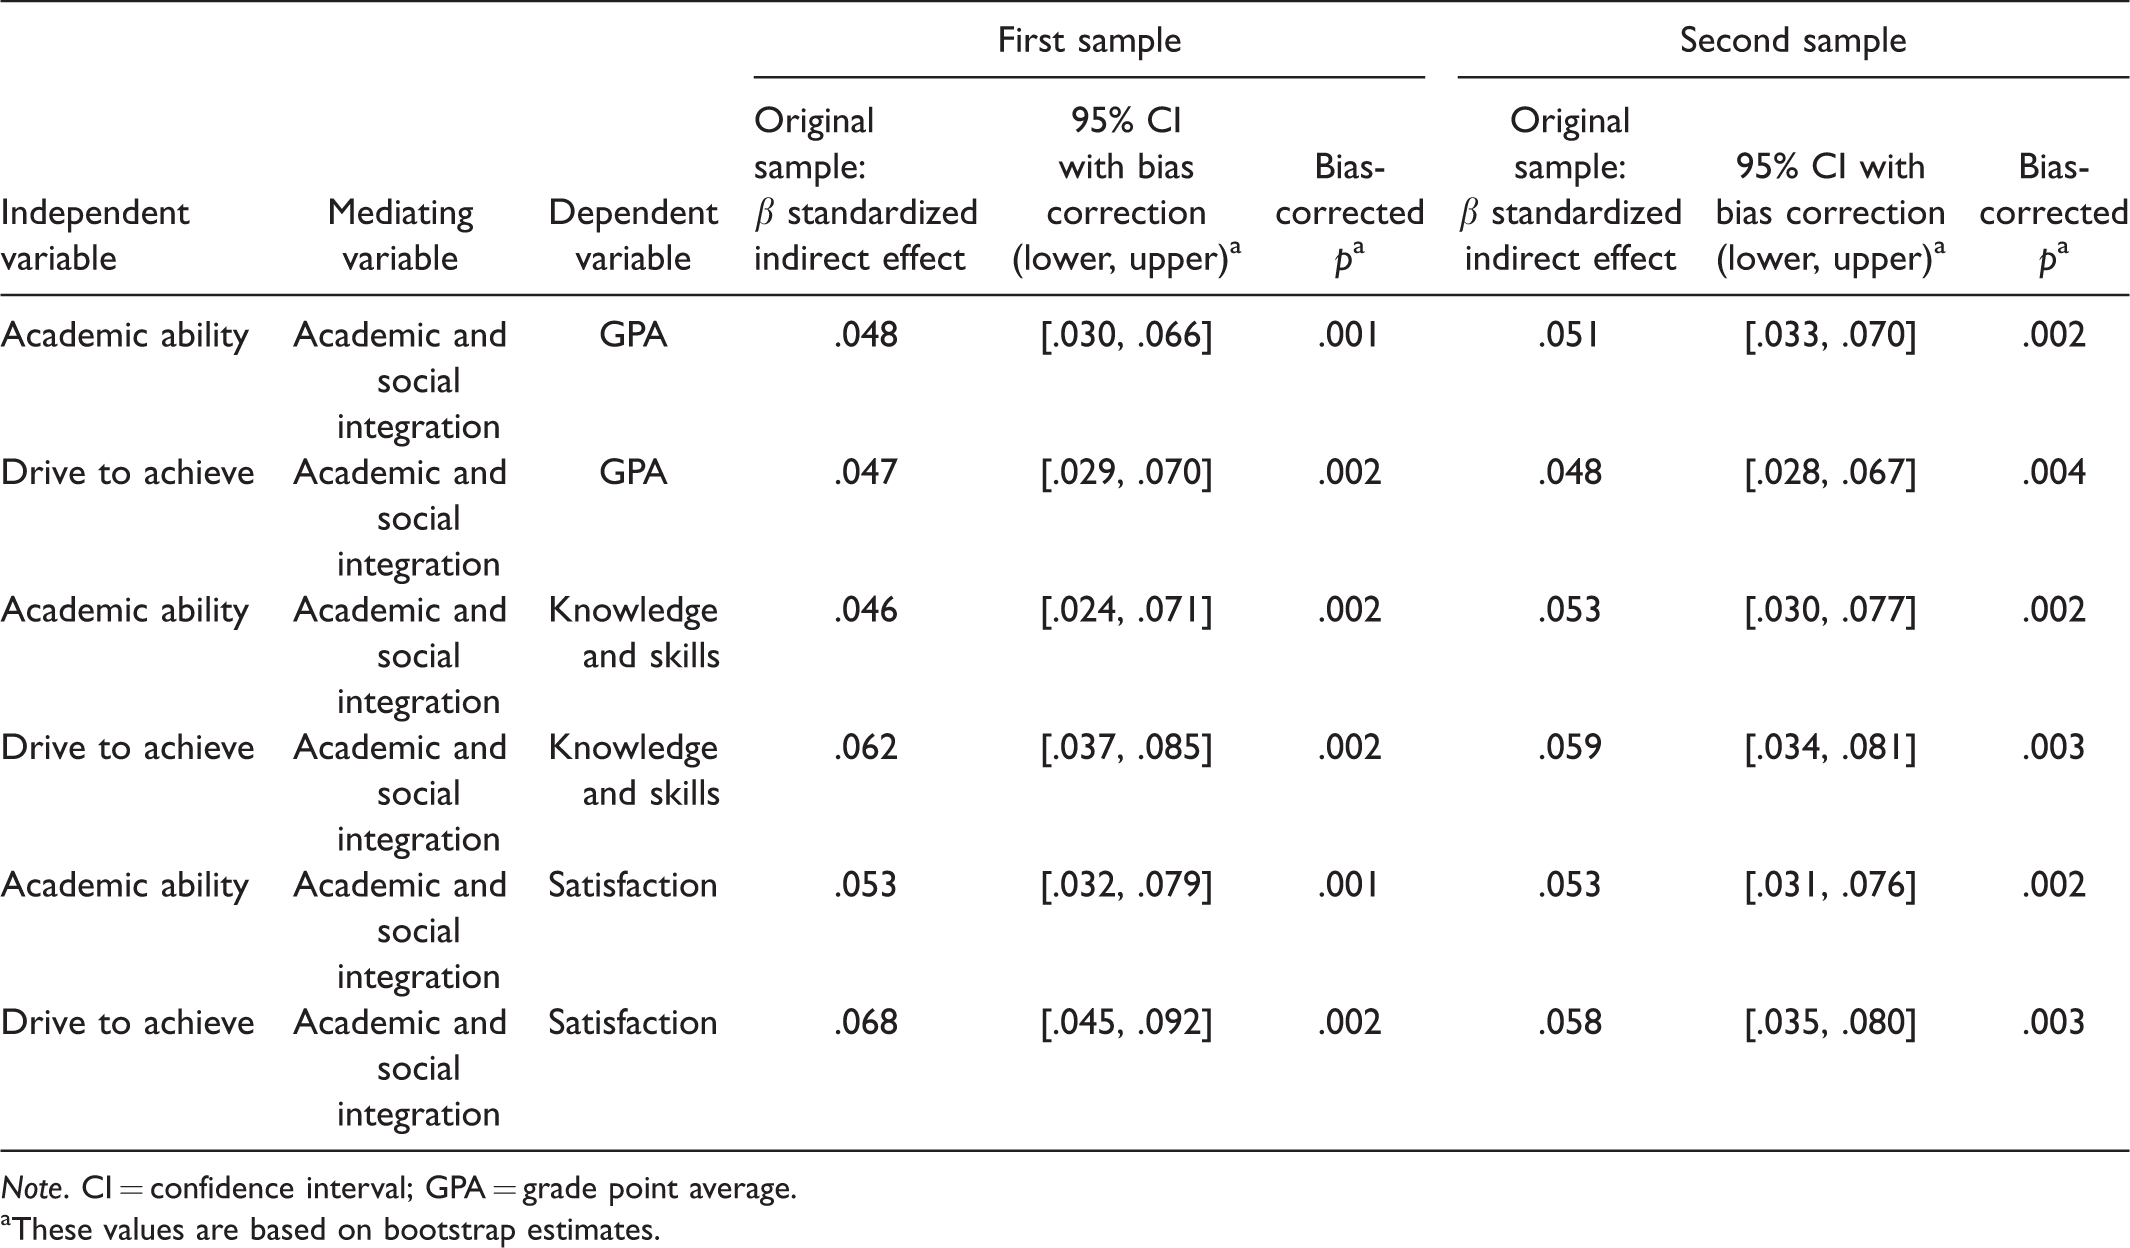
Note. CI = confidence interval; GPA = grade point average.
aThese values are based on bootstrap estimates.
Cross Validation Sample 2
We repeated the analyses on a separate sample of students (n = 2,501). The CFA including the same items for academic integration, social integration, and acquisition of knowledge and skills resulted in a good fit to the data, χ2 p < .001, CFI = .98, RMSEA = .04, SRMR = .04, and thus, we retained all items. The standardized regression weights range from .54 to .83 for the ease of adjustment items, from .74 to .87 for the sense of belonging items, and from .74 to .82 for the acquisition of knowledge and skills items. The estimated model (Figure 3) again demonstrated good fit χ2 p < .001, CFI = .97, RMSEA = .04, SRMR = .04. The tests of invariance showed no significant gender differences when examining the measurement weights and intercepts according to a chi-square difference test (Byrne, 2001) and no differences for structural weights according to changes in CFI (Cheung & Rensvold, 2002; Putnick & Bornstein, 2016). Thus, the model was considered invariant across genders, and the results are presented only once.
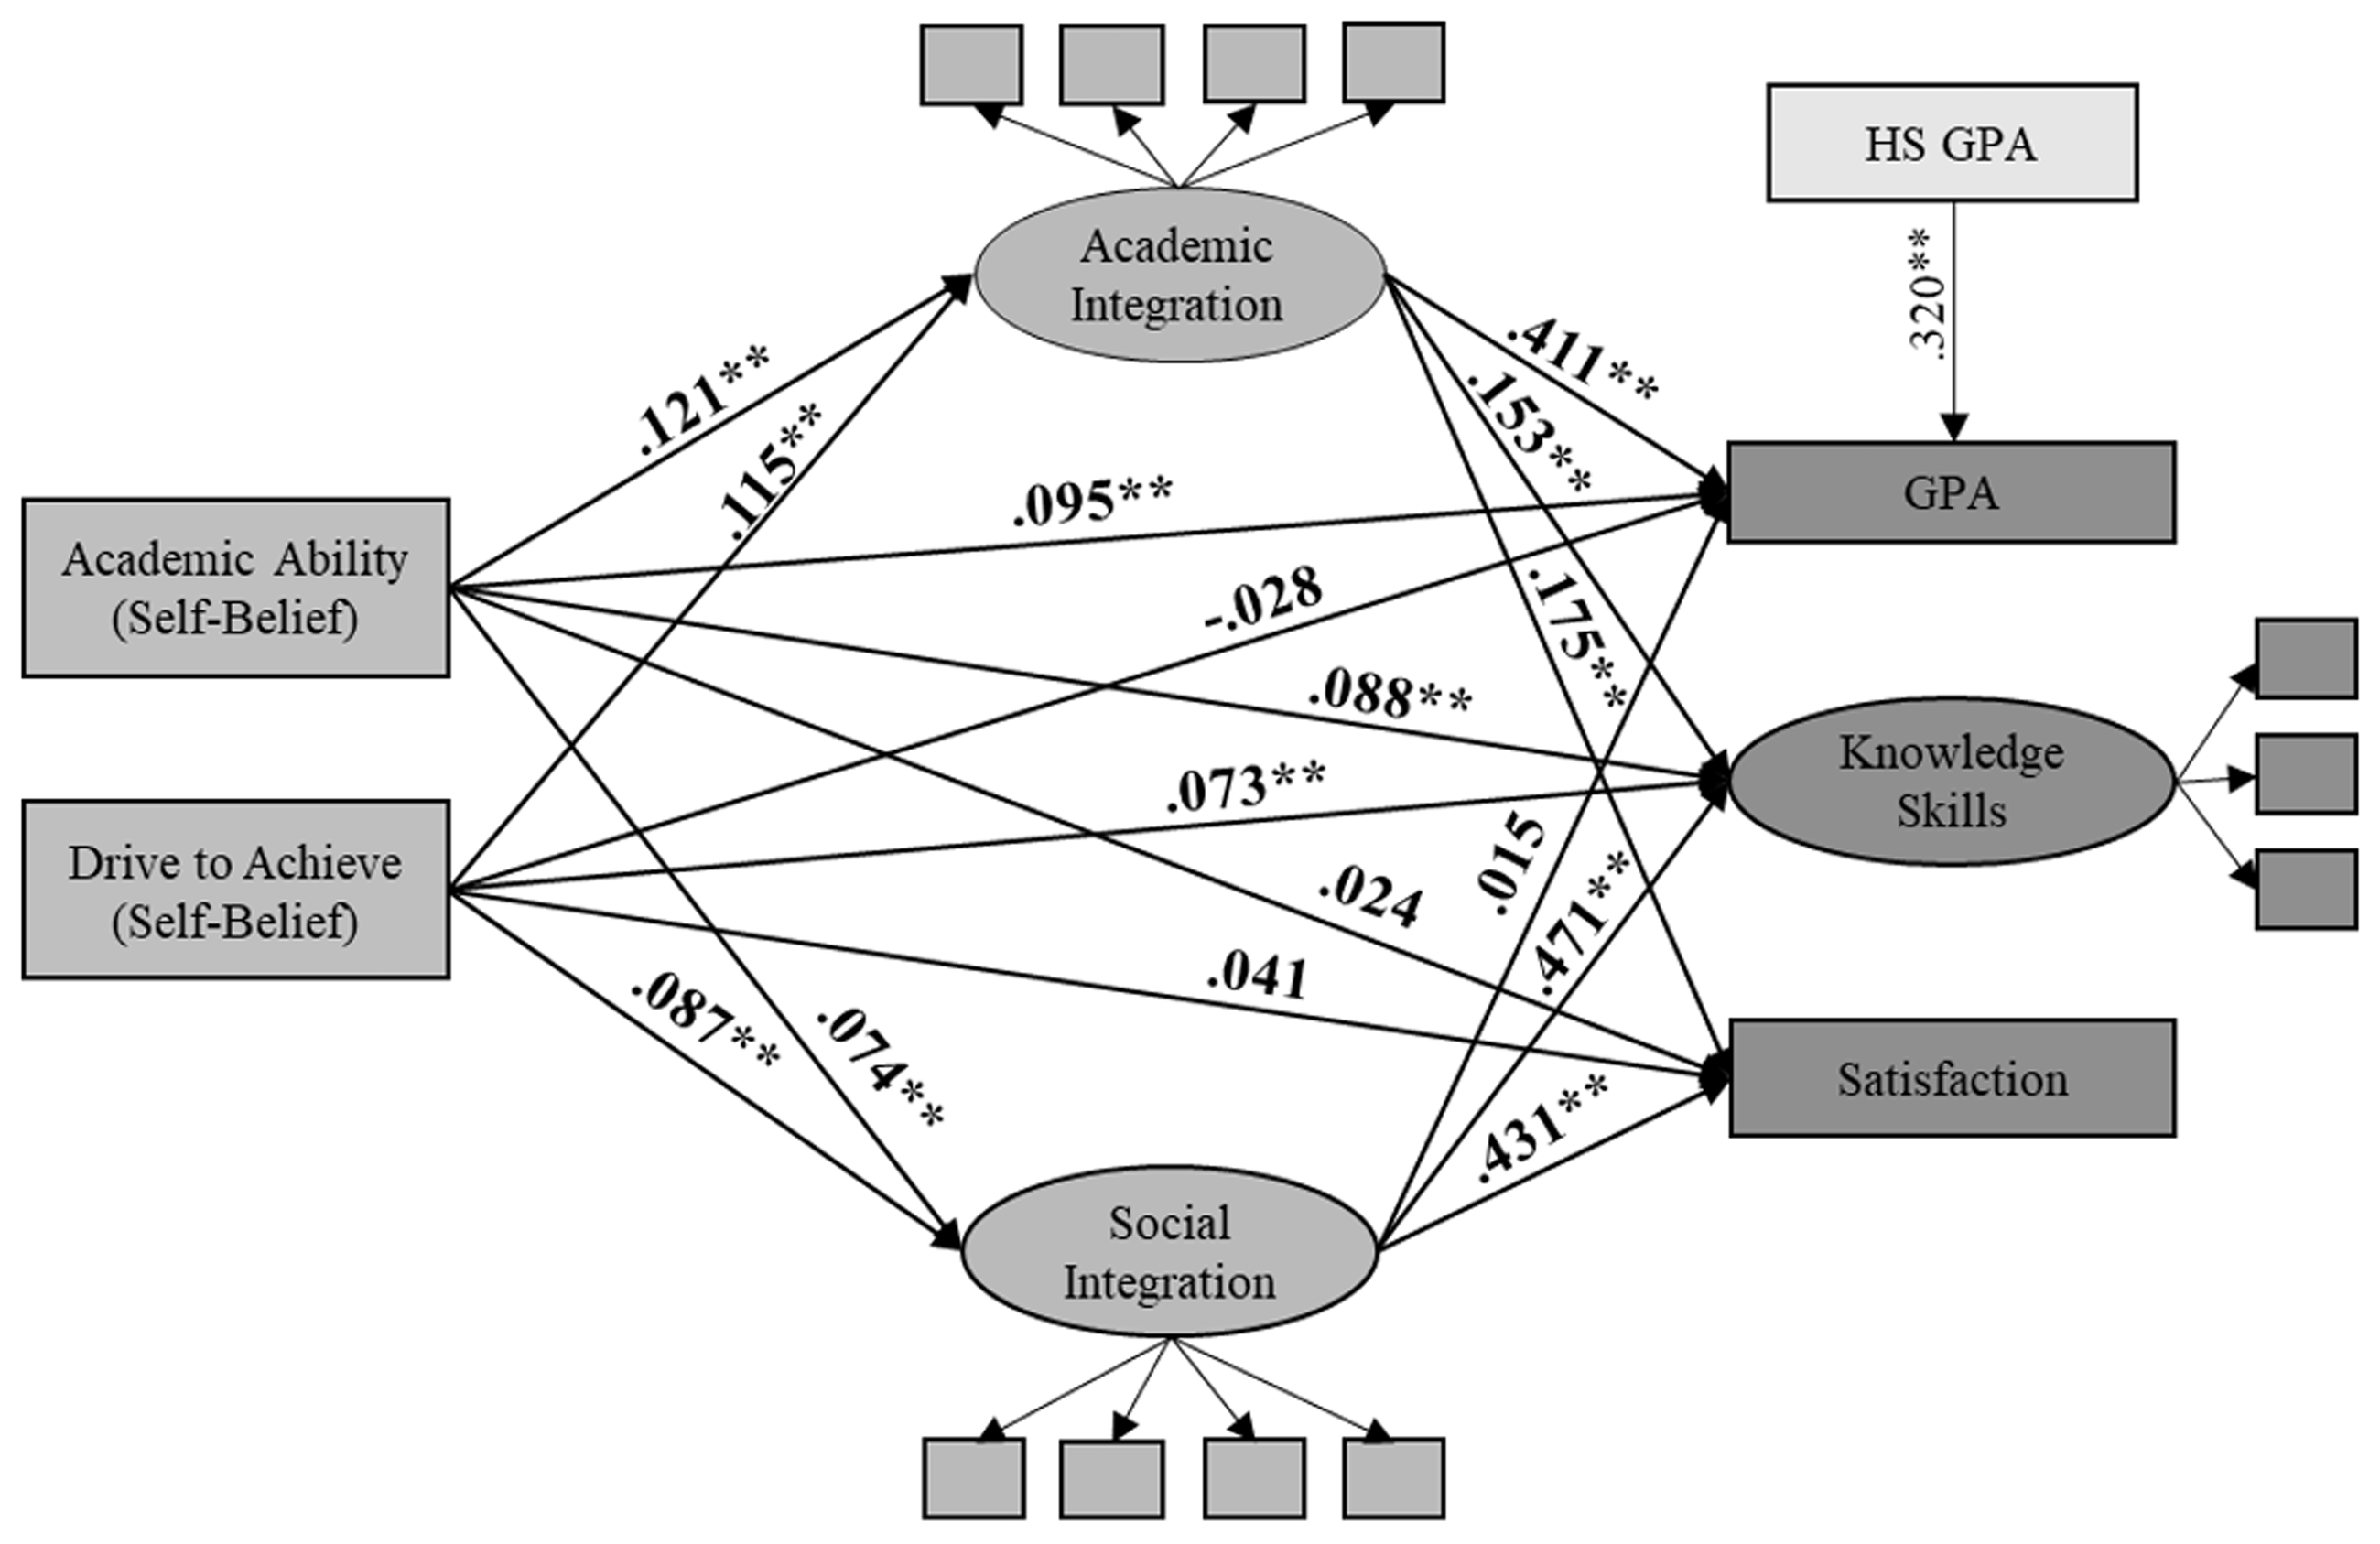
Structural model and standardized regression weights for the second sample.
Direct effects
Standardized path coefficients between all variables in the model are shown in Figure 3. With one exception, all direct effects were the same in terms of significance and similar in magnitude: Perceived academic ability and drive to achieve were both significantly positively related to the academic and social integration. Perceived academic ability was positively related to GPA and knowledge and skills acquired, but not to students’ overall satisfaction with their postsecondary experience. As the exception, in the original sample, drive to achieve did not relate to any outcomes; however, in this sample, it was positively and significantly related to acquisition of knowledge and skills. Academic integration and the outcome variables were all significantly positively related. In contrast, social integration on campus was again positively related to the knowledge and skills and overall satisfaction with postsecondary experience, but not GPA.
Indirect effects
Perceived academic ability had a significant indirect effect on students’ GPA, acquisition of knowledge and skills, and overall student satisfaction (see Table 4) through integration. Drive to achieve also had a significant indirect effect on all study outcome variables. These results indicate the overall stability of this model because all direct and indirect effects were the same as found in the first half of the sample with the exception of the direct effect between drive to achieve and acquisition of knowledge and skills.
Discussion
Our research examined student academic success at postsecondary (outcomes) by way of student characteristics (inputs) and student integration on campus (environment). In this discussion, we focus on how our findings can expand the current understanding of supporting students during their postsecondary education. Specifically, we discuss (a) the importance of student perceptions of their academic ability and drive to achieve when they begin their postsecondary programs, (b) how integration, both academic and social, plays an important role in academic success, and (c) the importance of using multiple measures of academic success. In closing, we also discuss the limitations of our research and recommendations for future research.
Student Characteristics Are Important for Academic Success
Student perceptions of their academic ability and drive to achieve at the start of their postsecondary experience play a significant role in their academic success at the end of their first year of postsecondary studies. For example, students’ perception of their academic ability had a direct effect on the student’s academic and social integration at postsecondary, their resulting GPA, and their acquired knowledge and skills. Furthermore, the indirect effects on all three outcomes through the integration variables were all significant suggesting an additive effect. Student’s drive to achieve was also an important component in their academic success at the end of the first year of a student’s postsecondary studies. Indeed, drive to achieve also had a direct effect on the student’s academic and social integration at postsecondary and to their acquisition of knowledge and skills. However, compared with perceptions of academic ability, drive to achieve was related to fewer indicators of academic success. Nevertheless, the indirect effects from drive to achieve on outcomes through the integration variables were all significant, again suggesting an additive effect by accounting for both student inputs and their integration.
Our results are consistent with previous research that has demonstrated the positive impact students’ perception of their academic ability and drive to achieve can have on their academic success (e.g., Fong et al., 2017; Richardson et al., 2012; Robbins et al., 2004). However, it is important to note that this previous research has examined academic success in terms of GPA and persistence, and our research expands on this by examining acquisitions of knowledge and skills and satisfaction as measures of academic success.
It is important to note that these positive perceptions that students develop are done so before they enter into the postsecondary environment, and therefore, it is imperative for teachers and school personnel in the K-12 system to support these positive perceptions in their students. The good news is that these characteristics are malleable, and teachers can make a difference in their student’s perceptions. One avenue to support these students is by utilizing mastery-oriented feedback (CAST, 2019). The universal design principles highlight the importance of increasing mastery-oriented feedback as this type of feedback emphasizes the importance of effort and persistence, wherein ability is not inherent or fixed which is important for positive learning practices and one’s perception of their ability (CAST, 2019).
Integration Is Important Too
Students’ integration, both social and academic, was important for their academic success. Academic integration, conceptualized as the ease of their adjustments to the demands of postsecondary, had a significant direct effect on student GPA, acquisition of knowledge and skills, and their overall satisfaction at postsecondary. Perhaps not surprisingly, academic integration had the largest beta weight when it came to GPA. These students understand what their professors expect from them academically, develop effective study skills, and manage their time effectively. As such, they objectively do better at postsecondary. Social integration, conceptualized as the sense of belonging students developed over the first year of their studies, also had a significant direct effect on their acquisition of knowledge and skills and their overall satisfaction at postsecondary, but not their GPA. Therefore, if students see themselves as a part of the campus community and feel valued and that they have a sense of belonging on their campus, they endorse higher ratings on the more subjective components of academic success.
These results are consistent with the work of Tinto (1975, 1999), who suggested that the two systems (academic and social) at postsecondary have different consequences. Academic integration can be seen as the intellectual development of students (Meeuwisse et al., 2010), and therefore, it is not surprising that it was related to our outcomes of GPA and acquisition of knowledge and skills. In particular, the connection to GPA is important as Tinto (1975) suggested that a lack of academic integration would lead to lower grades and result in students possibly having to leave the institution due to unsatisfactory performance. Academic integration did have the strongest beta weight to GPA, and the connection between the two cannot be ignored. On the other hand, social integration involves interactions with peers and participation in social activities on campus (Chrysikos et al., 2017; Meeuwisse et al., 2010). A lack of social integration is suggested to leave the students feeling disconnected from others, and as a result, they may be more likely to voluntarily leave (Tinto, 1975). In line with this theorizing, our results showed the strong connection between social integration and overall satisfaction at postsecondary. It is interesting to note that acquisition of knowledge and skills was the most significant outcome related to social integration. One explanation for this could be the result of the overlap between the two types of integrations (Beekhoven et al., 2002). For example, if a student is studying with their friends, they are developing their sense of belonging while also learning course content.
Our findings highlight the importance of postsecondary institutions supporting students in their navigation of the campus environment, not only academically, but socially as well. One avenue in which this can be accomplished is through the development of writing centers and other academic supports available to assist students in learning academic expectations in social ways. Furthermore, postsecondary institutions often require students to take an introductory English class to support their development of writing skills necessary for postsecondary, and postsecondary institutions might want to consider if other introductory courses related to postsecondary demands should be taken by all incoming students. This is similar to the ideas of Tinto (1999) who suggested learning communities for first-year students. Learning communities could involve linked courses, creating freshman interest groups, or clustered courses and coordinated studies so that first-year students are supported in their academic and social integration (Tinto, 1999). Indeed, Tinto stated that “The first year of college should be understood as a developmental year in which new students acquire the skills, dispositions and norms needed to learn and grow throughout the college years” (p. 9).
If learning communities are not possible at an institutional level, instructors of first-year courses could also encourage the use of study groups to help students connect and, perhaps, depending on the size of the class, have opportunities for group work or discussion so students can get to know one another. This strategy would help with both social and academic integration. When it comes to social integration more explicitly, postsecondary campuses should be mindful of social activities offered to students. For example, some campuses offer orientation weeks that can offer a plethora of activities that can apply to all different students. Postsecondary institutions might also want to consider the diversity of social clubs available on campus so that students feel there are options that appeal to their interests and needs. Furthermore, it might be beneficial to connect with local high schools to help students integrate on campus. For example, postsecondary institutions could offer programs wherein high school students are welcomed to campus and are able to be a student for a day. They could sit in courses they are interested in and meet other likeminded students.
The Value in Multiple Measures of Academic Success
Researchers have examined the definition of academic success, and the general consensus is that there is no one singular agreed-upon definition (Krumrei-Mancuso et al., 2013; Robbins et al., 2004; York et al., 2015). By selecting different conceptualizations of success, our research found different relationships with the student characteristics (i.e., inputs) and student integration (i.e., environment) variables. For example, the relationship between academic ability, and both the outcomes of GPA and acquisition of knowledge and skills were significant, but the relationship between academic ability and satisfaction was not. When it comes to social integration, both outcomes of acquisition of knowledge and skills and overall satisfaction are significant, but the relationship between social integration and GPA was not. Furthermore, the relationships between the student characteristics or the integration variables are significant with multiple measures of academic success; however, the standardized beta weights can vary significantly. Our results demonstrate that how researchers measure academic success will impact the findings obtained. Therefore, future research should utilize multiple measures of success, and success should be viewed more broadly than GPA and persistence.
Limitations and Future Directions
While our findings provide important insights that will support student attainment of academic success at postsecondary, there are three important limitations that should be mentioned. First, the use of secondary data poses a number of challenges. The surveys accessed by the Cooperative Institutional Research Program contain single items rather than preexisting scales. Indeed, secondary datasets typically have significant breadth of content rather than depth of measurement (i.e., constructs often only have an item or two; Trzesniewski, Donnellan, & Lucas, 2011). Nevertheless, where possible, we have grouped similar items together and analyzed a measurement model to examine the fit between our items and the construct of interest. However, there were a number of single items included in our analysis that could underrepresent the complexity of the constructs. That said, the face validity of the individual items selected was appropriate, and the relationships found in our study are consistent with others who have examined similar constructs. These constraints are offset by the fact that using secondary data allowed us to access a large number of participants that would not have been possible otherwise. Future research could examine a single university with our model and follow-up with interviews or focus groups that include various first-year students to provide additional information as to their experiences over the first year of postsecondary studies.
A second limitation of our study was that the participants were a homogeneous group of first-year students, in the United States, coming right from high school, who did not identify having a disability. Future research could extend our model to different years of students, populations, countries, or routes to postsecondary such as gap year or mature students. It may also be that as a more diverse set of students arrive on U.S. campuses, the results may be different for first-generation students, students with learning disabilities, or ethnic minorities. Testing the model with these groups would provide postsecondary institutions with important information as to the experiences of diverse students on their campuses.
A third limitation of our study was that there are potentially other inputs and environment variables that could have been included within our model. While our model demonstrated a number of significant relationships between the psychosocial predictors (inputs), integration (environment) and academic success (outcomes), it is possible that others variables could have provided additional information about the relationships between these constructs. Therefore, future research should consider potential additional constructs to include within the model.
Conclusion
In conclusion, our study provides valuable information about student success at postsecondary. Our results highlight that academic success is more complicated and nuanced than a singular measure, and researchers need to be mindful when selecting their instruments. Furthermore, our results highlight the importance of various student characteristics and integration for students when it comes to their success. The implications of the current results suggest that postsecondary institutions should support the development of academic and social integration of students in their campuses. Furthermore, teachers in the K-12 system, particularly those in grade 12, should be mindful of psychosocial variables (i.e., perceived academic ability and drive to achieve) and how to encourage a positive mindset in their students. These areas provide avenues for future research to further investigate how to support academic success for students during their postsecondary education.
Footnotes
Declaration of Conflicting Interests
The author(s) declared no potential conflicts of interest with respect to the research, authorship, and/or publication of this article.
Funding
The author(s) disclosed receipt of the following financial support for the research, authorship, and/or publication of this article: This work was supported by a Doctoral Fellowship from the Social Science and Humanities Council of Canada to the first author.