
Abstract
Aims:
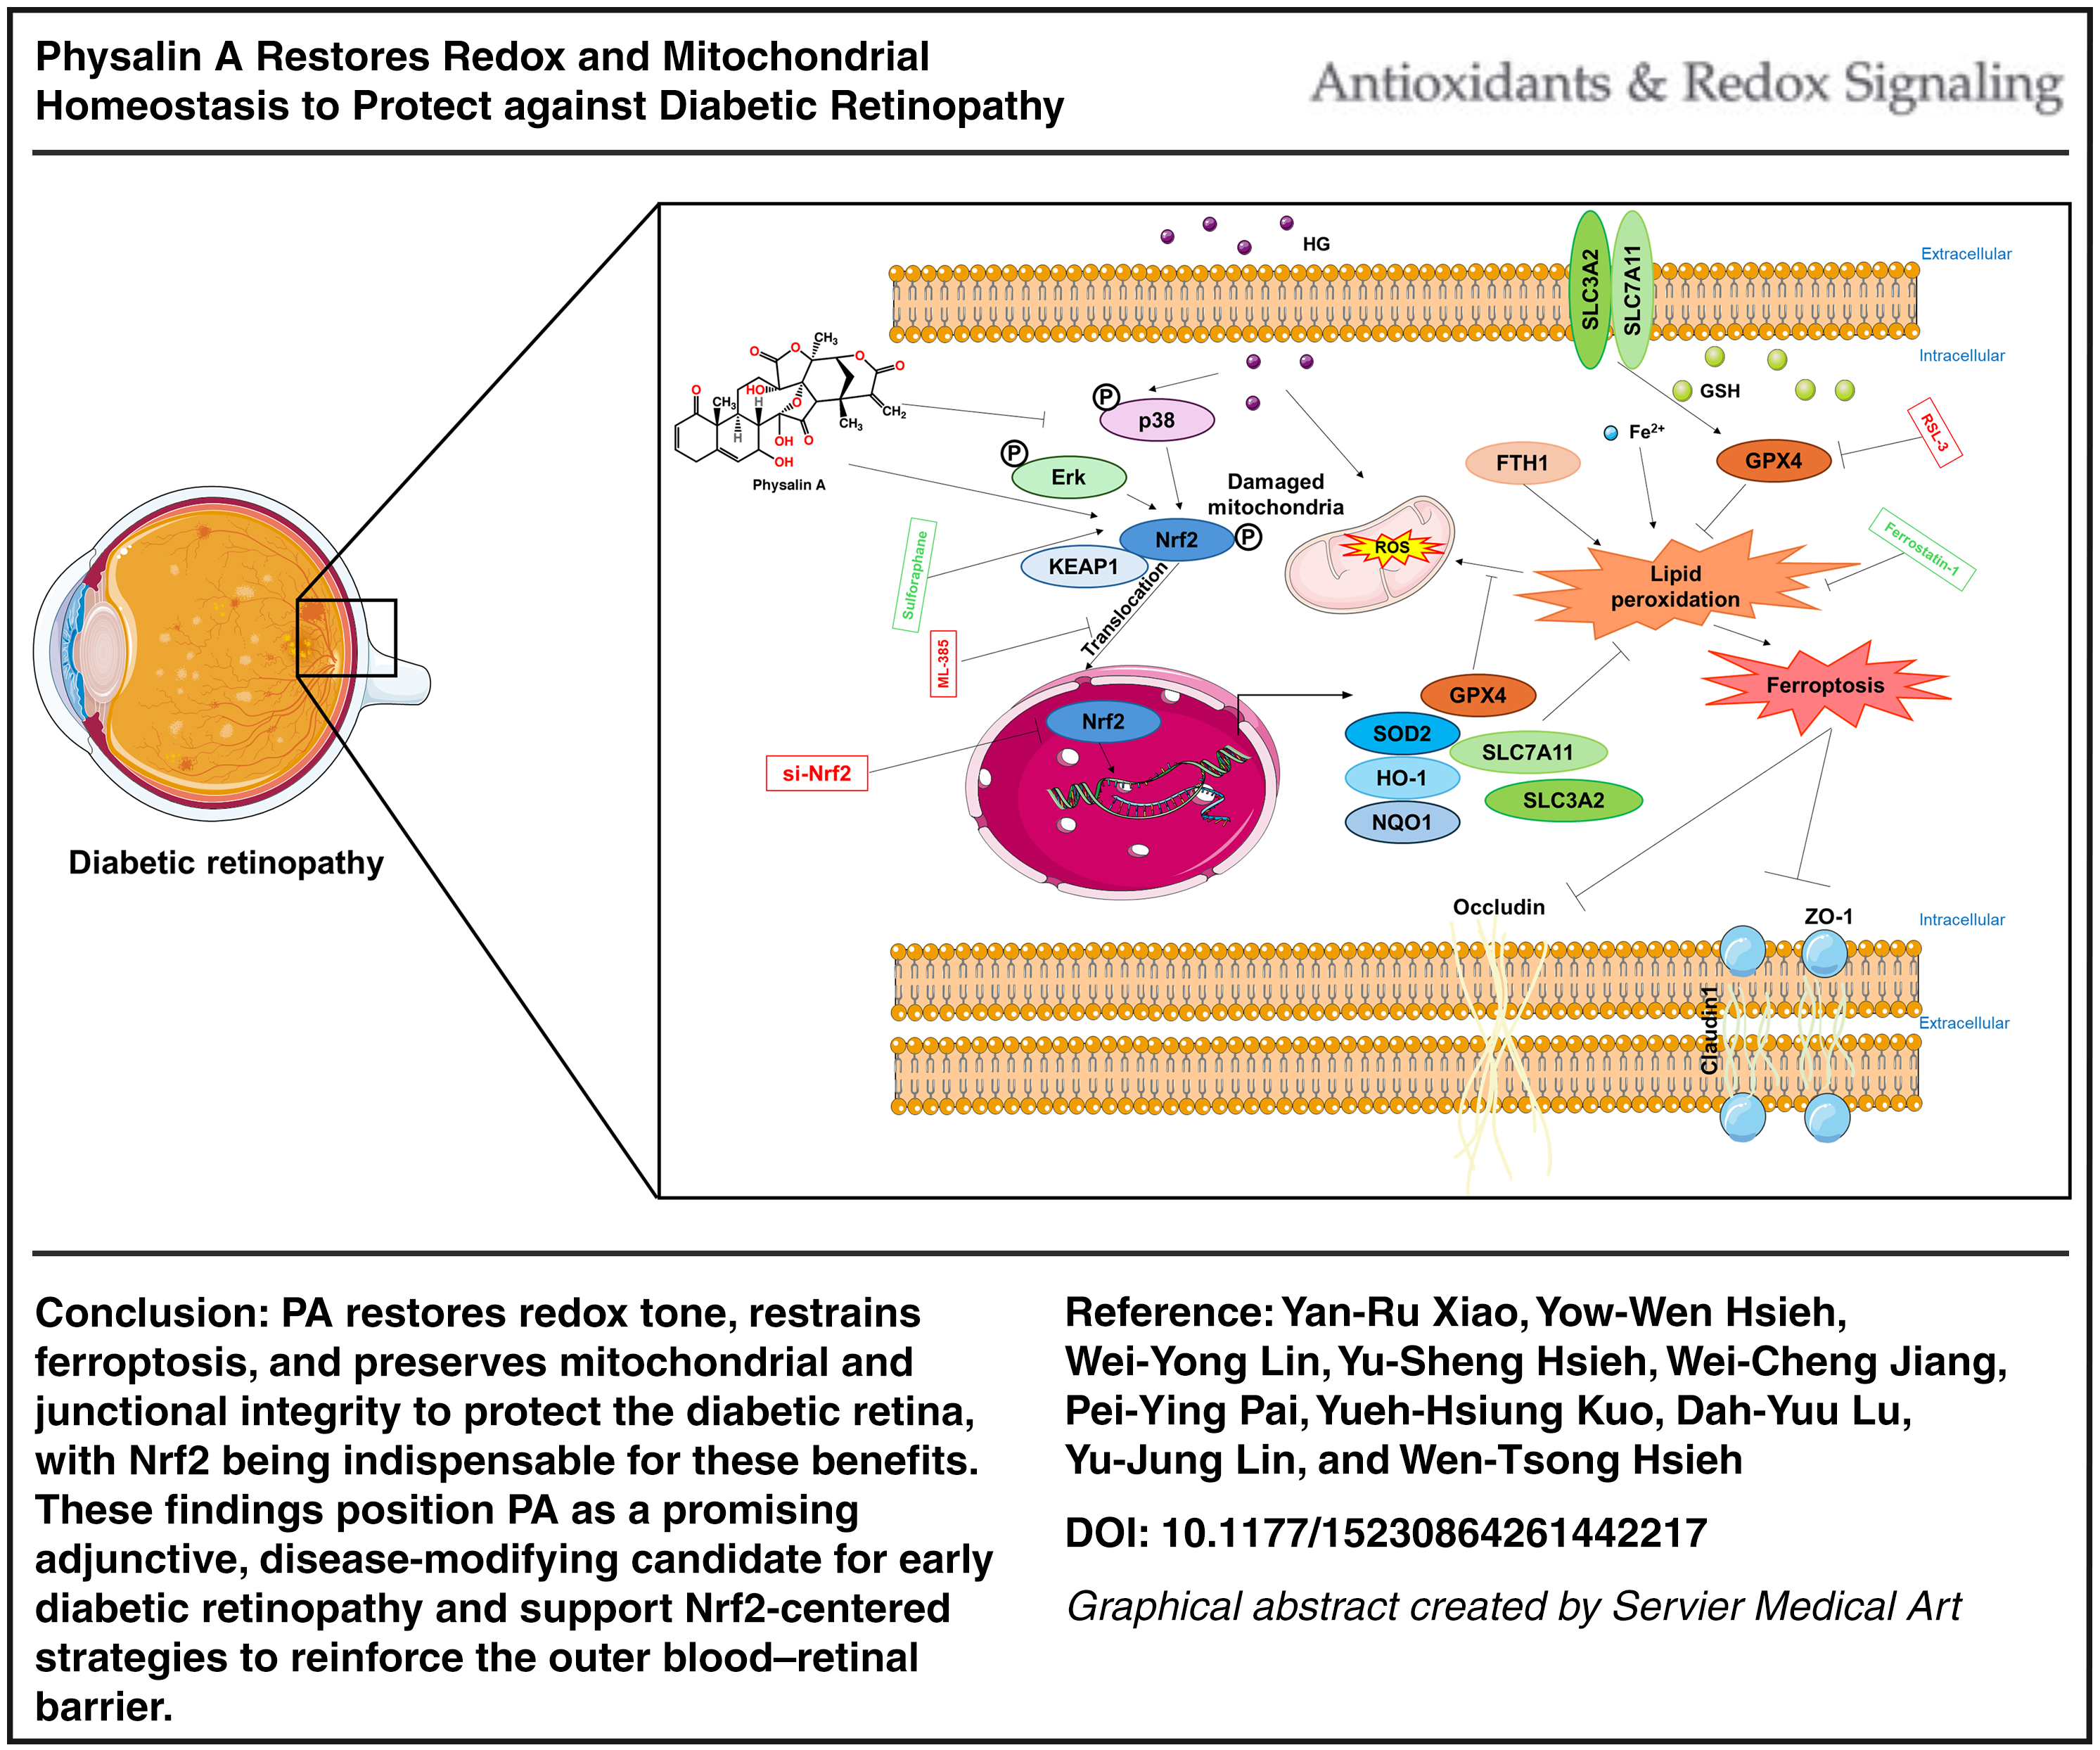
To determine whether physalin A (PA) safeguards the outer blood–retinal barrier under diabetic stress by engaging nuclear factor erythroid 2-related factor 2 (Nrf2) to restore redox balance and restrain ferroptosis in human retinal pigment epithelial (hRPE) cells and C57BLKS/J Iar −+Leprdb/+Leprdb mice.
Results:
In high-glucose challenged hRPE cells, PA dose-dependently preserved viability, maintained claudin-1/occludin/zonula occludens-1 abundance and membrane localization, and reversed ferroptosis hallmarks (restored solute carrier family 7 member 11 [SLC7A11], SLC3A2, and glutathione peroxidase 4; reduced ferrous iron [Fe2+] overload and lipid peroxidation). PA restored glutathione levels, reduced malondialdehyde (MDA), and enhanced the antioxidant defense pathway mediated by Nrf2, including upregulation of heme oxygenase 1, NAD(P)H quinone dehydrogenase 1, and superoxide dismutase 2. Silencing Nrf2 abolished the effects of PA on barrier integrity and ferroptosis suppression, with rebounds in reactive oxygen species, MDA, Fe2+, and tight junction loss. In db/db mice treated systemically for 20 weeks, PA reduced Evans Blue leakage, increased retinal thickness, restored RPE tight junction proteins, and normalized mitochondrial architecture by transmission electron microscopy. PA rebalanced mitochondrial dynamics (dynamin 1-like, optic atrophy 1, fission 1, mitofusin 1, FUN14 domain containing 1), increased retinal mitochondrial DNA copy number, and partially stabilized glycemia and weight.
Conclusion:
PA restores redox tone, restrains ferroptosis, and preserves junctional integrity to protect the diabetic retina, with Nrf2 being indispensable for these benefits. These findings position PA as a promising adjunctive candidate for early diabetic retinopathy and support Nrf2-centered strategies to reinforce the outer blood–retinal barrier. Antioxid. Redox Signal. 45, 5–27.
Keywords
Introduction
Diabetic retinopathy (DR) is a common microvascular complication of diabetes mellitus (DM), with its prevalence and severity increasing with age (Li et al., 2024). Approximately 24.7% to 35.7% of diabetic patients develop DR, leading to vision impairment and ultimately becoming one of the primary causes of blindness (Tang et al., 2022). DR pathogenesis is primarily attributed to retinal vascular abnormalities, including blood–retinal barrier (BRB) disruption, mitochondrial dysfunction, abnormal angiogenic factors, increased vascular permeability, and retinal microvascular degeneration (Antonetti et al., 2021; Uemura et al., 2021; Wykoff et al., 2022). The BRB consists of two components: the inner barrier formed by endothelial cells and the outer barrier formed by retinal pigment epithelium (RPE) cells. The RPE, a specialized monolayer located between the neural retina and the choroidal vasculature, maintains retinal integrity by preventing harmful blood-derived substances from entering the retina through tight junction proteins such as zonula occludens-1 (ZO-1) and occludin on the RPE cell membrane (Lakkaraju et al., 2020; Lewandowski et al., 2022). Prolonged exposure to high glucose (HG) disrupts RPE metabolism, accelerating DR progression (Tonade and Kern, 2021). Since RPE viability depends on sufficient energy supply, efficient energy metabolism and a high mitochondrial count are required. Mitochondrial energy production is accompanied by reactive oxygen species (ROS) generation, resulting in high ROS levels in RPE cells (He et al., 2010; Plafker et al., 2012). Under normal conditions, the intracellular antioxidant system scavenges excessive ROS; however, hyperglycemia reduces antioxidant activity, leading to excessive ROS accumulation, impairing RPE cell viability and function in DR (Farnoodian et al., 2016; Wu et al., 2018). Current DR treatments, including anti-vascular endothelial growth factor (anti-VEGF) and hormone therapy, have limited efficacy and pose adverse ocular and systemic effects (Fang et al., 2024; Zehden et al., 2022). Consequently, novel therapeutic strategies for DR are urgently needed.
Innovation
This study uncovers a previously unrecognized mechanism in which Physalin A (PA) simultaneously restores mitochondrial quality control and suppresses ferroptosis through an Nrf2-dependent pathway to stabilize the outer blood–retinal barrier. Unlike conventional antioxidants that act downstream of oxidative injury, PA uniquely integrates MAPK–KEAP1–Nrf2 signaling relief, ferroptosis blockade, and mitochondrial dynamics rescue into a unified protective axis. The combined mechanistic, epistasis, and cross-species evidence highlights PA as a representative withanolide compound that may target redox–ferroptosis–mitochondria crosstalk in diabetic retinopathy.
Previous studies have indicated that apoptosis, autophagy, and inflammation play critical roles in the early development of DR; however, these mechanisms do not fully account for DR pathogenesis (Boya et al., 2016; Kong et al., 2022). Ferroptosis, a newly identified form of regulated cell death driven by iron-dependent lipid peroxidation, has been observed in DR (Li et al., 2024). The main features of ferroptosis include elevated malondialdehyde (MDA) levels, increased ROS and Fe2+ concentrations, and decreased glutathione (GSH) content (Yagoda et al., 2007). Iron accumulation is closely associated with ferroptosis, where excessive free iron triggers ROS production through the Fenton reaction, further promoting lipid peroxidation (Park and Chung, 2019). Furthermore, solute carrier family 7 member 11 (SLC7A11) and solute carrier family 3 member 2 SLC3A2 play critical roles in ferroptosis by mediating cystine uptake for GSH synthesis. When SLC7A11/SLC3A2 function is inhibited, cystine uptake decreases, resulting in reduced GSH synthesis, impaired glutathione peroxidase 4 (GPX4) activity, oxidative stress accumulation, and ferroptosis (Jiang et al., 2024; Li et al., 2020). ROS are recognized as key components in ferroptosis, and their excessive production exacerbates oxidative stress and retinal damage in DR (Park and Chung, 2019).
Nuclear factor erythroid 2-related factor 2 (Nrf2) is a major nuclear transcription factor that regulates redox homeostasis. Upon oxidative stress activation, Nrf2 translocates to the nucleus and binds to antioxidant response elements (AREs) located in various gene promoters, inducing the transcription of antioxidant enzymes such as HO-1 (Ma, 2013; Sahin et al., 2010). Recent studies have also revealed that Nrf2 is involved in the epigenetic regulation of redox signaling in DR (Kowluru and Mishra, 2017; Nabavi et al., 2016; Ouyang et al., 2022). Nrf2 not only modulates the expression of multiple signaling proteins and enzymes to maintain cellular redox balance but also regulates the expression of genes associated with ferroptosis. Previous studies have explored the impact of Nrf2 signaling on lipid peroxidation and ferroptosis (Dodson et al., 2019). When activated, Nrf2 can alleviate DR by modulating ferroptosis (Li et al., 2023b; Tang et al., 2022). Given the intricate connection between ROS, lipid peroxidation, Nrf2, and ferroptosis, we propose that Nrf2 activation can attenuate HG-induced retinal damage by regulating ferroptosis.
Physalin A (PA), a natural withanolide found in various medicinal plants, has demonstrated therapeutic effects in multiple pathological processes, including oxidative stress and inflammation, and has been shown to treat diseases such as diabetes (Iwansyah et al., 2022). Studies indicate that PA exhibits antidiabetic properties through mechanisms such as improving insulin sensitivity, inhibiting intestinal glucosidase, and preventing pancreatic β-cell defects (Hassan and Ghoneim, 2013). PA has also been shown to possess antidiabetic activity in streptozotocin-induced diabetic rats (Iwansyah et al., 2022), as well as antioxidant and renal restorative effects in alloxan-induced diabetic Wistar rats (Adewoye et al., 2016). In 2020, our findings further confirmed that PA effectively inhibits the TLR4/JNK/NF-κB pathway, enhancing its anti-inflammatory and antioxidant capabilities (Lin et al., 2020). Thus, PA has been proposed as a novel therapeutic agent for type 2 diabetes (Iwansyah et al., 2022). However, its impact on HG-induced retinal damage remains unknown. Here, we hypothesize that oxidative stress during DR induces ferroptosis, exacerbating disease progression, while PA may alleviate DR by inhibiting oxidative stress-induced ferroptosis through the Nrf2/ARE signaling pathway.
Results
PA prevents retinal damage and reduces blood glucose fluctuations in diabetic mice
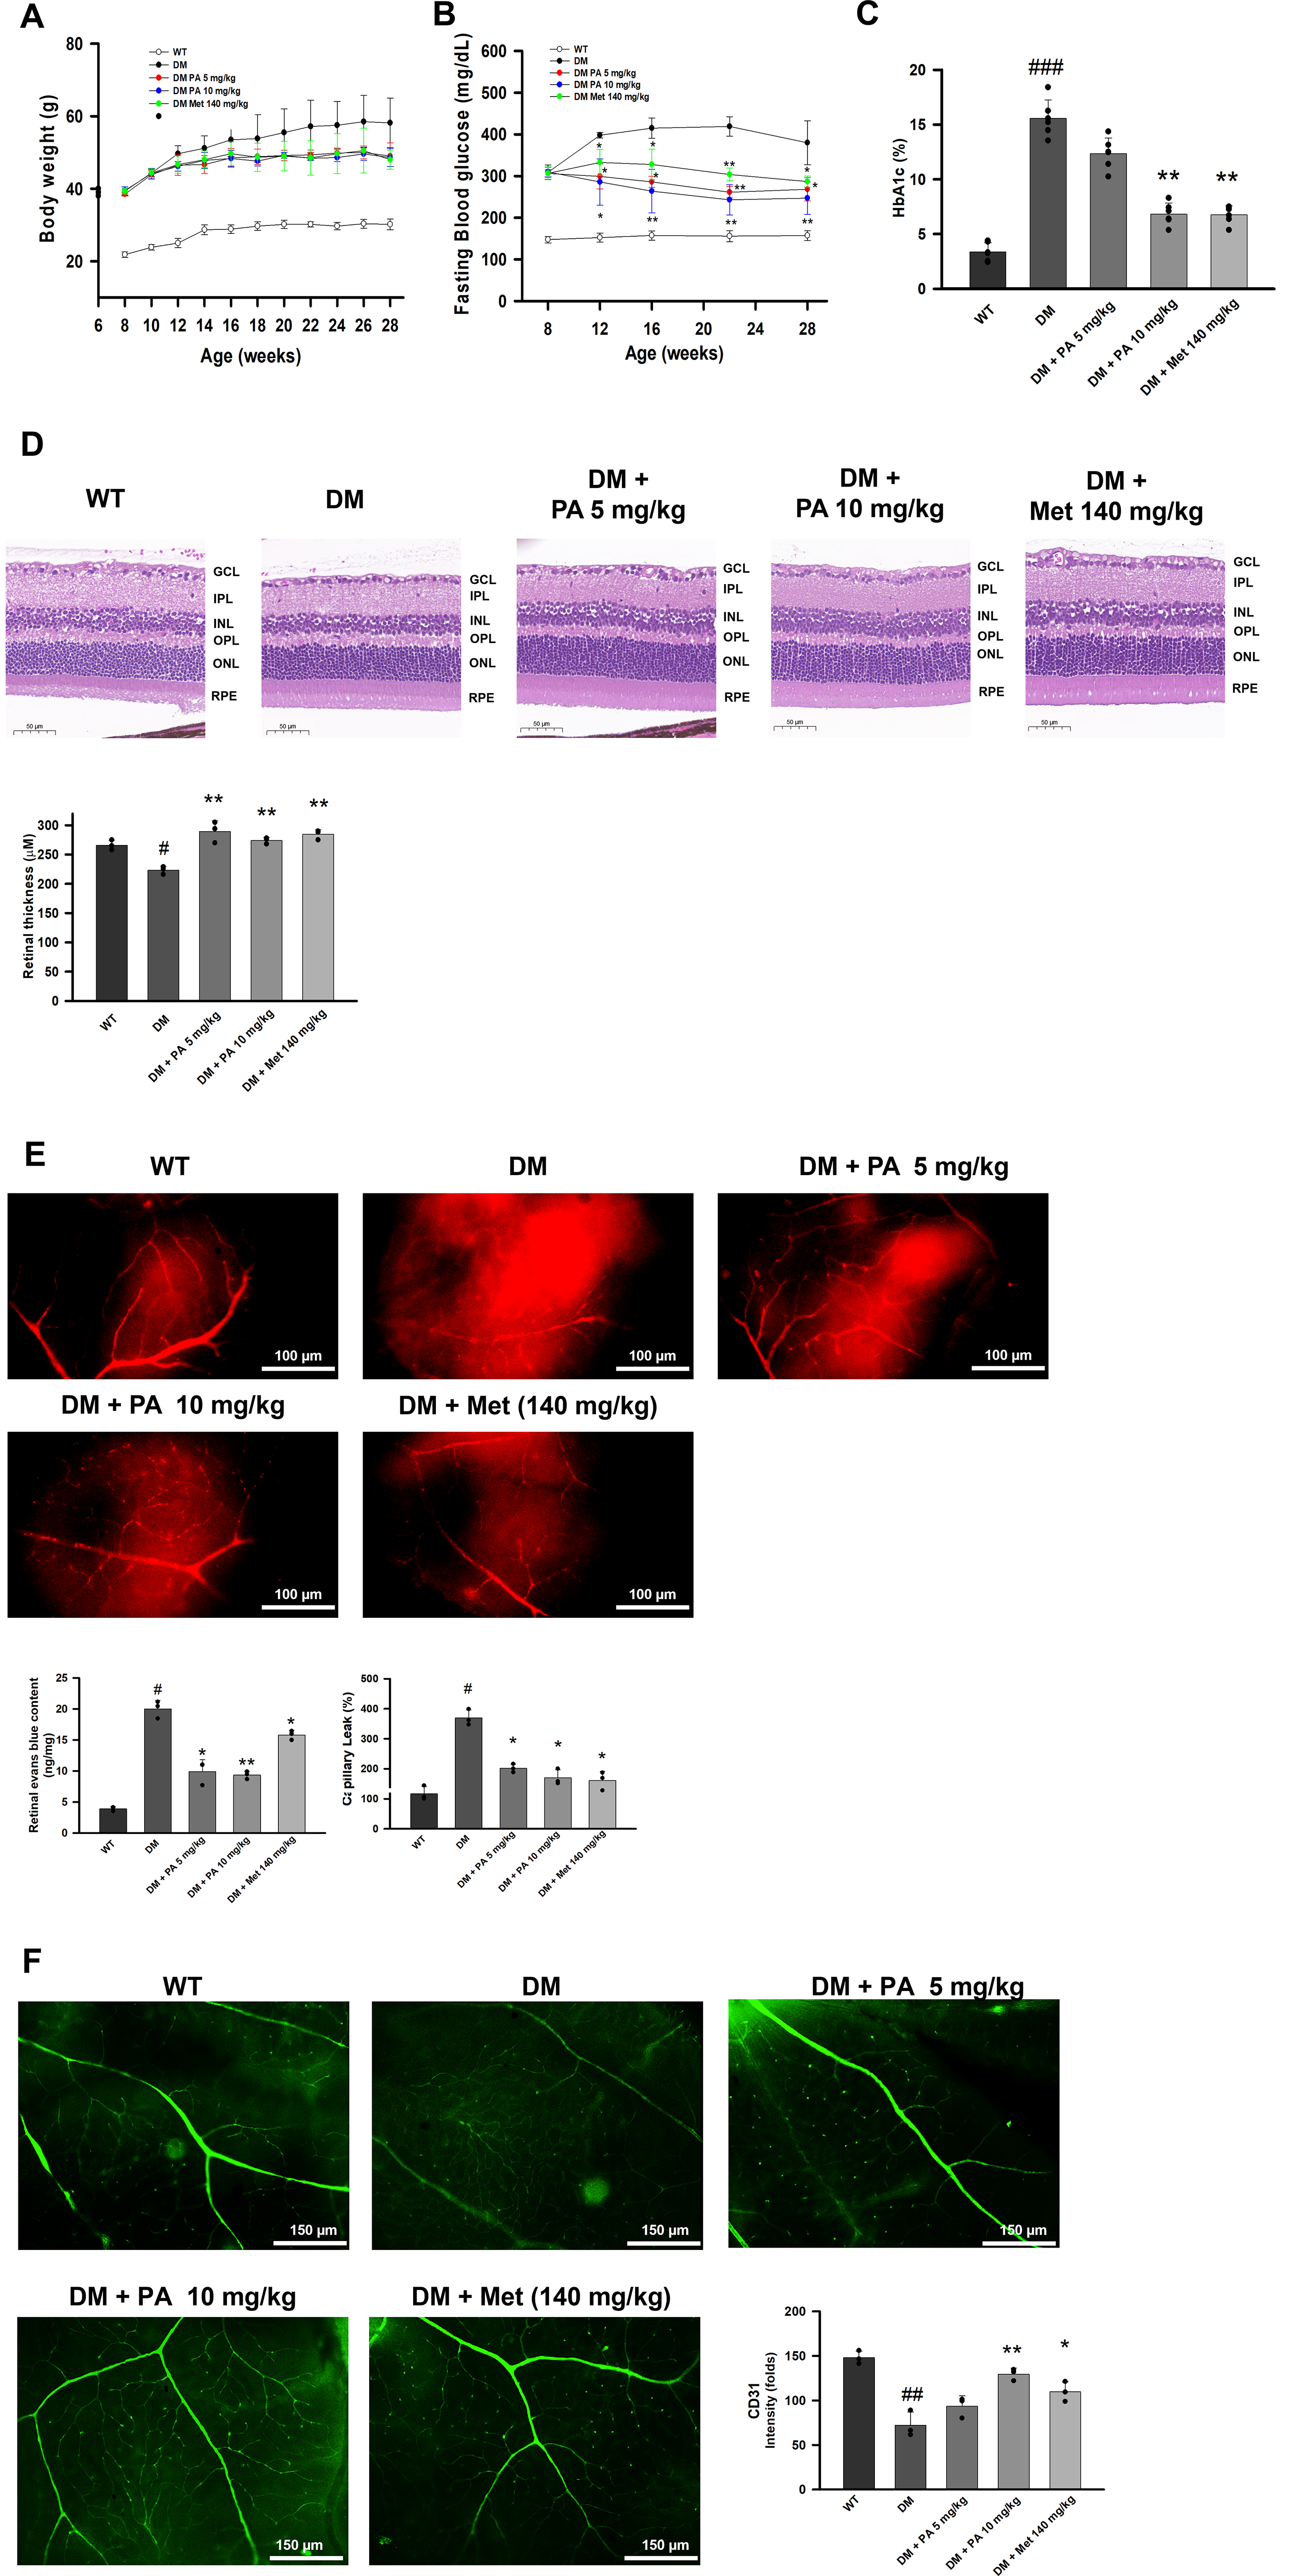
To delineate the therapeutic impact of PA on retinal pathology and metabolic dysregulation, we employed C57BLKS/J Iar−+Leprdb/+Leprdb mice to establish a DR model. During the 20-week treatment period, body weight rose steadily in the DM group but was maintained at consistent levels in the PA and metformin groups (Fig. 1A). Glycemic monitoring revealed a progressive and sustained reduction in random blood glucose levels throughout PA treatment (Fig. 1B), and hemoglobin A1c (HbA1c) measurements at week 28 further confirmed a significant improvement in long-term glycemic control (Fig. 1C). After 20 consecutive weeks of PA administration, PA-treated diabetic mice demonstrated a striking preservation of retinal thickness and retinal architecture, in sharp contrast to the pronounced retinal thinning observed in untreated DM mice (Fig. 1D). At the microvascular level, Evans blue assays showed marked vascular leakage in untreated DM retinas, indicating tight junction disruption, whereas PA treatment substantially reduced vascular permeability (Fig. 1E). Consistently, CD31 immunostaining revealed severe loss of microvascular density and endothelial integrity in DM mice, both of which were significantly restored following PA therapy (Fig. 1F). Despite the expected time-dependent weight gain in DM mice, PA also mitigated diabetes-associated metabolic deterioration (Fig. 1A–C). Together, these findings provide strong evidence that PA confers robust protection against retinal structural damage, preserves microvascular integrity, and improves systemic metabolic outcomes in diabetic mice.
PA prevents outer BRB tight junction protein disruption in the retinas of DM mice
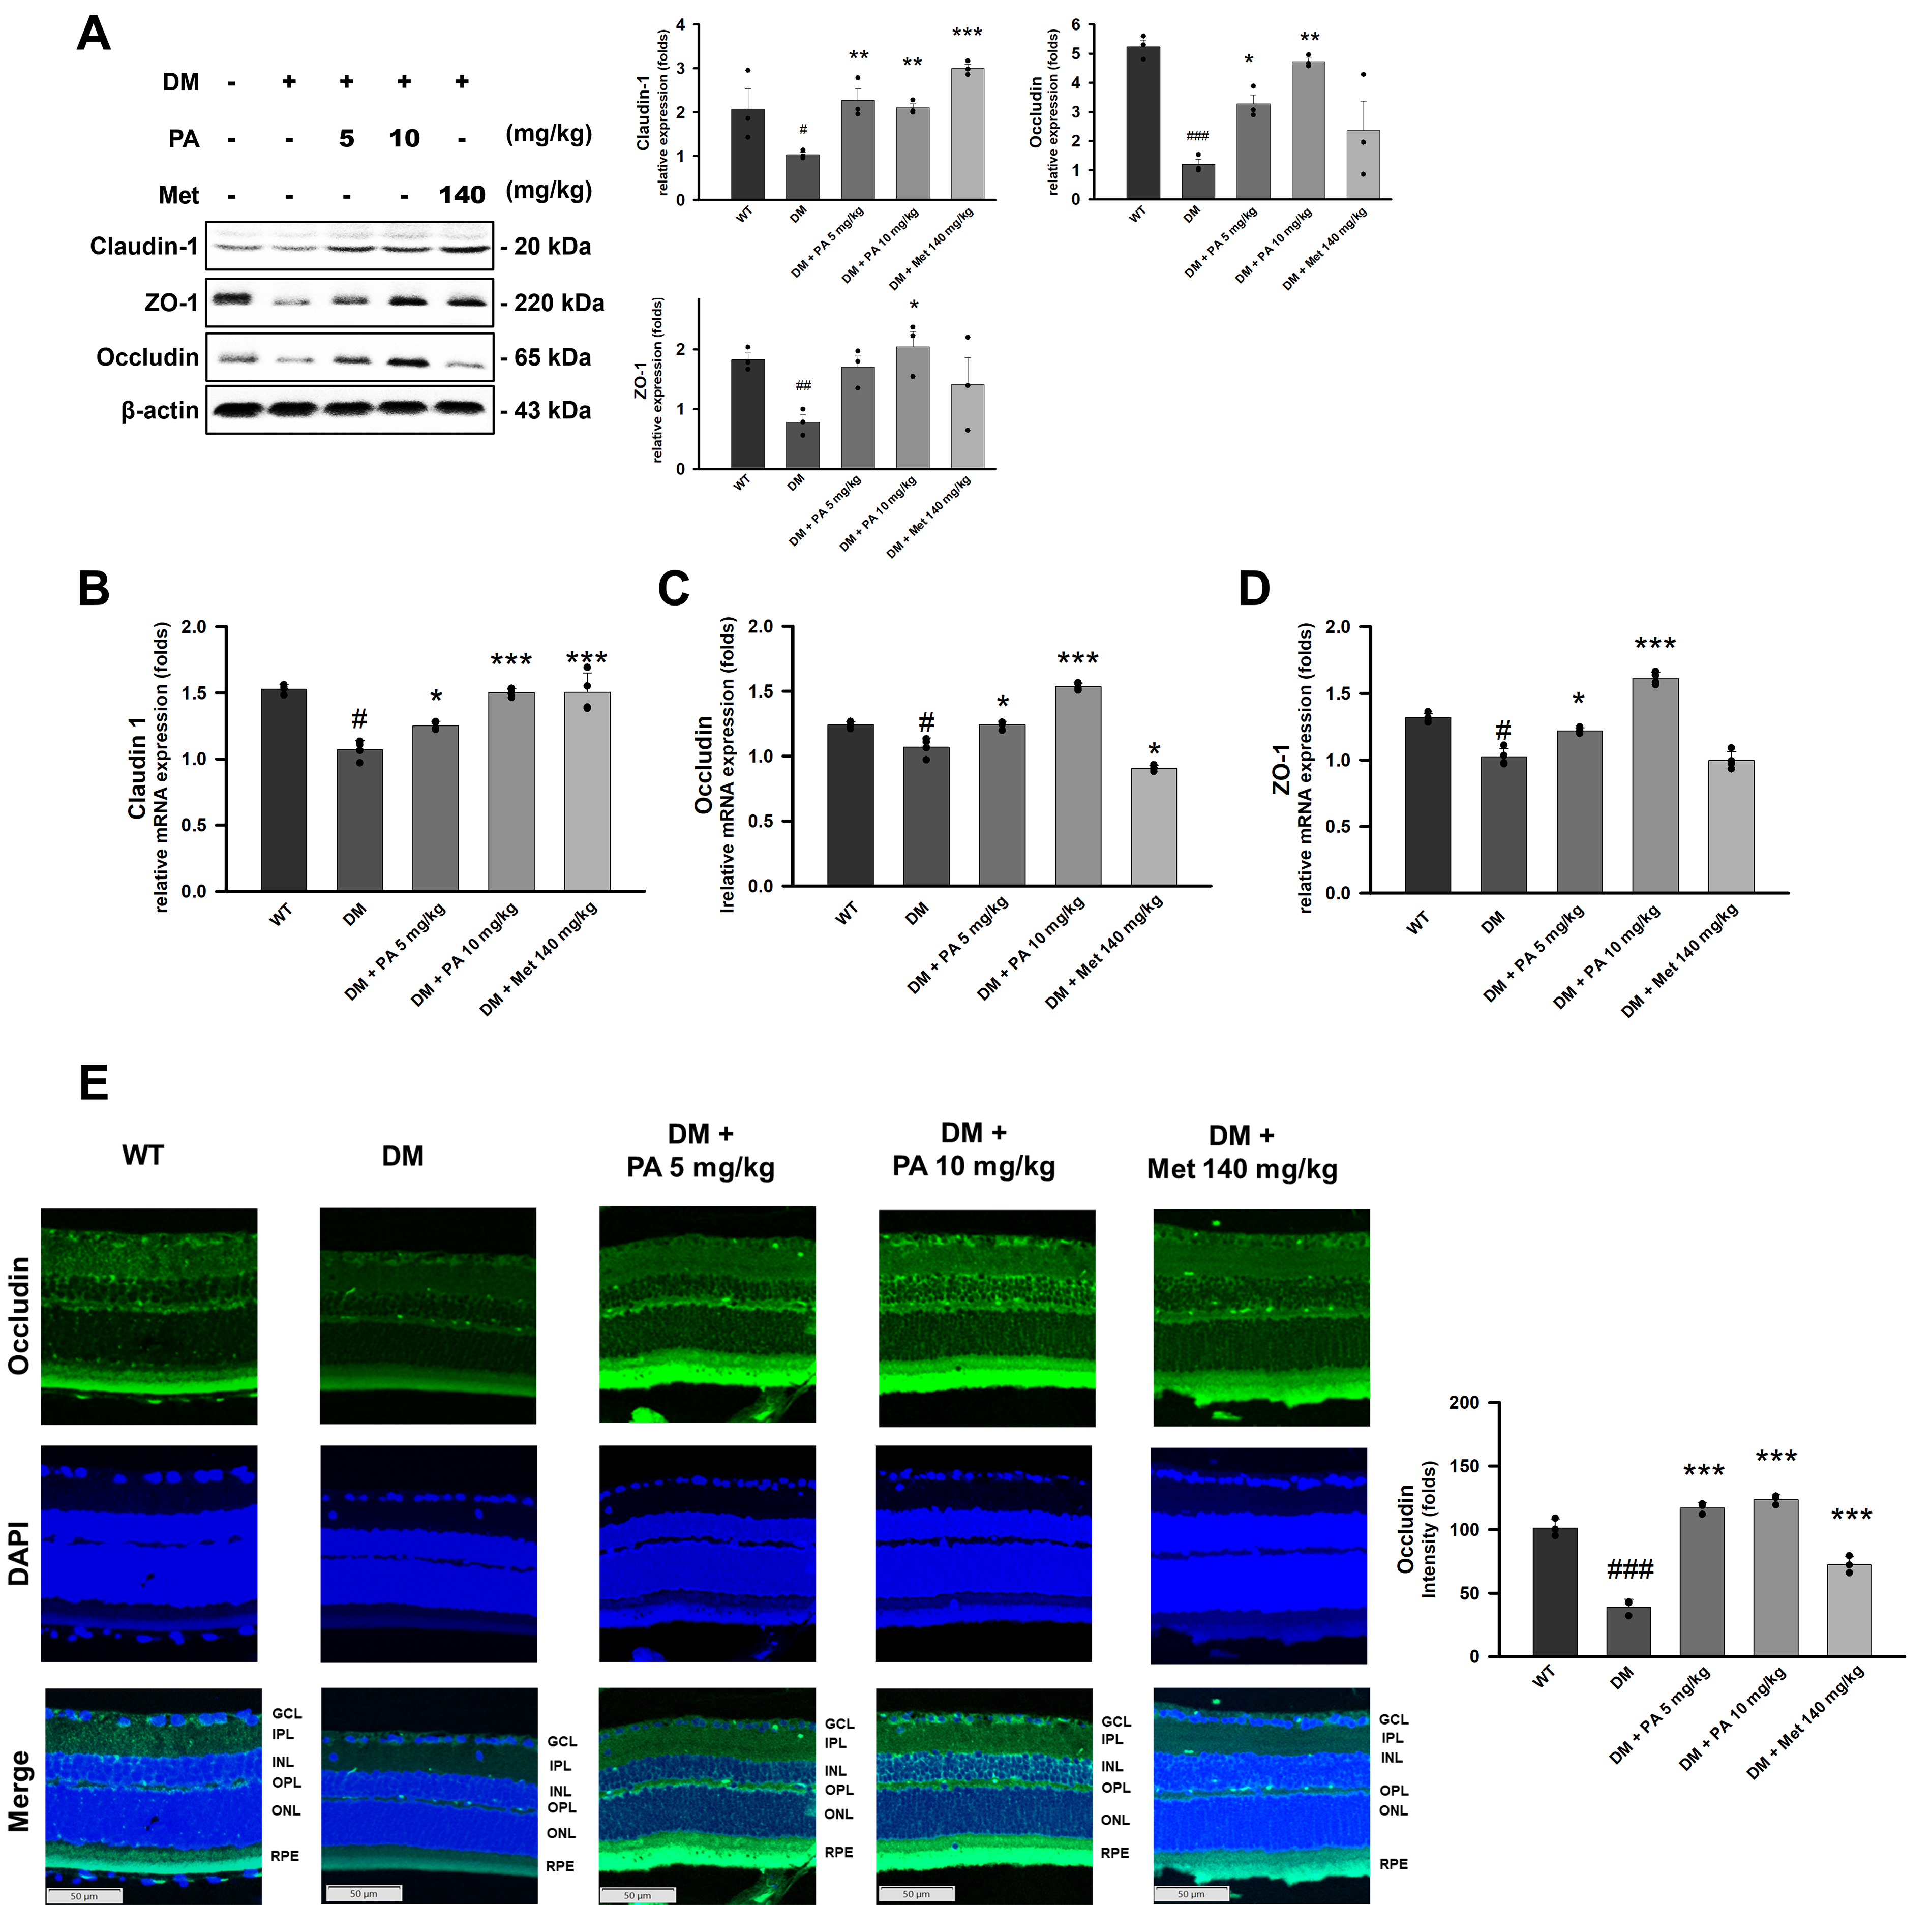
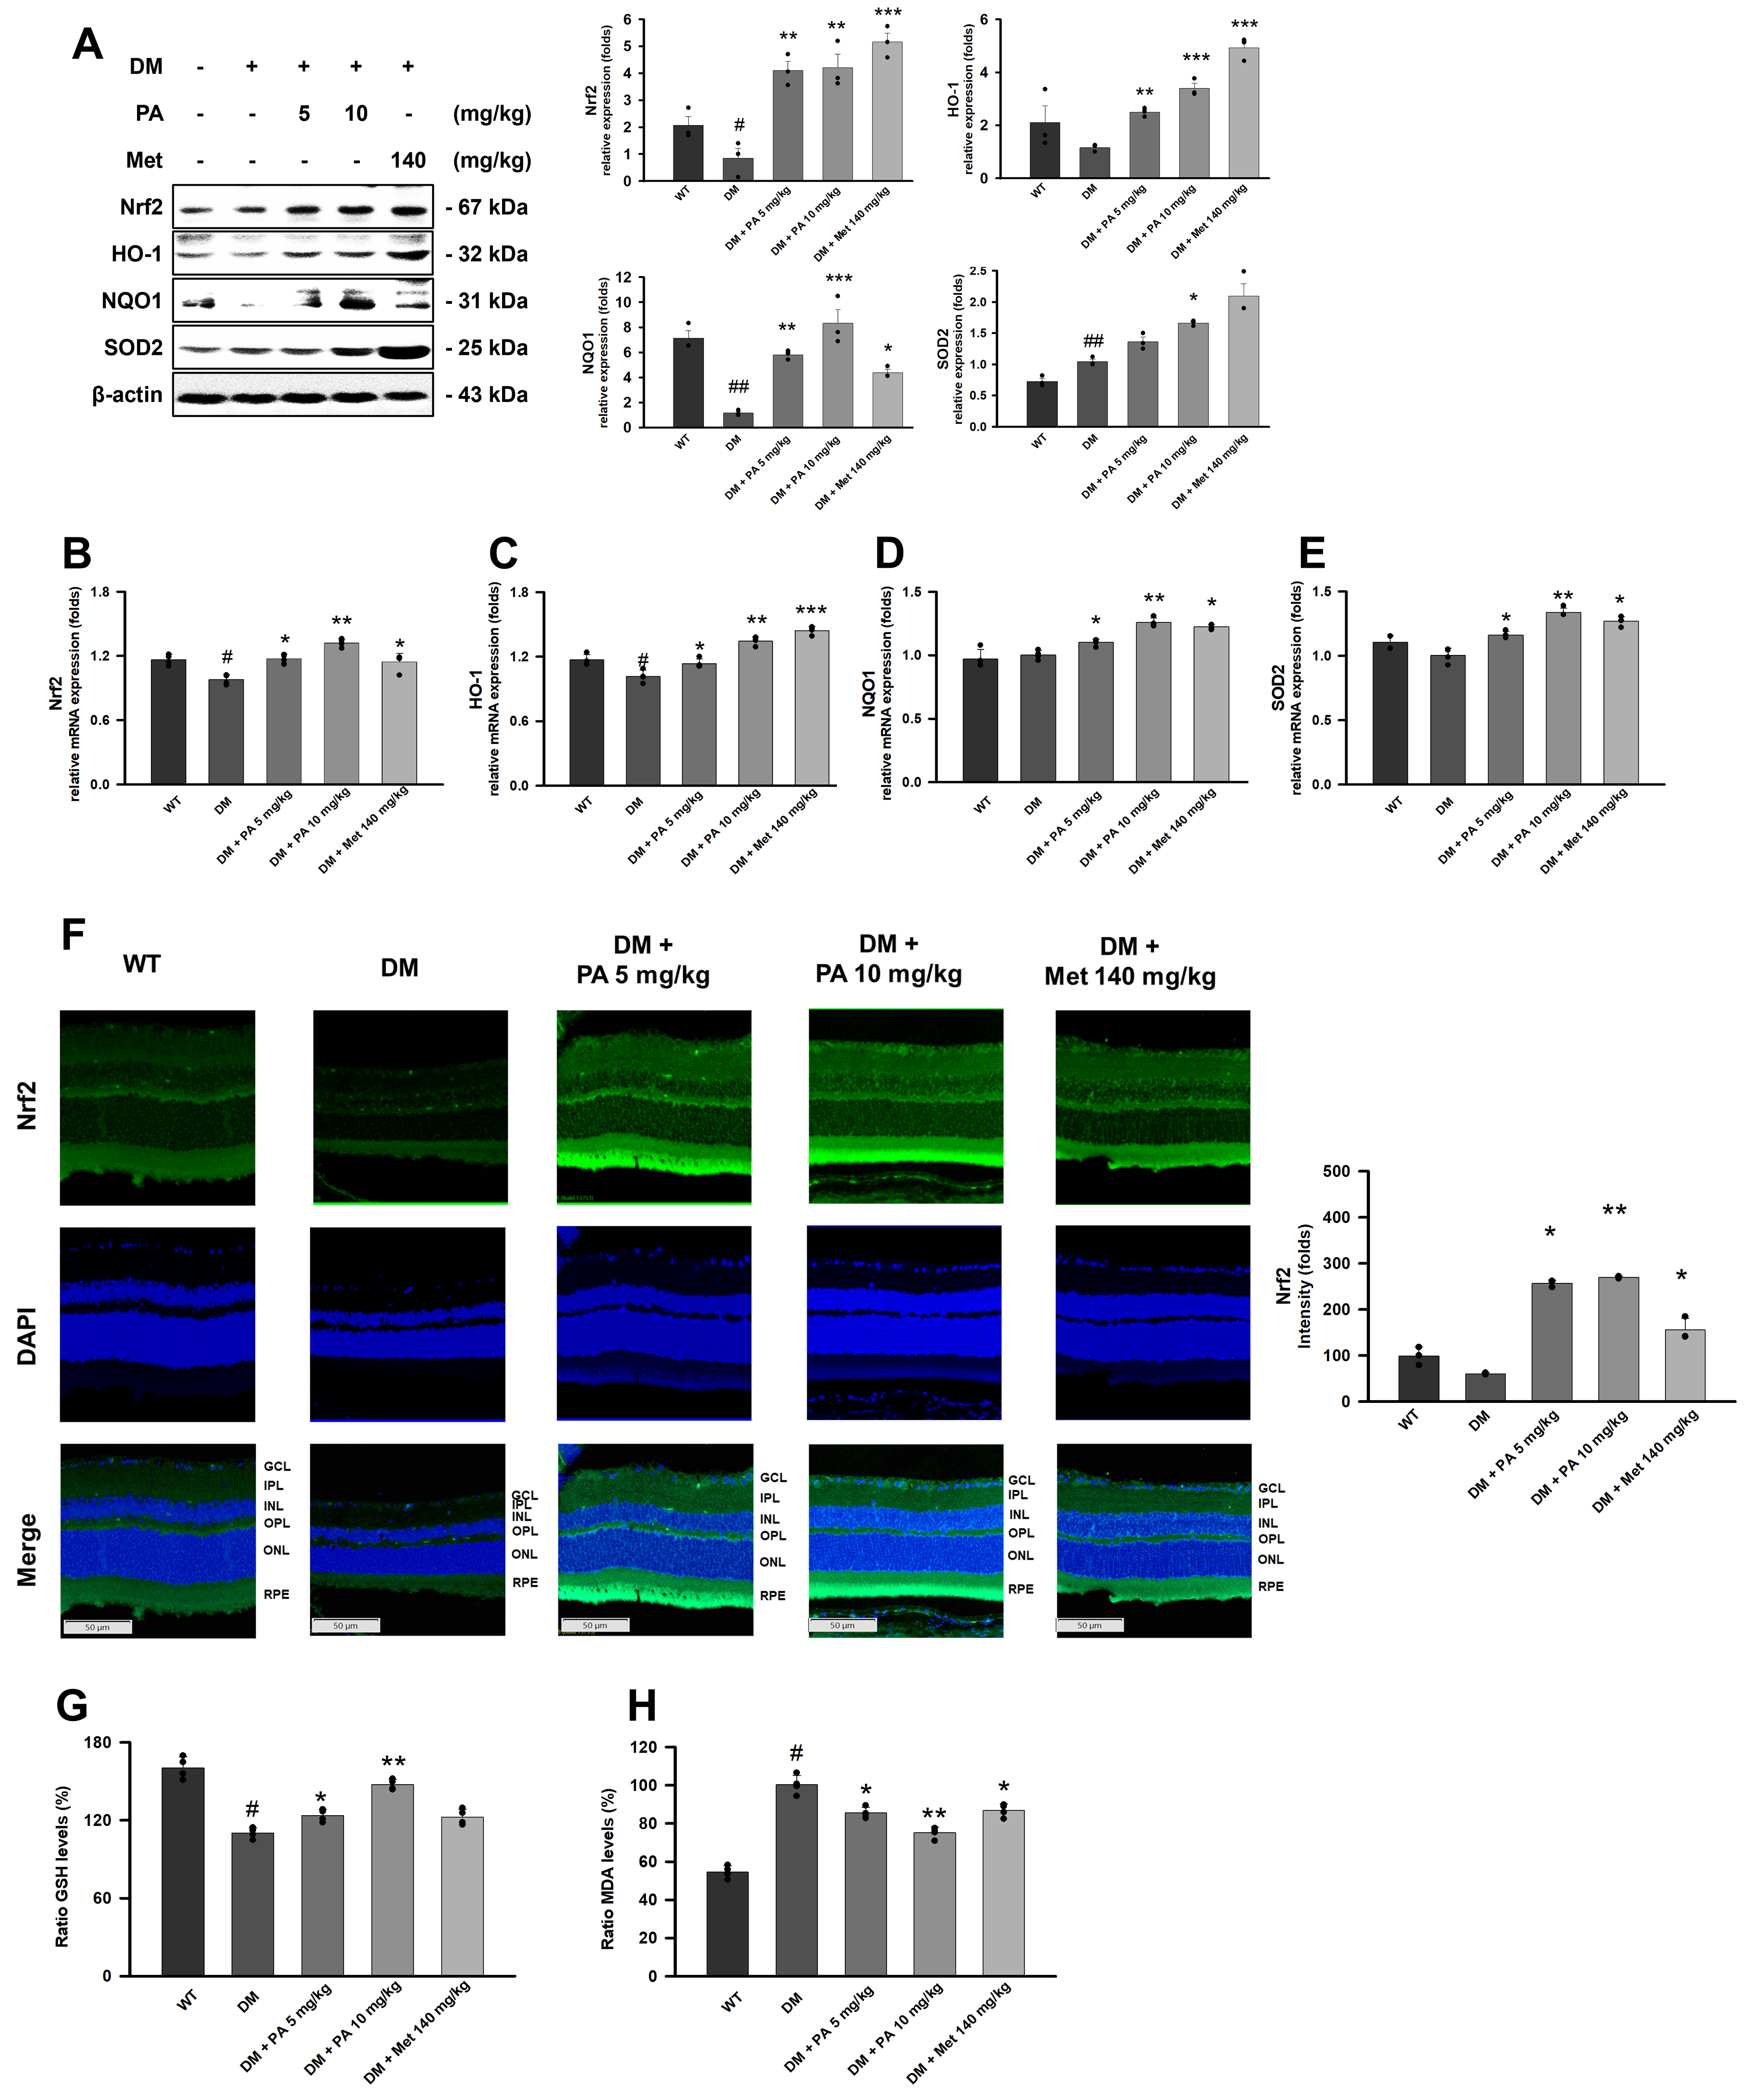
The molecular mechanisms underlying pathological retinal structural damage in diabetic retinopathy involve the loss of tight junction proteins. Consistent findings from Western blot analysis (Fig. 2A), RT-qPCR (Fig. 2B–D), and immunofluorescence staining (Fig. 2E) demonstrated a marked reduction in the expression of tight junction proteins (claudin-1, occludin, and ZO-1) in the retinal RPE layer of DM mice compared with wild-type controls. Notably, PA intervention restored these tight junction components in a dose-dependent manner, bringing their expression levels close to those observed under normal physiological conditions (Fig. 2A–E).
PA protects against retinal ferroptosis and its characteristic manifestations in DM mice
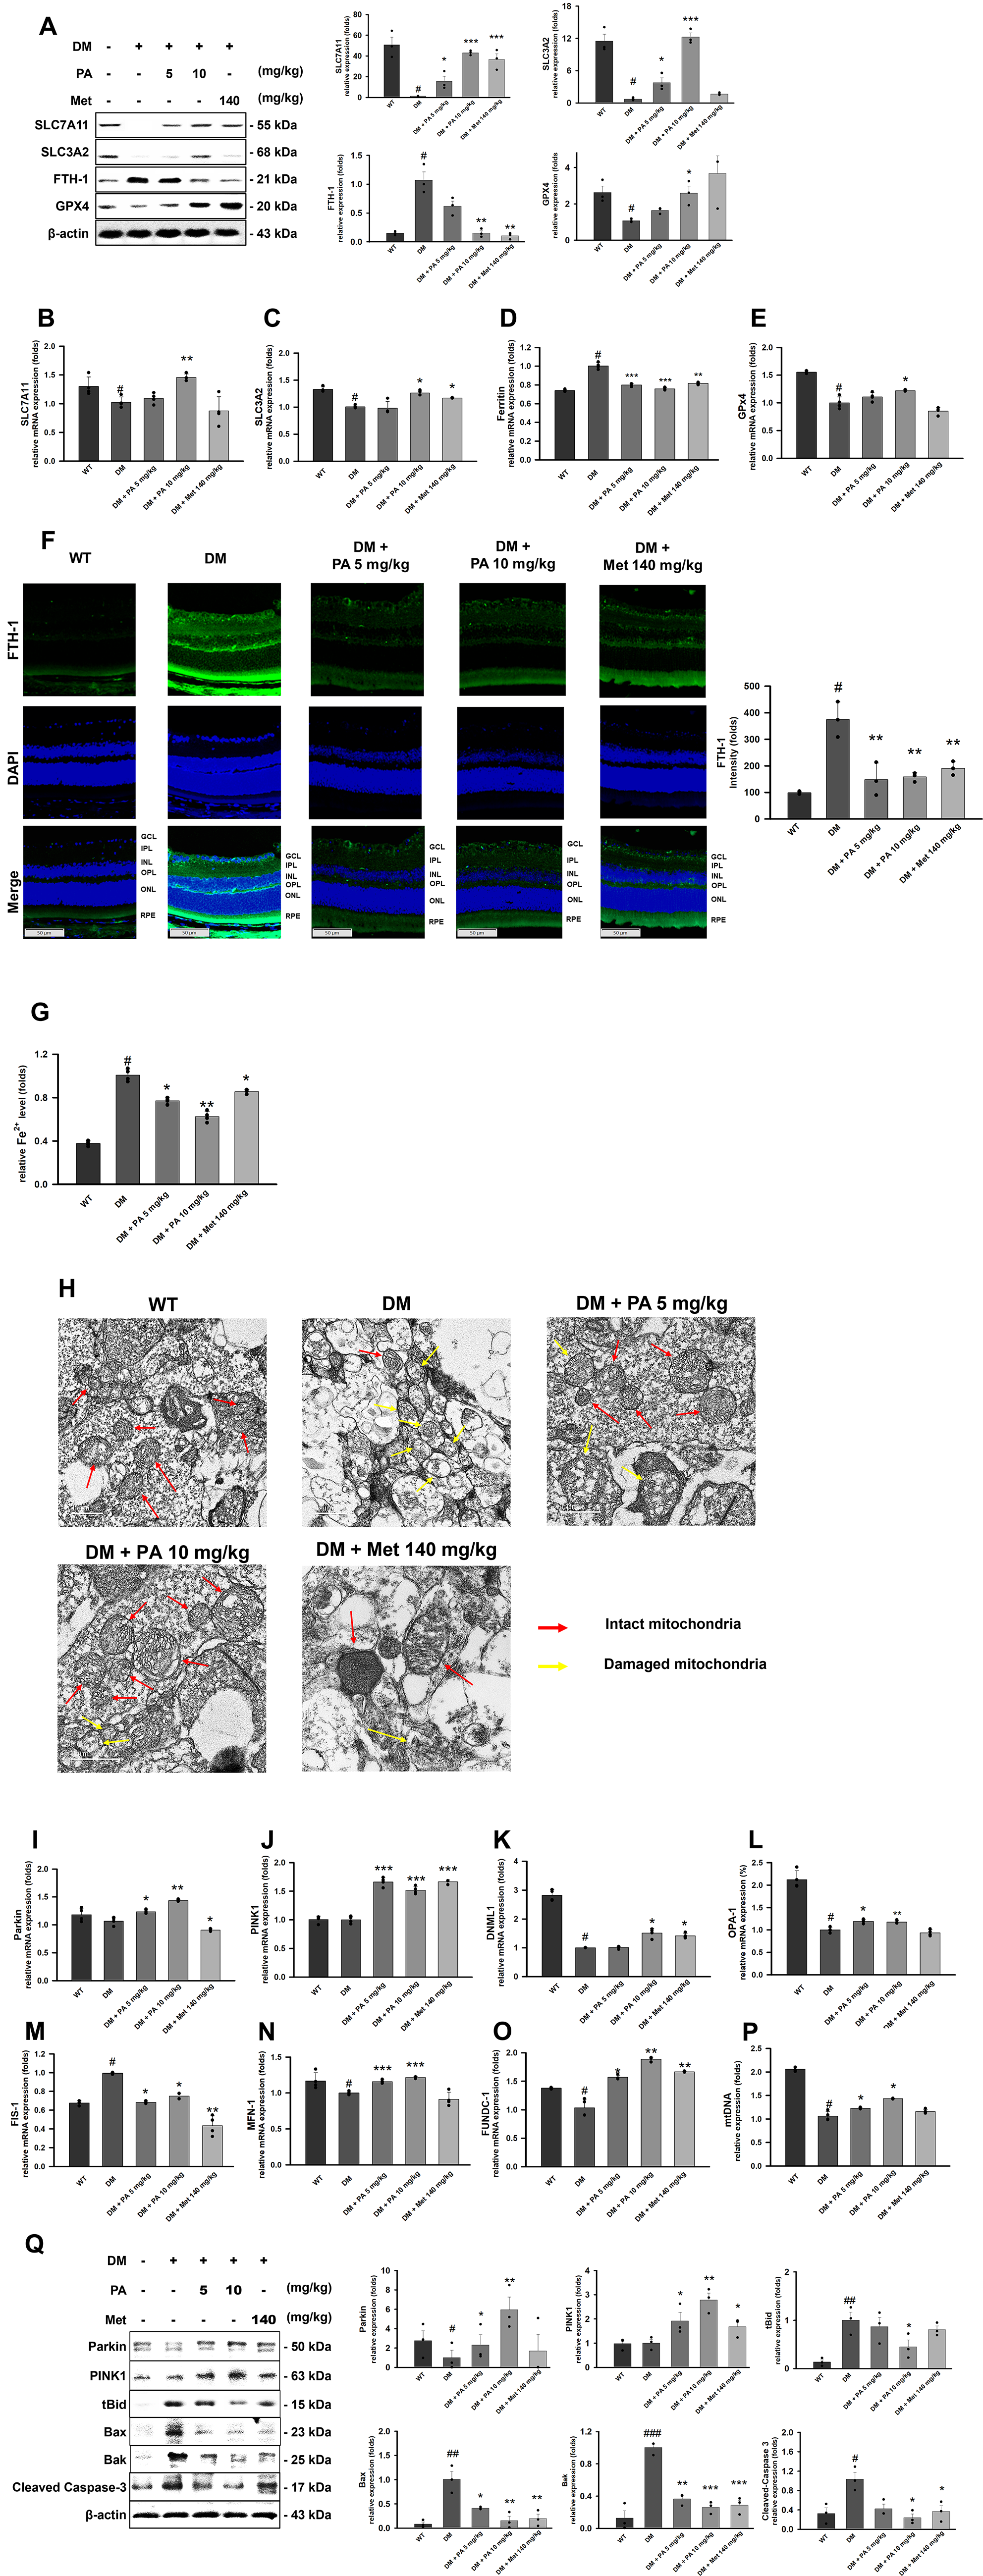
Loss of tight junction proteins is associated with the activation of ferroptosis. We examined the expression of ferroptosis-related markers in the retinas of DM mice. At 28 weeks of age, the retina of DM mice exhibited decreased expression of SLC7A11, SLC3A2, and GPX4, accompanied by an increase in ferritin heavy chain 1 (FTH-1) expression (Fig. 3A–F). Consistently, Fe2+ accumulation was markedly elevated in the retinas of DM mice (Fig. 3G), collectively indicating the occurrence of ferroptosis. PA treatment reversed these alterations in a dose-dependent manner. In addition, because mitochondrial dysfunction represents a key driver of oxidative stress and ferroptosis injury, we further evaluated the expression of mitochondrial homeostasis–related genes in the retina using reverse transcription polymerase chain reaction (RT-PCR). DM mice displayed clear mitochondrial defects, reflected by reduced expression of DNM1L, OPA-1, fission 1 (FIS-1), mitofusin 1(MFN-1), and FUN14 domain containing 1 (FUNDC1) (Fig. 3K–O). Mitochondrial DNA copy-number analysis also confirmed reduced mitochondrial abundance and activity (Fig. 3P). Notably, PA treatment progressively restored mitochondrial function and concomitantly activated mitophagy, as evidenced by increased Parkin and phosphatase and tensin homolog (PTEN)-induced kinase 1 (PINK1) expression (Fig. 3I and J). Transmission electron microscopy provided direct ultrastructural confirmation that the untreated DM group displayed disrupted mitochondrial cristae, membrane rupture, and cytoplasmic swelling with vacuolization, whereas both normal and PA-treated groups showed well-preserved mitochondrial morphology with intact cristae (Fig. 3H). To evaluate mitochondrial-dependent apoptosis and mitophagy pathways, we analyzed the expression of relevant proteins via Western blotting. In the untreated DM group, a substantial upregulation of pro-apoptotic markers, including tBid, Bax, Bak, and cleaved Caspase-3, was observed in the retina. Notably, PA administration significantly attenuated the expression of these markers while simultaneously promoting the recruitment of PINK1 and Parkin (Fig. 3Q). Collectively, these results support the notion that PA exhibits potent ferroptosis-inhibitory capability.
PA promotes antioxidant protein expression in the retinas of DM mice
Ferroptosis is linked to redox system imbalance. We investigated the regulation of oxidative stress in DM mice after PA treatment. PA administration increased the expression of Nrf2 in the retinal RPE layer, along with the downstream antioxidant factors, including NAD(P)H quinone dehydrogenase 1(NQO1), heme oxygenase-1 (HO-1), and superoxide dismutase 2 (SOD2) (Fig. 4A–F). Notably, PA also suppressed MDA elevation and promoted GSH production in the retinas of DM mice (Fig. 4G and H). PA treatment resulted in marked antioxidant effects, coinciding with upregulation of Nrf2 and its downstream targets.
PA prevents HG-induced tight junction disruption in hRPE cells
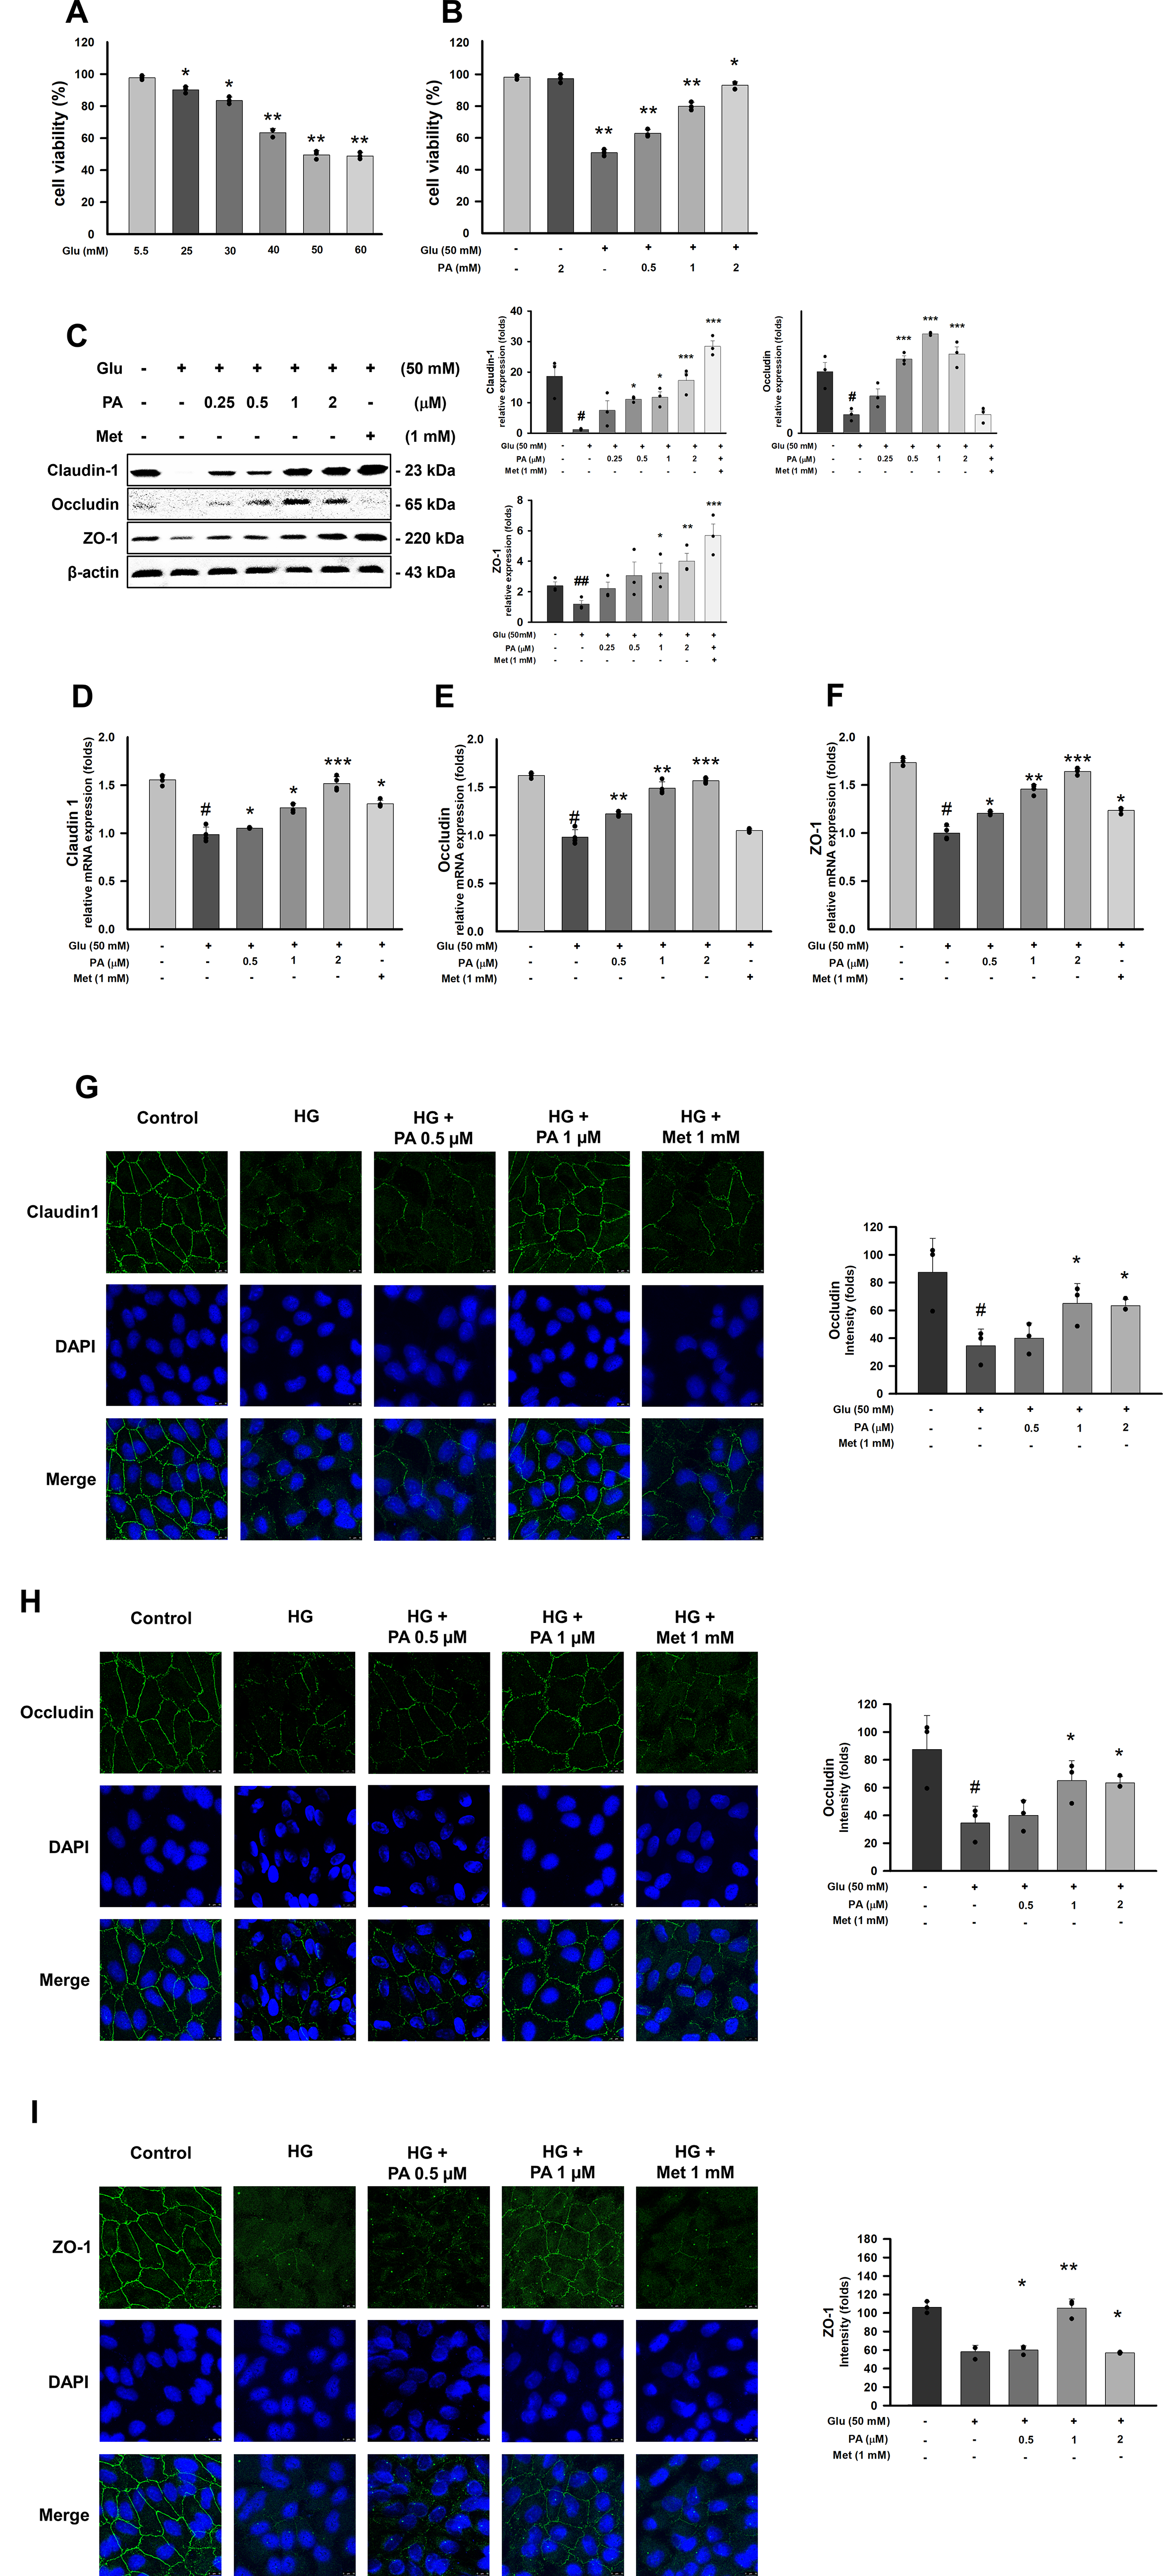
To establish an in vitro model of DR and further elucidate the mechanistic actions of PA, hRPE cells were exposed to varying glucose concentrations for 48 h. Exposure to 50 mM glucose for 48 h resulted in a significant reduction in cell viability, indicating substantial high-glucose-induced cytotoxicity (Fig. 5A and B). PA itself did not elicit cytotoxicity at any tested concentration in hRPE cells (Fig. 5B), confirming its safety under the experimental conditions. Analysis of tight junction proteins revealed that high glucose markedly suppressed the expression of Claudin-1, Occludin, and ZO-1 (Fig. 5C). However, pretreatment with PA for 1 hour effectively prevented high-glucose-induced tight junction disruption, restoring protein expression after 48 h (Fig. 5C–F). Immunofluorescence further illustrated the subcellular distribution of these proteins in hRPE cells: high-glucose exposure reduced cell density and substantially diminished Claudin-1 (Fig. 5G), Occludin (Fig. 5H), and ZO-1 (Fig. 5I) signals. PA intervention markedly reversed these alterations, indicating that PA preserves tight junction integrity in hRPE cells under hyperglycemic stress.
PA inhibits HG-induced ferroptosis in hRPE cells
HG exposure markedly reduced the protein and mRNA expression levels of SLC7A11, SLC3A2, and GPX4 in hRPE cells (Fig. 6A–C, E, F, H), while concomitantly increasing FTH-1 expression and intracellular Fe2+ accumulation (Fig. 6D,G, I). These alterations are characteristic of ferroptosis activation, indicating that HG induces ferroptosis in hRPE cells. PA treatment significantly reversed these HG-induced changes. To further validate the involvement of ferroptosis in PA-mediated protection, we performed comparative assays using the ferroptosis activator Ras-selective lethal small molecule 3 (RSL-3) and the inhibitor ferrostatin-1. Notably, co-treatment with RSL-3 (0.5 µM) abolished the PA-mediated restoration of SLC7A11 and SLC3A2, reducing their expression to levels comparable to the HG group, suggesting that ferroptosis activation negates the protective effects of PA (Fig. 6J). In contrast, PA exhibited efficacy comparable to ferrostatin-1 in rescuing ferroptosis-related markers. The combination of PA with ferrostatin-1 did not produce additional benefits beyond those achieved by ferrostatin-1 alone (ns), implying that both agents act through similar regulatory pathways (Fig. 6K). Collectively, these bidirectional findings demonstrate that the protective effects of PA are suppressed by ferroptosis activation and mirror those of a ferroptosis inhibitor, strongly supporting that PA exerts its cytoprotective function primarily by inhibiting the ferroptosis pathway.

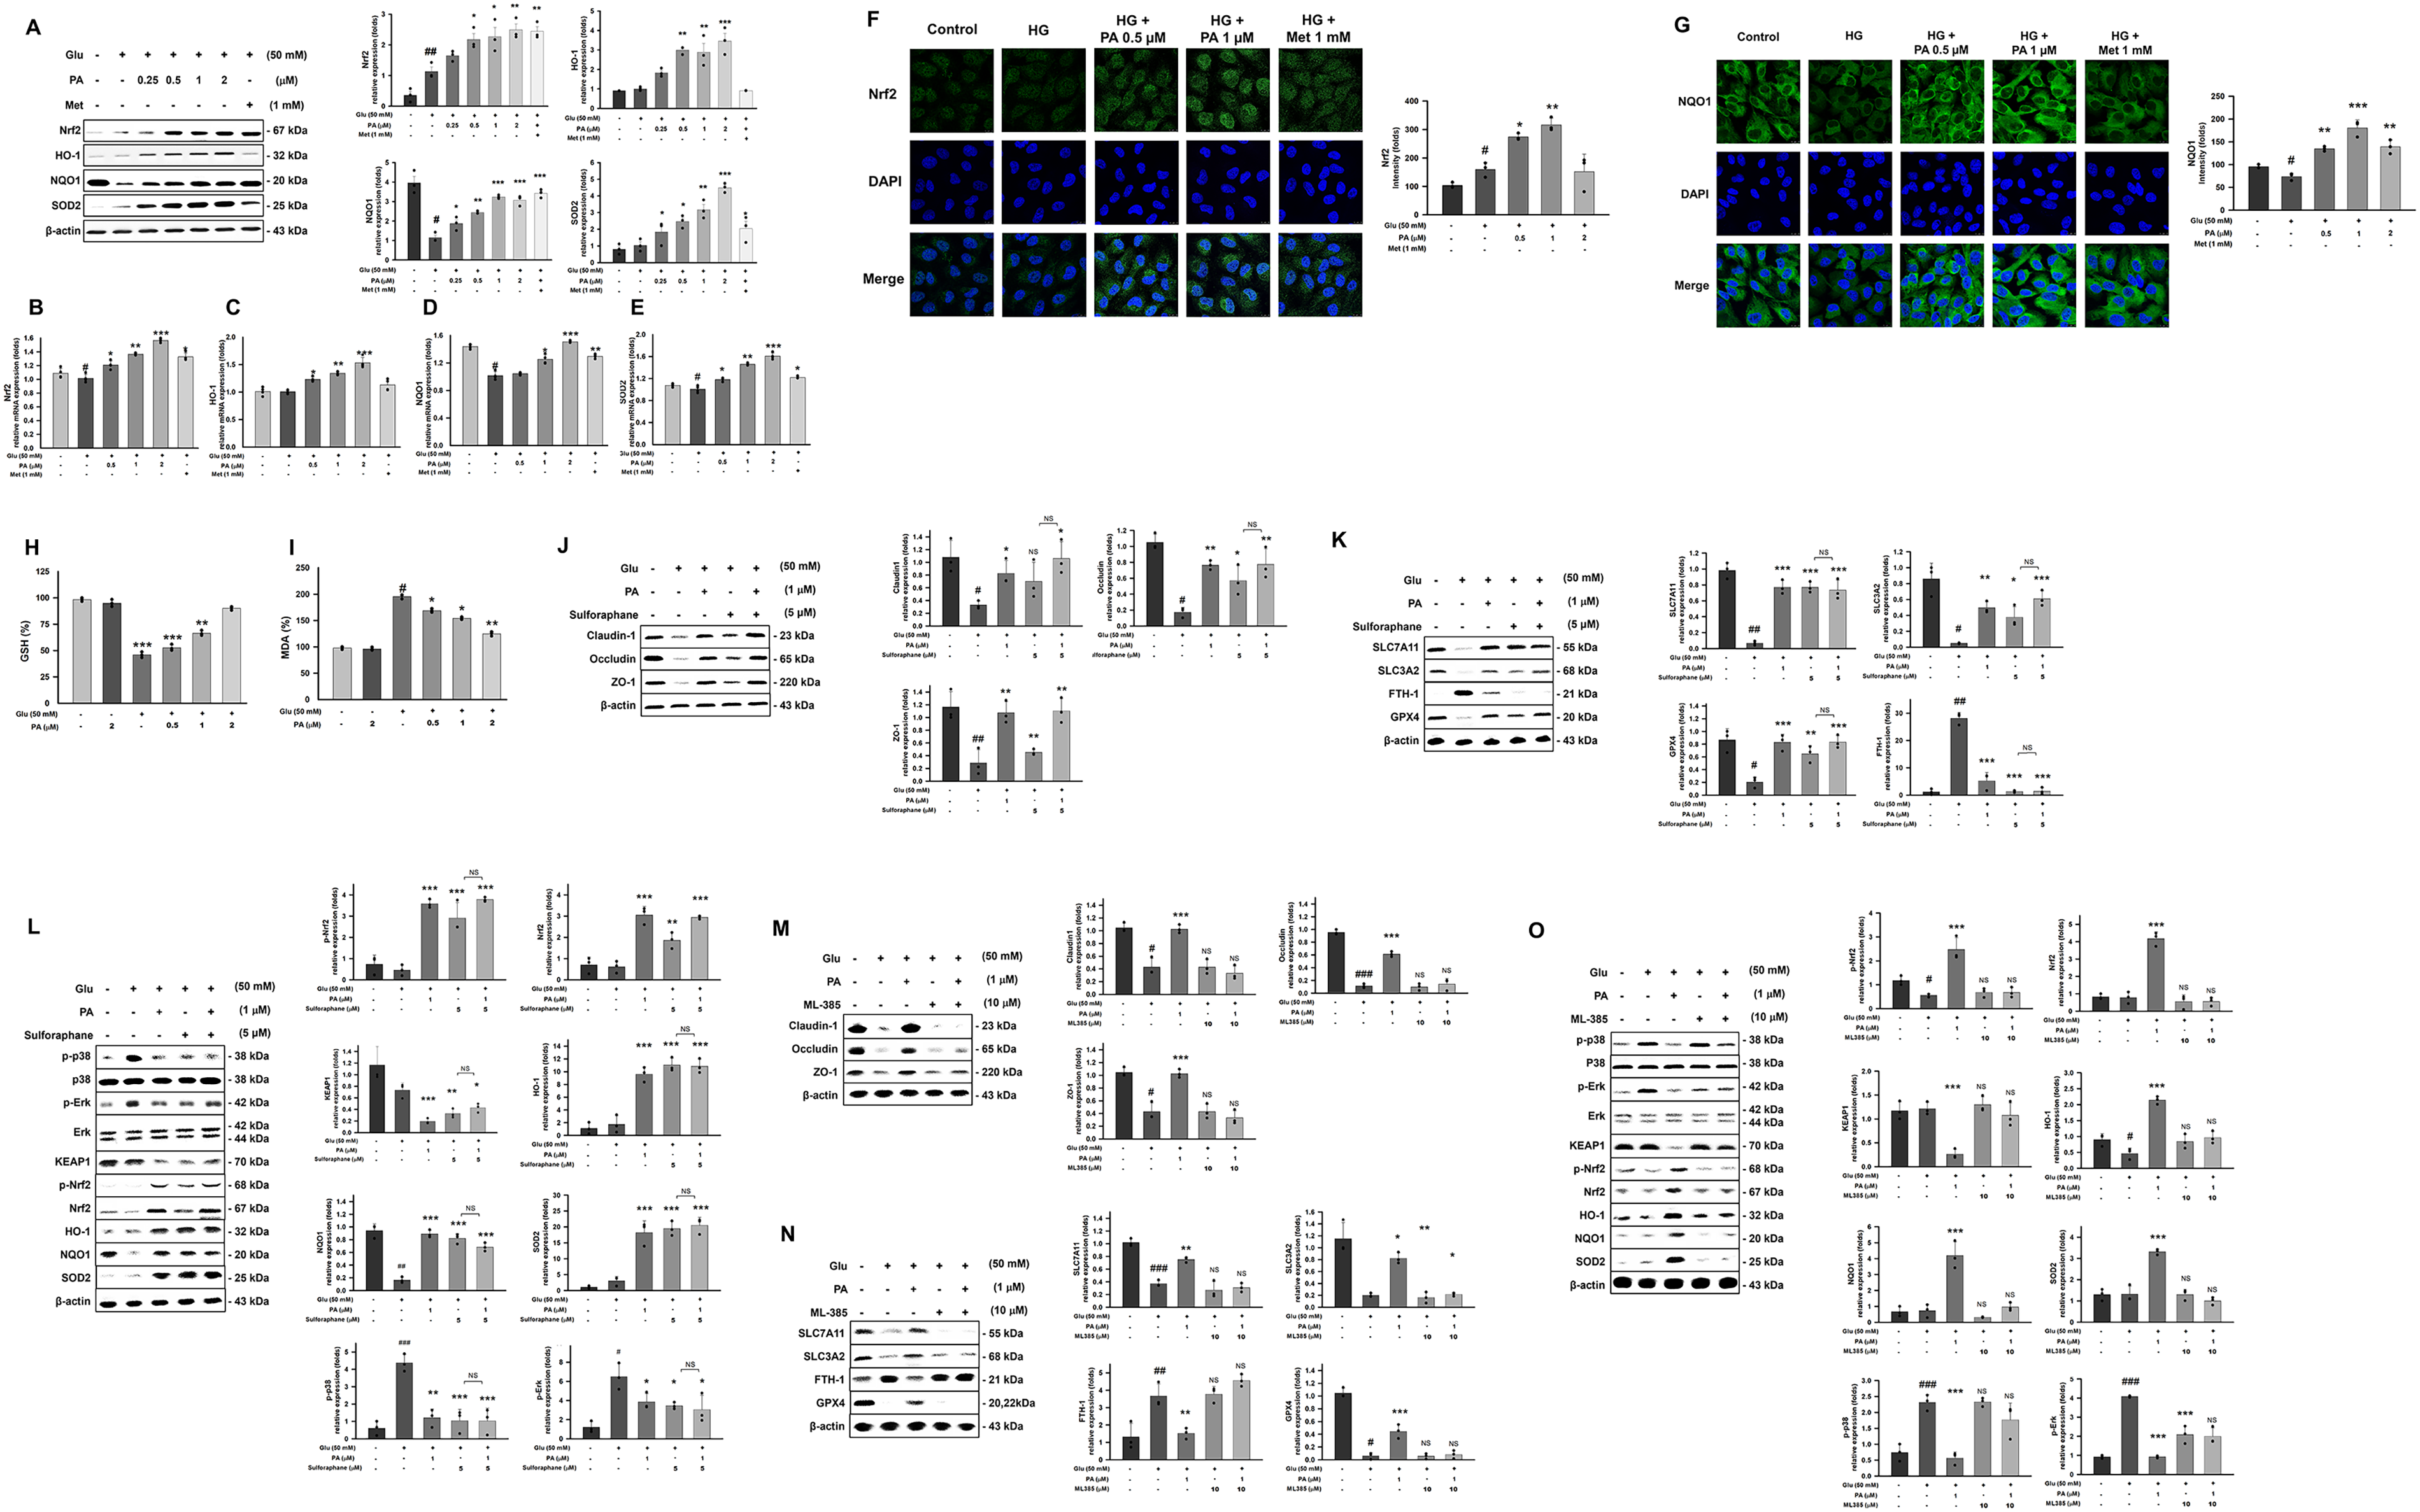
PA suppresses ROS generation and lipid peroxidation and upregulates Nrf2 and its downstream antioxidant genes
Lipid peroxidation is a typical pathological mechanism of ferroptosis, thereby examined the lipid peroxidation factors and antioxidant proteins. The results showed that HG stimulation significantly decreased Nrf2, HO-1, NQO1, SOD2, GSH, and increased MDA expression, indicating HG stimulated lipid peroxidation and impaired antioxidant function in hRPE cells (Fig. 7A–I). The results showed that PA enhanced the expression of Nrf2 downstream antioxidant factors, including HO-1, NQO1, and SOD2 (Fig. 7A–G). Immunofluorescence showed that HG eliminated Nrf2 expression in the nucleus and lowered downstream NQO1 expression (Fig. 7F and G). After PA treatment, GSH levels were restored, and MDA expression was suppressed (Fig. 7H and I); in the meantime, PA promotes Nrf2 expression, nuclear translocation, and activates the related antioxidant signaling pathways (Fig. 7F). To definitively confirm that the protective mechanism of PA is mediated by the Nrf2 pathway, we performed mechanistic studies using the Nrf2 activator Sulforaphane and the inhibitor ML-385. As shown in Figure 7J and K, HG treatment significantly suppressed the expression of Nrf2 and its downstream targets (SLC7A11, SLC3A2, FTH-1, HO-1, NQO1, SOD2) compared to the control group. Treatment with PA (1 µM) or Sulforaphane (5 µM) alone significantly restored these levels. Importantly, the combination of PA and Sulforaphane did not produce any significant additive effects compared to Sulforaphane alone (ns), suggesting that PA mimics the action of Sulforaphane and likely acts through the same signaling axis. Conversely, the Nrf2 inhibitor ML-385 was used to verify dependency. While PA effectively upregulated Nrf2-related antioxidant proteins and tight junction markers (ZO-1, Occludin, Claudin-1), this protective effect was significantly abolished by ML-385 (10 µM) (Fig. 7M and N). The protein levels in the PA–ML-385 combo group were significantly lower than those in the PA-only group, confirming that PA-mediated protection is Nrf2-dependent. To investigate the upstream signaling pathways involved in PA-mediated protection, we analyzed the phosphorylation status of MAPKs (p38 and ERK) and the expression of kelch-like ECH-associated protein 1 (KEAP1)/Nrf2. As shown in Figure 7L and O, HG induced a significant stress response, characterized by the aberrant hyperphosphorylation of p38 (p-p38) and extracellular signal-regulated kinase (ERK) (p-Erk) compared to the control group. This activation of stress-related MAPKs was accompanied by an upregulation of KEAP1 and a suppression of Nrf2 nuclear accumulation/activity. Treatment with PA (1 µM) effectively alleviated this stress response. PA treatment significantly suppressed the phosphorylation of p38 and ERK, restoring them to levels comparable to the control. Concurrently, PA downregulated KEAP1 expression and significantly increased p-Nrf2 levels. These findings suggest that PA exerts its cytoprotective effects by dampening the HG-induced overactivation of p38/ERK stress signaling pathways, while simultaneously enhancing the Nrf2 antioxidant response, possibly through the inhibition of KEAP1-mediated degradation (Fig. 8).
Results
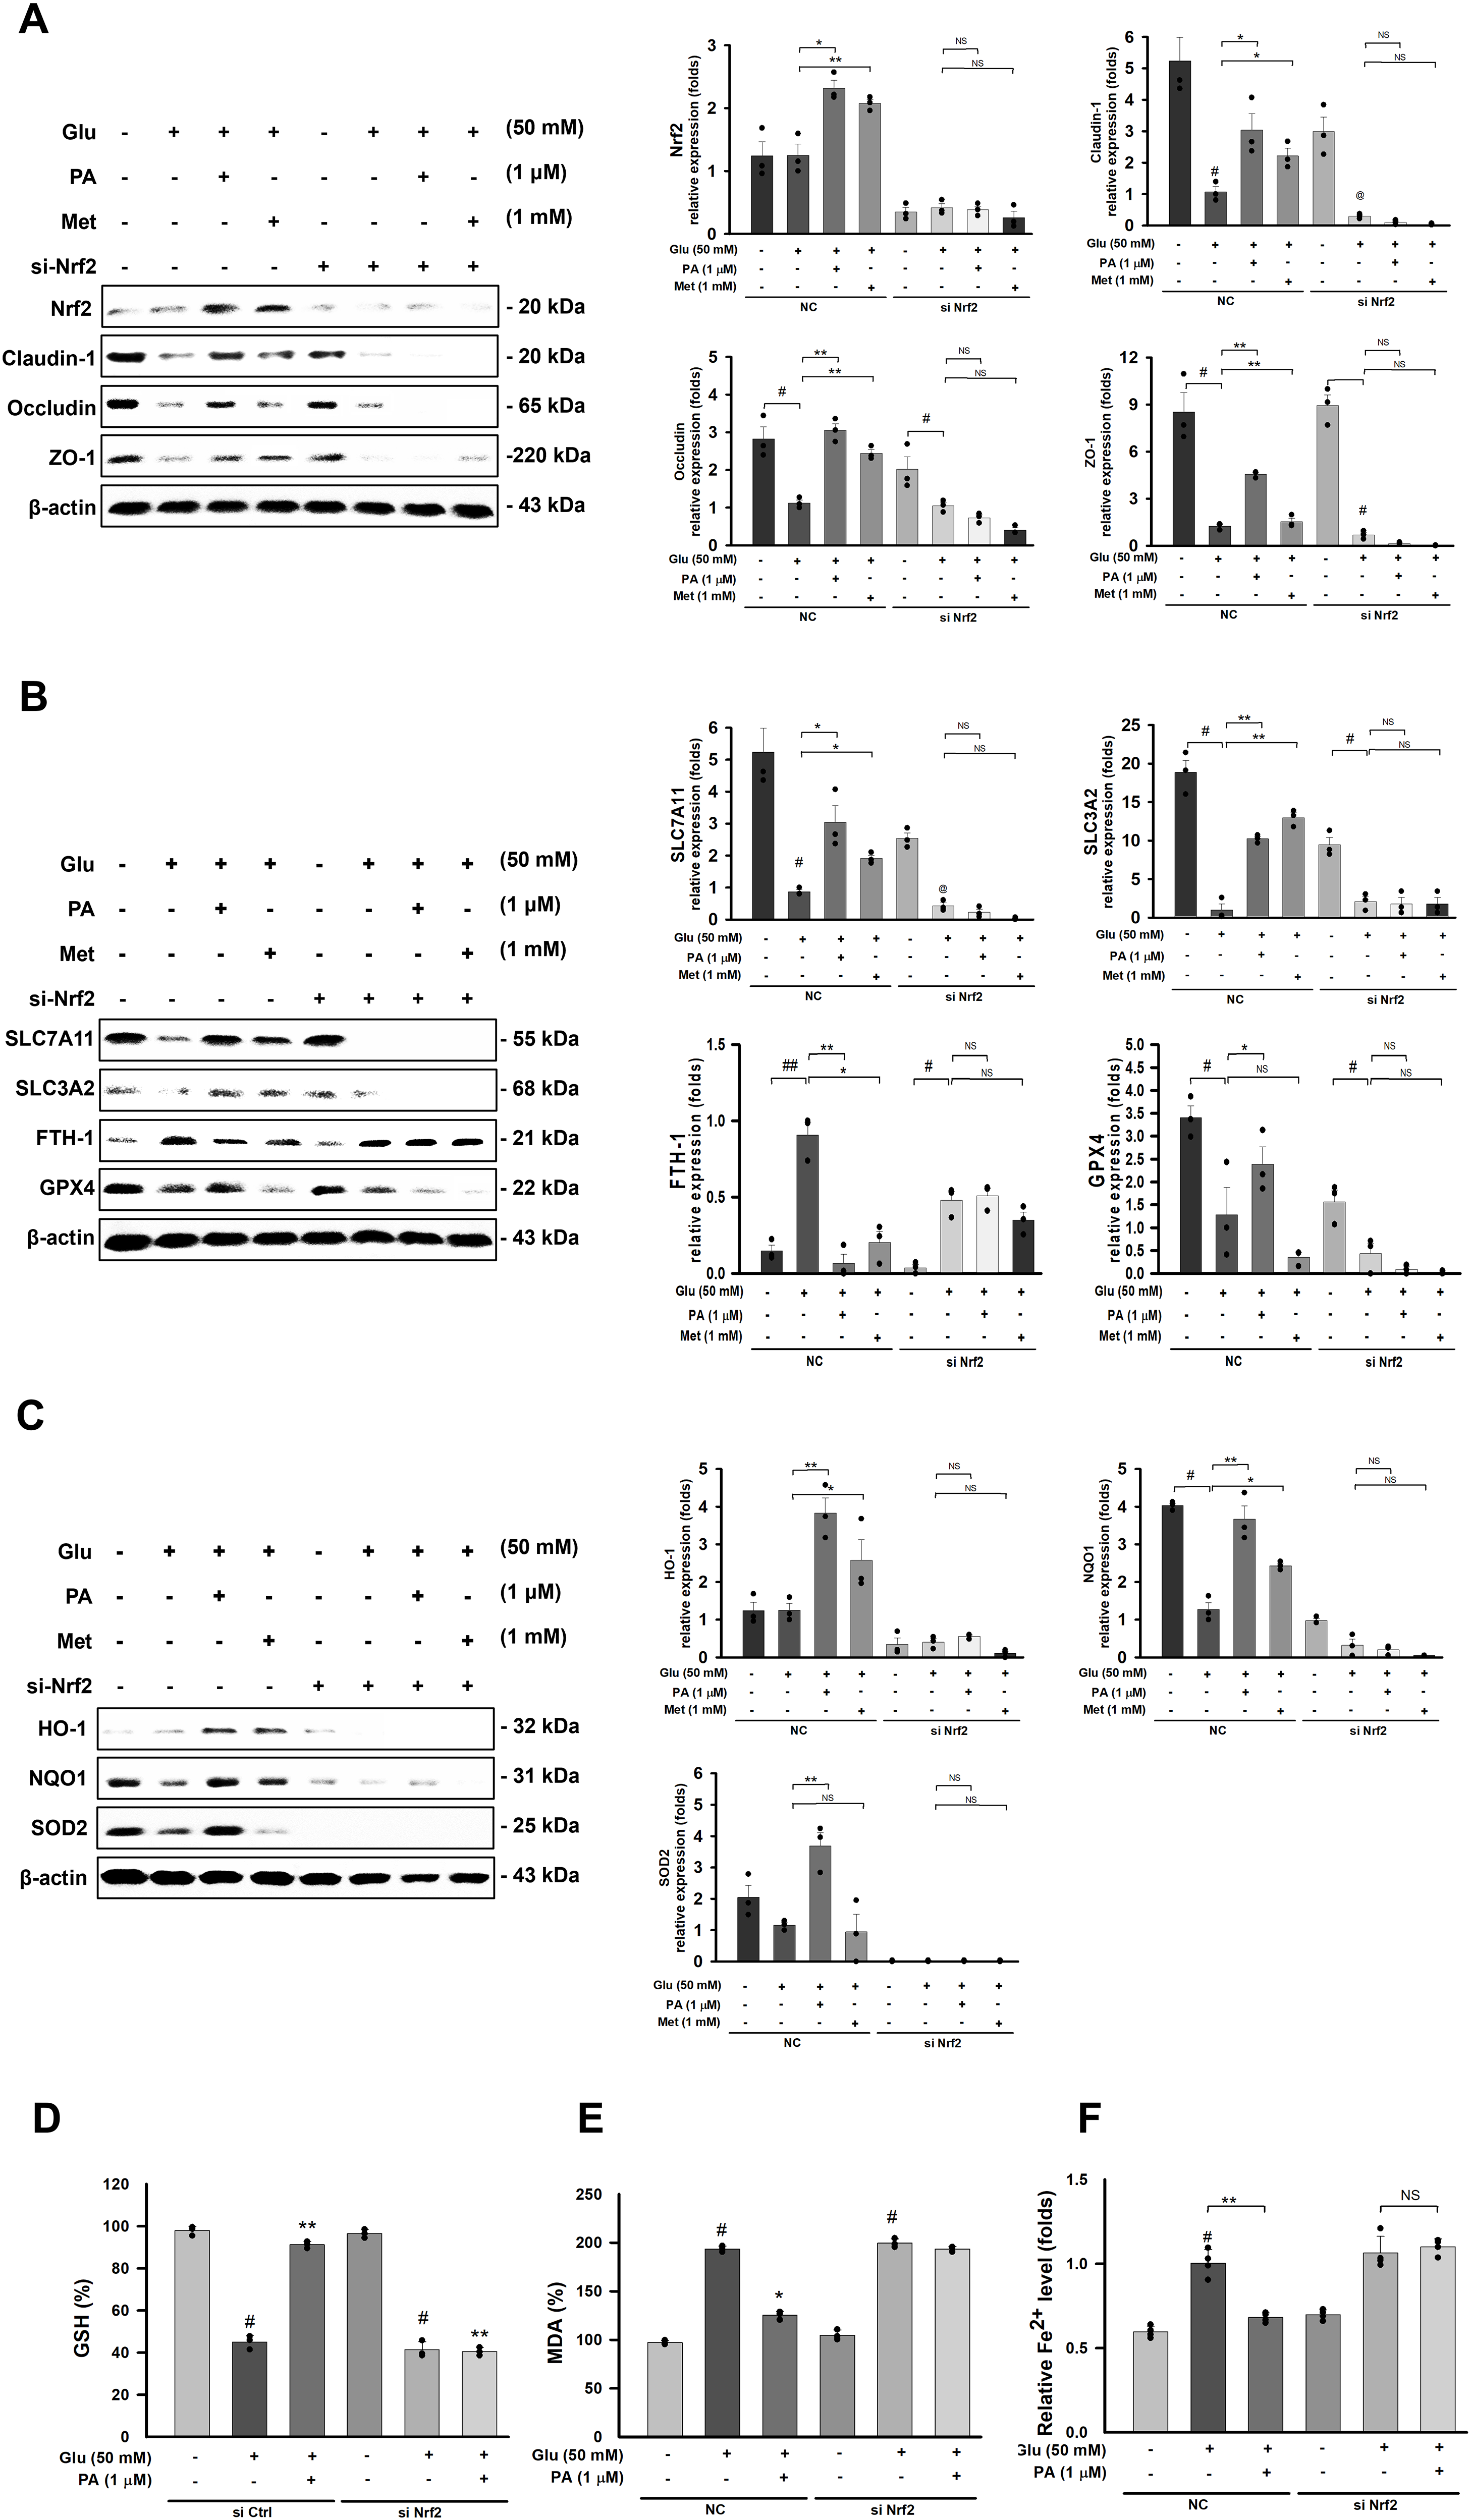
This Nrf2-dependent mechanism was further validated by Nrf2 knockdown experiments. Following Nrf2 silencing, the protective effect of PA on tight junction integrity was abolished (Fig. 8A), and its anti-ferroptosis effects were similarly lost (Fig. 8B, and F). Moreover, the antioxidant effects mediated by Nrf2 (Fig. 8C-D) and the suppression of lipid peroxidation (Fig. 8E) were also attenuated. Collectively, these results indicate that PA exerts its protective effects through the Nrf2 pathway.
Discussion
DR remains a leading cause of blindness and is characterized by progressive breakdown of the blood–retinal barrier and dysfunction of the retinal pigment epithelium (Frey and Antonetti, 2011; Naylor et al., 2019). Chronic hyperglycemia-induced oxidative stress is a central driving force in this pathology (Frey and Antonetti, 2011; Liou, 2010), triggering inflammation and a cascade of cell death pathways. Recent attention has focused on ferroptosis, an iron-dependent, lipid peroxidation-driven form of regulated cell death, as a key effector linking metabolic stress to retinal damage (Chen et al., 2024; Li et al., 2024; Liu et al., 2024; Ouyang et al., 2023). In DR models, hyperglycemia perturbs iron handling and antioxidant defenses, lowering GSH and GPX4 activity while elevating labile Fe2+ and peroxidized lipids; such changes correlate with microvascular leakage and RPE dysfunction (Li et al., 2024; Liu et al., 2024). Conversely, inhibiting ferroptosis can mitigate retinal vascular leakage and structural injury (Liu et al., 2024; Ouyang et al., 2023), underscoring that ferroptosis is not merely a bystander but a tractable driver of oxidative damage in the diabetic retina (Li et al., 2024; Liu et al., 2024; Ouyang et al., 2023). In this setting, cytoprotection hinges on the Nrf2 pathway, which boosts antioxidant capacity, replenishes thiol buffers, and transcriptionally upregulates the SLC7A11/GPX4 anti-ferroptosis axis (He et al., 2023). Indeed, under high-glucose stress, retinal cells show coordinated suppression of SLC7A11 and GPX4 alongside redox collapse; restoring Nrf2 reverses these molecular signatures and curtails lipid peroxidation (He et al., 2023; Wang et al., 2025). Activation of Nrf2 is therefore a rational upstream strategy to preserve the outer BRB by simultaneously normalizing redox homeostasis and raising the threshold for ferroptosis execution (He et al., 2023).
In the present study, we provide compelling evidence that PA protects against HG induced RPE injury in vitro and diabetic retinal damage in vivo. Notably, PA restored redox balance and preserved BRB integrity not merely by direct free-radical scavenging, but by acting as a specific Nrf2 activator and ferroptosis inhibitor. PA treatment maintained RPE tight junctions and cell viability under HG stress, prevented lipid peroxidation (malondialdehyde accumulation), and normalized GSH levels and ferroptosis markers (SLC7A11, SLC3A2, GPX4, and Fe2+). These cytoprotective effects were abolished by Nrf2 silencing, confirming Nrf2 is indispensable for the benefits of PA. Collectively, our findings identify PA as a dual-action modulator that links Nrf2-dependent antioxidant/ferroptosis resistance to stabilization of the outer BRB. This represents a novel mechanism for protecting the diabetic retina, positioning PA as a promising therapy to target the interconnected pathways of oxidative stress, ferroptosis, and barrier dysfunction.
Previous studies have reported conflicting roles of mitogen-activated protein kinase (MAPK) signaling pathways, particularly p38 and ERK, in the regulation of Nrf2. While some evidence suggests that phosphorylation of p38 and ERK facilitates Nrf2 activation (Zipper and Mulcahy, 2000), other studies indicate that aberrant hyperactivation of these kinases under pathological conditions, such as hyperglycemia or oxidative stress, can negatively regulate Nrf2 by promoting its nuclear export or degradation (Jiang et al., 2022; Keum et al., 2006; Tan et al., 2011; Tian et al., 2014). Our results align with the latter mechanism. We observed that high glucose stimulation induced a significant hyperphosphorylation of p38 and ERK, which coincided with the upregulation of KEAP1 and the suppression of Nrf2 activity. This aberrant activation of MAPKs likely serves as a stress signal that facilitates Nrf2-KEAP1 interaction and subsequent proteasomal degradation, thereby impairing the cellular antioxidant defense (Kobayashi et al., 2004; Zhu et al., 2006). Notably, treatment with PA significantly inhibited the hyperphosphorylation of p38 and ERK, while concurrently downregulating KEAP1 and restoring Nrf2 levels. This suggests that PA does not directly activate MAPKs to stimulate Nrf2; instead, it exerts its protective effects by dampening the stress-induced overactivation of p38/ERK signaling. By alleviating this negative regulation, PA likely disrupts the Nrf2-KEAP1 complex or prevents Nrf2 degradation, thereby re-establishing Nrf2 nuclear accumulation and transcriptional activity (Jiang et al., 2022). This mechanism of “inhibiting stress kinases to restore Nrf2” provides a plausible explanation for the potent anti-ferroptosis and cytoprotective effects of PA observed in our study. The net result is restoration of Nrf2 activity and transcription of antioxidant genes. This dual upstream mechanism—inhibiting stress MAPKs while targeting KEAP1 – provides a coherent explanation for potent activation of Nrf2 by PA in a high-glucose environment. Notably, the specificity of this Nrf2-dependent mechanism was confirmed using pharmacological probes. The protective effects of PA were non-additive with sulforaphane, a known Nrf2 activator, suggesting they share a common Nrf2 pathway. In contrast, benefits of PA were largely abolished by the Nrf2 inhibitor ML-385 or by Nrf2 siRNA, demonstrating that Nrf2 is indispensable for cytoprotection ability of PA. These epistasis experiments firmly establish that PA operates via Nrf2 (rather than parallel pathways), effectively lifting the MAPK/KEAP1 “brake” on Nrf2 to unleash an endogenous antioxidant program.
Beyond general antioxidative effects, our study positions PA as a potent inhibitor of ferroptosis, a distinct form of cell death characterized by iron-dependent lipid peroxidation (Chen et al., 2024; Li et al., 2024). The biochemical composition of retina is that rich in polyunsaturated fatty acids and high oxygen consumption, which renders it particularly susceptible to ferroptosis damage (Huang et al., 2025; Li et al., 2024). In our models, high-glucose exposure led to depletion of the cystine/glutamate antiporter System Xc− (SLC7A11) and the lipid-peroxide repair enzyme GPX4, alongside aberrant elevation of FTH-1. These changes indicate a disruption of iron metabolism and antioxidant defense consistent with ferroptosis activation (He et al., 2023; Li et al., 2024; Wang et al., 2025). Notably, similar suppressions of SLC7A11 and GPX4 have been observed in diabetic retinal tissues with concurrent redox collapse (He et al., 2023; Li et al., 2024). By re-engaging Nrf2, PA upregulated SLC7A11 and GPX4, which are critical determinants of ferroptosis resistance (Anandhan et al., 2020; Ye et al., 2014). Nrf2 is known to directly or indirectly control these genes, thereby coordinating iron, lipid, and thiol metabolism to prevent ferroptotic cell death (Anandhan et al., 2020; Nakagami, 2016; Ye et al., 2014). The restoration of the SLC7A11/GPX4 axis by PA provides a mechanistic basis for the reduction in lipid peroxidation (MDA levels) and protection from ferroptosis observed in our experiments.
To validate the specific anti-ferroptosis action of PA, we employed complementary pharmacological modulators. RSL-3, a direct GPX4 inhibitor, was used to challenge the PA-mediated protective pathway. Co-treatment PA with RSL-3 effectively abrogated the rescue of SLC7A11 and SLC3A2, reducing their levels back to those of HG-only cells, and nullified the prevention of lipid ROS accumulation. This antagonism strongly suggests that the protective efficacy of PA relies on maintaining GPX4 activity and the cystine import pathway, i.e., counteracting the ferroptosis cascade (Liu et al., 2024). Conversely, when PA was compared with the canonical ferroptosis inhibitor ferrostatin-1, both agents showed comparable efficacy in restoring ferroptosis markers and reducing FTH-1 accumulation. Moreover, the combination of PA and ferrostatin-1 did not yield additive benefits beyond Fer-1 alone. This lack of additivity implies that PA and ferrostatin-1 were likely to act on overlapping pathways (both ultimately preventing lipid peroxidation), further supporting the notion that PA specifically targets the ferroptosis machinery. Together, these findings establish PA not just as a general antioxidant, but as a targeted modulator of ferroptosis—primarily through Nrf2-driven upregulation of SLC7A11 and GPX4 that raises the cellular threshold for lipid peroxidation-mediated damage (Anandhan et al., 2020).
The mitochondrial protection of PA appears pivotal in its anti-ferroptosis action. Under high-glucose stress, RPE cells typically exhibit marked mitochondrial fragmentation and downregulation of fusion/biogenesis genes like MFN-1 and FIS-1 (Aloysius Dhivya et al., 2022). PA treatment reversed these changes, as evidenced by preserved cristae ultrastructure and restored expression of mitochondrial dynamics regulators (FIS-1, MFN-1, OPA1, DRP1) and the biogenesis marker FUNDC1 (Kaarniranta et al., 2018). By rebalancing fission–fusion signals, PA likely prevents the bioenergetic collapse associated with diabetic stress. This mitochondrial rescue has direct relevance to ferroptosis: mitochondria are major sources of ROS that drive lipid peroxidation (Li et al., 2023a), and loss of mitochondrial iron sequestration (for instance via ferritin degradation) triggers iron overload that fuels ferroptosis damage (Li et al., 2023a). Conversely, sustaining mitochondrial integrity raises resistance to ferroptosis—for example, preventing mitochondrial iron overload or excessive ROS (e.g., by overexpressing mitochondrial ferritin or catalase) markedly blunted ferroptosis cell death under oxidative stress (Chen et al., 2023). Thus, the ability of PA to normalize mitochondrial morphology and gene expression under hyperglycemia may interrupt the ROS-iron feedforward loop of ferroptosis, further reinforcing RPE resilience.
Translating our in vitro findings to an animal model, we demonstrated that PA administration confers significant retinal protection in diabetic mice. In db/db mice, a well-known type 2 diabetes model that develops retinal edema, vascular pathology, and Müller glial activation (Azrad-Leibovich et al., 2022; Bora et al., 2023; Lai and Lo, 2013), PA treatment substantially preserved retinal structure and vascular integrity. PA-treated diabetic mice showed striking preservation of total retinal thickness compared to untreated diabetics, indicating prevention of neuroretinal atrophy. At the microvascular level, PA protected the outer BRB: Evans blue dye leakage assays revealed that PA significantly reduced retinal vascular permeability, aligning with preservation of tight junction function (Yao et al., 2018). Immunostaining for endothelial marker CD31 demonstrated that diabetes-induced loss of capillary density and endothelial integrity was largely prevented by PA therapy, confirming its ability to maintain retinal vasculature. Similarly, PA restored the expression and localization of RPE tight junction proteins (occludin, ZO-1, and claudin-1) in diabetic mice, re-establishing a continuous junctional belt at the outer BRB. Together, these in vivo outcomes provide strong evidence that PA stabilizes the BRB under diabetic conditions—an effect reflected both in molecular markers and functional leakage assays. Notably, our observations are consistent with prior reports that strengthening the RPE barrier can protect retinal neurons and prevent edema in DR models (Dujardin et al., 2024; Zhou et al., 2025).
Crucially, we also evaluated the systemic safety of chronic PA treatment, given concerns that constitutive Nrf2 hyperactivation might in some contexts produce “reductive stress” or other side effects (Lappalainen et al., 2010). Reassuringly, PA exhibited a favorable safety profile in major organs. Histological and biochemical analyses of the liver and kidneys from PA-treated diabetic mice revealed no signs of toxicity or off-target injury. On the contrary, PA reduced fibrosis markers (e.g., collagen-I, α-alpha-smooth muscle actin (SMA)) that were elevated in diabetic control mice, suggesting an attenuation of diabetes-related tissue fibrosis. This finding aligns with evidence that enhancing Nrf2 can mitigate fibrogenic changes in metabolic disease models (Zhang et al., 2021). Indeed, an analogous withanolide compound, Physalin B, was recently shown to ameliorate experimental steatohepatitis by improving oxidative stress and inhibiting fibrotic progression via Nrf2 activation (Zhang et al., 2021). Additionally, we observed that PA-treated mice had Nrf2 levels in liver and kidney restored toward the physiological baseline of non-diabetic controls, rather than excessively above normal. This indicates that PA modulates Nrf2 within a therapeutic window—enough to counteract hyperglycemic oxidative stress and inflammation, but not to a degree that causes aberrant reductive stress or organ dysfunction. These safety data are pivotal for considering PA as a viable long-term therapy for diabetes complications, as they suggest that its underlying mechanism maintains a balance between therapeutic efficacy and physiological regulation of the Nrf2 pathway. Another noteworthy observation was that PA-treated diabetic mice displayed milder fluctuations in blood glucose levels over time. While our study was not explicitly designed to investigate glycemic control, the PA group showed a modest stabilization of blood glucose (and a trend toward lower HbA1c) relative to untreated diabetics. Chronic oxidative stress and mitochondrial dysfunction are known to worsen systemic metabolism in diabetes, creating a vicious cycle. By improving mitochondrial efficiency and reducing oxidative burden, PA may indirectly contribute to better glycemic stability, even without directly targeting insulin or blood sugar pathways. The persistence of retinal benefits despite ongoing hyperglycemia is reminiscent of the “metabolic memory” phenomenon, wherein past exposure to high glucose causes lasting damage that is not easily reversed by late glycemic control (Kowluru and Alka, 2023). Our findings suggest that intervening at the level of redox and mitochondrial homeostasis can override some aspects of this metabolic memory, providing tissue protection independent of absolute glycemic control. This underscores the therapeutic value of targeting redox/mitochondrial dysfunction directly in DR (Xiong et al., 2023) – an approach that could complement standard glucose-lowering strategies and yield sustained retinal benefits.
Positioning PA within the broader landscape of cytoprotective therapies, our results resonate with previous studies on indirect antioxidants like sulforaphane and curcumin. These nutraceutical Nrf2 activators have shown the ability to quell inflammation, activate the antioxidant response, and protect retinal cells in diabetic or oxidative stress models (Bucolo et al., 2019; Qi et al., 2022; Yamagishi and Matsui, 2016; Zhang et al., 2024). For instance, sulforaphane activates Nrf2 and has demonstrated vascular protective effects in diabetic animals (Yamagishi and Matsui, 2016), and curcumin analogues prevented high-glucose damage in RPE via ERK1/2-mediated Nrf2/HO-1 activation (Bucolo et al., 2019). Sulforaphane was also found to preserve photoreceptor function in oxidatively stressed middle-aged mice through an Nrf2-dependent mechanism (Qi et al., 2022), and a recent review highlights sulforaphane’s potential in various ophthalmical diseases via Nrf2 modulation (Zhang et al., 2024). The convergence of the underlying mechanism with those of sulforaphane and curcumin reinforces the concept that enhancing endogenous defense systems represents a promising strategy against DR. Moreover, withanolide scaffolds like PA may constitute a particularly potent class of indirect antioxidants. In this regard, it is notable that another withanolide, withaferin A, was reported to attenuate retinal ischemia–reperfusion injury by reducing oxidative damage (partly via Akt and Nrf2 signaling) (Yan et al., 2022). The efficacy of withaferin A in an acute retinal stress model suggests a broader class effect of withanolides in protecting retinal cells. Our work extends this concept to chronic diabetic stress, indicating that physalins and related compounds merit further exploration as multifunctional protectants in ocular disease.
While our study provides strong mechanistic evidence for the protective role of PA in DR, several limitations should be noted. First, we focused on structural and molecular endpoints but did not directly assess functional visual outcomes (such as electroretinography or visual acuity). Future studies will need to correlate the molecular and histological improvements reported here with actual visual function in diabetic models (Lai and Lo, 2013). Second, our in vitro and mouse models, though capturing key features of DR, do not fully recapitulate the chronic and multifactorial nature of human disease. In particular, the interplay of RPE with other retinal cells (photoreceptors, Müller glia, microglia) and the contributions of systemic factors (e.g., dyslipidemia) were not addressed. Recent studies have highlighted that Nrf2 activation may exhibit dual roles in inflammation depending on context and duration. While transient Nrf2 activation generally confers protection, chronic or excessive upregulation has been linked to reductive stress and impaired protein turnover, particularly in the heart and vasculature (Rajasekaran et al., 2011; Schäfer et al., 2014; Zhang et al., 2012). Notably, sustained Nrf2/ARE signaling was shown to exacerbate proteotoxicity in a cardiomyopathy model (Rajasekaran et al., 2011). Although our results indicate a protective role of PA-induced Nrf2 activation in the diabetic retina, we acknowledge that long-term modulation of redox balance may have tissue-specific consequences. This underscores the need for dose and timing optimization in translational development and warrants further studies on potential redox imbalance under prolonged exposure. More complex experimental systems such as organotypic retinal cultures, outer BRB organoids, or diabetic primate models would help validate efficacy of PA in a setting that mimics the human retinal microenvironment (Dujardin et al., 2024). These additions would strengthen the translational relevance of our findings.
In conclusion, this study suggests that PA is a promising candidate for further preclinical evaluation in diabetic retinopathy. We delineate a mechanism whereby PA mitigates high-glucose retinal injury by inhibiting aberrant p38/ERK MAPK activation, thereby releasing Nrf2 from KEAP1-mediated suppression and activating the antioxidant response. This Nrf2-driven pathway, in turn, upregulates the System Xc−/GPX4 axis, blocking ferroptosis cell death and preserving the integrity of the outer BRB. By reinforcing tight junctions, suppressing lipid peroxidation, and supporting mitochondrial health, PA addresses several convergent pathways of DR pathology. Supported by robust in vivo efficacy and a favorable safety profile, PA represents a promising disease-modifying approach for early DR. Our findings also highlight the broader potential of targeting the Nrf2–ferroptosis axis in diabetic complications: therapies that restore redox balance and ferroptosis resistance may help protect not only the retina but other organs prone to diabetes-induced oxidative damage (Xiong et al., 2023). Taken together, this work positions PA and related withanolides as attractive adjuncts to current DR treatments, aimed at fortifying the neurovascular unit against the oxidative and ferroptotic stresses that drive diabetic vision loss.
Methods and Materials
Materials
Anti-claudin1 (ab307692), anti-ZO1 (ab307799), anti-SLC7A11 (ab307601), anti-SLC3A2 (ab307587 & ab303510), anti-FTH-1 (ab75973), anti-GPX4 (ab125066), anti-Nrf2 (ab313825), anti-HO-1(ab189491), anti-glutamate-cysteine ligase catalytic subunit (GCLC) (ab190685), anti-fibronectin (ab199056), anti-SLC22A2 (ab230629) Hematoxylin and eosin (H&E) Staining Kit (ab245880), DAPI (ab104139), Glutathione Assay Kit (ab65322) and Lipid Peroxidation (MDA) Assay Kit (ab233471) were purchased from Abcam (Cambridge, UK). Anti-occludin (91131), anti-KEAP1, anti-p-Erk (4370), anti-Erk (4695), anti-p-p38 (4511), anti-p38 (9212), anti-alpha-Smooth Muscle Actin (19245), anti-SOD2 (13141) anti-cleaved Caspase 3 (9661) and HRP-linked Antibody (7074 & 7076) were purchased from Cell Signaling Technology (Danvers, USA). Anti-NQO1 (MA1-16672), anti-p-Nrf2 (PA5-67520) Alexa Fluor 488-Secondary Antibody (A-11008, A-11001), SYBR Green Master Mix (A46012), Cell Ferrous Iron Colorimetric Assay Kit (EEA008), and Lipofectamine 3000 (L3000001) were obtained from Invitrogen (Waltham, Massachusetts, USA). Cell Counting Kit-8 (96992), D-(+)-Glucose (G8270), Metformin (1396309), Evans Blue Dye content (E2129), formamide (F9037), Lead (II) citrate tribasic trihydrate (15326), LR White Resin (L9774), Osmium tetroxide (251755) and D-mannitol (M4125) were purchased from Sigma-Aldrich (St. Louis, Missouri, USA). Anti-β-Actin (sc-81178), anti-collagen I (sc-59772), anti-Parkin (sc-32282), anti-PINK1 (sc-517353), anti-Bax (sc-7480), anti-Bak (sc-518146), anti-tBid (sc-514622) were purchased from Santa Cruz Biotechnology (Dallas, Texas, USA). Dulbecco’s Modified Eagle Medium (31600034) was purchased from Gibco (Waltham, Massachusetts, USA). QIAGEN Genomic-tip 20/G (10223) was obtained from QIAGEN (Hilden, Germany). Nrf2 (NFE2L2) Human siRNA Oligo Duplex (SR321100) was purchased from Origene (Rockville, Maryland). ECL reagents were obtained from PerkinElmer (Waltham, Massachusetts, USA). High-Capacity cDNA Reverse Transcription Kit (4368814) was purchased from Applied Biosystems (Waltham, Massachusetts, USA). 4% Uranyl Acetate Solution (22400-4) was purchased from Electron Microscopy Sciences (Hatfield, Pennsylvania, USA). PA (HY-N9942) was obtained from Medchemexpress (Monmouth Junction, New Jersey, USA).
Cell culture and drug treatment
Human primary retinal pigment epithelial (hRPE) cells (purchased from Applied Biological Materials Inc., Catalog No T4057) were cultured in DMEM/F12 medium supplemented with 10% fetal bovine serum and 1% penicillin-streptomycin at 37°C with 5% CO2. Medium was refreshed every 2–3 days, and hRPE cells were maintained below passage 5 to prevent dedifferentiation. To mimic diabetic conditions, hRPE cells were exposed to 50 mM D-(+)-glucose for 48 h. One hour prior to high glucose (HG) treatment, cells received one of the following: PA (0.25, 0.5, 1, or 2 µM), 1 mM Metformin, or Dulbecco’s modified Eagle’s medium (DMEM) containing 5.5 mM glucose as a control. To eliminate the impact of osmotic pressure, Mannitol was used to equalize the osmotic pressure of all media. Quality control included routine mycoplasma testing (One-Step Mycoplasma PCR Detection Kit, Sigma-Aldrich, Catalog No MP0050), immunofluorescence staining for RPE-specific markers (RPE65, CRALBP, ZO-1), and weekly contamination checks.
Cell viability
hRPE cells were seeded in 96 well plates (5 × 10³ cells/well) and co-cultured with PA and HG for 48 h. Then, 10 µL of Cell Counting Kit-8 (CCK-8) reagent was added to each well, followed by incubation at 37°C for 1 hour. The absorbance at 450 nm was measured using an enzyme-linked immunosorbent assay (ELISA) reader, and cell viability was calculated accordingly.
DM Mouse model reproduction and treatment
A total of 24 eight-week-old male C57BLKS/J Iar −+Leprdb/+Leprdb mice and 6 eight-week-old male C57BLKS/J wild type mice were obtained from the National Laboratory Animal Center (Taipei, Taiwan). All animals were housed at the China Medical University Animal Center under standard laboratory conditions, with a 12 hour light/dark cycle and temperature-controlled environments (21°C ± 2°C) and were provided with food and water ad libitum access to water and chow. Animals were monitored daily for general health, weight, grooming, and mobility. Humane endpoints followed institutional IACUC guidelines. Animals were randomly allocated into experimental groups using a computer-generated sequence. Outcome assessment was performed by investigators blinded to treatment allocation. Sample size was determined based on power analysis (power = 0.8, α = 0.05) using preliminary BRB leakage data to detect a 25% difference between groups. Male C57BLKS/J Iar −+Leprdb/+Leprdb mice were randomly divided into four groups (n = 6 per group) and were administered (ig) with saline (5 mL/kg body weight, control), PA (5 mg/kg body weight), PA (10 mg/kg body weight), or Metformin (140 mg/kg body weight) daily. Wild type male C57BLKS/J mice received saline as a non-diabetic or normal control. PA and Metformin dosages were designed based on previous studies (Lin et al., 2020; Rooney et al., 2015). Treatments lasted for 20 weeks, with weekly measurements of body weight and blood glucose levels. Mice were subsequently anesthetized and sacrificed. No animals were excluded unless they exhibited unrelated health issues. Exclusion criteria were predefined, including severe non-diabetic conditions or injection-related injury. Investigators performing imaging, histology, and quantification were blinded to treatment conditions. This study adhered to the guidelines of the National Institutes of Health and ARRIVE guidelines 2.0 for the care and use of laboratory animals. The experimental protocol was approved by the Institutional Animal Care and Use Committee of China Medical University, Taichung, Taiwan (Approval No: CMUIACUC-2024-159-1).
Histological analysis
Retinal tissues were fixed in Davidson’s fixative for over 24 h, embedded in paraffin, and sectioned at 5 µm thickness. H&E staining was performed following standard protocols. Sections were imaged using an inverted phase contrast microscope (Olympus IX73), and at least 4 random non-overlapping fields per section were analyzed under 400 × magnification. Three to five sections were evaluated per animal. All image acquisition and quantitative analyses were conducted by investigators blinded to group assignments. Quantification of retinal thickness and structural integrity was performed using ImageJ software (NIH, Bethesda, MD, USA).
Western blot analysis
Cell and retina samples, which have been collected, were denatured with Laemmli buffer on ice. Equal amounts of denatured samples were electrophoretically separated by 10% SDS-PAGE and transferred to PVDF membranes. The membranes were then blocked with 5% non-fat milk for 30 min. Primary antibodies were incubated with the membranes overnight at 4°C. Subsequently, the membranes were incubated with horseradish peroxidase-conjugated secondary antibodies (1:5000) for 1 hour. After incubation, the membranes were washed three times. The dilution range we used in this study is listed in Table 1. Relative expression levels were quantified using ImageJ software.
List of Antibodies Applied in the Current Study
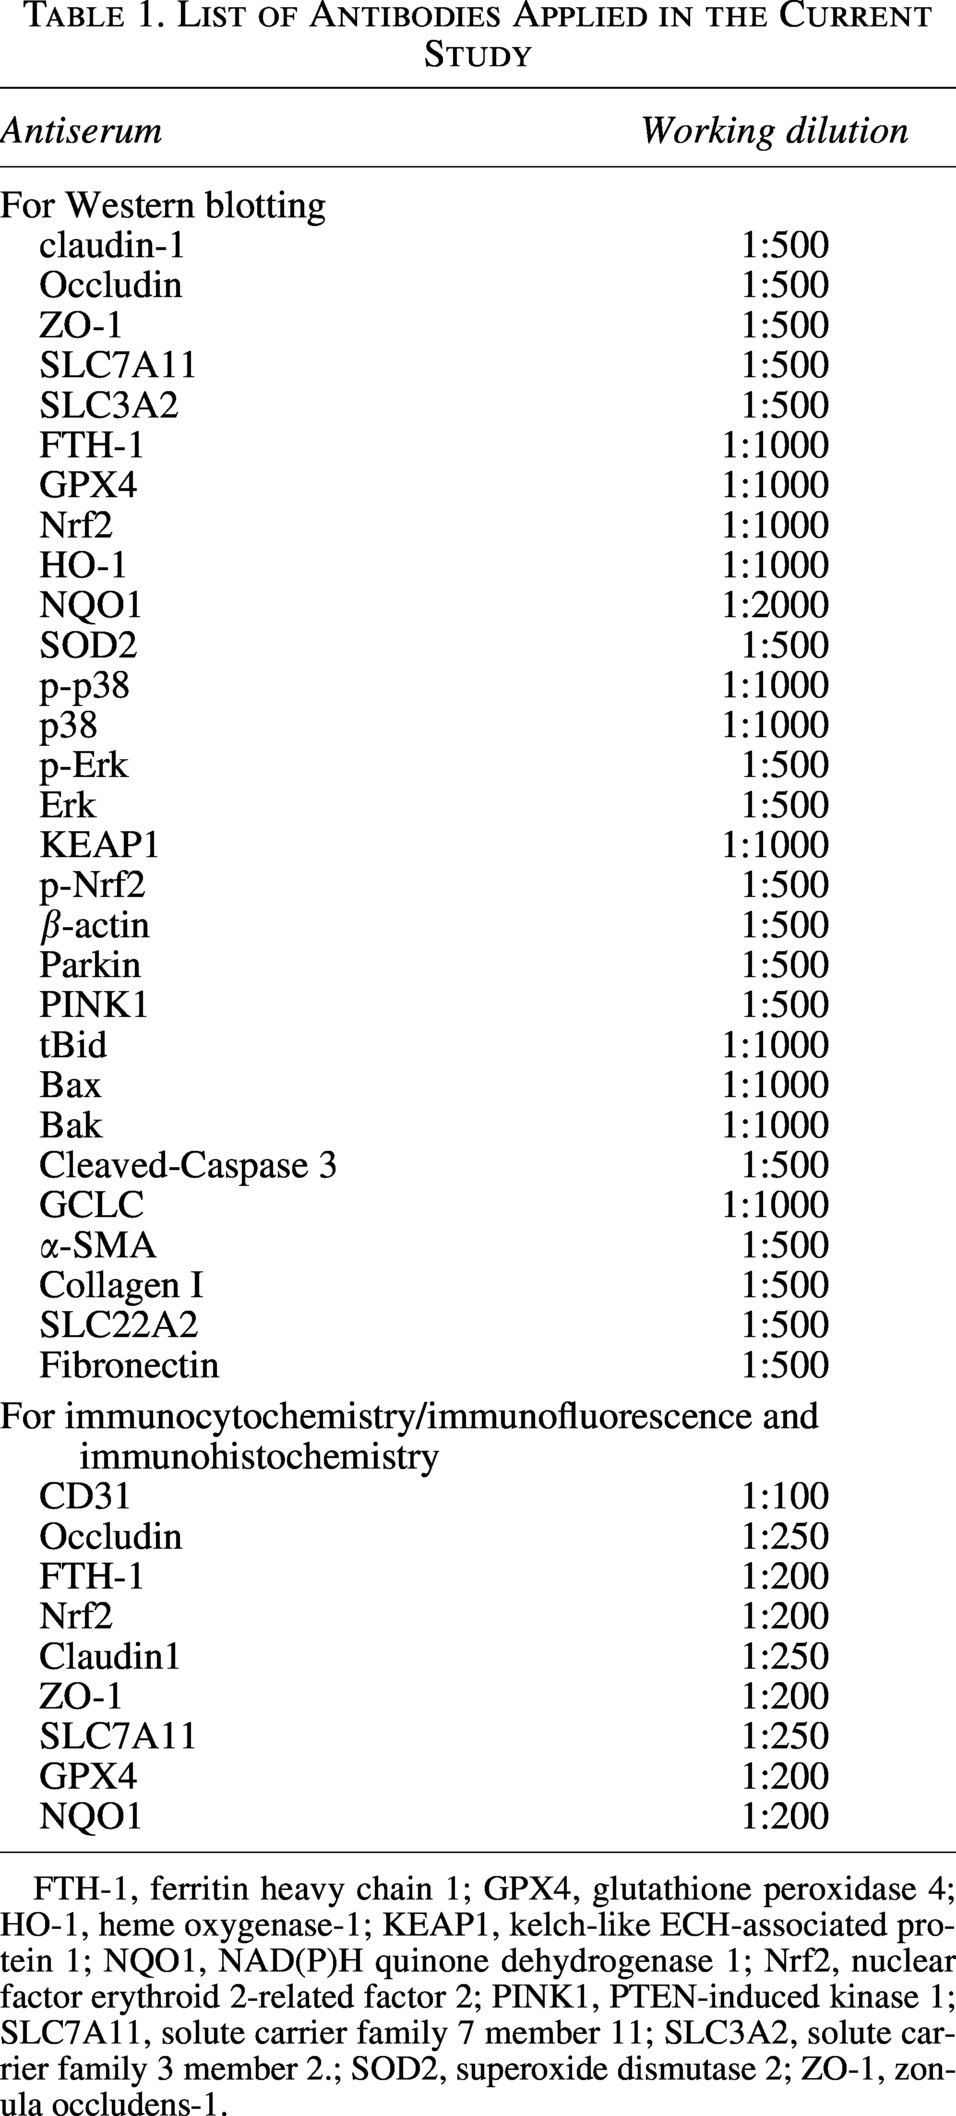
FTH-1, ferritin heavy chain 1; GPX4, glutathione peroxidase 4; HO-1, heme oxygenase-1; KEAP1, kelch-like ECH-associated protein 1; NQO1, NAD(P)H quinone dehydrogenase 1; Nrf2, nuclear factor erythroid 2-related factor 2; PINK1, PTEN-induced kinase 1; SLC7A11, solute carrier family 7 member 11; SLC3A2, solute carrier family 3 member 2.; SOD2, superoxide dismutase 2; ZO-1, zonula occludens-1.
Reverse transcription-quantitative PCR
RNA was extracted using an RNA isolation kit. Assessment of purity and concentration of the RNA was conducted on a NanoDrop spectrophotometer. The RNA was then reverse transcribed into cDNA using a High-Capacity cDNA Kit in a thermal cycler. SYBR Green reagent was used to visualize the amplification of cDNA in a StepOnePlus™ real-time PCR system (Applied Biosystems, USA). The primers used are listed in Table 2. The 2−ΔΔCt method was employed to calculate mRNA expression levels, with β-actin serving as the endogenous control.
Primer Sequence Used in qPCR System
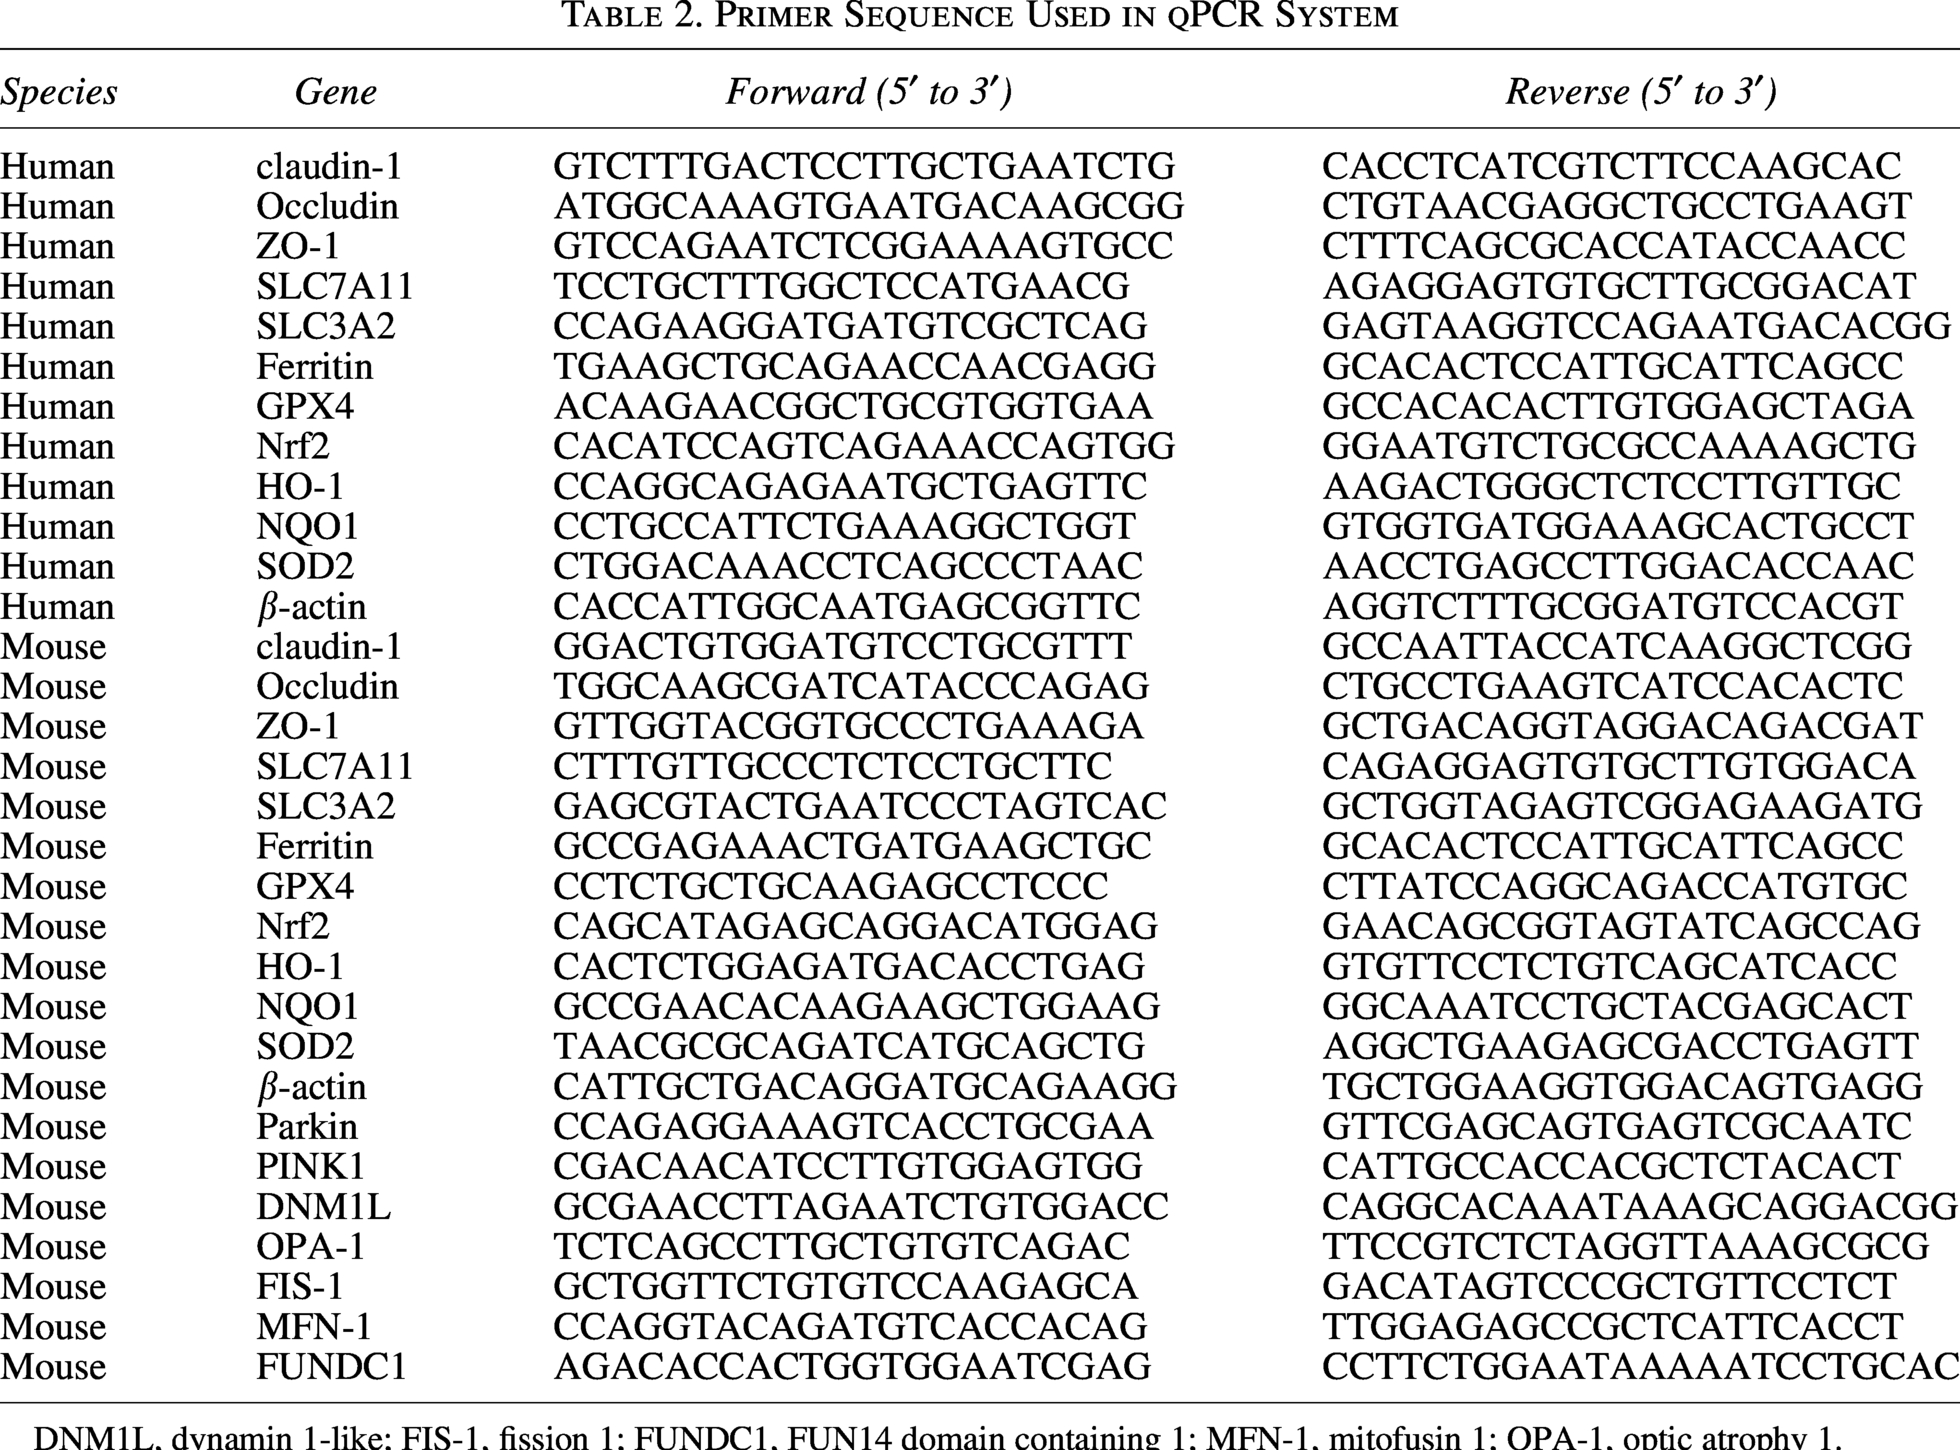
DNM1L, dynamin 1‐like; FIS‐1, fission 1; FUNDC1, FUN14 domain containing 1; MFN‐1, mitofusin 1; OPA‐1, optic atrophy 1.
Evans blue assay
Retinal vascular permeability was determined by measuring the leakage of Evans blue dye into the retinal vasculature. In brief, Evans blue (45 mg/kg) was administered via tail vein injection and allowed to circulate for 2 h. A tiny cannula was inserted into the left ventricle of the heart to perfuse the vasculature and clear excess dye. One eye from each mouse was used for Evans blue fluorescence detection, while the other eye was used for dye extraction. Retinas were fixed in 4% paraformaldehyde in PBS at room temperature for 30 min and then dried for 5 h. The retinas were incubated in formamide (0.2 mL per retina) at 78°C for 12 h to extract the Evans blue dye. The resulting suspension was centrifuged at 12,000 ×g for 45 min. Absorbance was measured at 620 and 740 nm (background) using an ELISA reader. Each sample was measured in triplicate, and the average was calculated. The amount of Evans blue dye was quantified based on a standard curve and normalized using the following formula:

GSH and MDA detection
Retinal tissue or cultured cells were homogenized in GSH lysis buffer and centrifuged to remove insoluble material. The supernatant was deproteinized using 1M perchloric acid (PCA) and neutralized with 2M KOH to achieve a final pH of 6.5–8.0. After centrifugation to remove precipitates, 100 µL of the sample or standards were incubated with 2 µL of GST enzyme mix and 2 µL of monochlorobimane probe at 37°C for 60 min. Fluorescence was measured at Ex/Em = 380/461 nm using a microplate reader. Glutathione concentrations were calculated based on a standard curve generated from serial dilutions of the GSH standard. For MDA measurement, commercial recipes and samples were sequentially mixed and vortexed thoroughly, then incubated at 95°C for 40 min. Samples were then cooled with water, centrifuged at 3000 RPM for 20 min, and the absorbance was measured at 532 nm.
Iron content analysis
The intracellular ferrous ion (Fe2+) content was measured using the Cell Ferrous Iron Colorimetric Assay Kit (Thermo Fisher Scientific, Cat# EEA008). Approximately 1 × 10⁶ cells were suspended in 0.9% NaCl, centrifuged at 300 g for 10 min at 4°C, and the supernatant was discarded. Lysis buffer was added at a 5:1 ratio (cell number: buffer volume, mL), followed by incubation on ice for 10 min and centrifugation at 15,000 g for 10 min. The supernatant was collected for analysis. Samples and iron standards (0–50 µmol/L) were added to a 96-well microplate (80 µL per well). Control groups received 80 µL of the control solution, while the experimental and standard groups received 80 µL of the chromogenic reagent. After incubation at 37°C for 10 min, absorbance was measured at 593 nm using an ELISA reader. The Fe2+ concentration was calculated based on the standard curve and corrected using the following formula:
This assay primarily detects cellular labile ferrous iron (Fe2+), which reflects the redox-active iron pool implicated in ferroptosis, rather than total intracellular iron content, as characterized by the manufacturer’s protocol.
RNA interference
hRPE cells were transfected with Nrf2 siRNA (Origene, Catalog No SR321100, sequence: 5′-AUUGAUGUUUCUGAUCUAUCACUTT-3′) by Lipofectamine 3000 (Invitrogen, Catalog No L3000001) for 72 h, followed by Western blot analysis with an anti-Nrf2 antibody (1:1000) to assess transfection efficiency.
Immunofluorescence staining
After drug treatment, hRPE cells were fixed with 4% paraformaldehyde or ice-cold methanol (for tight junction staining) at room temperature or −20°C for 20 min. Cells were permeabilized with 0.5% Triton X-100 for 10 min (omitted for methanol fixation) and blocked with 5% BSA for 2 h. Primary antibodies were applied and incubated overnight at 4°C. After PBS washing, cells were incubated with Alexa Fluor 488-conjugated secondary antibodies for 1 hour, followed by DAPI staining. The dilution range we used in this study was listed at Table 1.
Transmission electron microscopy
Mouse retinal tissues were harvested and immediately immersed in freshly prepared 4% paraformaldehyde at 4°C for overnight fixation. After primary fixation, the samples were post-fixed in 1% osmium tetroxide at room temperature for 1 hour in the dark. The tissues were then rinsed and stained with 2% uranyl acetate for 12 h. Dehydration was performed using a graded ethanol series (10%, 30%, 50%, 70%, 85%, 95%, and 100%) with 30-minute incubations at each step. The samples were infiltrated overnight at 4°C with a 1:1 mixture of LR White resin and absolute ethanol, followed by full infiltration in 100% LR White resin overnight at 4°C. Embedding was carried out in fresh LR White resin and polymerized at 65°C for 48 h. Ultrathin sections (∼70 nm) were cut using an ultramicrotome and mounted onto copper grids. Post-staining was performed with lead citrate and uranyl acetate for 5 min to enhance contrast. Sections were observed using a JEOL JEM-1400 Flash transmission electron microscope operated at 80–120 kV. Images were digitally acquired and uniformly processed for subsequent analysis.
Mitochondrial copy number analysis
Total DNA was extracted from mouse tissue samples using the Qiagen Genomic-tip 20/G kit, following the manufacturer’s instructions. DNA concentration was measured using PicoGreen dsDNA quantification reagent and diluted to 3 ng/µL. PCR reactions were performed by using a commercial DNA polymerase kit in a 50 µL reaction volume containing 24.5 µL nuclease-free water, 10 µL 5 × buffer, 1 µL BSA (0.1 mg/mL), 1 µL dNTPs (10 mM), 2.5 µL forward primer (10 µM), 2.5 µL reverse primer (10 µM), 3.5 µL MgCl2 (25 mM), 0.5 µL DNA polymerase, and 5 µL DNA template (15 ng). Specific primers for mouse mitochondrial DNA were used: forward 5′-CCCAGCTACTAC-CATCATTCAAGT-3′, reverse 5′-GATGGTTTGGGAGATTGGTTGATGT-3′, product length 117 bp. PCR conditions were: 94°C for 3 min, followed by 18 cycles of 94°C for 15 s, 60°C for 45 s, and 72°C for 45 s, with a final extension at 72°C for 10 min. PCR products were quantified using PicoGreen, and fluorescence intensity was measured (excitation: 480 nm, emission: 520 nm). To control for variation in total DNA input, mitochondrial DNA levels were normalized to nuclear DNA using a nuclear-encoded reference gene (18S rRNA) amplified in parallel reactions. Primers for the nuclear-encoded 18S rRNA gene (used for normalization) were: forward 5′-CGGCTACCACATCCAAGGAA-3′ and reverse 5′-GCTGGAATTACCGCGGCT-3′, generating a 187 bp product. Relative mtDNA copy number was calculated using the ratio of mtDNA to nDNA PCR product intensity. Relative mitochondrial DNA copy number was assessed by comparing fluorescence intensities.
Statistics
All experiments were performed in at least three independent biological replicates. Data are presented as the mean ± standard error of the mean unless otherwise specified. Statistical analyses were conducted using SigmaPlot version 15 (Systat Software Inc., USA). Student’s t-tests (two-tailed) were used to evaluate statistical differences between two groups. For comparisons involving more than two groups, analysis of variance was performed, followed by Tukey–Kramer post hoc tests to determine pairwise significance. A p value <0.05 was considered statistically significant.
Electronic notebook
Electronic laboratory notebook was not used.
Authors’ Contributions
Y.-R.X.: Conceptualization, data curation, formal analysis, investigation, methodology, project administration, validation, visualization, writing—original draft, writing—review and editing. Y.-W.H.: Conceptualization, data curation, formal analysis, investigation, methodology, project administration, validation, visualization, writing—original draft, writing—review and editing. W.-Y.L.: Data curation, formal analysis, investigation, methodology, validation, visualization, writing—review and editing. Y.-S.H.: Data curation, formal analysis, investigation, methodology, validation, visualization. W.-C.J.: Data curation, formal analysis, methodology, validation, visualization. P.-Y.P.: Data curation, formal analysis, methodology. Y.-H.K.: Formal analysis, resources. D.-Y.L.: Formal analysis. Y.-J.L.: Conceptualization, data curation, formal analysis, funding acquisition, investigation, methodology, project administration, resources, software, supervision, validation, visualization, writing—original draft, writing—review and editing. W.-T.H.: Conceptualization, data curation, formal analysis, funding acquisition, investigation, methodology, project administration, resources, software, supervision, validation, visualization, writing—original draft, writing—review and editing.
Footnotes
Acknowledgments
The authors express their gratitude to the Medical Research Core Facilities Center at China Medical University (Taichung, Taiwan) and the i-Center for Advanced Science and Technology at Chung Hsing University (Taichung, Taiwan) for providing access and technical support for confocal microscopy and transmission electron microscopy.
Data Availability Statement
Author Disclosure Statement
No competing financial interests exist
Funding Information
This work was supported by the National Science and Technology Council, Taiwan (NSTC 113-2320-B-039-029; NSTC 111-2813-C-039-161-B). This work is also supported by the Chinese Medicine Research Center, China Medical University, from the Featured Areas Research Center Program within the Higher Education Sprout Project by the Ministry of Education (MOE) in Taiwan (CMRC-CENTER-7).
Supplemental Material
Supplemental Material
Abbreviations Used
References
Supplementary Material
Please find the following supplemental material available below.
For Open Access articles published under a Creative Commons License, all supplemental material carries the same license as the article it is associated with.
For non-Open Access articles published, all supplemental material carries a non-exclusive license, and permission requests for re-use of supplemental material or any part of supplemental material shall be sent directly to the copyright owner as specified in the copyright notice associated with the article.