
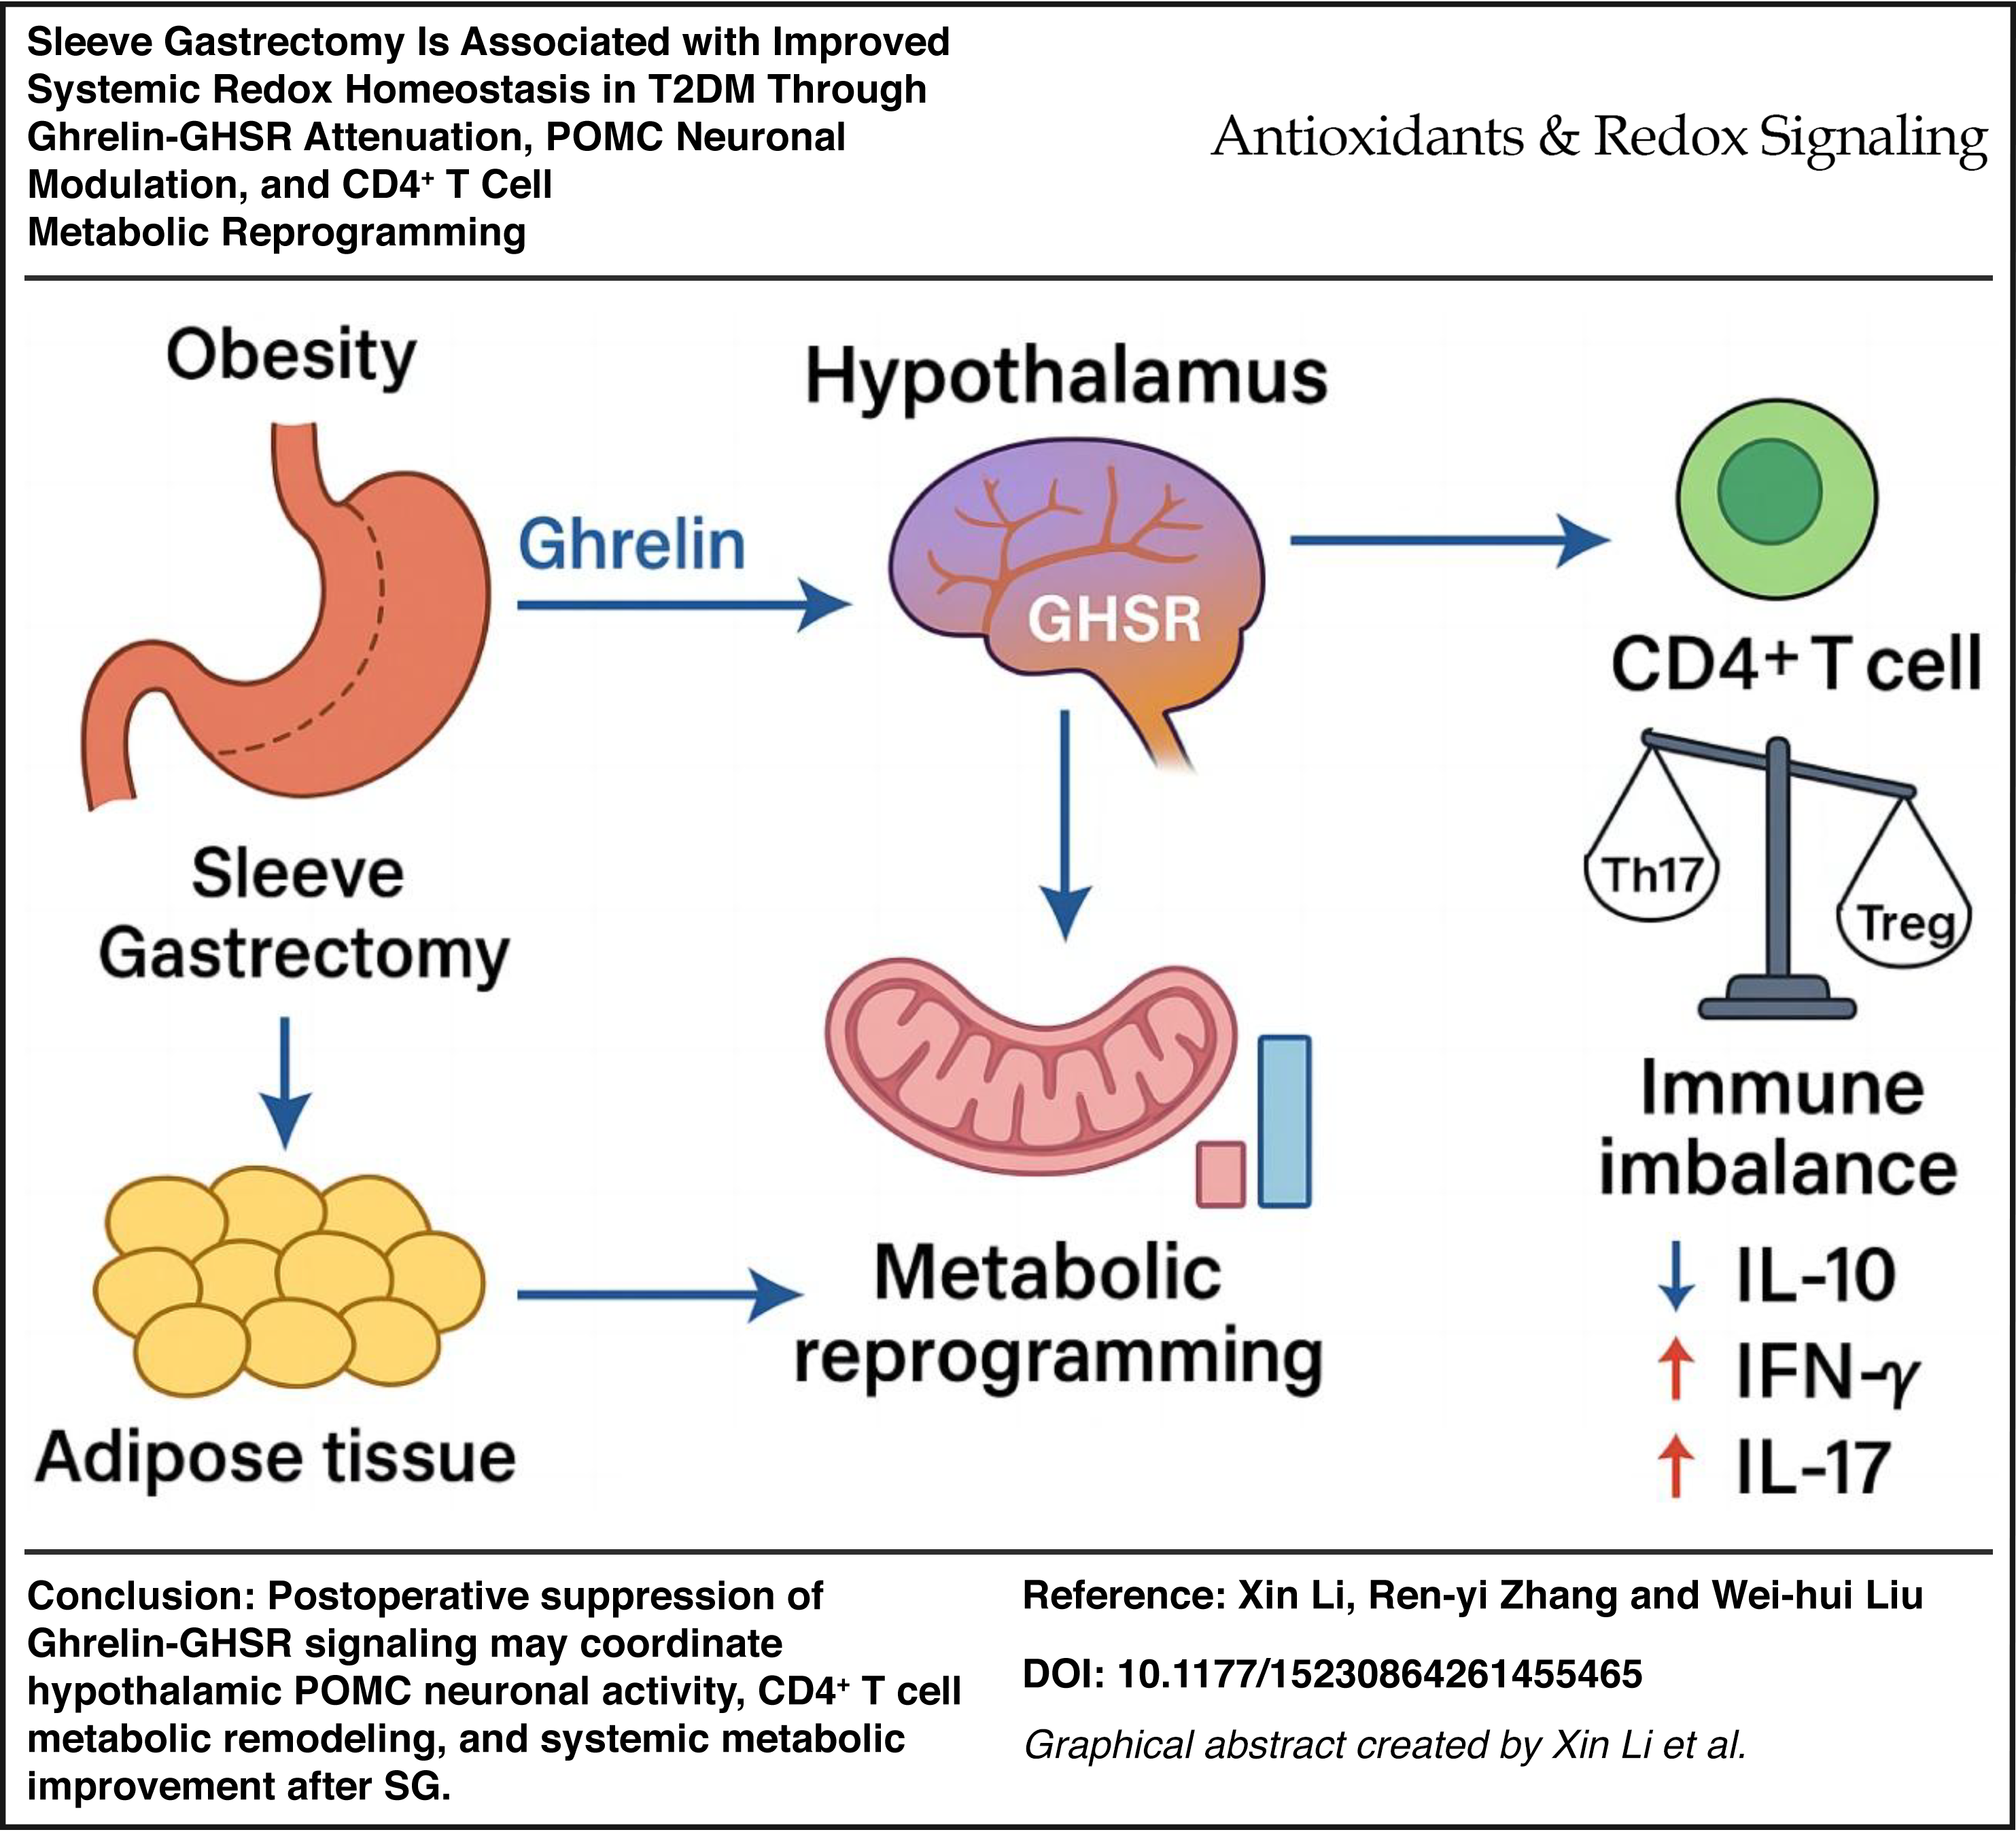
Abstract
Objective:
Sleeve gastrectomy (SG) improves obesity-associated type 2 diabetes mellitus (T2DM) beyond mere weight loss. We investigated whether SG enhances systemic metabolic homeostasis by suppressing the Ghrelin–growth hormone secretagogue receptor (GHSR) axis, remodeling hypothalamic pro-opiomelanocortin (POMC) neuronal activity, and reprogramming CD4+ T cell immunometabolism.
Methods:
Using a diet-induced T2DM mouse model undergoing SG or Sham surgery, we integrated bulk/single-cell RNA sequencing and metabolomics to evaluate systemic neuro-immune-metabolic alterations. Functional assays validated Ghrelin’s effects on CD4+ T cell metabolism and differentiation, alongside assessments of hepatic/pancreatic function and hypothalamic neuronal activity.
Results:
SG globally remodeled peripheral immunity, expanding Tregs while reducing pro-inflammatory Th17 cells. scRNA-seq and metabolomic profiling revealed that CD4+ T cells shifted metabolically from glycolysis toward oxidative phosphorylation, matching increased tricarboxylic acid cycle intermediates. Functionally, Ghrelin–GHSR signaling promoted CD4+ T cell glycolysis, mitochondrial damage, and Th17 skewing; GHSR antagonism successfully reversed these detrimental effects. Systemically, SG reduced hyperglycemia and hepatic lipidosis, restored islet α/β-cell balance, activated anorexigenic POMC neurons, and suppressed AgRP neurons.
Conclusion:
SG alleviates T2DM through coordinated suppression of the Ghrelin–GHSR axis, bridging central appetite regulation with peripheral immunometabolic reprogramming. By shifting CD4+ T cells toward oxidative metabolism and restoring the Treg/Th17 balance, SG drives systemic metabolic recovery, providing critical molecular insights into the neuro-immune mechanisms of metabolic surgery. Antioxid. Redox Signal. 00, 000–000.
Keywords
Innovation
This study highlights a cross-system regulatory axis linking the Ghrelin–GHSR pathway to hypothalamic POMC neuronal activity and peripheral CD4+ T cell metabolic reprogramming in obesity-associated T2DM. While SG is clinically effective, its weight-independent mechanisms remain incompletely defined. Here, our data support that SG is associated with a coordinated shift in CD4+ T cell energetics from glycolysis toward oxidative phosphorylation (OXPHOS) through suppression of Ghrelin–GHSR signaling, thereby helping restore Treg/Th17 balance and systemic redox homeostasis.
By integrating bulk RNA-seq, scRNA-seq, metabolomics, and functional metabolic assays, this study proposes a neuro-immune-metabolic framework connecting hormonal signaling, mitochondrial function, immune subset differentiation, and hypothalamic neuronal activity. The observation that pharmacologic GHSR inhibition amplifies SG-associated metabolic and immune improvements further highlights the translational potential of targeting this pathway as a nonsurgical therapeutic strategy.
Introduction
Obesity-associated type 2 diabetes mellitus (T2DM) is among the fastest-growing metabolic disorders worldwide and poses a major threat to human health (Singh et al., 2025). Its pathogenesis is multifactorial, involving insulin resistance, pancreatic β-cell dysfunction, and adipose tissue inflammation and is closely linked to chronic low-grade inflammation (Chandrasekaran and Weiskirchen, 2024; Szukiewicz, 2023). Increasing evidence indicates that T2DM is not merely a disorder of energy metabolism, but also a systemic disease characterized by disrupted neural regulation and immune homeostasis, forming a complex metabolic-immune-neural network (Wang et al., 2023; Zatterale et al., 2019). Although conventional glucose-lowering agents can effectively control hyperglycemia in the short term, they remain insufficient to halt disease progression or restore systemic homeostasis (Donath et al., 2013; Wondmkun, 2020; Tsai et al., 2015). Therefore, identifying interventions capable of modulating multiple biological pathways at the systemic level has become a central focus of both basic and translational T2DM research.
Metabolic surgery, particularly sleeve gastrectomy (SG), has emerged as an effective treatment for obesity-associated T2DM, with long-term outcomes superior to those of traditional pharmacotherapy (Balasubaramaniam and Pouwels, 2023). Clinical studies have shown that SG not only induces substantial weight loss and improves insulin sensitivity but also rapidly ameliorates glucose metabolism in the early postoperative period, partly independent of weight reduction (Davoudi et al., 2025; Carbone et al., 2021). These benefits are accompanied by changes in gastrointestinal hormones, improvements in hepatic and pancreatic metabolism, and attenuation of systemic inflammation, suggesting that SG exerts therapeutic effects through coordinated regulation of endocrine, neural, and immune pathways (Cibičková et al., 2023). Among these factors, alterations in endogenous hormones such as Ghrelin may play an important role in central energy regulation and immune remodeling after SG (McCarty et al., 2020; Anderson et al., 2013). However, the molecular basis through which SG drives cross-system remodeling remains poorly understood.
The Ghrelin–GHSR signaling axis is a key stomach-derived hormonal pathway that regulates appetite, energy intake, insulin secretion, and immune function (Kasprzak and Adamek, 2022). Previous studies have shown that Ghrelin promotes glycolytic metabolism in CD4+ T cells through activation of GHSR, enhances inflammatory Th17 differentiation, disrupts the Treg/Th17 balance, and aggravates metabolic dysregulation (Wu et al., 2021). GHSR expressed in specific hypothalamic neurons contributes to appetite and behavioral regulation, particularly through POMC/AgRP-associated neuronal circuits (Na et al., 2022; Chu et al., 2022; De Solis et al., 2024). These findings suggest that the Ghrelin–GHSR axis may serve as a critical link between central energy sensing and peripheral immune metabolism. In addition, metabolic reprogramming of CD4+ T cells has become a major focus in immunology, as T cell differentiation and effector function are tightly coupled to cellular metabolic states (de Candia et al., 2022; Guo et al., 2022). Under T2DM conditions, aberrant T cell metabolism contributes to chronic inflammation and may represent a promising therapeutic target (Zhang et al., 2021). With the rapid development of multiomics approaches, including single-cell RNA sequencing, bulk RNA sequencing, and metabolomics, it is now increasingly feasible to dissect the multilayered regulatory mechanisms of disease and the systemic remodeling induced by SG (Jovic et al., 2022; Slovin et al., 2021; Li and Wang, 2021).
Based on this framework, the present study investigated whether SG improves metabolic homeostasis in obesity-associated T2DM through suppression of the Ghrelin–GHSR axis, thereby coordinately remodeling hypothalamic POMC neuronal activity and the metabolic and immune states of peripheral CD4+ T cells. By focusing on the functional interplay among neural, immune, and metabolic systems, we sought to clarify the molecular, cellular, and systemic mechanisms underlying SG-induced integrated remodeling. These findings may deepen understanding of the mechanisms of metabolic surgery and provide potential targets for precision therapy in T2DM. More importantly, they may offer a theoretical foundation for the development of nonsurgical strategies and for establishing a multidimensional therapeutic paradigm centered on metabolic, immune, and neural regulation.
Results
Overview of SG-induced neuro-immune-metabolic cross-system remodeling
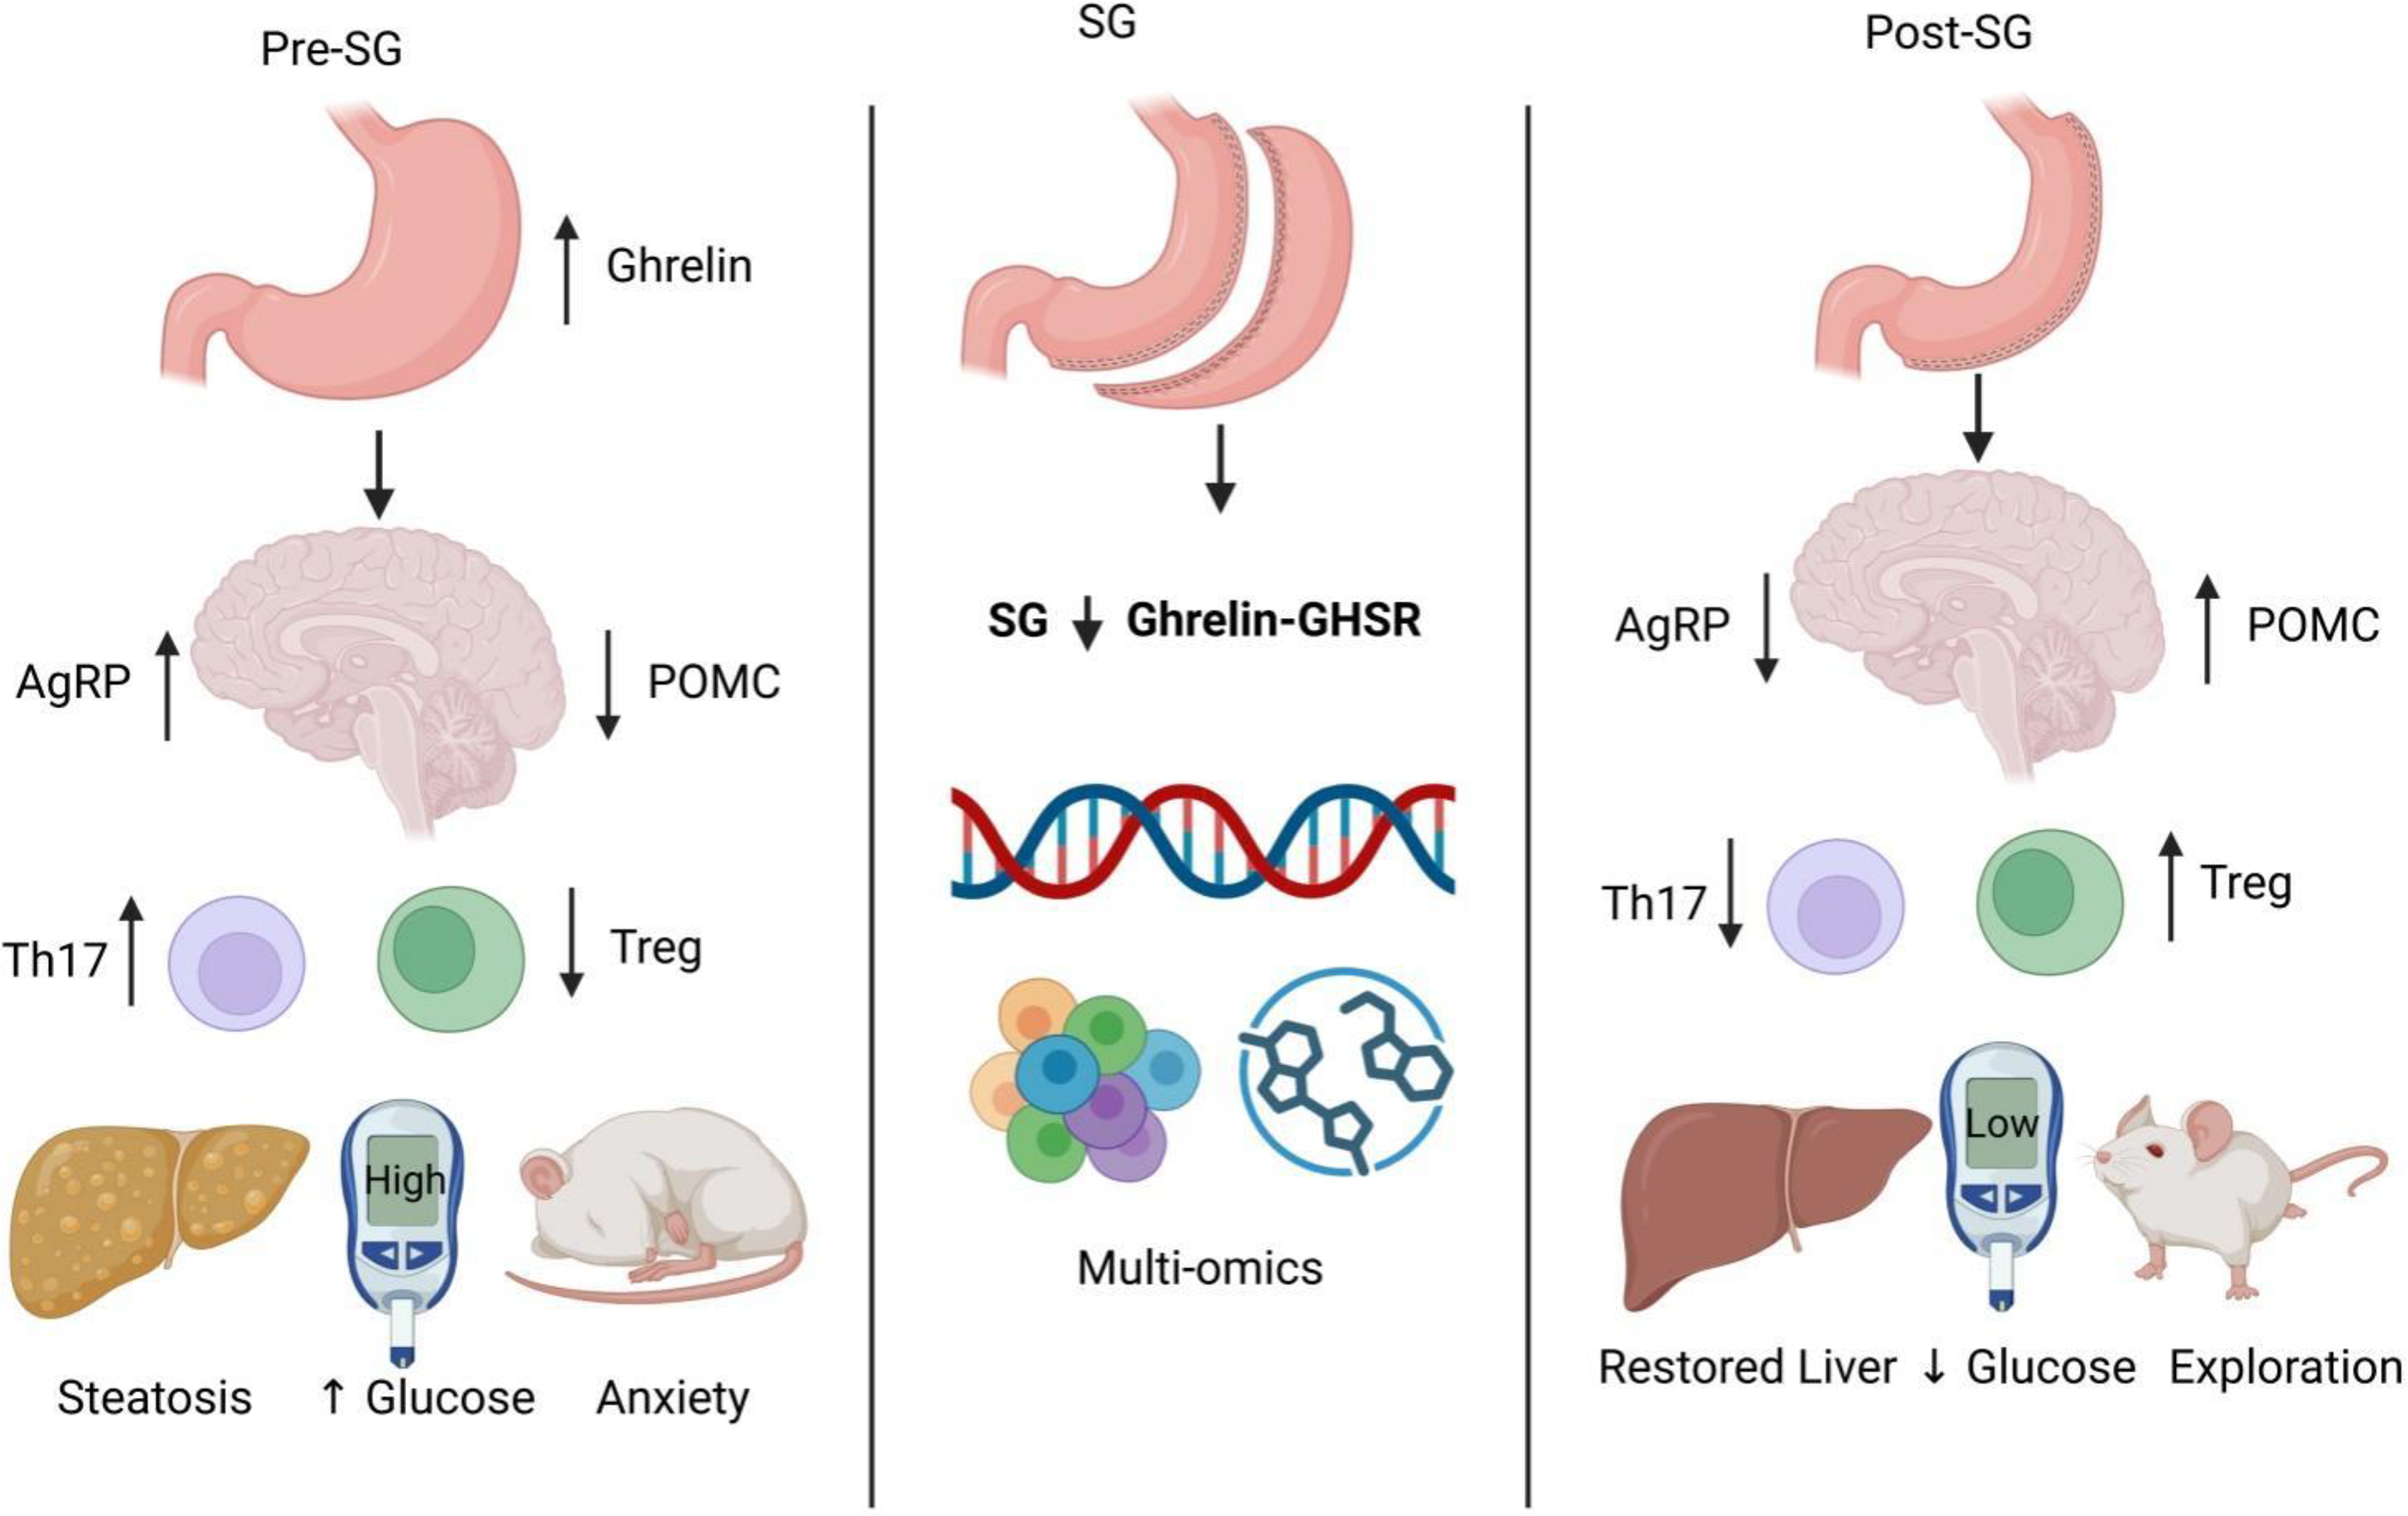
To provide an integrated view of the biological framework examined in this study, Figure 1 presents a schematic model of the central-immune-metabolic regulatory network potentially modulated by SG. Before surgery, activation of the Ghrelin–GHSR signaling axis was associated with persistent stimulation of the hypothalamic AgRP/NPY orexigenic pathway and suppression of POMC neuronal activity. This dysregulated state was accompanied by Th17/Treg imbalance, hepatic lipid droplet accumulation, and impaired glycemic control. Following SG, Ghrelin levels were markedly reduced, GHSR signaling was suppressed, and hypothalamic activity shifted toward a POMC-dominant state. In parallel, peripheral CD4+ T cell homeostasis was restored, and metabolic tissue function was improved. The subsequent analyses further support this cross-system remodeling through multiomics evidence, including single-cell transcriptomics, bulk transcriptomics, and metabolomics.
Transcriptomic profiling of peripheral blood before and after SG in an obesity-associated T2DM animal model
To assess the systemic transcriptional effects of SG, bulk RNA sequencing was performed on peripheral blood samples collected from obesity-associated T2DM animals before and after surgery. Principal component analysis (PCA) revealed clear separation between the SG and T2DM groups along PC1 and PC2, indicating substantial differences in global transcriptional profiles (Fig. 2A). Differential expression analysis identified 218 upregulated and 97 downregulated genes (Fig. 2B). Gene Ontology (GO) enrichment analysis showed that these differentially expressed genes were primarily involved in fatty acid beta-oxidation, oxidative stress response, acute inflammatory response, and mitochondrial inner membrane organization (Fig. 2C). Kyoto Encyclopedia of Genes and Genomes (KEGG) analysis further indicated significant enrichment of pathways related to OXPHOS, peroxisome proliferator-activated receptor (PPAR) signaling, and insulin signaling, suggesting that SG prominently affected metabolic and energy-regulatory processes (Fig. 2D).
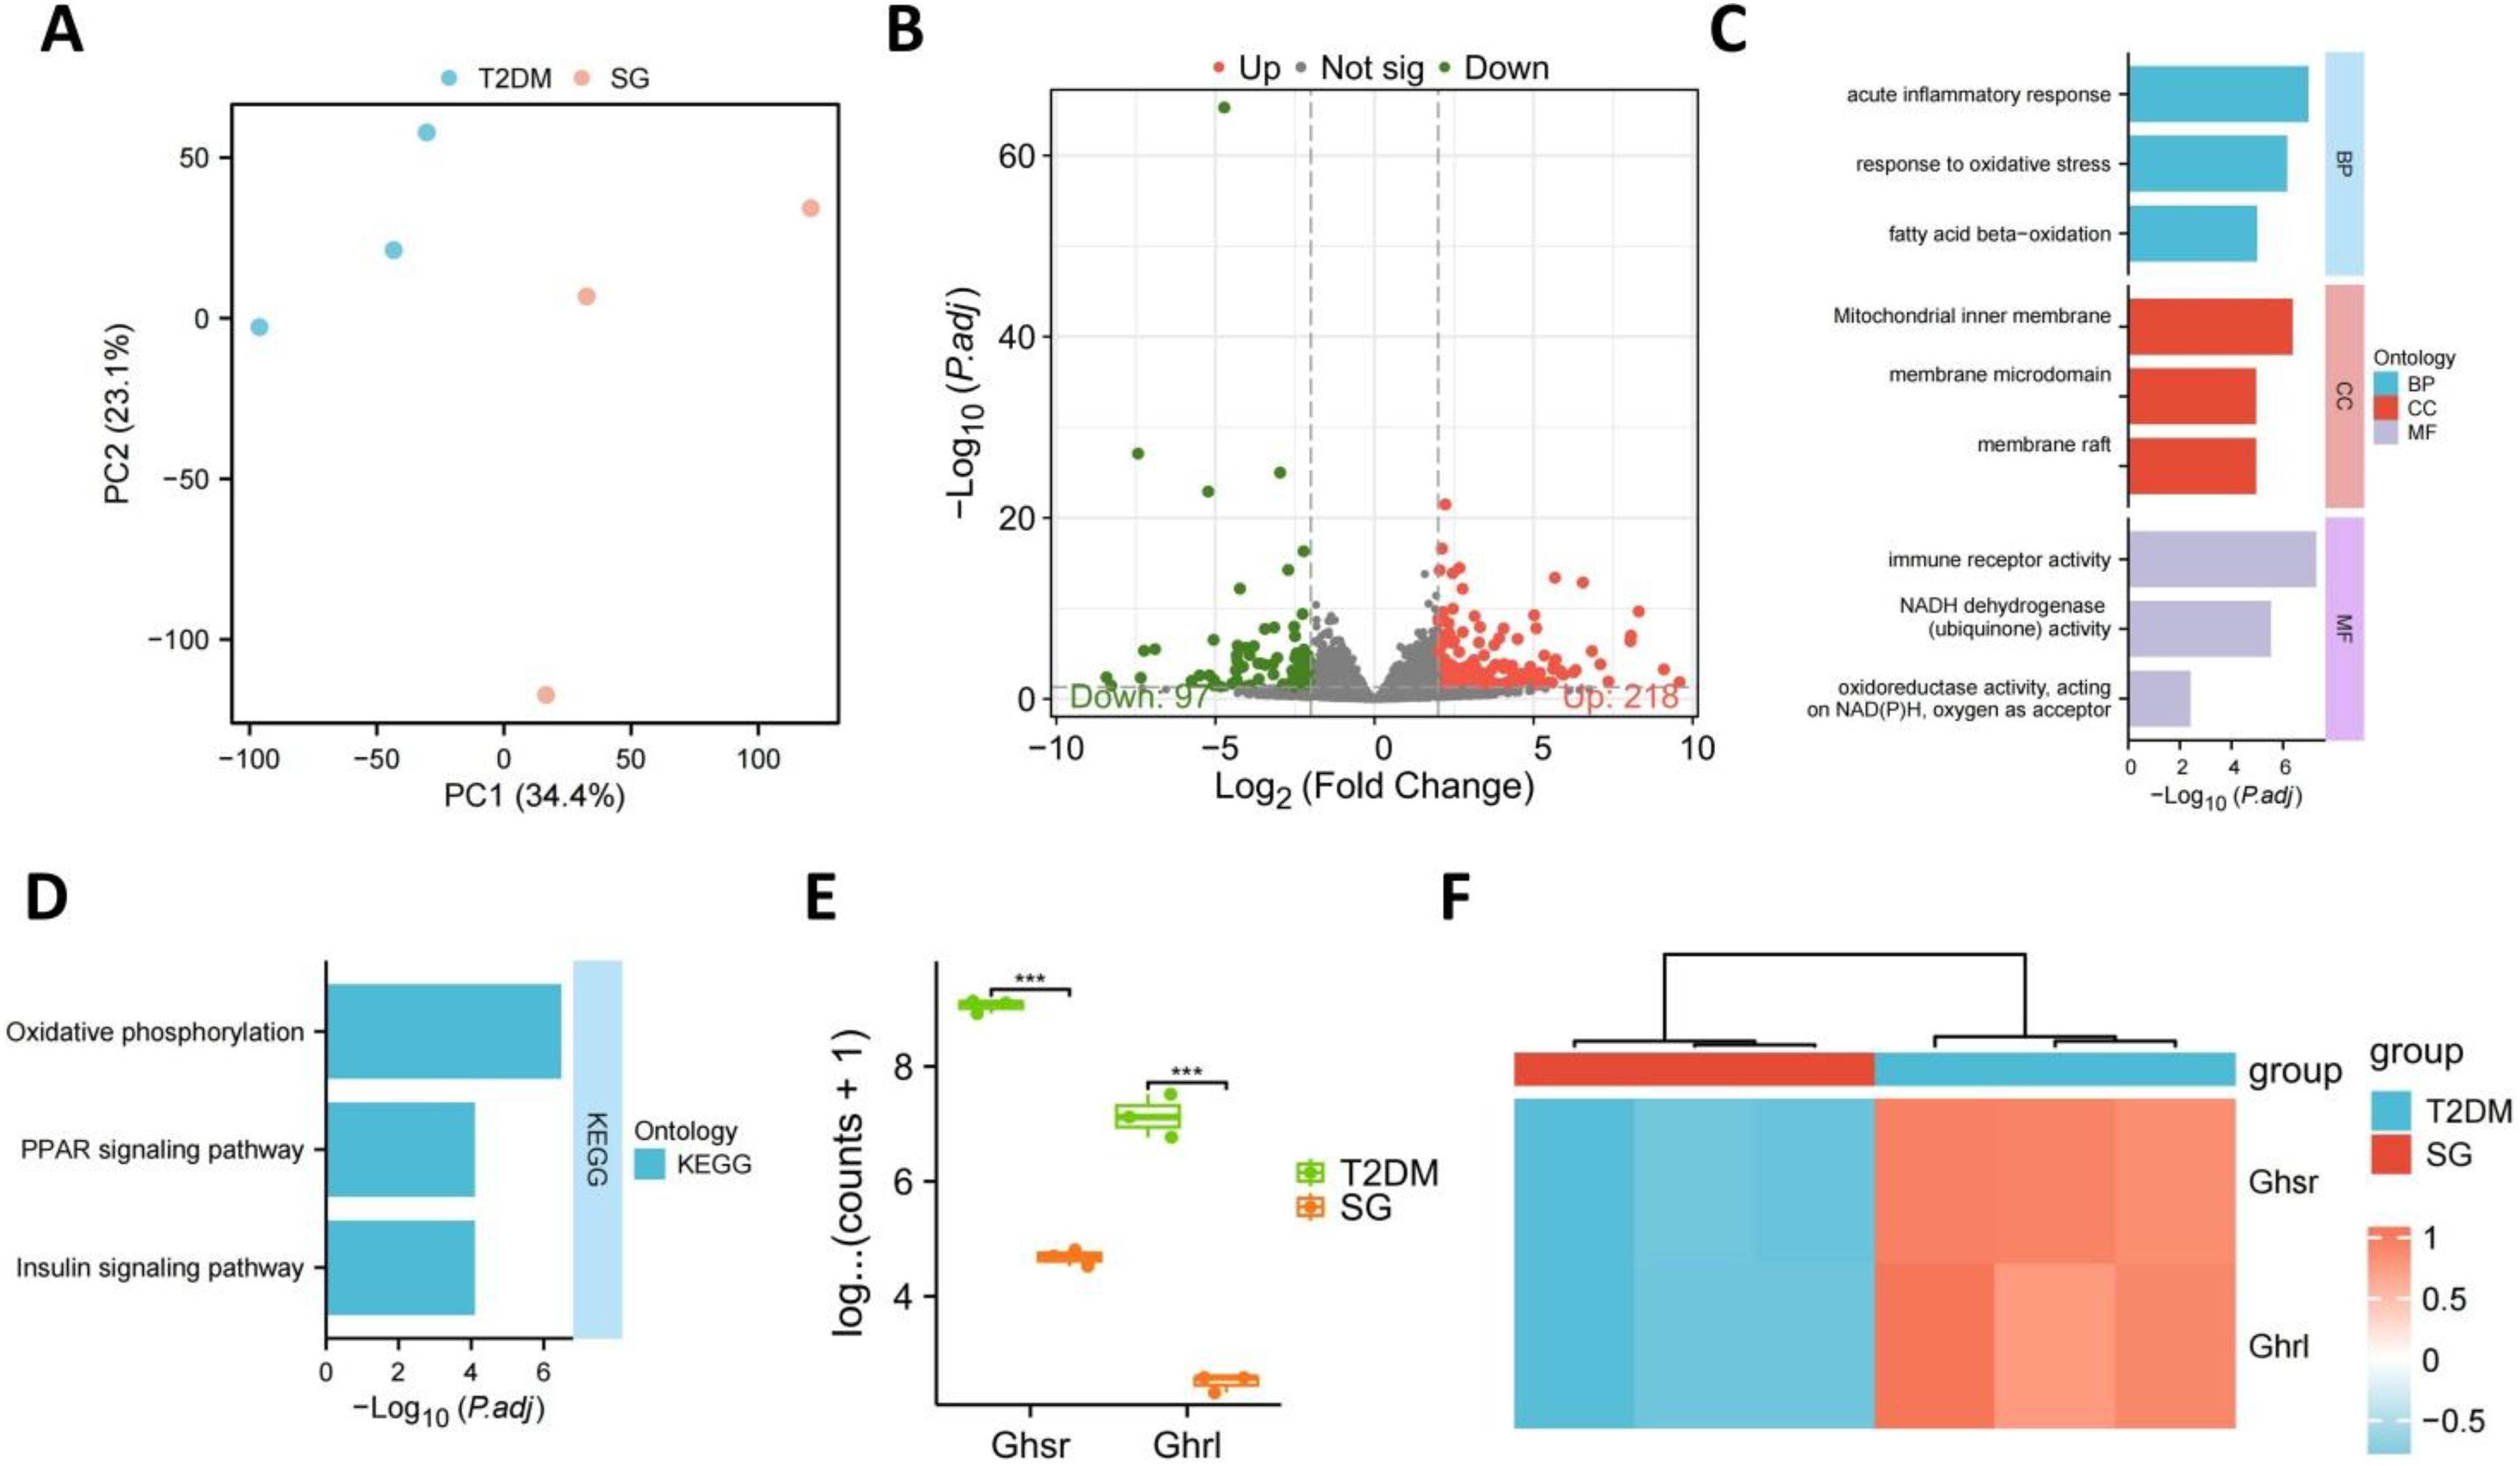
Validation of representative targets showed that the expression levels of Ghsr and Ghrl were significantly lower in the SG group than in the T2DM group (Fig. 2E). In addition, the heatmap demonstrated relatively consistent expression-pattern differences between groups, supporting the robustness and potential discriminatory value of these transcriptional changes (Fig. 2F).
Collectively, these findings indicate that SG induces marked transcriptomic remodeling in peripheral blood, particularly in pathways related to fatty acid metabolism, mitochondrial energy conversion, and insulin signaling. These alterations may contribute to the systemic metabolic improvement observed after surgery.
scRNA-seq of peripheral blood reveals immune-cell remodeling following SG surgery
After stringent quality control of the raw scRNA-seq data, S-phase and G2/M-phase scores were close to zero in both the SG and T2DM groups, with no significant differences observed (Supplementary Fig. S1A). The two groups also showed broadly comparable distributions of detected gene numbers, transcript counts, and mitochondrial gene proportions (Supplementary Fig. S1B). Correlation analysis further showed that nCount_RNA was strongly positively correlated with nFeature_RNA, weakly negatively correlated with percent.mt, and showed no correlation with percent.HB (Supplementary Fig. S1C). These results indicate balanced sequencing depth, minimal erythrocyte contamination, and overall data quality sufficient for downstream analysis.
Screening of highly variable genes revealed a clear distribution of standardized variance, providing a foundation for subsequent clustering analysis (Supplementary Fig. S1D). PCA indicated that the first 30 principal components captured the major sources of variation in the dataset (Supplementary Fig. S1E). After batch correction using Harmony, SG and T2DM samples showed improved mixing in low-dimensional space, suggesting that technical bias between samples had been effectively reduced (Supplementary Fig. S1F). Multiresolution clustering analysis further indicated that a resolution of 0.8 yielded a relatively stable clustering structure and was selected for downstream cell-type annotation (Supplementary Fig. S1G).
Uniform manifold approximation and projection (UMAP) visualization showed clear separation of peripheral blood immune-cell populations, reflecting substantial cellular heterogeneity (Supplementary Fig. S2A). Based on canonical marker genes, 11 major cell populations were annotated, including CD4+ T cells, CD8+ T cells, B cells, monocytes, natural killer (NK cells), neutrophils, dendritic cells, and platelets (Supplementary Fig. S2B). Compared with the T2DM group, the SG group showed an increased proportion of CD4+ T cells, upward trends in CD8+ T cells and B cells, and downward trends in monocytes, NK cells, and neutrophils (Supplementary Fig. S2C). Given the limited sample size, however, these compositional changes should be interpreted cautiously and require validation in additional biological replicates. Further differential expression analysis of CD4+ T cells identified multiple significantly upregulated and downregulated genes (Supplementary Fig. S2D). GO enrichment analysis suggested that these genes were mainly involved in immune-regulatory processes, including T cell differentiation, immunological synapse formation, and T cell receptor binding (Supplementary Fig. S2E). KEGG analysis further indicated enrichment of immune-related pathways such as tumor necrosis factor signaling, Th17 differentiation, and Th1/Th2 differentiation (Supplementary Fig. S2F).
Overall, these findings suggest that SG is associated with remodeling of peripheral immune-cell composition and transcriptional programs. In particular, alterations in CD4+ T cell-related signaling pathways may contribute to the regulation of metabolic status and immune homeostasis after surgery, although these observations still require further validation in larger cohorts and functional studies.
SG promotes peripheral blood CD4+ T cell immune remodeling and induces a metabolic shift from glycolysis to oxidative metabolism
UMAP visualization revealed distinct distributions of CD4+ T cell subpopulations in two-dimensional space, indicating marked transcriptional heterogeneity (Fig. 3A). Reclustering identified five functional subsets within the CD4+ T cell compartment, including naive CD4+ T cells, central memory CD4+ T cells, Treg cells, Th17 cells, and Th1 cells (Fig. 3B). Comparison between groups showed that the SG group had an increased proportion of Treg cells and a reduced proportion of Th17 cells, whereas naive and central memory CD4+ T cells remained relatively stable and Th1 cells were decreased (Fig. 3C). These findings suggest that SG is associated with remodeling of peripheral CD4+ T cell composition toward a less inflammatory state. To validate the subset changes identified by scRNA-seq, flow cytometry was performed in an independent cohort of animals (Fig. 3D). Consistent with the single-cell results, the SG group exhibited a higher proportion of CD4+CD25+Foxp3+ Treg cells and a lower proportion of CD4+IL-17A+ Th17 cells than the T2DM group, supporting a shift toward a more homeostatic immune profile after SG.
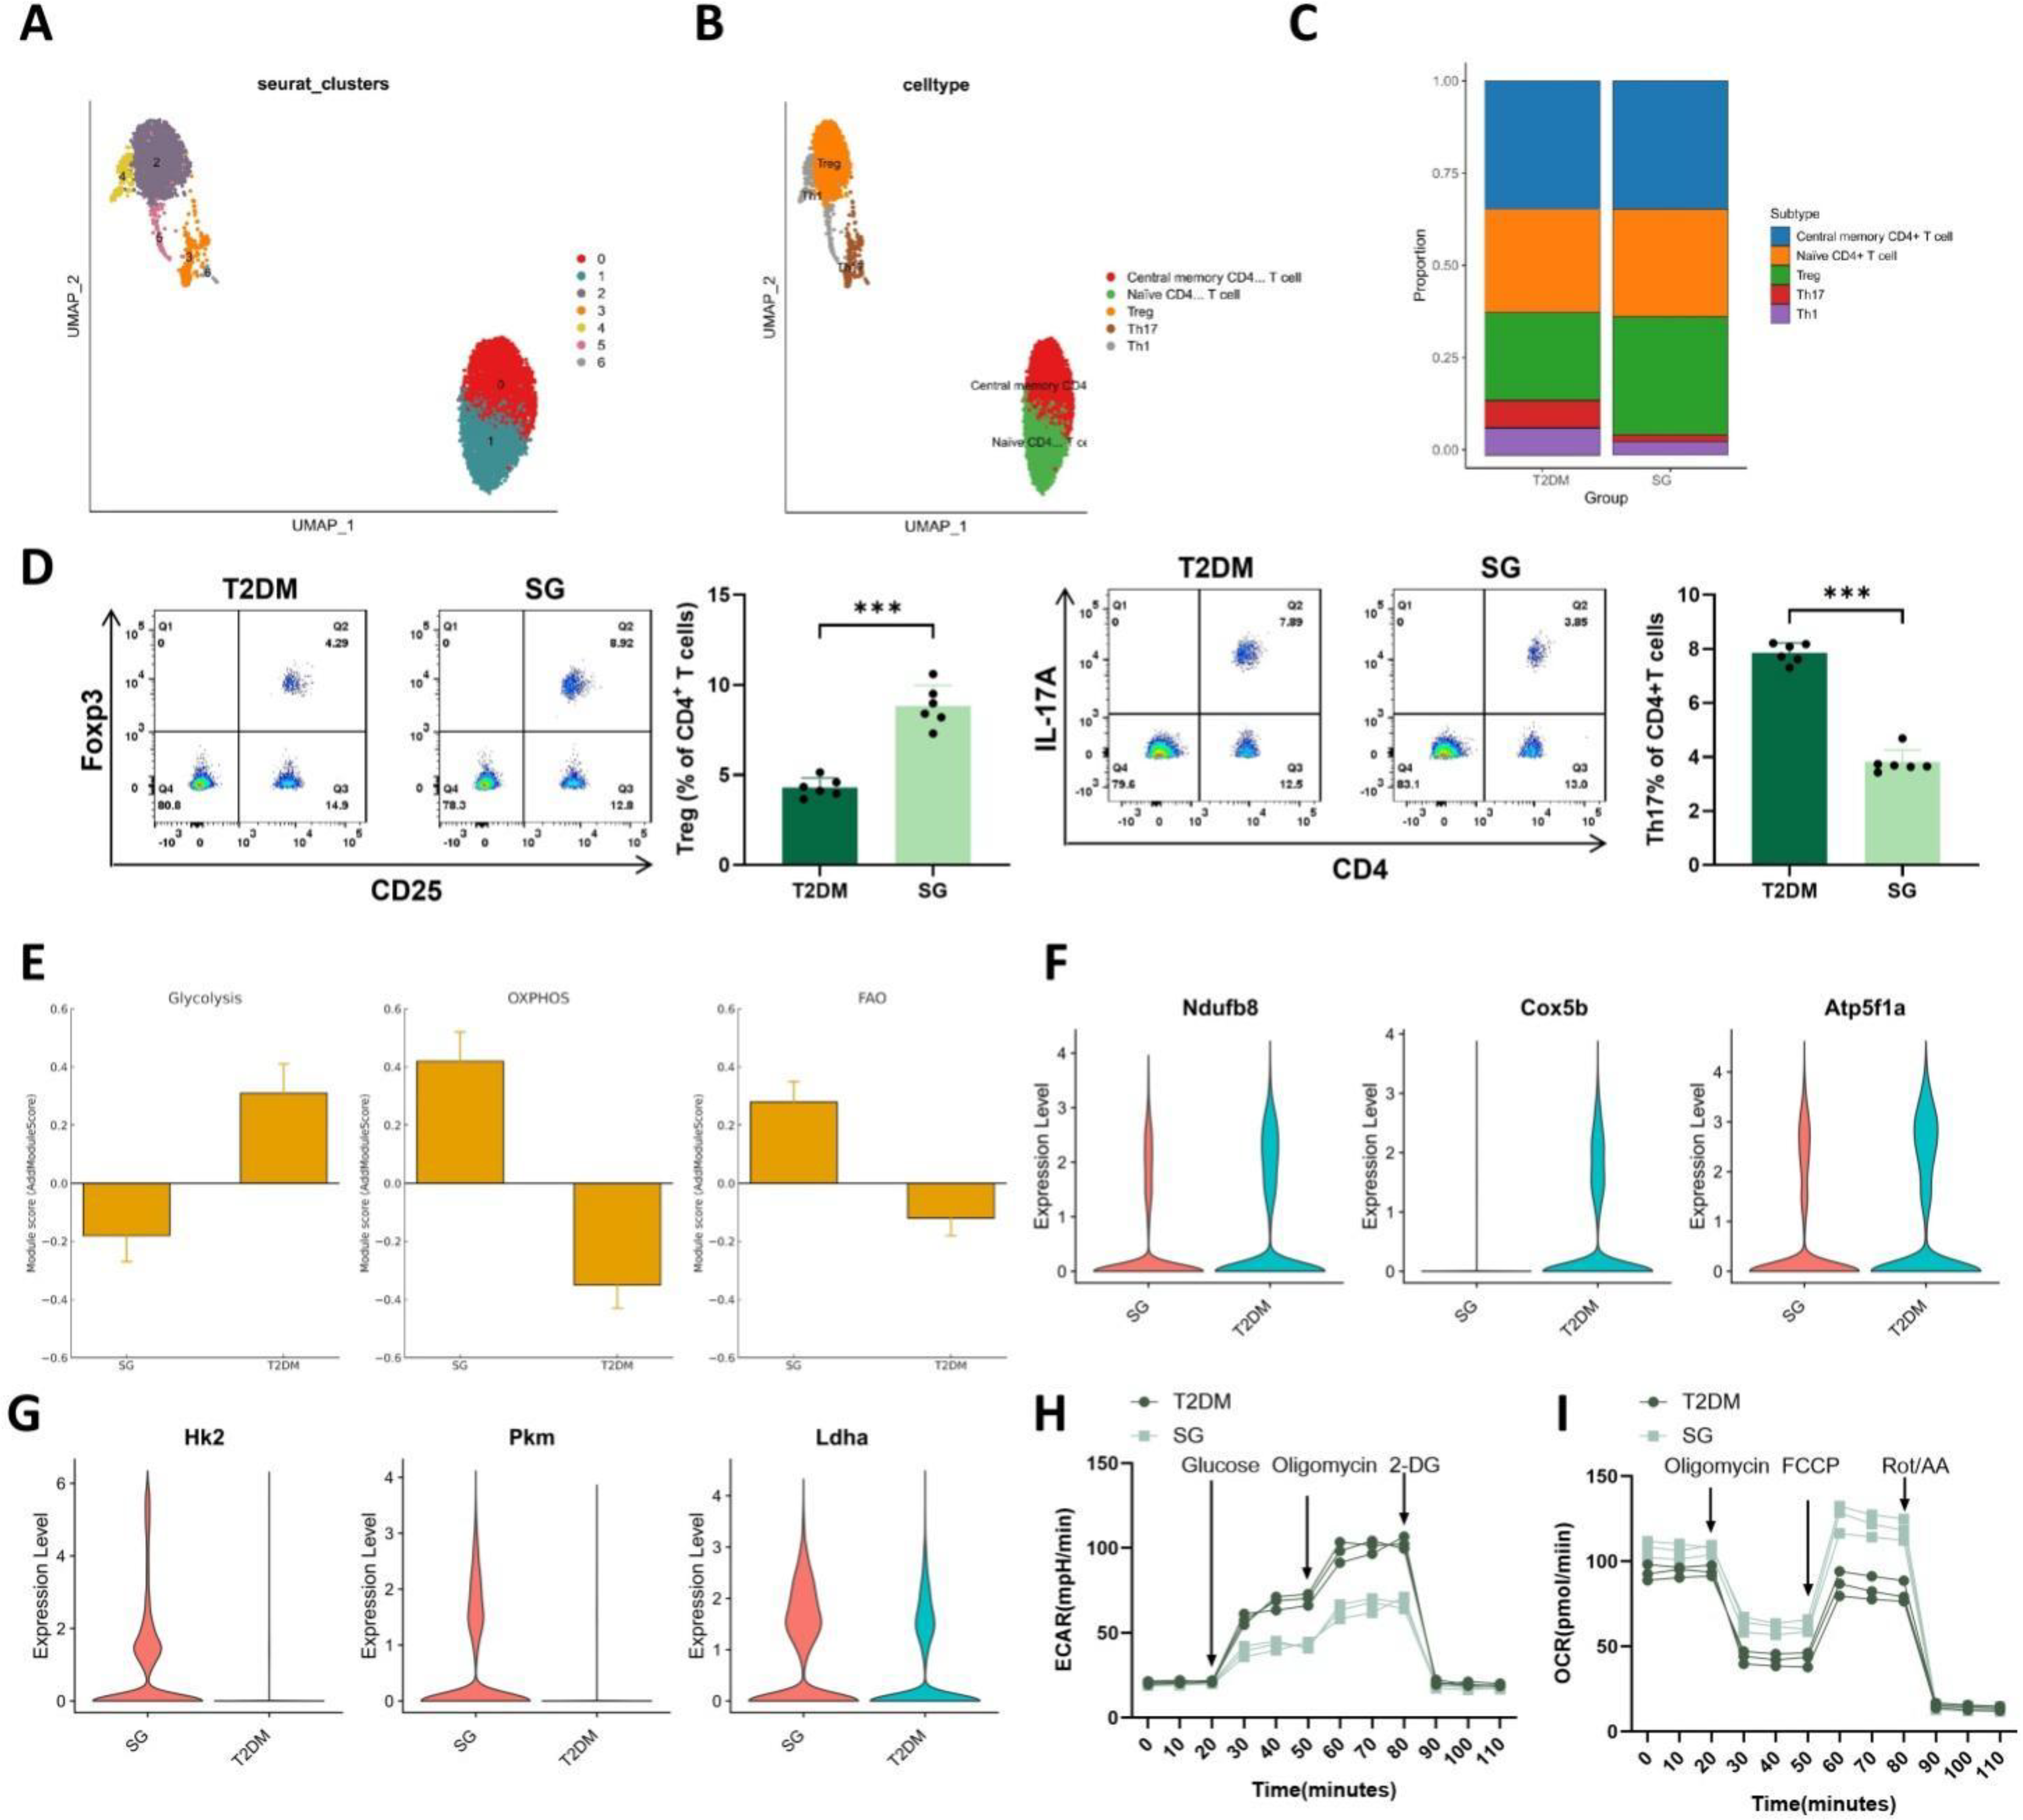
To further examine the metabolic state of CD4+ T cells, AddModuleScore analysis was used to evaluate the activity of key metabolic pathways. The SG group displayed enhanced OXPHOS and fatty acid oxidation (FAO), together with reduced glycolytic activity (Fig. 3E). At the single-cell level, key OXPHOS genes (Ndufb8, Cox5b, and Atp5f1a) were upregulated in the SG group (Fig. 3F), whereas key glycolytic genes (Hk2, Pkm, and Ldha) were downregulated (Fig. 3G). To functionally validate the metabolic reprogramming suggested by the scRNA-seq data, peripheral CD4+ T cells were isolated from an independent animal cohort and subjected to Seahorse XF analysis (Fig. 3H, I). Compared with the T2DM group, SG-derived CD4+ T cells showed an overall reduction in extracellular acidification rate (ECAR), with blunted responses to glucose and oligomycin stimulation, whereas oxygen consumption rate (OCR) was relatively increased and displayed greater respiratory reserve after carbonyl cyanide p-trifluoromethoxyphenylhydrazone (FCCP) stimulation. These findings were consistent with the single-cell module scores and metabolic gene expression patterns, supporting a shift from glycolysis toward a more oxidative metabolic state after SG.
Taken together, these data indicate that SG promotes both immune and metabolic remodeling of peripheral CD4+ T cells. Specifically, SG shifts CD4+ T cells from a highly glycolytic, pro-inflammatory state toward a more homeostatic profile characterized by enhanced OXPHOS and FAO, a pattern that is consistent with Treg expansion and systemic attenuation of inflammation.
Single-cell pseudotime analysis reveals CD4+ T cell differentiation trajectory
Monocle2 pseudotime analysis of reclustered CD4+ T cells generated a branched trajectory, with cells distributed along a continuous spectrum of states (Supplementary Fig. S3A). The early segment of the trajectory was enriched in naive CD4+ T cells, followed by central memory CD4+ T cells, whereas other functional subsets appeared progressively along the pseudotime axis. Treg, Th17, and Th1 cells were more frequently detected in relatively later pseudotime regions. Accordingly, naive and central memory CD4+ T cells primarily occupied early pseudotime intervals, whereas Treg, Th17, and Th1 cells were enriched in intermediate-to-late stages, suggesting a continuous transition from initial or memory-like states toward distinct functional states (Supplementary Fig. S3B). Given the limited single-cell sample size, these findings should be regarded as an exploratory depiction of CD4+ T cell state continuity rather than a definitive comparison of stable differentiation trajectories between treatment groups.
Further analysis of representative differentiation- and function-related genes along pseudotime showed that markers associated with naive and central memory CD4+ T cells, including Tcf7, Ccr7, and Sell, were highly expressed in early pseudotime regions and gradually declined as pseudotime progressed, consistent with a transition from initial or memory-like states toward more differentiated states. In intermediate regions, the Treg-associated markers Foxp3 and Ctla4 progressively increased and reached higher levels in Treg-enriched segments, indicating the emergence of immune-regulatory transcriptional features. In the terminal region, expression of the Th17-associated gene Il17a increased, suggesting that a subset of cells acquired a more inflammatory effector-like transcriptional program (Supplementary Fig. S3C).
Overall, these findings suggest that peripheral blood CD4+ T cells after SG may exhibit transcriptional features consistent with a continuous transition from naive or memory-like states toward regulatory and effector-like states, thereby providing exploratory evidence for postoperative immune remodeling.
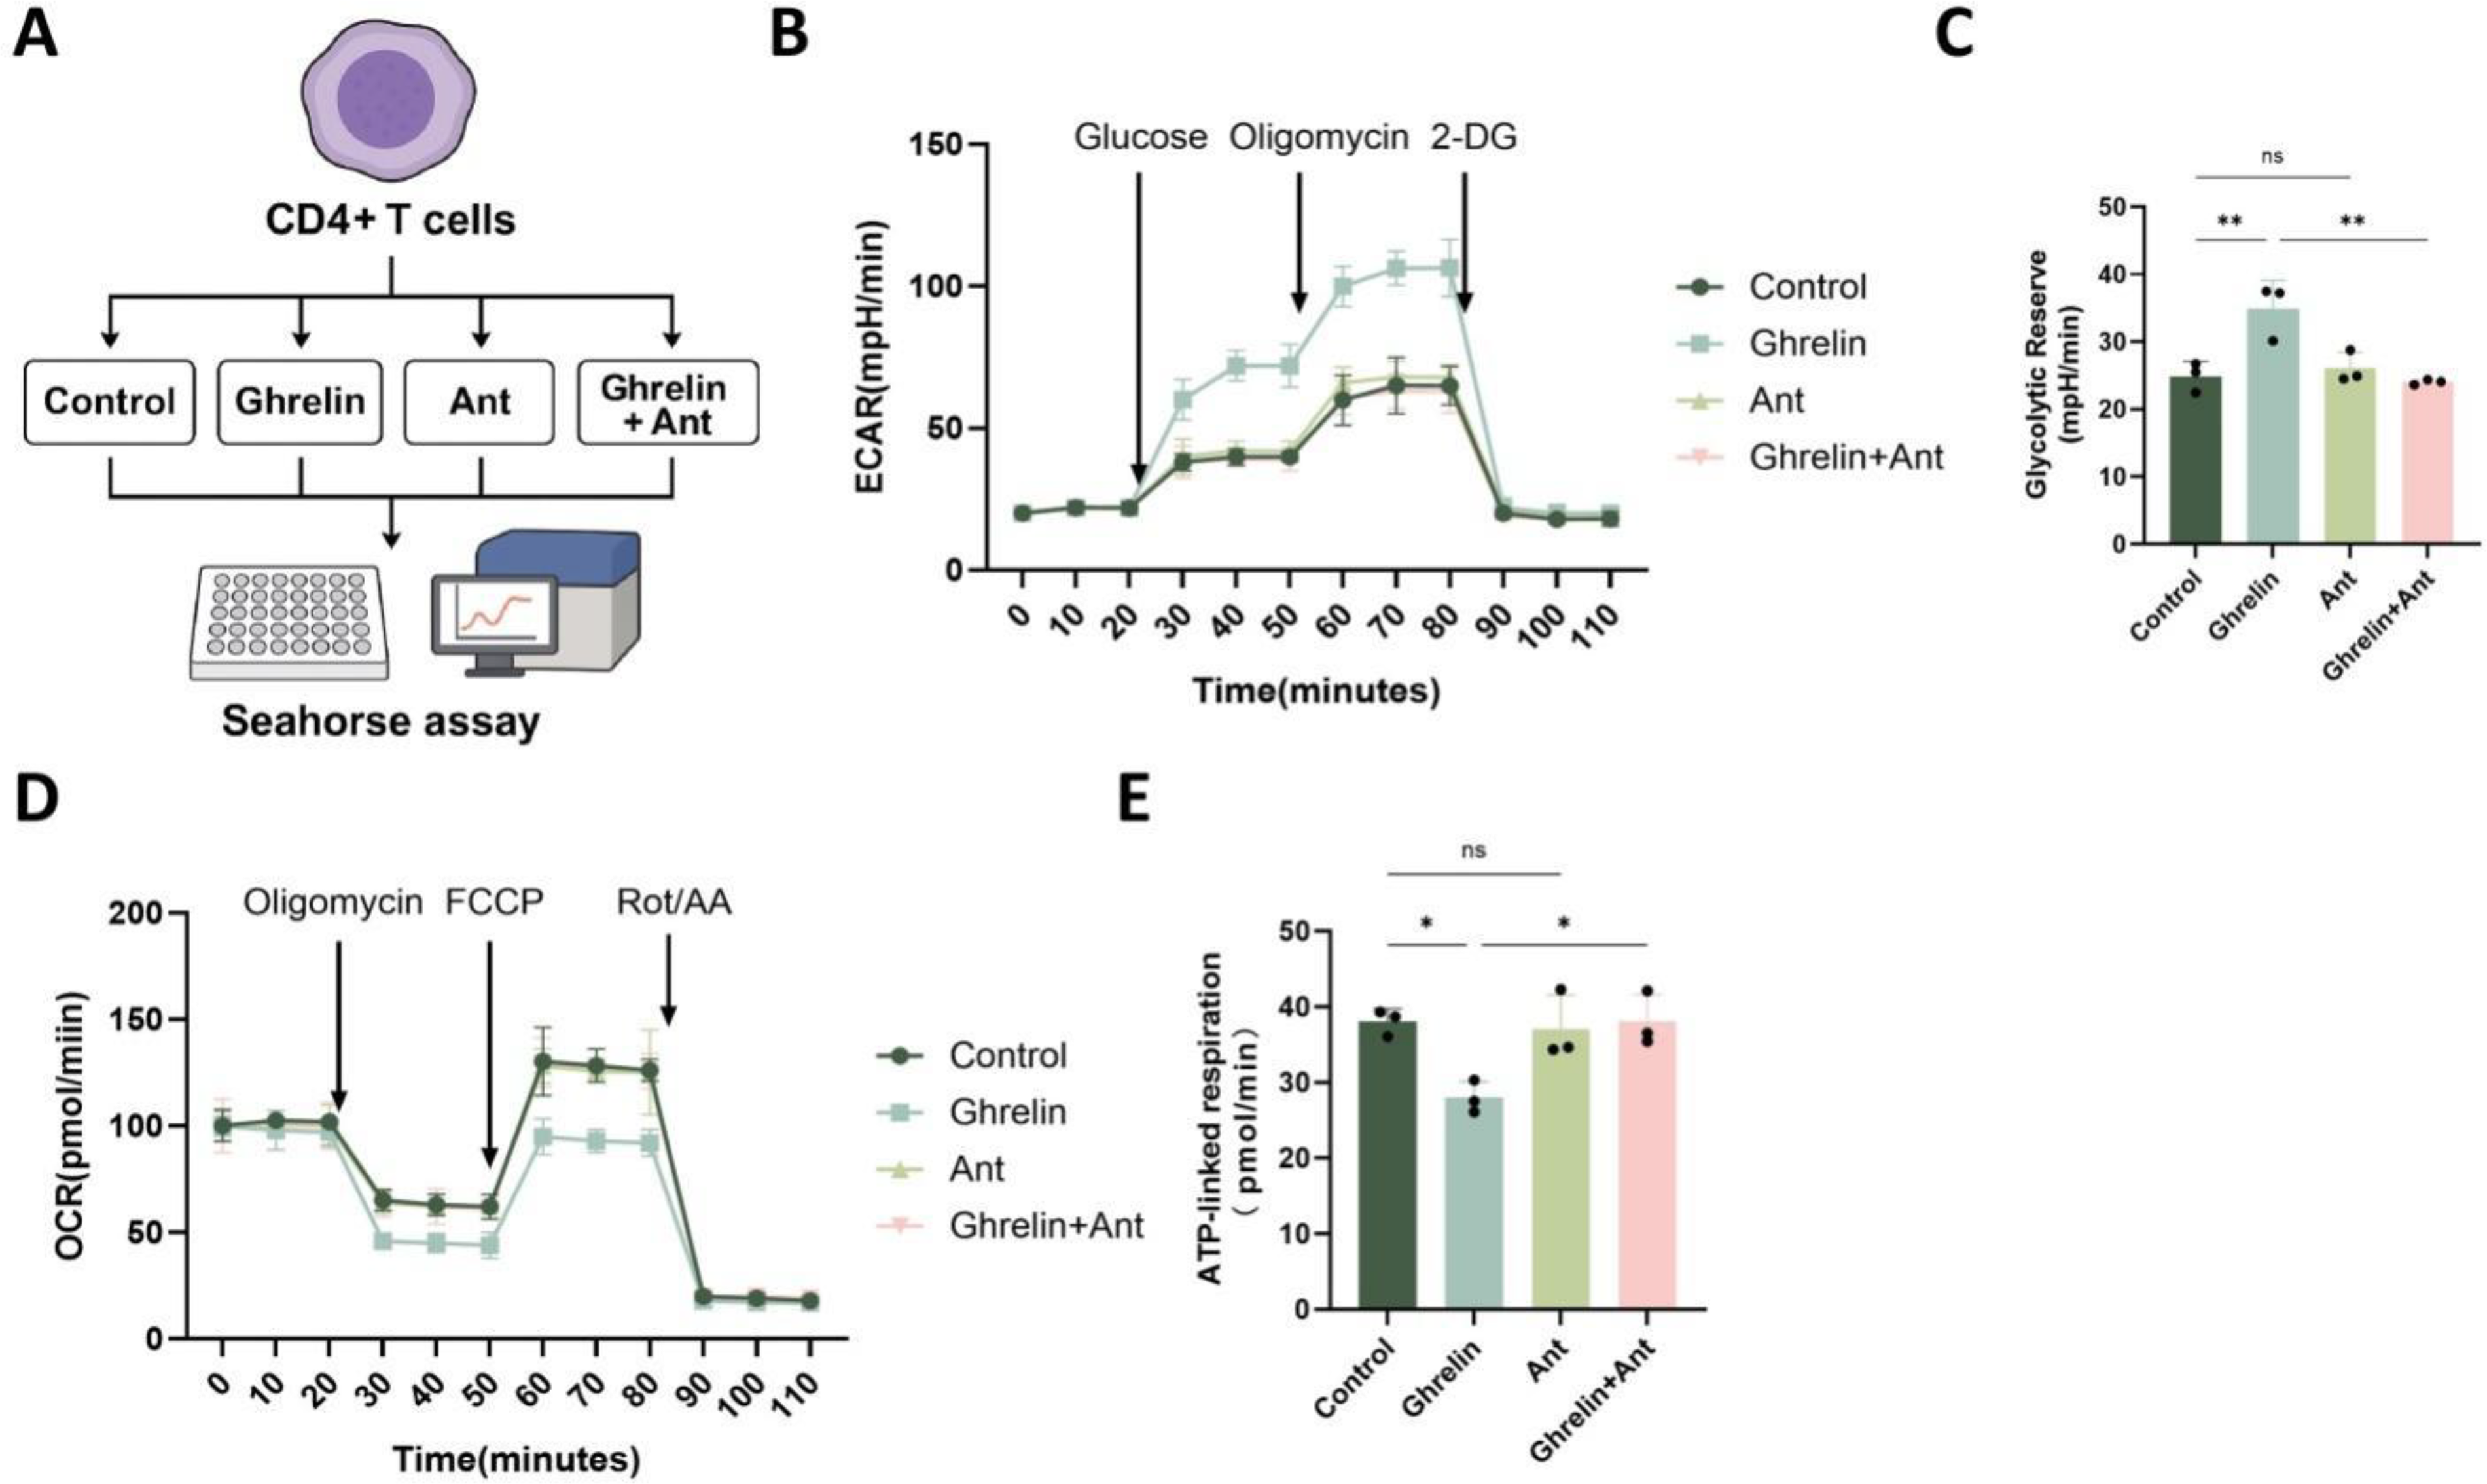
Ghrelin enhances glycolysis and suppresses mitochondrial respiration in vitro
To investigate the regulatory role of Ghrelin in CD4+ T cell energy metabolism, four experimental groups were established: Control, Ghrelin, Ant, and Ghrelin + Ant. Glycolytic and mitochondrial respiratory profiles were assessed using the Seahorse XF platform (Fig. 4A). Ghrelin treatment markedly increased ECAR following glucose and oligomycin stimulation, indicating enhanced glycolytic activity, glycolytic capacity, and glycolytic reserve. In contrast, the Control and Ant-only groups showed comparable glycolytic responses (Fig. 4B, C). Simultaneously, OCR measurements revealed that Ghrelin suppressed mitochondrial respiration, particularly during the ATP-linked respiratory phase, whereas the Control and Ant-only groups maintained relatively higher respiratory activity (Fig. 4D, E). Notably, cotreatment with Ghrelin and the GHSR inhibitor effectively reversed both the glycolytic enhancement and the suppression of mitochondrial respiration, restoring the metabolic phenotype to a level comparable to that of the Control group. Collectively, these findings indicate that Ghrelin drives metabolic reprogramming in CD4+ T cells by shifting energy utilization from OXPHOS toward glycolysis through the GHSR signaling axis.
Ghrelin disrupts CD4+ T cell mitochondrial ultrastructure and induces oxidative stress, partially reversed by GHSR inhibition
To further evaluate the impact of Ghrelin on mitochondrial homeostasis in CD4+ T cells, a systematic analysis was conducted across four groups (Control, Ghrelin, Ant, and Ghrelin + Ant) (Fig. 5A). Transmission electron microscopy (TEM) showed intact mitochondrial morphology and well-organized cristae in the Control group. In contrast, Ghrelin-treated cells displayed marked mitochondrial swelling, cristae disruption, and vacuolar degeneration. These structural abnormalities were substantially alleviated by cotreatment with the GHSR inhibitor, with mitochondrial morphology approaching that of the Control group (Fig. 5B). JC-1 staining showed a significant reduction in the red-to-green fluorescence ratio in the Ghrelin group, indicating loss of mitochondrial membrane potential (ΔΨm), whereas GHSR inhibition largely restored this ratio to near-control levels (Fig. 5C).
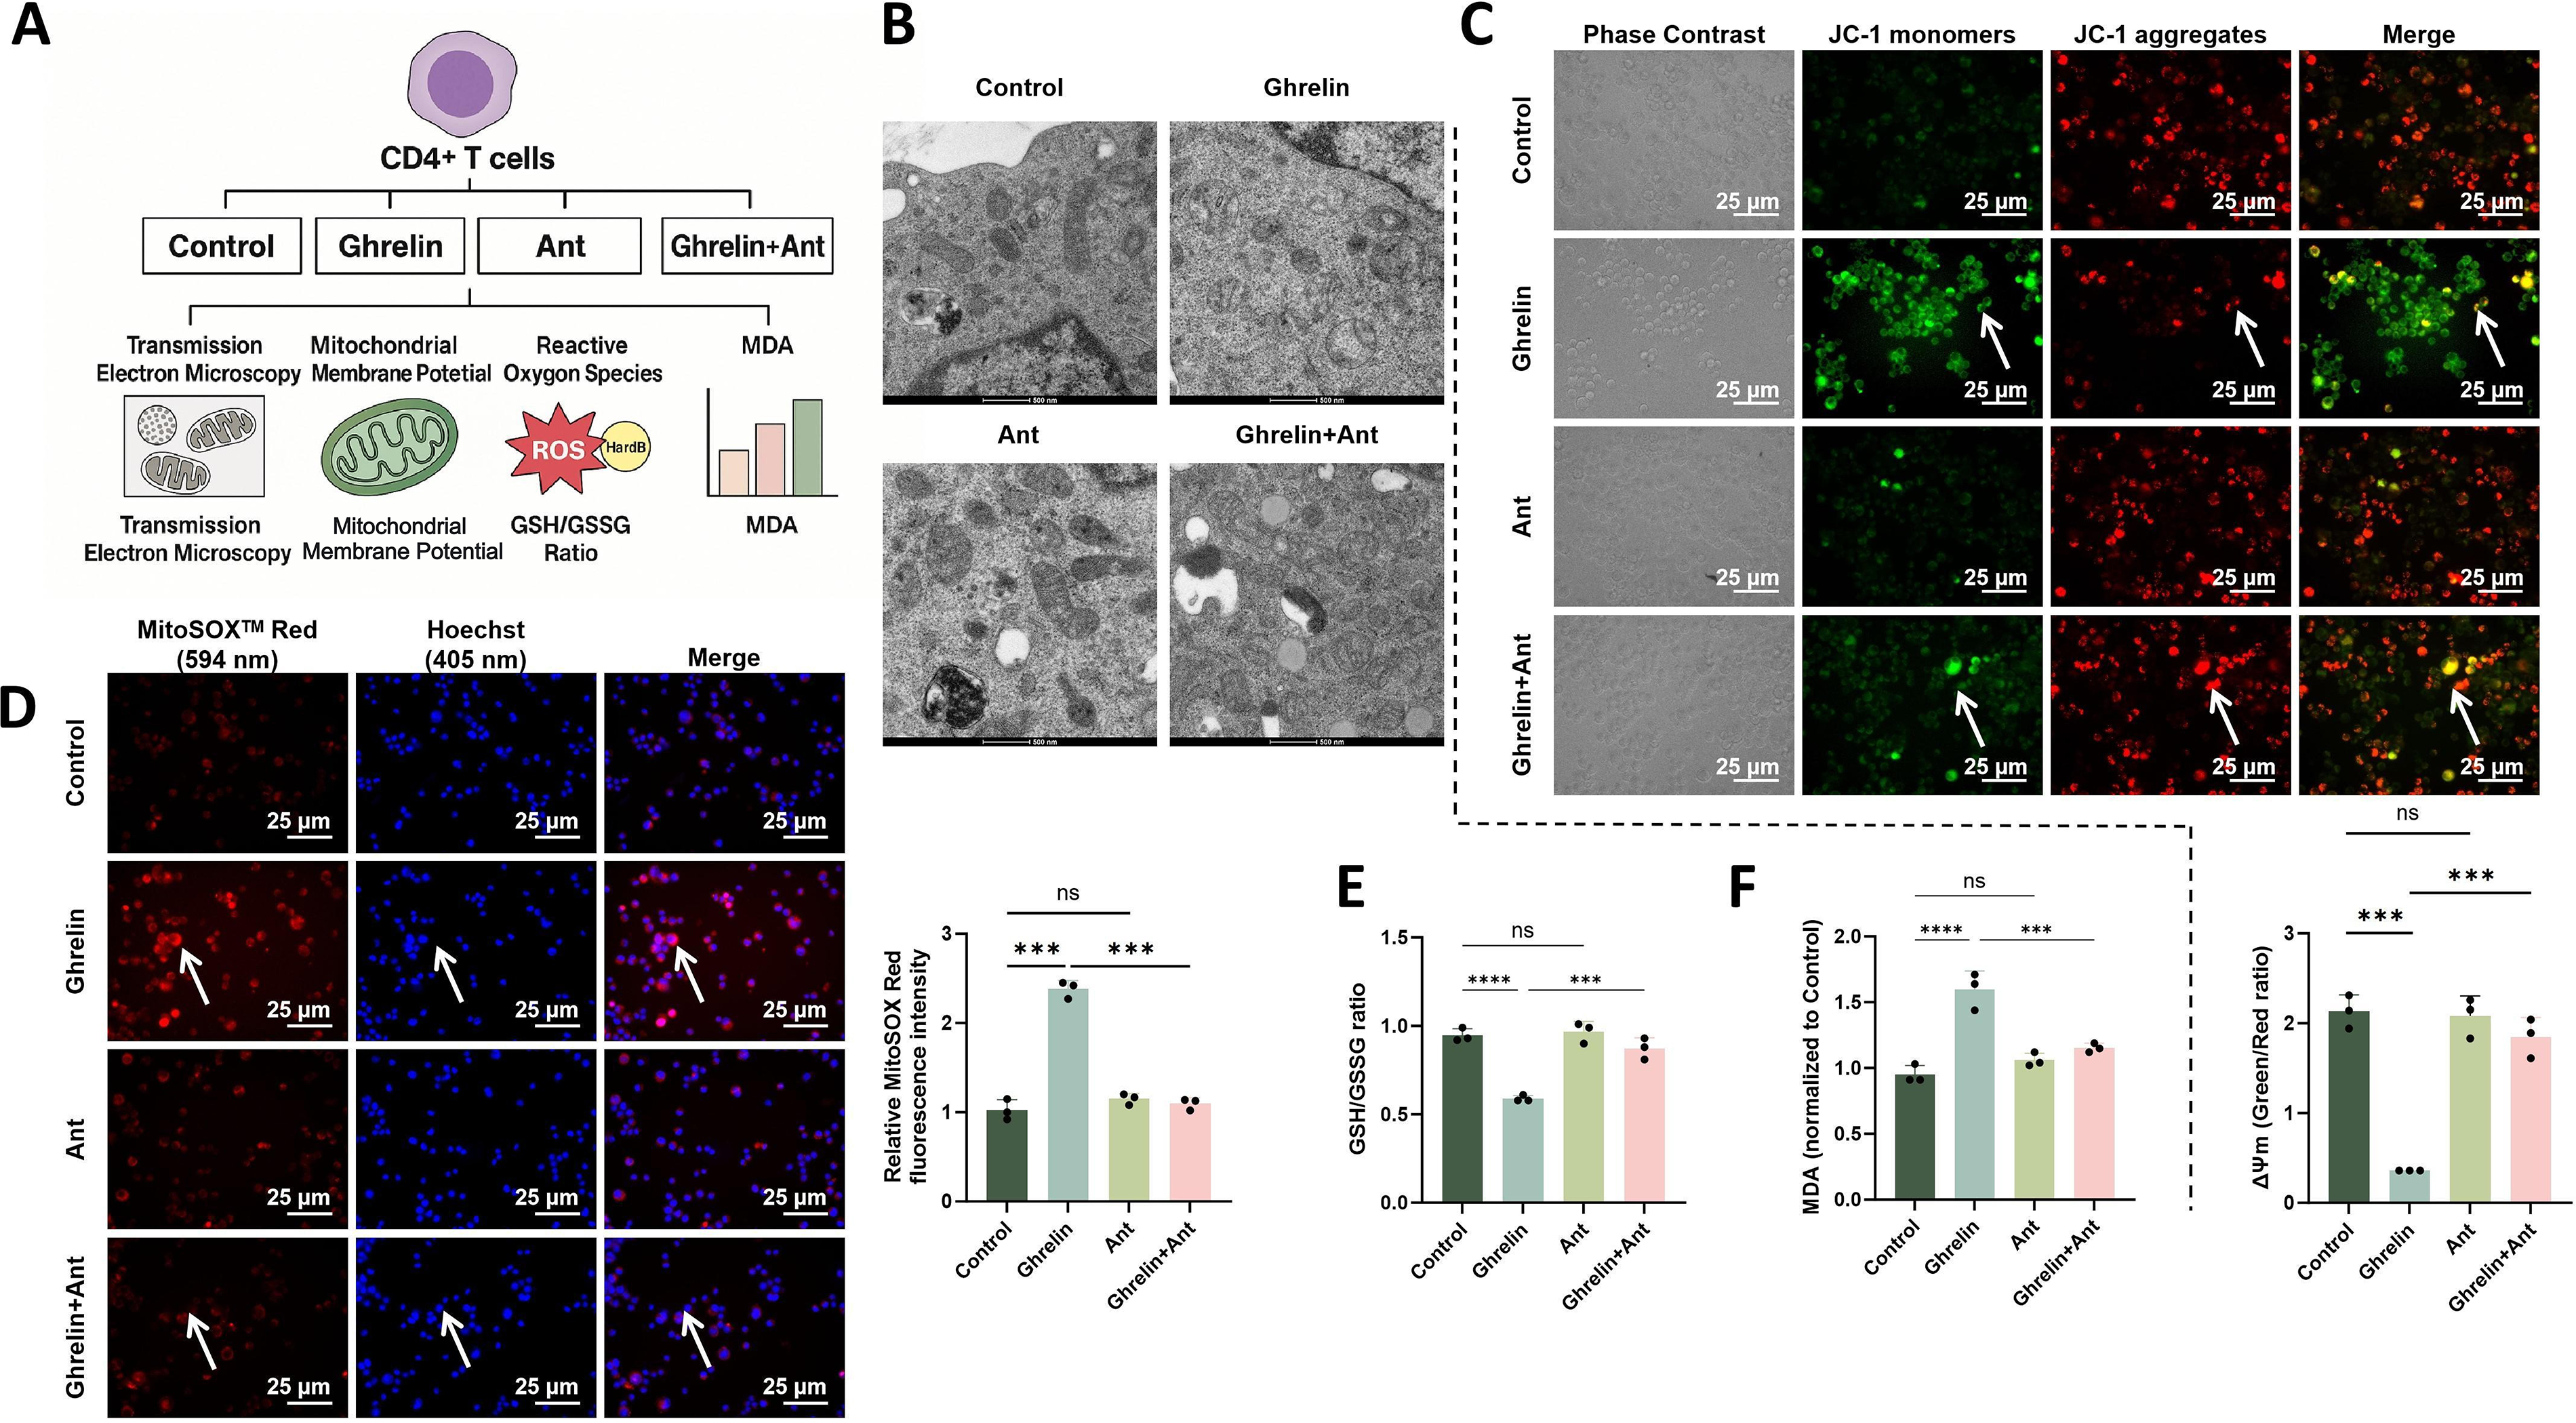
MitoSOX analysis revealed that Ghrelin markedly increased mitochondrial reactive oxygen species (ROS) accumulation, while Ant treatment significantly attenuated this oxidative signal (Fig. 5D). Analysis of oxidative stress-related metabolic markers further showed that Ghrelin reduced the glutathione (GSH)/oxidized glutathione (GSSG) ratio, indicating impaired antioxidant capacity, and increased malondialdehyde (MDA) levels, reflecting enhanced lipid peroxidation. These alterations were partially reversed by Ant treatment, which restored the GSH/GSSG ratio and reduced MDA levels toward control values (Fig. 5E, F).
Collectively, these results demonstrate that Ghrelin disrupts mitochondrial integrity in CD4+ T cells through the GHSR signaling axis, leading to membrane depolarization, excessive ROS production, impaired antioxidant defense, and increased lipid peroxidation. The protective effects of GHSR inhibition further support a central role for this pathway in maintaining mitochondrial homeostasis and redox balance.
Ghrelin promotes Th17 expansion, reduces Treg proportions, and alters the cytokine profile
To clarify the regulatory effects of Ghrelin on CD4+ T cell differentiation and cytokine production, flow cytometry was performed to quantify Th17 and Treg cell proportions. Ghrelin treatment significantly increased the proportion of Th17 cells while markedly reducing the proportion of Treg cells, indicating a shift toward a pro-inflammatory immune state (Supplementary Fig. S4A, B). In contrast, Ant treatment alone did not induce significant changes. However, cotreatment with Ghrelin and the antagonist largely reversed the increase in Th17 cells and the decrease in Treg cells, restoring their proportions to near-control levels.
Analysis of cytokines in the culture supernatant further showed that Ghrelin markedly increased the secretion of IL-17A and IFN-γ while suppressing IL-10 production, thereby establishing a distinct pro-inflammatory cytokine profile (Supplementary Fig. S4C–E). These alterations were significantly attenuated by co-administration of Ant, with cytokine levels returning toward those of the control group.
Together, these data indicate that the Ghrelin–GHSR signaling axis promotes Th17 expansion, suppresses Treg differentiation, and drives a cytokine shift characterized by increased IL-17A and IFN-γ and decreased IL-10. This remodeling disrupts CD4+ T cell subset homeostasis and skews the immune environment toward a pro-inflammatory phenotype, an effect that can be effectively blocked by GHSR inhibition.
SG suppresses the Ghrelin–GHSR axis and improves blood glucose, hepatic lipid accumulation, and islet α/β-cell balance
Under a consistent high-fat diet (HFD) background, SG markedly improved glucose and lipid metabolism at both systemic and organ levels. Oil Red O (ORO) staining of the liver revealed extensive lipid droplet accumulation in the Sham group, whereas the SG group showed a clear reduction in hepatic lipid deposition. Ghrelin supplementation partially reversed this improvement, while combined treatment with Ant resulted in the lowest degree of lipid accumulation and the most organized hepatic cord and sinusoidal architecture (Fig. 6A). Consistently, both body weight and fasting blood glucose levels showed a marked decline in the SG group. These effects were attenuated by Ghrelin supplementation but further enhanced by Ant treatment (Fig. 6B, C). In the glucose tolerance test (GTT), the SG and SG + Ant groups exhibited lower overall glucose curves, lower peak glucose levels, and more rapid return to baseline, whereas the SG + Gh group showed a higher curve than the SG group, and the Sham group displayed the highest and most prolonged peak (Fig. 6D). Similarly, in the insulin tolerance test (ITT), the SG and SG + Ant groups showed greater insulin sensitivity, as reflected by steeper declines and lower glucose nadirs. The SG + Gh group showed an intermediate response, whereas the Sham group exhibited the weakest glucose-lowering effect (Fig. 6E). Dual immunofluorescence staining for insulin and glucagon further showed that SG substantially restored islet architecture and α/β-cell balance, as indicated by enhanced β-cell signals and a relative reduction in α-cell signals. Ghrelin supplementation partially blunted this restoration, whereas Ant treatment produced the most pronounced recovery (Fig. 6F).
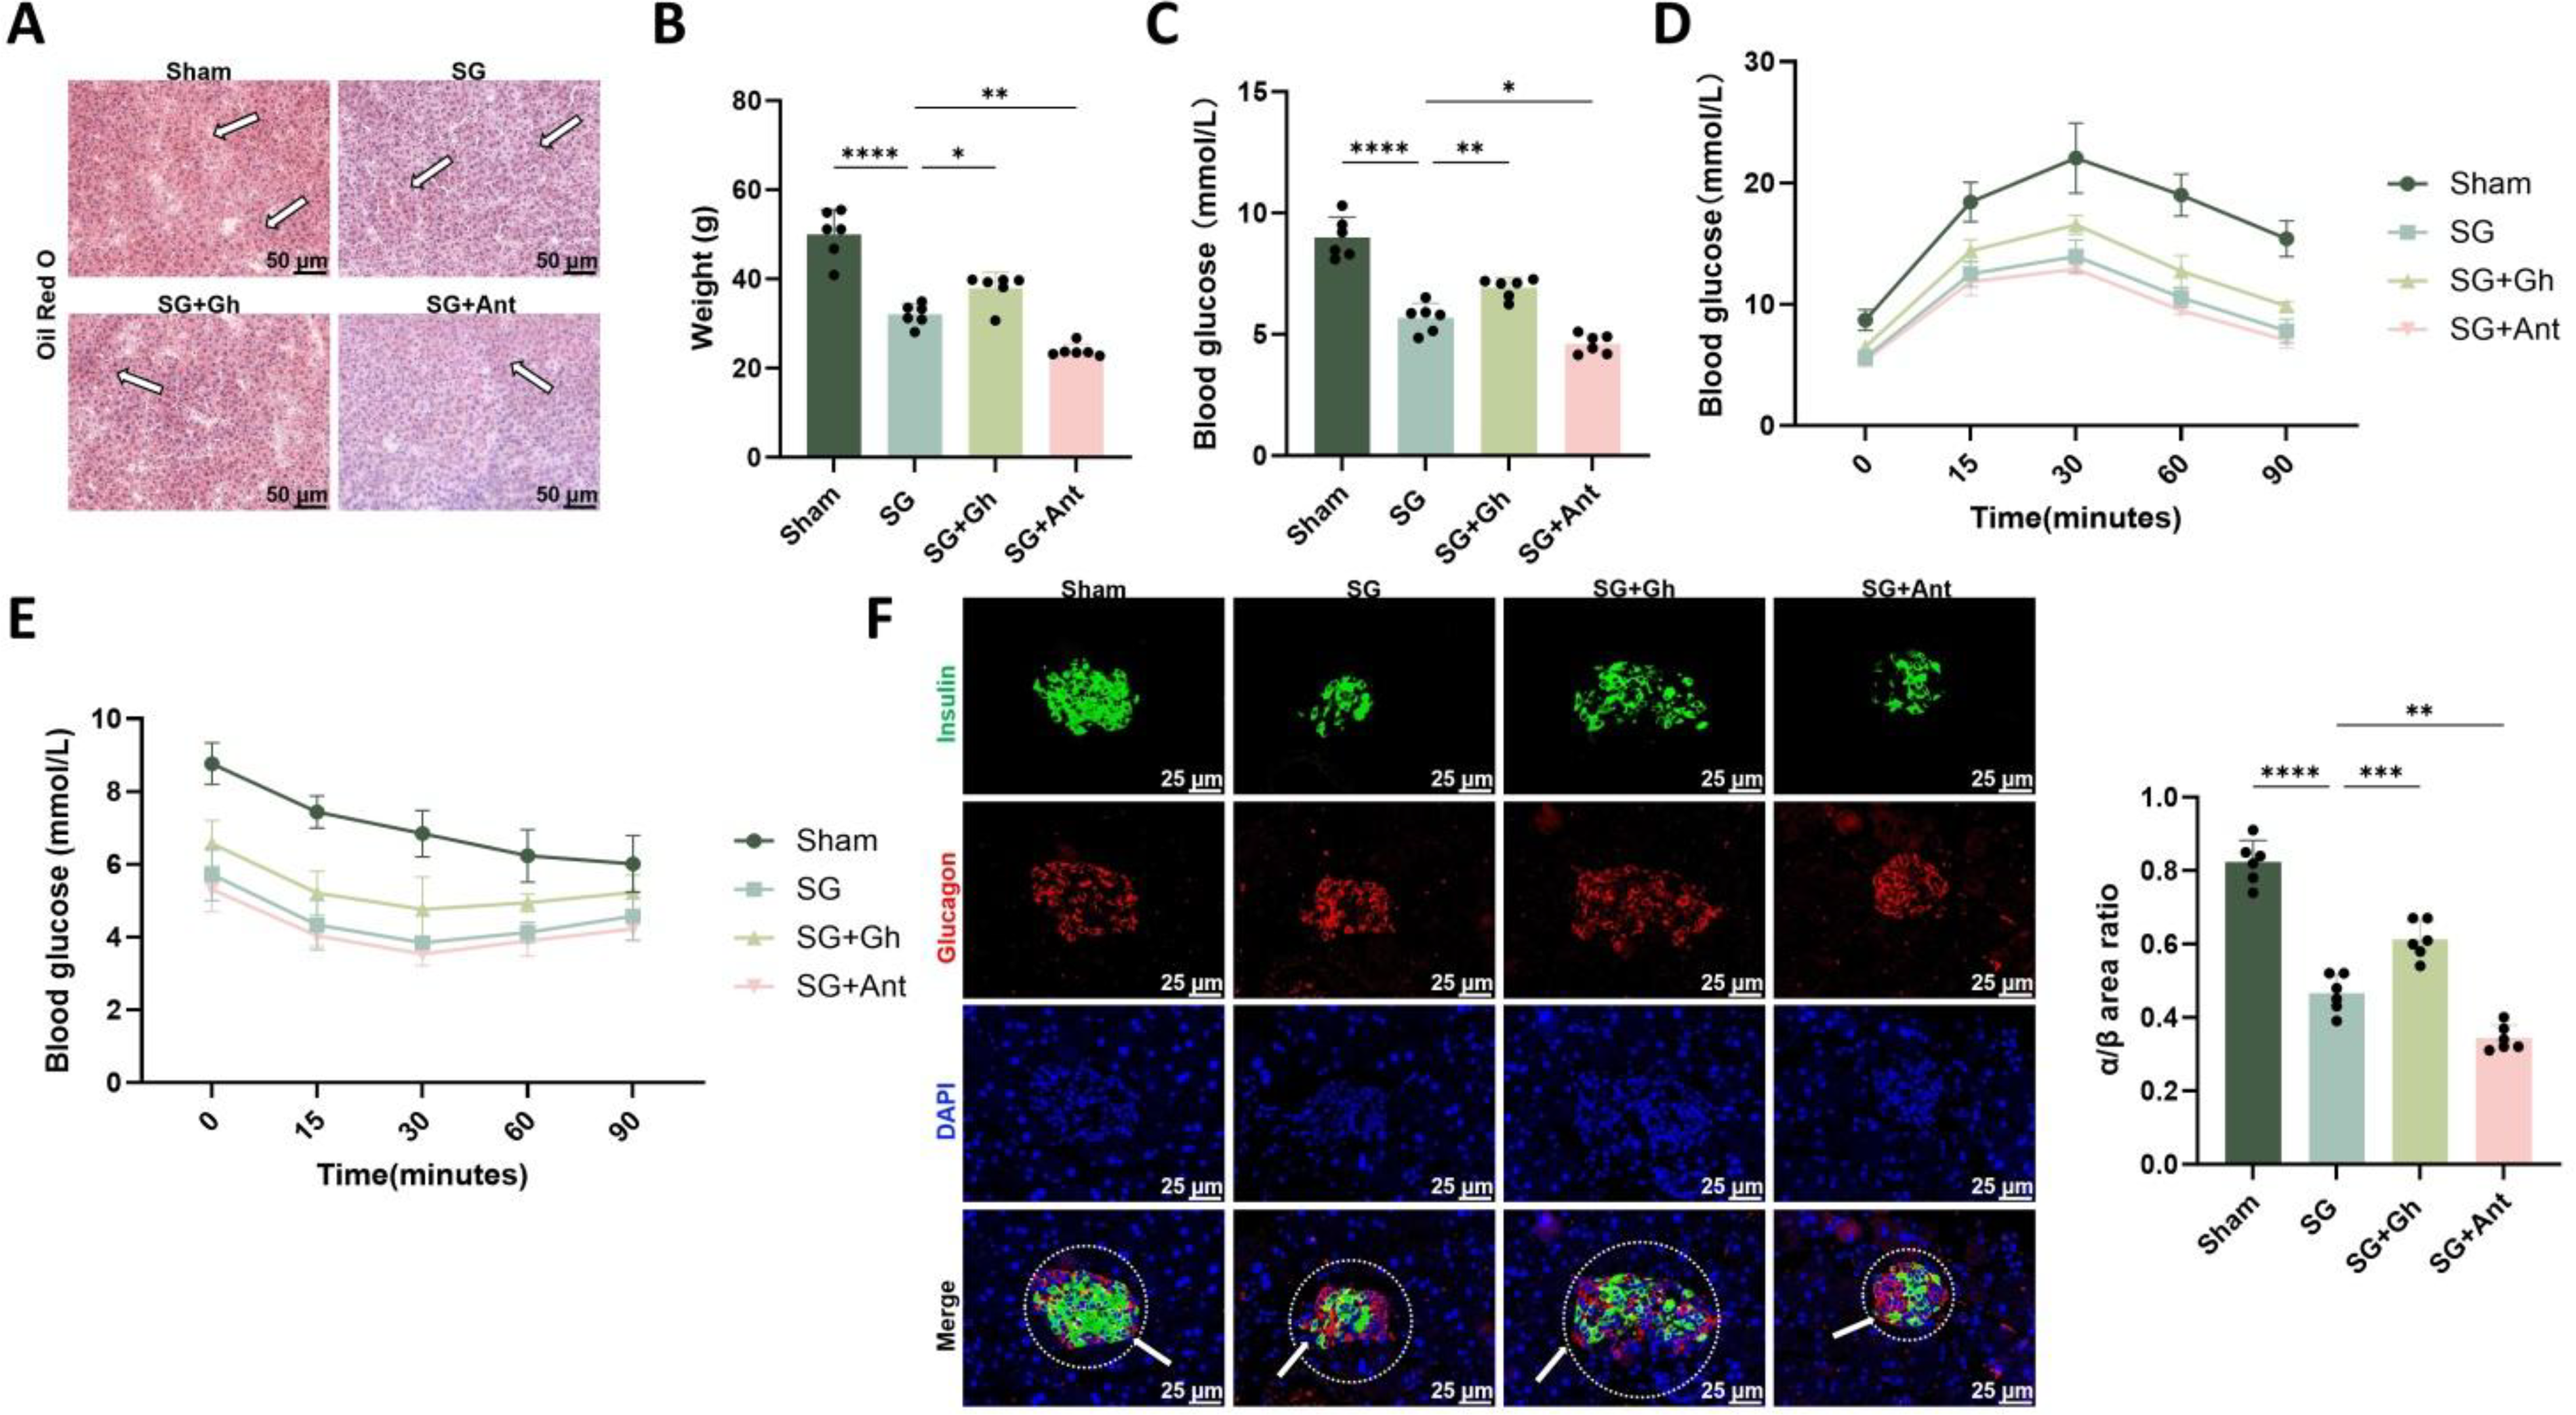
Overall, these results suggest that postoperative suppression of the Ghrelin–GHSR axis after SG is associated with multilevel metabolic improvement, including reduced body weight, improved glycemic control, decreased hepatic lipid accumulation, and restoration of islet structure and α/β-cell balance.
Postoperative activation of POMC neurons and suppression of AgRP
At the level of the arcuate nucleus, dual immunofluorescence staining revealed that the proportion of AgRP+/c-Fos+ double-positive neurons was significantly lower in the SG group compared with the Sham group. This proportion partially increased in the SG + Gh group, while further decreasing in the SG + Ant group (Fig. 7A). In contrast, the proportion of POMC+/c-Fos+ double-positive neurons was markedly elevated in the SG group, partially reversed in the SG + Gh group, and further enhanced in the SG + Ant group (Fig. 7B). At the molecular level, both RT-PCR and Western blot (WB) analyses consistently demonstrated upregulation of Pomc/pro-POMC and downregulation of AgRP and Ghsr/GHSR1a (Fig. 7C, D). These molecular changes were attenuated in the SG + Gh group and amplified in the SG + Ant group. Secretory analyses further confirmed this pathway remodeling: α-MSH levels were significantly elevated in hypothalamic tissue homogenates, with the SG + Ant group exhibiting the highest levels, whereas plasma acyl-Ghrelin remained low in both the SG and SG + Ant groups but increased markedly in the SG + Gh group (Fig. 7E, F).
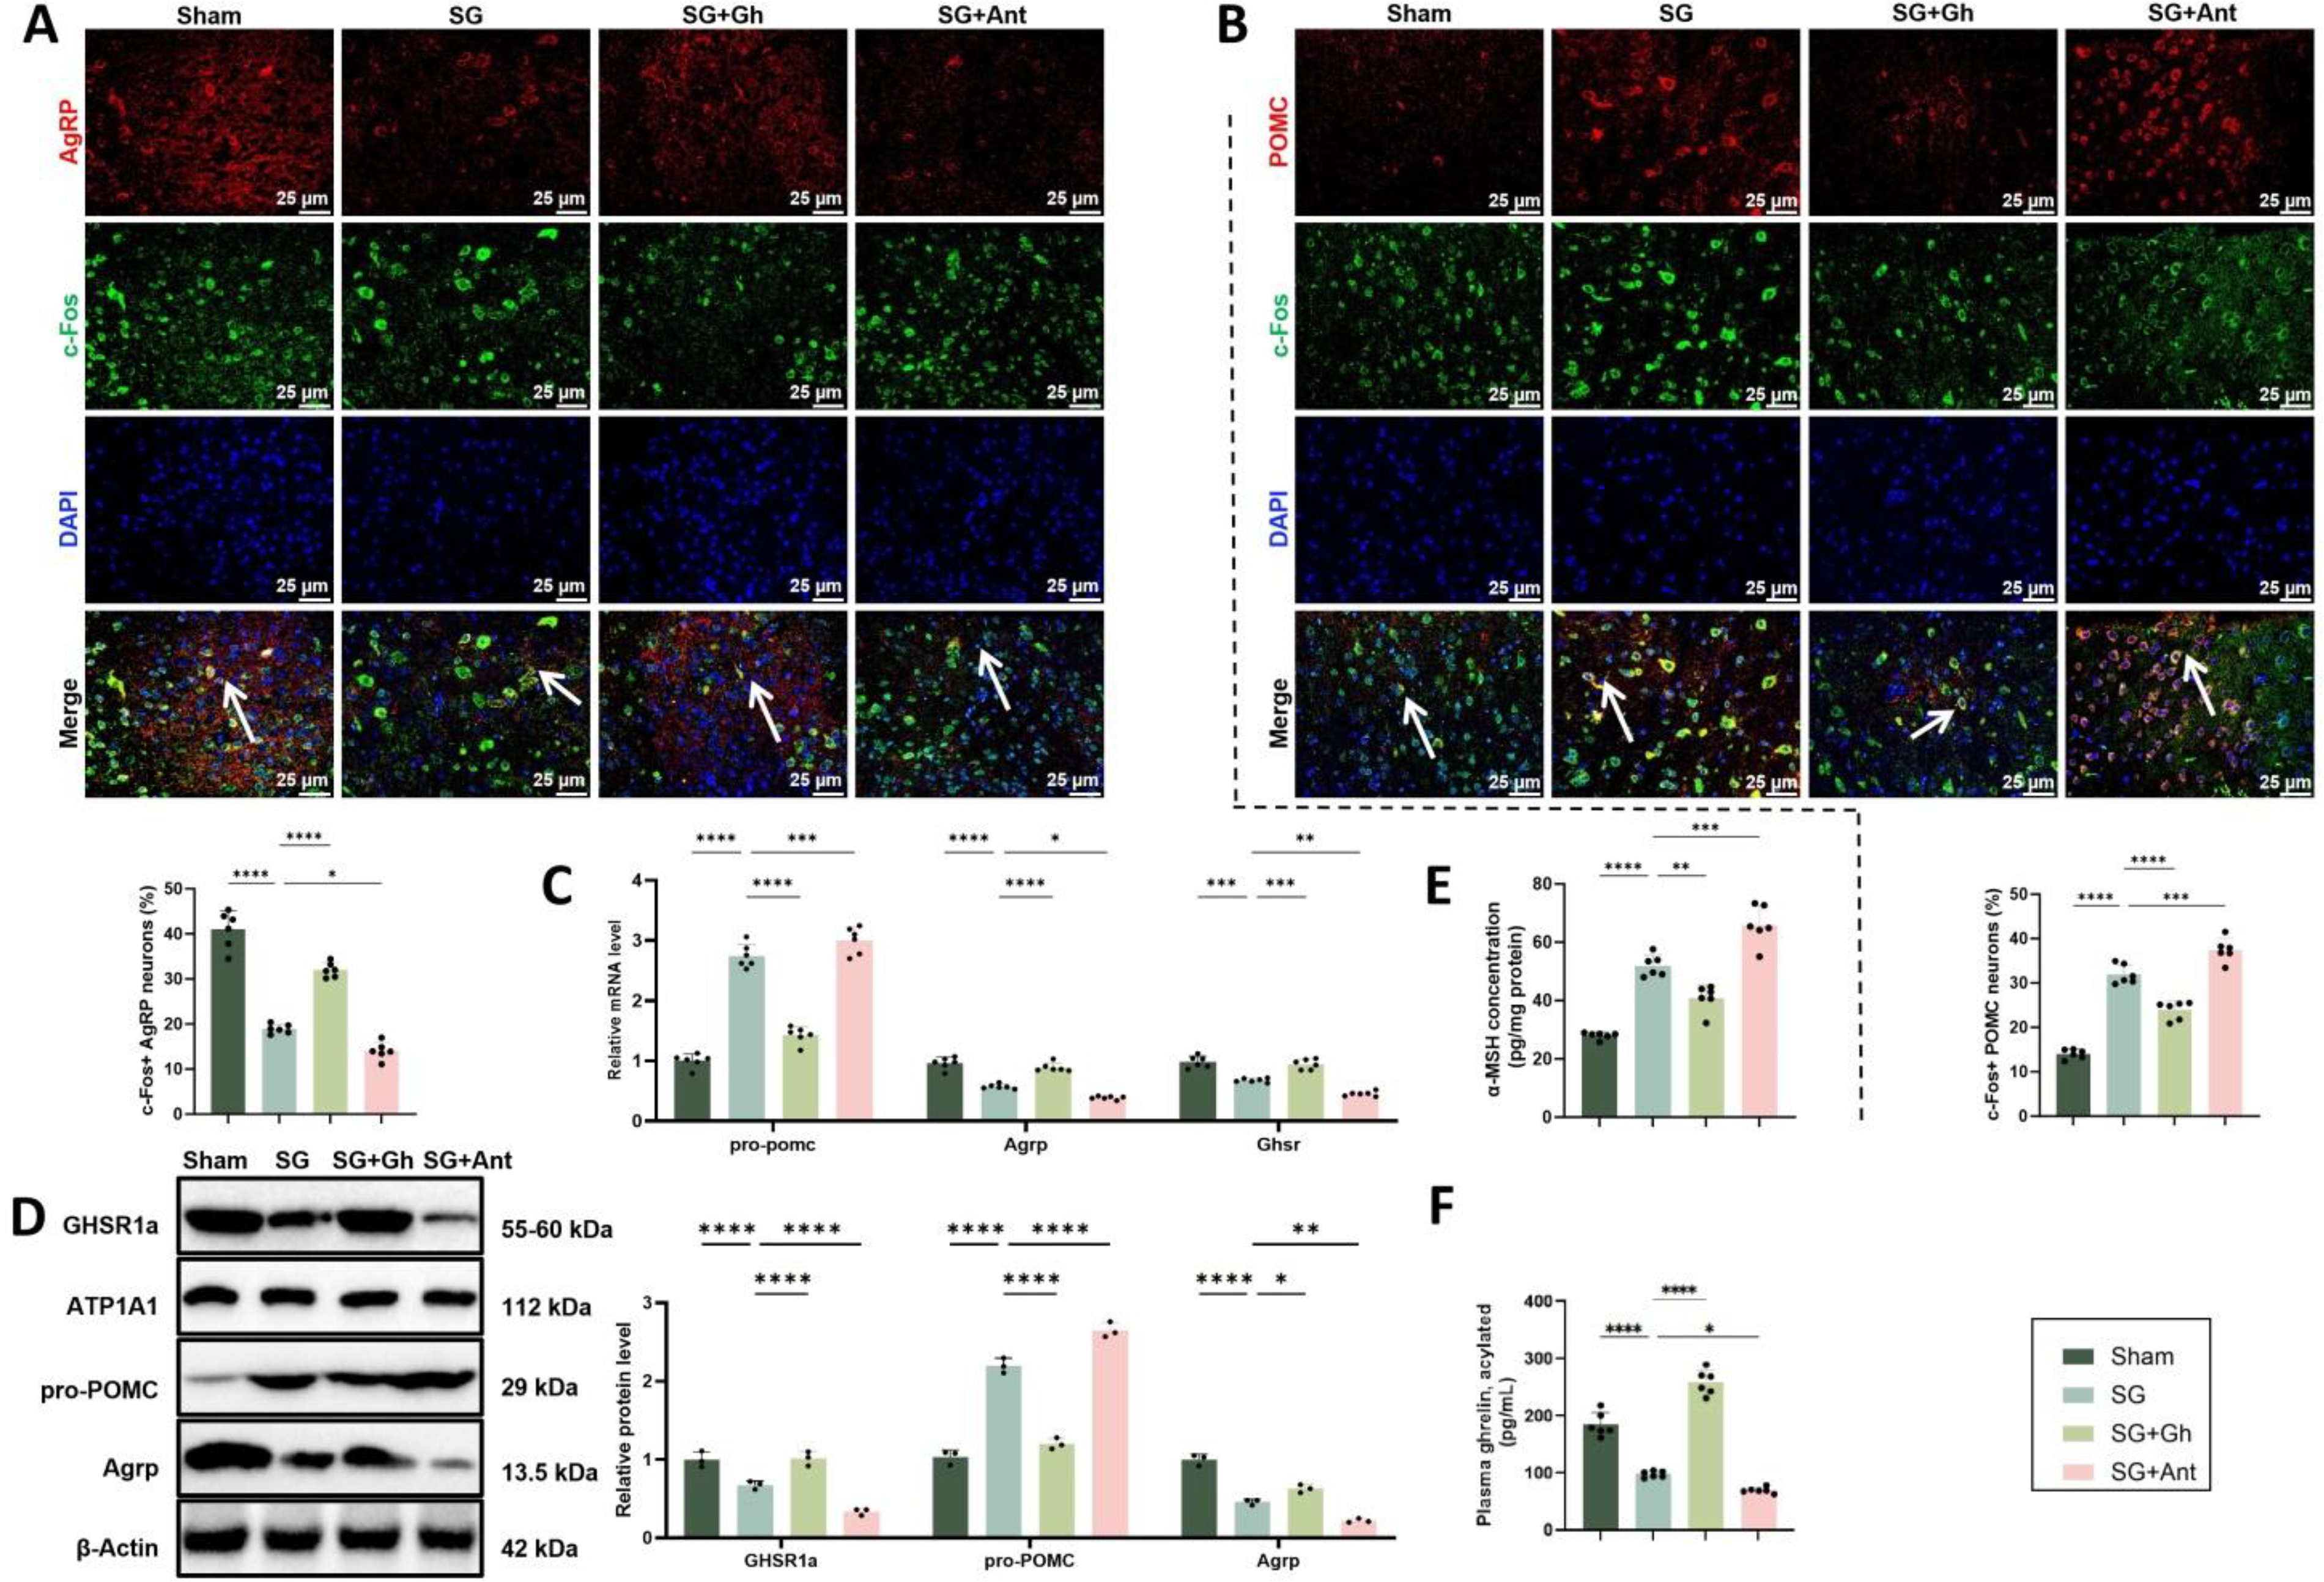
In summary, these findings suggest that postoperative suppression of the Ghrelin–GHSR axis is accompanied by inhibition of the orexigenic AgRP/NPY pathway and activation of the anorexigenic POMC/α-MSH pathway, indicating that this signaling axis may play an important role in regulating arcuate nucleus neuronal activity after SG.
SG enhances exploratory behavior and reduces anxiety-like phenotypes via Ghrelin–GHSR dependence
After confirming that SG activated POMC neurons and suppressed AgRP neurons, we next examined whether these central alterations were associated with behavioral changes. In the open-field test, SG-treated rats showed increased locomotor and exploratory activity, as indicated by longer total movement distances, broader spatial exploration, and more frequent entries into the center zone (Supplementary Fig. S5A–C). SG + Gh partially reversed these enhancements, whereas SG + Ant further amplified them. The light-dark box test yielded consistent findings: compared with Sham controls, SG rats spent more time in the light zone and entered it more frequently (Supplementary Fig. S5D–F). These anxiolytic effects were partially attenuated by Ghrelin and further enhanced by GHSR inhibition. Overall, these behavioral data indicate that SG promotes exploratory activity and alleviates anxiety-like phenotypes. The directional consistency between these behavioral changes and the alterations observed in the POMC/AgRP neural circuitry further supports a Ghrelin–GHSR-dependent mechanism.
SG reduces glycolysis and enhances mitochondrial coupling
Following animal grouping, preparation of splenic single-cell suspensions, and isolation of peripheral CD4+ T cells, Seahorse analysis was performed to evaluate cellular metabolic function (Fig. 8A). The ECAR curves showed that glycolytic flux after glucose and oligomycin injection was highest in the Sham group, reduced in the SG group, partially restored in the SG + Gh group, and lowest in the SG + Ant group. After 2-DG injection, ECAR in all groups rapidly returned to near-baseline levels (Fig. 8B). A similar pattern was observed for glycolytic reserve, which was highest in the Sham group, followed by SG + Gh, lower in SG, and lowest in SG + Ant (Fig. 8C). These findings suggest that SG redirects CD4+ T cell energy metabolism away from glycolysis and toward OXPHOS. Consistent with this interpretation, OCR analysis showed that the SG group had higher basal respiration and FCCP-stimulated maximal respiration than the Sham group. These increases were partially attenuated by Ghrelin supplementation and further enhanced by Ant treatment (Fig. 8D). ATP-linked respiration showed a similar trend, with the highest level in the SG + Ant group, followed by SG, whereas SG + Gh displayed an intermediate level between SG and Sham (Fig. 8E).
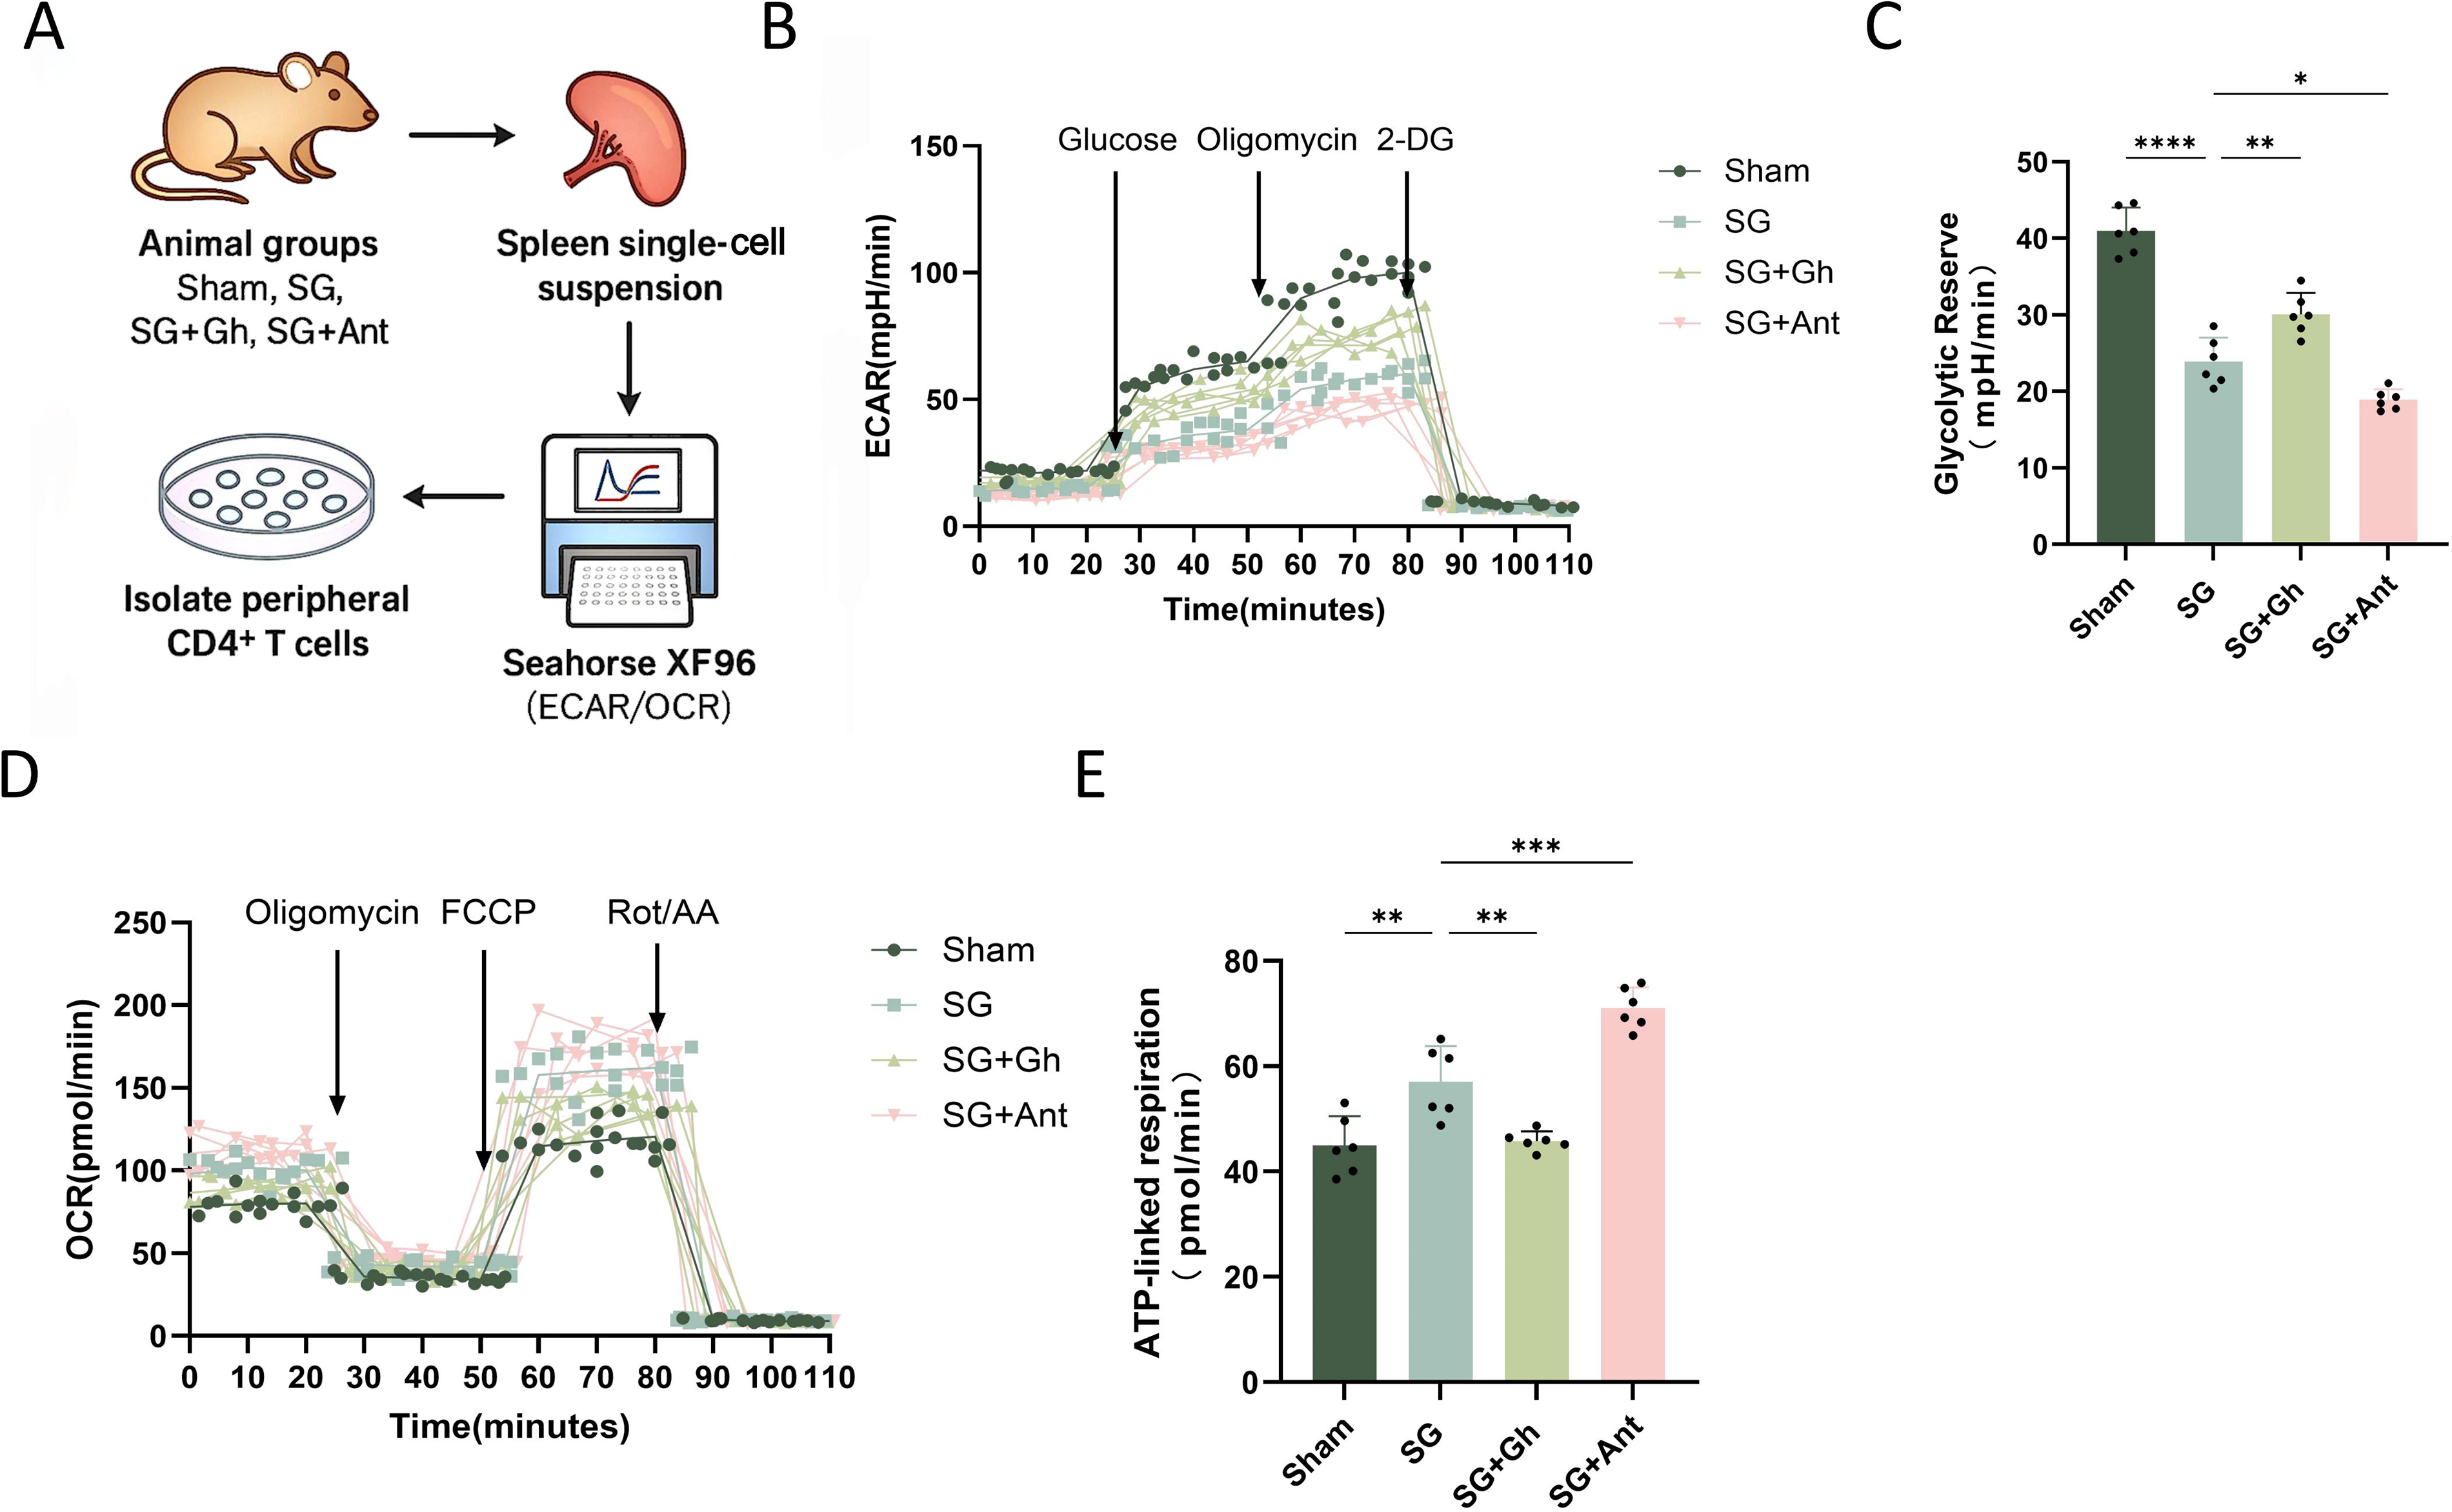
Overall, these results indicate that SG suppresses Ghrelin–GHSR signaling to reduce glycolytic dependence while enhancing mitochondrial coupling and ATP production. This metabolic restoration was attenuated by exogenous Ghrelin and further strengthened by GHSR inhibition.
SG regulates mitochondrial function and redox state of peripheral CD4+ T cells via Ghrelin–GHSR signaling
To determine whether changes in metabolic flux were accompanied by mitochondrial repair, ultrastructural and oxidative stress assessments were performed in splenic CD4+ T cells (Fig. 9A). TEM showed that mitochondria in the SG group exhibited denser and more organized cristae, with less swelling and vacuolization than those in the Sham group. These improvements were partially reversed by Ghrelin and further enhanced by Ant treatment (Fig. 9B). JC-1 staining showed that ΔΨm was increased in the SG group, partially reduced in the SG + Gh group, and highest in the SG + Ant group (Fig. 9C). Analysis of mitochondrial oxidative stress showed that MitoSOX fluorescence was markedly reduced after SG, partially restored by Ghrelin supplementation, and further decreased by Ant treatment (Fig. 9D). Concurrently, whole-cell antioxidant capacity was improved, as reflected by increased GSH/GSSG ratios in the SG and SG + Ant groups and reduced MDA levels, indicating decreased lipid peroxidation. The SG + Gh group again displayed an intermediate phenotype (Fig. 9E, F).
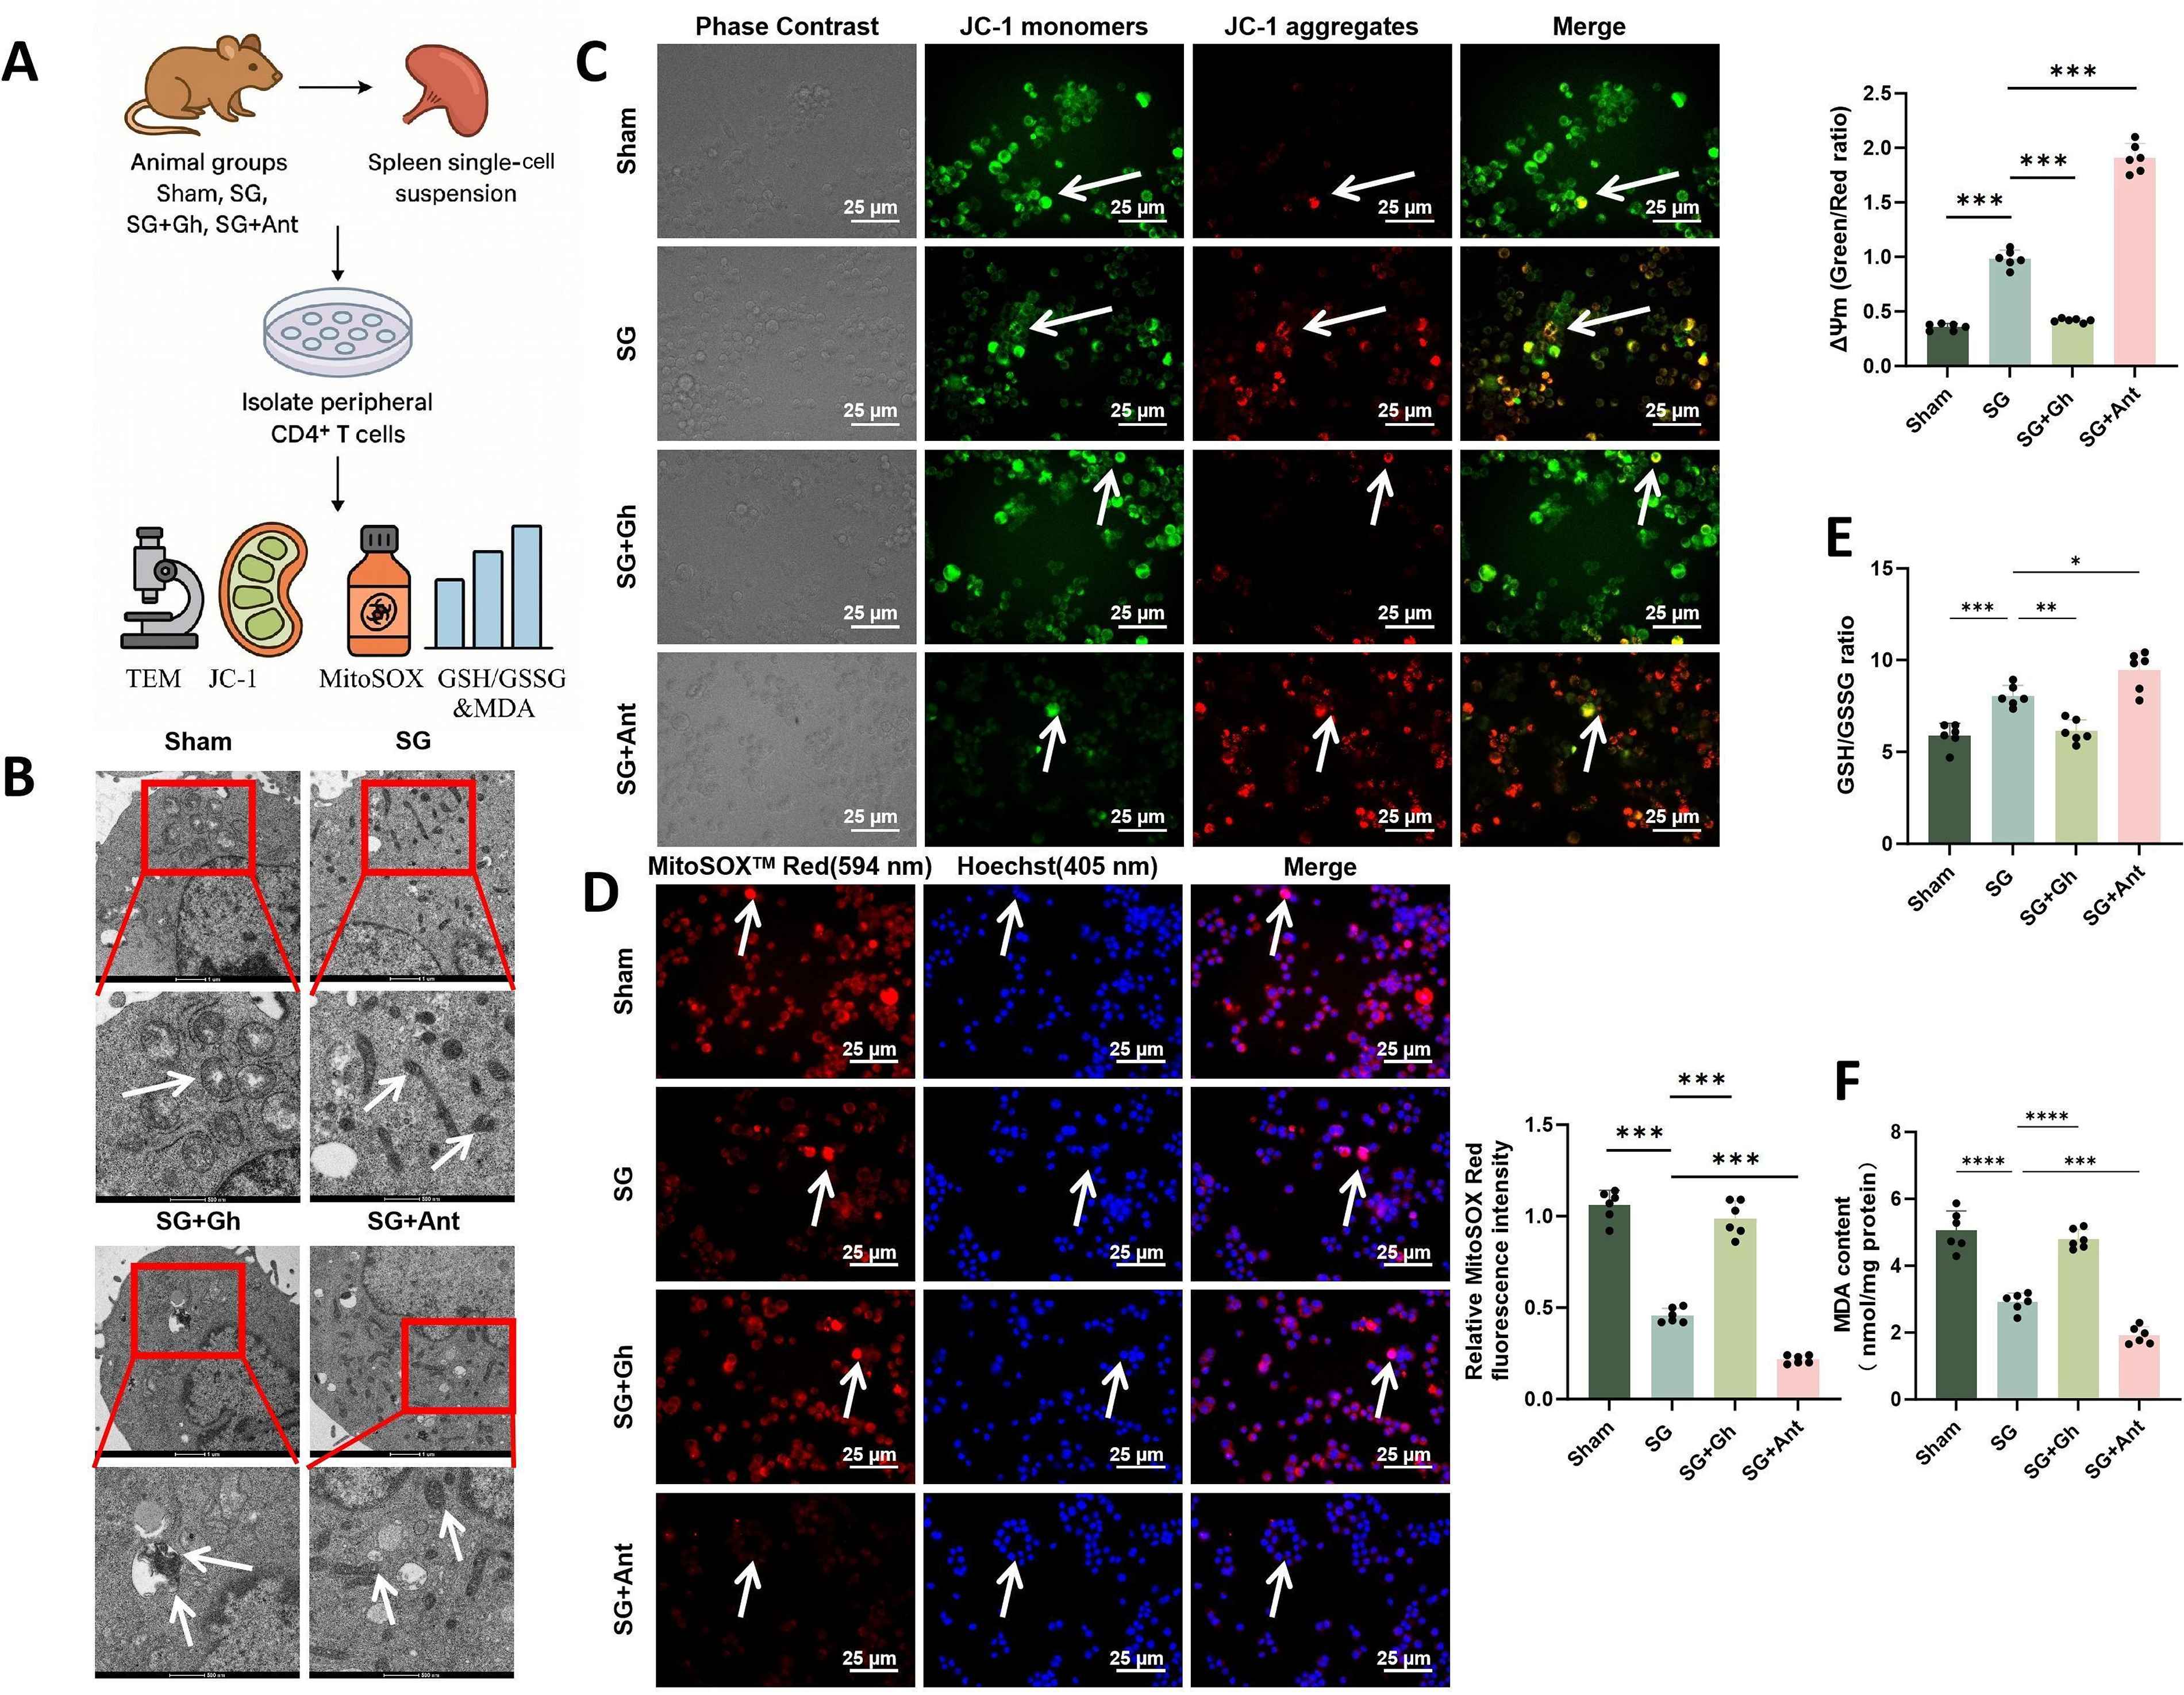
These findings, together with the Seahorse data, indicate that SG improves mitochondrial function and redox homeostasis in peripheral CD4+ T cells by inhibiting the Ghrelin–GHSR pathway. This effect is associated with restoration of ΔΨm, reduction of mitochondrial ROS, and enhancement of cellular antioxidant capacity, thereby supporting a stable shift from glycolysis toward oxidative metabolism.
SG regulates peripheral immune balance via the Ghrelin–GHSR axis
Flow-cytometric analysis of splenic CD4+ T cell subsets showed that SG significantly reduced the Th17+/CD4+ ratio while increasing the Treg+/CD4+ ratio. These changes were partially reversed by Ghrelin supplementation, whereas Ant treatment further decreased Th17-cell frequency and further increased Treg abundance beyond the levels observed with SG alone (Supplementary Fig. S6A, B). Consistent with these cellular changes, the plasma cytokine profile shifted from a pro-inflammatory to an anti-inflammatory pattern after SG. Specifically, IL-17A and IFN-γ levels were reduced, whereas IL-10 levels were increased. These effects were attenuated by Ghrelin supplementation and further enhanced by Ant treatment (Supplementary Fig. S6C–E).
These findings indicate that SG suppresses pro-inflammatory Th17 responses while promoting Treg-associated immune regulation through the Ghrelin–GHSR axis. This immune remodeling is accompanied by reduced pro-inflammatory cytokine production and enhanced anti-inflammatory signaling, consistent with a systemic shift toward immune homeostasis and tolerance.
SG induces remodeling of peripheral blood energy metabolism pathways
To assess the systemic metabolic effects of SG, peripheral blood metabolomic profiling was performed in the obesity-associated T2DM animal model before and after surgery. PCA revealed clear separation between the SG and T2DM groups along the PC1 and PC2 axes, indicating substantial differences in global metabolic profiles (Supplementary Fig. S7A). Differential metabolite analysis identified multiple significantly upregulated and downregulated metabolites, as illustrated in the volcano plot (Supplementary Fig. S7B). Pathway enrichment analysis showed that these metabolites were mainly involved in fatty acid degradation, branched-chain amino acid catabolism, glutathione metabolism, and the tricarboxylic acid (TCA) cycle (Supplementary Fig. S7C). Further metabolomic analysis showed that lactate, a key glycolytic product, was reduced in the SG group, suggesting suppression of glycolytic activity. In contrast, several TCA cycle intermediates, including α-ketoglutarate, citrate, and succinate, were significantly increased, indicating enhanced oxidative metabolism (Supplementary Fig. S7D). The heatmap further demonstrated distinct distribution patterns of differentially expressed metabolites between the two groups (Supplementary Fig. S7E).
Together, these findings demonstrate that SG induces broad remodeling of peripheral energy metabolism by coordinately regulating multiple pathways, including FAO, TCA cycle activity, and branched-chain amino acid metabolism.
Discussion
SG, one of the most widely performed metabolic surgeries, has been extensively validated in both clinical and animal studies for its efficacy in improving obesity and related metabolic disorders (Zheng et al., 2025; Aminian, 2018). Through an integrative strategy combining multiomics analyses with in vivo and in vitro experiments, the present study further suggests that the benefits of SG extend beyond reduced body weight or caloric intake. Specifically, SG appears to promote systemic metabolic remodeling through coordinated regulation of the neural-immune-metabolic axis. We found that SG was associated with suppression of Ghrelin–GHSR signaling, activation of hypothalamic POMC neural activity, restoration of peripheral CD4+ T cell metabolic programming and subset balance, and improvement of systemic glucose homeostasis and insulin sensitivity. These findings provide a plausible mechanistic explanation for the long-recognized clinical observation that metabolic improvement after SG often exceeds that expected from weight loss alone.
Ghrelin, widely known as the “hunger hormone,” has been extensively studied in the context of appetite regulation and energy homeostasis (Howick et al., 2017; Davis et al., 2020). Previous research has primarily focused on its activation of central feeding circuits via GHSR, with limited attention to its functions in immunometabolism (Noh et al., 2022; Gajewska et al., 2023). By integrating single-cell and transcriptomic analyses with animal experiments, our study consistently identified upregulation of the Ghrelin–GHSR pathway in obesity-associated T2DM, accompanied by disturbances in both energy metabolism and immune homeostasis. Compared with earlier work that primarily linked Ghrelin to diabetes risk, the present findings suggest a broader and more coherent role for Ghrelin–GHSR signaling in coordinating metabolic and immune remodeling across multiple biological layers. Although the causal hierarchy of these events remains to be fully established, the data support this pathway as a potentially important mediator of obesity-related metabolic dysfunction.
Hypothalamic POMC neurons are well established as a central hub for appetite suppression and energy expenditure (Saucisse et al., 2021). In the present study, alterations in POMC neuronal activity coincided with improvements in peripheral immune balance, suggesting that their role may extend beyond classical metabolic regulation. Previous studies have shown that neuropeptide signaling can modulate immune-cell activity through sympathetic and vagal pathways (Gajewska et al., 2023). Within this framework, it is plausible that the POMC-MC4R pathway serves as an important neuro-immune relay linking central nutrient sensing to peripheral immune regulation. This perspective provides a useful conceptual framework for understanding the systemic remodeling induced by SG.
Metabolic reprogramming of CD4+ T cells is increasingly recognized as a key determinant of chronic inflammation in diabetes (Shi et al., 2013; Cifuentes-Mendiola et al., 2022). Although Th17/Treg imbalance has been repeatedly implicated in obesity-associated low-grade inflammation, the upstream signals driving this imbalance remain incompletely understood (Wen et al., 2021). Our integrative analysis links the Ghrelin–GHSR axis to the metabolic state of CD4+ T cells, suggesting a close functional coupling between endocrine signaling and immune metabolism. This interpretation is consistent with the emerging concept of hormone-immune-metabolic coregulation (Noh et al., 2022). Moreover, evidence that Ghrelin regulates mitochondrial function and glycolytic activity provides a biologically plausible upstream basis by which this pathway may promote Th17/Treg disequilibrium and, conversely, by which SG may facilitate immune restoration.
The integrative multiomics analysis further strengthened the overall mechanistic framework. Convergent evidence from metabolomics, transcriptomics, and single-cell omics revealed a coordinated cross-system link among central signaling, metabolic alterations, and immune subset remodeling. Compared with single-omics studies, this multilayered evidence provides greater explanatory depth and supports the development of a more integrated neuro-immune-metabolic regulatory model, thereby offering a stronger basis for future mechanistic validation and clinical translation.
Previous clinical studies have shown that the metabolic benefits of SG often occur before substantial weight loss, suggesting the presence of weight-independent mechanisms. In the present study, hormonal intervention and multiomics analyses provide biological support for this observation, indicating that the Ghrelin–GHSR-POMC-immune axis may be engaged before overt changes in body weight become apparent. This framework not only accords with clinical findings but also underscores the importance of central-peripheral signaling in the metabolic effects of SG, highlighting the potential of hormone- or receptor-targeted adjunct strategies to enhance surgical efficacy.
The brain-immune-metabolic perspective proposed in this study may also provide conceptual insights into other metabolic interventions. Conventional interpretations of pharmacological therapy and metabolic surgery have largely emphasized gastrointestinal effects or reduced caloric intake. Our findings suggest that these interventions may also exert broader systemic effects through neuro-immune communication pathways. This perspective may open new directions for the development of metabolic therapies, particularly in drug discovery and the optimization of surgical strategies. Moreover, the finding that GHSR antagonism enhanced the effects of SG highlights the translational potential of combining surgery with pharmacological modulation in the treatment of metabolic disease.
It is also noteworthy that both the Ghrelin–GHSR and POMC-MC4R pathways have been implicated in the tumor microenvironment and in resistance to immunotherapy. Our findings raise the possibility of a mechanistic intersection between metabolic surgery and cancer immunotherapy through shared immune-metabolic regulatory pathways. This potential overlap may encourage cross-disciplinary investigation at the interface of metabolic disease and tumor immunology and may further support the adjunctive use of metabolic interventions in cancer treatment.
At the same time, the regulatory model proposed in this study, the Ghrelin–GHSR-neural-immune-metabolic axis, should not be interpreted as excluding alternative mechanisms. First, SG is a surgical intervention, and perioperative stress responses, including sympathetic activation and glucocorticoid elevation, may independently influence immune-cell differentiation and metabolic states. Second, postoperative reductions in food intake and negative energy balance could themselves reshape metabolite profiles and immune activity. Third, SG is known to rapidly alter the gut microbiota, which may independently affect T cell differentiation, short-chain fatty acid production, and systemic inflammation. Therefore, some of the observed changes may reflect parallel or interacting mechanisms rather than exclusive mediation through the Ghrelin–GHSR axis. Future studies incorporating pair-feeding, weight-matched controls, antistress interventions, and microbiota transplantation will be necessary to more precisely dissect these contributions.
Several additional limitations should also be acknowledged. First, the central mechanistic inferences of this study were derived primarily from a murine model of obesity-associated T2DM. Although the integrated data support a relatively coherent Ghrelin–GHSR-centered neuro-immune-metabolic framework, direct human validation is still lacking. Second, the omics sample size was limited: peripheral blood bulk RNA-seq was performed in only three mice per group, and scRNA-seq included only one sample from each of the SG and control groups. Accordingly, the observed transcriptional patterns and immune-cell compositional changes should be considered exploratory and require validation in larger cohorts and independent datasets. Moreover, because bulk RNA-seq was generated from mixed peripheral blood cell populations, the observed differential expression and enrichment results may reflect both cell-intrinsic transcriptional changes and shifts in leukocyte composition. Given that scRNA-seq already suggested postoperative immune remodeling, the enrichment of pathways such as OXPHOS, PPAR signaling, and insulin signaling should not be interpreted solely as intrinsic metabolic reprogramming. Future studies should incorporate cell-type deconvolution and compositional adjustment to better resolve the origins of bulk transcriptional signals. Third, mechanistic validation of the Ghrelin–GHSR axis relied mainly on pharmacologic intervention. Although JMV2959 showed directionally consistent effects in vivo and in vitro and opposed or reversed the effects of exogenous Ghrelin, the present data should be interpreted as pharmacologic support for GHSR involvement rather than definitive evidence of target specificity. Future work should therefore include Ghsr loss-of-function models, structurally independent antagonists, and systematic PK/PD and target-engagement analyses. Finally, the current design does not fully disentangle the contributions of postoperative weight loss, reduced caloric intake, perioperative stress, and microbiota remodeling from those of Ghrelin–GHSR signaling. Thus, the present findings more strongly support this axis as an important candidate mediator of SG-induced systemic remodeling than as the sole independently validated causal pathway.
In conclusion, supported by multiomics analyses and functional experiments, this study suggests that postoperative suppression of Ghrelin–GHSR signaling is associated with altered hypothalamic POMC neuronal activity, remodeling of CD4+ T cell metabolism and subset composition, and improvement of systemic metabolic homeostasis. These findings provide important clues for understanding the mechanisms of SG and extend the role of Ghrelin beyond that of a simple orexigenic hormone. More broadly, they support a cross-organ neuro-immune-metabolic framework that may inform future precision strategies for obesity-associated T2DM.
Materials and Methods
SG animal model
Male C57BL/6J mice (n = 219, 20–22 g, 8 weeks old) were purchased from Beijing Vital River Laboratory Animal Technology Co., Ltd. Animals were housed under specific pathogen-free conditions at 22°C ± 2°C and 50%–60% relative humidity under a 12-h light/dark cycle, with free access to food and water. All procedures were approved by the Institutional Animal Ethics Committee (Approval No. 2025156) and were conducted in accordance with ARRIVE guidelines and international standards for the care and use of laboratory animals. Mice were acclimated for 1 week before experimentation.
To induce obesity and insulin resistance, mice were fed an HFD (60% kcal from fat) for 10 weeks and then randomly assigned to the Sham, SG, SG + Ghrelin, and SG + GHSR antagonist (Ant) groups (n = 10 per group). The SG + Ghrelin group received synthetic Ghrelin (100 μg/kg; 551-10, Tocris Bioscience, USA) by daily intraperitoneal injection for 4 weeks after surgery. The SG + Ant group received the GHSR antagonist JMV2959 (3 mg/kg; HY-U00433, MedChemExpress, USA) by daily intraperitoneal injection for 4 weeks. Block randomization was used for group allocation, and investigators were blinded during surgery and data collection. Because the study included behavioral, histological, molecular, and multiomics endpoints, not all randomized animals were used for every assay. The final sample size for each experiment was determined according to the predefined allocation scheme and quality-control criteria and is provided in the corresponding figure legends. For behavioral assays, only animals completing the full testing workflow and meeting predefined quality-control criteria were included. Animals with persistent immobility, interrupted locomotor tracking, instrument failure, or abnormal postoperative recovery were excluded according to prespecified criteria.
SG was performed using a standard minimally invasive procedure. Under inhaled isoflurane anesthesia (2%–3%), ∼70% of the greater curvature of the stomach was resected while preserving the tubular gastric remnant along the lesser curvature. Postoperative analgesia was provided by subcutaneous ibuprofen (5 mg/kg every 12 h for 48 h), and prophylactic ceftezole (20 mg/kg) was administered for 3 days. Mice were housed individually after surgery and maintained on a liquid diet for 48 h before gradual reintroduction of a standard diet. Body weight, food intake, and general condition were monitored throughout recovery.
Bulk RNA-seq
Peripheral blood was collected in EDTA-coated tubes (BD Vacutainer) from SG mice (n = 3) and T2DM control mice (n = 3) at postoperative week 8 via the retro-orbital venous plexus. Blood cells were isolated by centrifugation at 1500 g for 10 min at 4°C and lysed in TRIzol reagent (Invitrogen, USA). Total RNA was purified using the RNeasy Mini Kit (Qiagen, Germany) and treated with DNase I. RNA integrity was assessed with the Agilent 2100 Bioanalyzer, and only samples with RNA integrity number (RIN) ≥ 7.0 were included. RNA concentration and purity were determined using NanoDrop 2000 and Qubit 4.0, with acceptable A260/A280 ratios of 1.8–2.1.
Poly(A)+ mRNA was enriched using the NEBNext Poly(A) mRNA Magnetic Isolation Module (NEB, USA), and libraries were prepared using the NEBNext Ultra II RNA Library Prep Kit (NEB, USA). After fragmentation, cDNA synthesis, adapter ligation, and PCR amplification, libraries were purified with AMPure XP beads (Beckman Coulter), yielding an average insert size of ∼350 bp. Libraries passing RT-PCR and Bioanalyzer quality control were sequenced on the Illumina NovaSeq 6000 platform using paired-end 150-bp reads.
Raw FASTQ files were evaluated using FastQC (v0.11.9) and MultiQC (v1.14). Adapter sequences and low-quality bases were removed using Trimmomatic (v0.39) with a sliding window of 4:Q20 and a minimum read length of 36 bp. Clean reads were aligned to the mouse reference genome GRCm39 (Gencode M31 annotation) using STAR (v2.7.11a). Gene-level counts were generated with featureCounts (Subread v2.0.3) using the parameters -p -s 0 -t exon -g gene_id while excluding multi-mapped reads and rRNA sequences. Samples with alignment rates ≥90%, normal gene-body coverage, and acceptable library complexity were retained.
Transcriptome data normalization
Raw count data were normalized in DESeq2 (v1.42.0) using the median-of-ratios method to account for sequencing depth and RNA composition. A variance-stabilizing transformation (VST) was then applied to the normalized matrix for downstream visualization and distance-based analyses.
PCA of transcriptome data
The VST-transformed expression matrix was subjected to unsupervised PCA using the prcomp function in base R with center = TRUE and scale. = TRUE. The first 20 principal components were retained, and two-dimensional score plots were generated using PC1 and PC2.
Differential expression analysis
Differentially expressed genes (DEGs) were identified in DESeq2 using a generalized linear model with Wald testing. p-Values were adjusted using the Benjamini–Hochberg method. Genes with false discovery rate (FDR) <0.05 and |log2 fold change| ≥ 1 were considered significant. To reduce noise, only genes with counts per million (CPM) > 1 in at least half of the samples were included. Volcano plots were generated using ggplot2 (v3.5.1).
Functional enrichment and pathway analysis
GO and KEGG enrichment analyses were performed using clusterProfiler (v4.10.0). GO enrichment was conducted separately for biological process, cellular component, and molecular function using enrichGO, with annotation based on org.Mm.eg.db (v3.18.0). All detected genes were used as the background set. Enrichment significance was evaluated with the hypergeometric test and adjusted by the Benjamini–Hochberg method; FDR < 0.05 was considered significant. Redundant GO terms were reduced using the simplify function with a similarity cutoff of 0.7.
KEGG pathway analysis was performed using enrichKEGG with species set to Mus musculus (mmu), and all detected genes were used as background. Significant GO and KEGG results were visualized using enrichplot and ggplot2.
scRNA-seq
Peripheral blood was collected from SG mice (n = 1) and T2DM control mice (n = 1) at postoperative week 8 after a 6-h morning fast. Following red blood cell lysis (BioLegend RBC Lysis Buffer), samples were filtered through a 40-μm cell strainer. Single-cell suspensions were processed using the 10x Genomics Chromium Single Cell 3′ v3.1 platform, targeting 8000–10,000 cells per sample. Libraries were prepared according to the Chromium Next GEM Single Cell 3′ Reagent Kits protocol and sequenced on the Illumina NovaSeq 6000 platform with paired-end 150-bp reads.
FASTQ files were aligned to the mm10 reference genome using Cell Ranger (v7.1.0) to generate gene-cell expression matrices. Data were analyzed in Seurat (v4.3.0; R 4.3.1). Low-quality or artifact-prone cells were excluded according to the following criteria: mitochondrial gene content >10%, hemoglobin gene content >5%, fewer than 200 or more than 6000 detected genes, or abnormally extreme nCount_RNA values. Data were normalized using SCTransform, followed by variable-feature selection and dimensionality reduction.
Batch correction across samples was performed using Harmony (v0.1.1). PCA was conducted, and the top 30 principal components were used for downstream analysis. Clustering was performed using FindNeighbors and FindClusters at a resolution of 0.8, and cell populations were visualized by UMAP. Cell identities were manually assigned based on canonical marker genes.
Differential expression and pathway analysis
Within the CD4+ T cell compartment, differentially expressed genes between SG and T2DM groups were identified using Seurat’s FindMarkers function with the Wilcoxon rank-sum test. Genes with |log2 fold change| ≥ 0.25 and FDR <0.05 were considered significant. GO and KEGG enrichment analyses were performed using clusterProfiler (v4.10.0), with species set to mmu and significance defined as FDR <0.05.
Subclustering and pseudotime analysis
Annotated CD4+ T cells were extracted from the full single-cell dataset and reanalyzed in Seurat. Data were renormalized using SCTransform while regressing out mitochondrial and hemoglobin gene effects. Highly variable genes were identified, followed by PCA. The top 20 principal components were used for secondary clustering with FindNeighbors and FindClusters at a resolution of 0.8. Clusters were visualized by UMAP and annotated using canonical markers.
For pseudotime analysis, reclustered CD4+ T cell data were imported into Monocle2 (v2.24.0; R 4.3.1). A CellDataSet object was generated using the Seurat-normalized expression matrix and cell annotations, with expression modeled by a negative binomial distribution. Size-factor normalization and dispersion estimation were performed using estimateSizeFactors and estimateDispersions. Genes with minimum dispersion >0.5 were selected for trajectory inference. Dimensionality reduction was performed using reduceDimension with reduction_method = “DDRTree,” and cells were ordered along pseudotime using orderCells.
Single-cell metabolic pathway activity scoring
Pathway activity scores for OXPHOS, FAO, glycolysis, and mTORC1 signaling were calculated using Seurat’s AddModuleScore function. Gene sets for OXPHOS, glycolysis, and mTORC1 signaling were obtained from the Hallmark collection, and the FAO gene set was derived from KEGG_FATTY_ACID_METABOLISM. All gene sets were downloaded from the Molecular Signatures Database (MSigDB) and converted to mouse gene symbols.
Metabolomics sequencing
Peripheral blood (∼0.5 mL per mouse) was collected from SG (n = 6) and T2DM control (n = 6) mice at postoperative week 8 following a 6-h morning fast. Blood was collected into EDTA tubes, placed immediately on ice, processed within 30 min, and stored at −80°C. A total of 12 plasma samples were subjected to metabolomic profiling.
Metabolomic analysis was performed using an Ultimate 3000 UHPLC system coupled to a Q Exactive Plus mass spectrometer (Thermo Fisher Scientific). Chromatographic separation was achieved on an ACQUITY UPLC HSS T3 column (2.1 × 100 mm, 1.8 μm; Waters). The mobile phase consisted of 0.1% formic acid in water (A) and 0.1% formic acid in acetonitrile (B), using a 30-min gradient: 0–2 min, 5% B; 2–20 min, 5%–95% B; 20–25 min, 95% B; 25–26 min, 95%–5% B; 26–30 min, 5% B. The flow rate was 0.3 mL/min, and the column temperature was maintained at 40°C. Mass spectra were acquired in positive and negative ion modes with spray voltages of 3.5 kV and −2.8 kV, capillary temperature of 320°C, and a scan range of m/z 70–1050 at 70,000 resolution.
Raw data were processed with Compound Discoverer (v3.2) for peak extraction, retention-time alignment, denoising, and missing-value imputation. Only metabolites with relative standard deviation <30% in quality-control samples were retained. Signal intensities were normalized by Pareto scaling, and batch effects were corrected using QC-based robust LOESS signal correction (QC-RLSC).
PCA and differential metabolite analysis
Processed metabolite matrices were imported into MetaboAnalyst (v5.0) for unsupervised PCA to assess overall metabolic separation and within-group reproducibility. For differential analysis, relative metabolite abundances were compared between groups using two-tailed Student’s t-tests followed by Benjamini–Hochberg correction. Variable importance in projection (VIP) scores were derived from partial least squares discriminant analysis (PLS-DA). Metabolites with VIP > 1 and FDR <0.05 were considered significantly altered.
Pathway enrichment analysis of differential metabolites
Significantly altered metabolites were mapped to KEGG pathways. Enrichment analysis was performed using the hypergeometric test with Benjamini–Hochberg correction, and FDR <0.05 was considered significant. Pathway impact scores based on compound topology were also calculated to identify key pathways associated with energy metabolism.
CD4+ T cell isolation and culture
Spleens were collected from 8- to 10-week-old male C57BL/6J mice under sterile conditions. Single-cell suspensions were generated by mechanical dissociation through a 70-μm cell strainer, followed by red blood cell lysis. CD4+ T cells were isolated using a negative-selection kit (B90001, STEMCELL Technologies, Canada), yielding purity >90%, as confirmed by flow cytometry using CD3 and CD4 staining.
Cells were cultured in RPMI-1640 supplemented with 10% fetal bovine serum (FBS), 1% penicillin-streptomycin, and 50 μM β-mercaptoethanol at 37°C in 5% CO2. T cell activation was induced with anti-CD3 and anti-CD28. Anti-CD3 antibody (2 μg/mL, 17-0031-82, Thermo Fisher, USA) was precoated onto 24-well plates overnight at 4°C, and soluble anti-CD28 antibody (1 μg/mL, 16-0281-82, Thermo Fisher, USA) was added at the start of culture. Cells were stimulated for 48–72 h.
Cell grouping and treatment
Activated CD4+ T cells were randomly assigned to four groups: Control, Ghrelin, Ant, and Ghrelin + Ant. The Ghrelin group received synthetic Ghrelin at 100 nM for 24 h. The Ant group received JMV2959 at 10 μM. In the Ghrelin + Ant group, cells were pretreated with JMV2959 for 30 min before Ghrelin administration. Ghrelin concentration and exposure duration were identical to those used in the Ghrelin-only group.
Peripheral CD4+ T cell isolation
After treatment, mice were euthanized between 09:00 and 11:00, and spleens were collected under sterile conditions. Tissues were dissociated in precooled PBS containing 2% FBS and filtered through a 70-μm strainer. Red blood cells were lysed with ACK buffer for 2–3 min at room temperature, and the reaction was stopped by centrifugation at 300 g for 5 min. After one PBS wash and Fc-blocking for 10 min, CD4+ T cells were purified using magnetic negative selection (Miltenyi CD4+ T Cell Isolation Kit). Purity was assessed by CD3+CD4+ flow cytometry, and viability was measured by trypan blue exclusion or 7-AAD staining. Only samples with purity and viability ≥90% were used.
Seahorse analysis of glycolysis and mitochondrial respiration
Cellular metabolic function was assessed using the Seahorse XF Extracellular Flux Analyzer (Agilent Technologies). Cells were seeded at 1 × 10⁵ cells per well. One hour before measurement, culture medium was replaced with unbuffered Seahorse XF Base Medium supplemented with 10 mM glucose, 2 mM glutamine, and 1 mM pyruvate, followed by incubation under CO2-free conditions. For glycolysis assays, ECAR was measured after sequential injections of glucose (10 mM), oligomycin (1 μM), and 2-deoxyglucose (2-DG, 50 mM). For mitochondrial respiration assays, OCR was measured after sequential injections of oligomycin (1 μM), FCCP (1 μM), and rotenone/antimycin A (0.5 μM). All values were normalized to total protein content or cell number per well.
TEM of mitochondrial ultrastructure
To evaluate mitochondrial ultrastructure, CD4+ T cells (1–2 × 10⁶ cells per sample) were collected and fixed in 2.5% glutaraldehyde in 0.1 M phosphate buffer (pH 7.4) at 4°C for at least 2 h. Samples were washed in phosphate buffer, postfixed in 1% osmium tetroxide for 1 h, dehydrated in graded ethanol, infiltrated with propylene oxide/epoxy resin, and embedded in epoxy resin. After polymerization at 60°C for 48 h, ultrathin sections (70–80 nm) were cut, mounted on nickel grids, and stained with 2% uranyl acetate and 0.3% lead citrate. Images were acquired using a JEOL JEM-1400 TEM at 80 kV.
Measurement of ΔΨm using JC-1 fluorescent probe
ΔΨm was assessed using the JC-1 fluorescent probe (C2006, Beyotime, China). CD4+ T cells were suspended in HBSS without phenol red or surfactants and seeded at 1.0 × 10⁵ cells per well in black-walled, clear-bottom 96-well plates. After 30 min of equilibration, cells were incubated with JC-1 working solution (5 μM) at 37°C for 30 min in the dark, washed twice, and equilibrated for an additional 10 min. Imaging was performed by confocal microscopy with excitation at 488 nm and fluorescence collection in the green (530 ± 15 nm) and red (590 ± 20 nm) channels. Identical acquisition settings were used for all samples.
MitoSOX Red detection of mitochondrial superoxide anion (O2−)
Mitochondrial superoxide was measured using MitoSOX Red (S0061M, Beyotime, China). Cells were resuspended in serum-free, phenol red-free imaging buffer and seeded at 1.0 × 10⁵ cells per well in black-walled, clear-bottom 96-well plates. After equilibration, cells were incubated with MitoSOX Red (5 μM) for 20 min at 37°C in the dark, washed twice, and further equilibrated for 10 min. Images were acquired on a Leica SP8 confocal microscope with excitation at 561 nm and emission collection at 579–620 nm.
GSH/GSSG ratio measurement
To assess cellular redox capacity, cell lysates were prepared in ice-cold PBS and centrifuged at 12,000 g for 10 min at 4°C. GSH and GSSG levels were measured using a commercial GSH/GSSG assay kit (S0053, Beyotime, China). Protein concentrations were first normalized to 1–2 mg/mL using the BCA assay. Samples were then divided into two aliquots: one for total GSH measurement and the other treated with 2-vinylpyridine to mask reduced GSH for selective GSSG quantification. Both aliquots were reacted with 5,5′-dithiobis-(2-nitrobenzoic acid) (DTNB), and absorbance was measured at 412 nm. Total GSH and GSSG concentrations were calculated from standard curves, and the GSH/GSSG ratio was used to reflect intracellular redox status. Results were expressed as μmol/g protein.
Malondialdehyde content measurement
Lipid peroxidation was assessed in cell or tissue homogenate supernatants using an MDA colorimetric assay kit (S0131M, Beyotime, China). Samples were mixed with thiobarbituric acid (TBA) reagent and incubated in a 95°C water bath for 40 min to generate MDA-TBA adducts. The reaction was then immediately terminated in an ice bath, followed by centrifugation to remove precipitates. Absorbance was measured at 532 nm, and MDA concentrations were calculated using a standard curve. Results were normalized to protein concentration and expressed as nmol/mg protein. Each sample was analyzed in technical duplicate with blank controls, and protein concentrations were determined by the BCA assay.
Flow-cytometric analysis of CD4+ T cell immunophenotypes
Following experimental treatment, CD4+ T cells were harvested and washed twice with prechilled PBS. Cells were incubated with Fixable Viability Dye eFluor™ 506 (Thermo Fisher Scientific) for 15 min at room temperature in the dark to exclude dead cells. After washing, cells were resuspended in PBS containing 2% FBS and stained with fluorophore-conjugated surface antibodies: anti-CD3 (17-0031-82, Thermo Fisher, USA), anti-CD4 (11-0041-82, Thermo Fisher, USA), and anti-CD25 (12-0251-82, Thermo Fisher, USA), followed by a 30-min incubation at 4°C in the dark. Subsequently, cells were fixed and permeabilized using the Foxp3/Transcription Factor Staining Buffer Set (eBioscience) and stained intracellularly with anti-Foxp3 (17-5773-82, Thermo Fisher, USA) and anti-IL-17A (12-7177-81, Thermo Fisher, USA) antibodies for 45 min to identify Treg (CD4+CD25+Foxp3+) and Th17 (CD4+IL-17A+) subsets, respectively.
Data acquisition was performed on a BD LSRFortessa™ flow cytometer, with voltage settings and compensation established using FACSDiva v8.0. Doublets and dead cells were excluded during analysis, and CD3+CD4+ cells were used as the parent population for quantification of Th17 and Treg subsets. Gating thresholds were established using isotype controls, single-stain compensation tubes, and fluorescence-minus-one controls. Final data were analyzed using FlowJo v10.8 and expressed as Th17+/CD4+ (%) and Treg+/CD4+ (%) cell proportions.
ELISA measurement of inflammatory cytokines
Cell culture supernatants were centrifuged at 300 g for 10 min to remove debris, immediately aliquoted, and stored at −80°C until analysis. Concentrations of IL-10, IFN-γ, and IL-17A were measured using commercial enzyme-linked immunosorbent assay (ELISA) kits (R&D Systems). Briefly, samples and standards (100 μL per well) were added to precoated 96-well plates, incubated at 37°C, and subjected to sequential washing, enzyme-conjugate incubation, and colorimetric substrate development.
Oil Red O staining
Hepatic lipid accumulation was assessed by ORO staining (C0157M, Beyotime, China). The left liver lobe was excised immediately after sacrifice, rinsed in prechilled PBS, blotted dry, embedded in OCT compound, rapidly frozen in isopentane cooled with liquid nitrogen for 30–60 s, and stored at −80°C. Cryosections (8–10 μm) were cut at −20°C, mounted on Superfrost Plus slides, and air-dried for 10 min at room temperature. Sections were fixed in 4% paraformaldehyde for 10 min, washed with PBS, and equilibrated in 60% isopropanol for 1–2 min. The ORO stock solution was prepared as 0.5% (w/v) in anhydrous isopropanol, filtered through a 0.45-μm membrane, and left to stand for 24 h. Immediately before use, the working solution was prepared by mixing stock solution with deionized water at a 3:2 (v/v) ratio and filtering again. Sections were stained for 10–15 min at room temperature in the dark, briefly differentiated in 60% isopropanol for 5–15 s, and rinsed with distilled water. Nuclei were counterstained with Mayer’s hematoxylin for 30–60 s or with DAPI (1 μg/mL) for 5 min, followed by bluing in tap water for 1–2 min. Slides were mounted with glycerol gelatin or another aqueous mounting medium to prevent lipid dissolution.
Monitoring of body weight and fasting blood glucose
To evaluate the metabolic effects of SG, body weight was measured at postoperative week 8 using a calibrated electronic balance with a precision of 0.1 g. Fasting blood glucose was measured after a 6-h morning fast with free access to water. Tail-tip blood was collected, and glucose levels were determined using a handheld glucometer (Accu-Chek Performa, Roche Diagnostics). Each mouse was measured twice, and the average value was recorded. To minimize external interference, all measurements were performed under identical ambient conditions and with minimal handling stress.
Glucose tolerance test
At postoperative week 8, a GTT was performed to assess glucose clearance. Mice were fasted for 12 h with free access to water. After baseline blood glucose was measured from tail-tip blood, sterile glucose solution (2 g/kg body weight) was administered intraperitoneally. Blood glucose levels were then recorded at 15, 30, 60, and 90 min after injection. Glucose solutions were freshly prepared and maintained at 37°C, and all injections were performed by the same experimenter to minimize operator-dependent variability.
Insulin tolerance test
An ITT was conducted at postoperative week 8 to assess insulin sensitivity. Mice were fasted for 6 h before baseline blood glucose was measured via tail-tip sampling. Recombinant human insulin (0.75 U/kg body weight, Novo Nordisk) was administered intraperitoneally, followed by blood glucose measurements at 15, 30, 60, and 90 min. During the test, mice were maintained in a thermally controlled environment and minimally handled to ensure stable glucose readings.
Open-field test
Spontaneous exploratory activity and anxiety-like behavior were assessed using the open-field test in a dedicated behavioral testing room. The apparatus consisted of an opaque square arena (40 × 40 × 40 cm) with gray walls and a matte floor, illuminated uniformly at 30–40 lux. The central zone was defined as a virtual 20 × 20 cm2. Mice were acclimated to the testing room (22°C ± 2°C; background noise <55 dB) for 30 min before testing. The test order was randomized, and both the experimenter and data analyst were blinded to group allocation. Each mouse was gently placed in a corner of the arena and allowed to explore freely for 10 min. Locomotor activity was recorded using ANY-maze (Stoelting) or EthoVision XT (Noldus), including total distance traveled, average velocity, time spent in the center, number of center entries, thigmotaxis, and immobility duration. The arena was cleaned with 70% ethanol between trials to remove olfactory cues. Mice were excluded according to predefined criteria if they jumped out of the arena, climbed the walls for more than 20% of the test duration, or if more than 10% of tracking data were lost because of signal failure.
Light-dark box test
Approach-avoidance conflict behavior was further evaluated using a two-chamber light-dark box. The light compartment (20 × 20 × 20 cm3) had white matte walls and floor illumination of ∼400 lux, whereas the dark compartment (20 × 20 × 20 cm3) had black walls and illumination below 5 lux. The two compartments were connected by a 5 × 5 cm2 opening. Mice were acclimated to the behavioral testing room for 30 min before testing. Each mouse was placed in the dark compartment and allowed to explore freely for 5 min. Tracking was performed using the same recording system as in the open-field test and synchronized with video recording. Primary parameters included time spent in the light compartment, number of light entries, latency to first entry into the light compartment, total transitions between compartments, total distance traveled, and average velocity. The apparatus was cleaned with 70% ethanol between trials. Mice were excluded according to predefined criteria if they remained immobile in the dark corner for more than 80% of the session or if equipment failure interrupted trajectory recording.
Immunofluorescence
To assess postoperative POMC neuronal activity in the hypothalamic arcuate nucleus, mouse brains were collected and fixed in 4% paraformaldehyde for 24 h, followed by dehydration in 20% and 30% sucrose. Tissues were embedded in OCT compound and cryosectioned at 20 μm. Sections were washed with PBS, permeabilized with 0.3% Triton X-100, and blocked with 5% goat serum for 1 h. Primary antibodies against POMC (1:200, PA5-149954, Thermo Fisher, USA), GHSR (1:100, PA5-28752, Thermo Fisher, USA), and c-Fos (1:500, MA5-15055, Thermo Fisher, USA) were then applied overnight at 4°C. After PBS washes, sections were incubated with Alexa Fluor-conjugated secondary antibodies (1:500) for 1 h in the dark, followed by DAPI counterstaining.
Laser capture microdissection of the hypothalamic arcuate nucleus
To analyze molecular expression in specific hypothalamic microregions, the arcuate nucleus was isolated by laser capture microdissection (LCM). Brain tissues were fixed in 4% paraformaldehyde, dehydrated, paraffin-embedded, and sectioned at 8–10 μm. Sections were rapidly stained with hematoxylin and eosin to visualize anatomical landmarks. The arcuate nucleus was identified microscopically and dissected using an LCM system. Isolated tissue was immediately collected into RNase-free microcentrifuge tubes and snap-frozen in liquid nitrogen to preserve RNA and protein integrity.
RT-PCR detection
Total RNA was extracted using TRIzol reagent (Invitrogen), and purity was assessed using a NanoDrop spectrophotometer. Samples with A260/A280 ratios between 1.8 and 2.0 were reverse-transcribed into cDNA. Quantitative RT-PCR was performed using SYBR Green chemistry on an ABI 7500 system under the following conditions: 95°C for 10 min, followed by 40 cycles of 95°C for 15 s and 60°C for 1 min. GAPDH was used as the internal control, and relative gene expression was calculated using the 2−ΔΔCt method. Primer sequences are listed in Supplementary Table S1.
Western blot
Protein expression was analyzed by WB. Total protein was extracted from isolated arcuate nucleus tissue using RIPA lysis buffer and quantified by the BCA assay. Equal amounts of protein (30–50 μg) were separated by SDS-PAGE and transferred onto PVDF membranes. Membranes were blocked with 5% nonfat milk for 1 h and then incubated overnight at 4°C with primary antibodies against POMC (PA5-149954, Thermo Fisher, USA), AgRP (PA5-149908, Thermo Fisher, USA), and GHSR (1:100, PA5-28752, Thermo Fisher, USA). After washing, membranes were incubated with HRP-conjugated anti-rabbit IgG secondary antibody (ab288151, Abcam, UK) for 1 h. Protein bands were visualized using enhanced chemiluminescence and captured with an imaging system. Band intensities were quantified using ImageJ and normalized to β-actin. At least three biological replicates were analyzed, and experiments were performed independently in different batches to ensure reproducibility.
Statistical analysis
All data were analyzed using R (v4.2) and GraphPad Prism (v9). Data normality was assessed using the Shapiro-Wilk test, and homogeneity of variance was evaluated using Levene’s test. For comparisons between two independent groups, an unpaired two-tailed Student’s t-test was used for normally distributed data, whereas the Mann–Whitney U test was used otherwise. For comparisons among three or more groups, one-way analysis of variance (ANOVA) followed by Tukey’s post hoc test was applied when assumptions of normality were met; otherwise, the Kruskal–Wallis test followed by Dunn’s multiple-comparisons test was used.
Repeated-measures data, including body weight, GTT, and ITT, were analyzed using two-way repeated-measures ANOVA or mixed-effects models when data were missing, followed by Sidak’s or Tukey’s multiple-comparisons test. Large-scale omics data, including flow cytometry, transcriptomics, and metabolomics, were adjusted for multiple testing using the Benjamini–Hochberg procedure, with FDR <0.05 considered significant. Metabolomic data were further evaluated by PCA and PLS-DA, and metabolites with variable VIP > 1 and FDR < 0.05 were considered significantly altered.
Sensitivity analyses were performed using multiple linear regression or linear mixed-effects models, with postoperative weight loss (Δ body weight) and average daily food intake included as covariates for metabolic and immune outcomes. Data are presented as mean ± standard error of the mean. Statistical significance is denoted as *p < 0.05, **p < 0.01, ***p < 0.001, and ****p < 0.0001; ns indicates not significant.
Electronic Laboratory Notebook
An electronic laboratory notebook was not used.
Authors’ Contributions
X.L. and R.-y.Z. conceived and designed the study. W.-h.L., X.L., and R.-y.Z. performed the experiments. X.L. and R.-y.Z. analyzed the data. X.L. and W.-h.L. wrote the article. All authors reviewed and approved the final version of the article.
Ethical Statement
All animal experiments were approved by the Animal Ethics Committee of Sichuan Provincial People’s Hospital (No. 2025156). All procedures were conducted in accordance with institutional guidelines for the care and use of laboratory animals and complied with the ARRIVE (Animal Research: Reporting of In Vivo Experiments) guidelines. All efforts were made to minimize animal suffering and to reduce the number of animals used.
Data Availability
The datasets generated and analyzed during the current study are available in public repositories. The proteomics data have been deposited to the ProteomeXchange Consortium via the iProX partner repository with the dataset identifiers PXD077846 and IPX0016920000. The bulk RNA sequencing and single-cell RNA sequencing data have been deposited in the NCBI Sequence Read Archive (SRA) under the BioProject accession number PRJNA1458972.
Footnotes
Author Disclosure Statement
The authors declare no conflicts of interest.
Funding Information
This study was supported by
Supplemental Material
Abbreviations Used
References
Supplementary Material
Please find the following supplemental material available below.
For Open Access articles published under a Creative Commons License, all supplemental material carries the same license as the article it is associated with.
For non-Open Access articles published, all supplemental material carries a non-exclusive license, and permission requests for re-use of supplemental material or any part of supplemental material shall be sent directly to the copyright owner as specified in the copyright notice associated with the article.