
Abstract
Aim. To test the possibility of identifying community readiness changes over time. Method. Key responders in seven municipalities in Stockholm County were interviewed about the availability of alcohol and parental support. The results were analyzed with paired t tests. Changes in community readiness were assessed. Ninety-three key responders from the participating communities were interviewed three times each, resulting in a total of 315 interviews. Data were collected on three occasions separated by ten months from semistructured telephone interviews based on the community readiness model. Findings. Significant readiness changes were found for both issues from baseline to the first follow-up. In terms of the six dimensions of community readiness, significant differences were evident from baseline to the first follow-up for parental support and the reduction of alcohol availability. Apart from knowledge of reduced alcohol availability, there were no significant changes in overall readiness or in the dimensions from the first follow-up to the second. The findings of this study are discussed in relation to earlier studies. Conclusion. In communities with an initial vague awareness of issues, a change in readiness level occurs in less than a year.
Introduction
Assessing community awareness is an important part of the implementation process (Brownson, Colditz, & Proctor, 2012). There are different methods of measuring the level of readiness (Castañeda et al., 2012; Fallin et al., 2012; Lehman, Greener, Rowan-Szal, & Flynn, 2012; Oetting, Jumper-Thurman, Pleasted, Edwards, & Edwards, 2001; Plested, Edwards, & Jumper-Thurman, 2006; Stith et al., 2006; Wandersman et al., 1998). Reports about the validity and reliability of the different methods of measuring community readiness are limited (Chilenski, Greenberg, & Feinberg, 2007; Sharma, Botzet, Sechrist, Arthur, & Winters, 2006).
Several studies have supported the importance of identifying which level a community is at, and they have also reported that adapting the strategy to the communities’ level of readiness is useful to achieve the desired prevention results (Buckner-Brown, Sharify, Blake, Phillips, & Whitten, 2014; Ehlers, Huberty, & Beseler, 2013a, 2013b; Engstrom et al., 2002; Frerichs et al., 2012; Hahn, Rayens, & York, 2013; Han, Cao, & Anton, 2015; Jarpe-Ratner et al., 2013; Jones, Settipalli, Goodman, Hootman, & Goins, 2012; Kakefuda, Stallones, & Gibbs, 2008; Kesten, Cameron, & Griffiths, 2013, 2015; Kostadinov, Daniel, Stanley, Gancia, & Cargo M 2015; Paltzer, Black, & Moberg, 2013; Parker, Alcaraz, & Payne, 2011; Plested, Thurman, Edwards, & Oetting, 1998; Roeseler, Solomon, Beatty, & Sipler, 2016; Sliwa, et al., 2011). A number of community readiness studies have covered different topics, such as intimate partner violence (Brackley et al., 2003), HIV/AIDS (Plested, Edwards, & Jumper-Thurman, 2007), childhood obesity (Findholt, 2007; Kesten et al., 2015), drug use (Plested, Smitham, Thurman, Oetting, & Edwards, 1999), breast cancer (Lawsin, Borrayo, Edwards, & Belloso, 2007), and tobacco control (Roeseler et al., 2016). Several studies have investigated readiness level in conjunction with a broad spectrum of topics. Hence it is obvious that the knowledge of readiness level is important and valid for some public health topics and that it can be equally applied to other public health topics.
Most work on community readiness assessments is derived from the community readiness model (CRM; Beebe, Harrison, Sharma, & Hedger, 2001; Edwards, Jumper-Thurman, Plested, Oetting, & Swanson, 2000; Oetting et al., 2001; Plested et al., 2006). The CRM focuses on readiness at a structural level and is based on different models, such as social action process of Beal (1964), indicating the necessity of motivating key persons to participate actively in the intervention. Another model is Rogers’s (2003) diffusion of innovation model, which describes how new ideas and technology are spread among individuals or organizations until they adapt to the intervention. The new idea must be widely adopted and must have reached the level of critical mass to self-sustain. Rogers (2003) has defined five adopter levels as follows: innovators, early adopters, early majority, late majority, and laggards. The CRM is based on DiClemente and Prochaska’s (1982) transtheoretical model; it identifies adequate intervention, depending on the level of readiness in a community. The transtheoretical model explains how ready an individual is to change his or her behavior. The model describes change as the following five-stage process: precontemplation, contemplation, preparation, action, and maintenance (DiClemente & Prochaska, 1982).
The CRM determines the level of community readiness through semistructured telephone interviews with four to six key respondents. The six dimensions are scored after each interview using a rating scale that is divided into the following nine readiness level steps: (1) no awareness, (2) denial/resistance, (3) vague awareness, (4) preplanning, (5) preparation, (6) initiation, (7) stabilization, (8) confirmation/expansion, and (9) high level of community ownership. The possible scores for community readiness range between 1 and 9, where 1 indicates the lowest level of readiness and 9 the highest level of readiness. After the interviews are concluded and the results are analyzed, the CRM provides “goals and general strategies appropriate for each stage” (Oetting et al., 2001; Plested et al., 2006). These goals and strategies provide examples of activities that will help increase the readiness level in the community.
The CRM has been used in some studies to measure baseline levels of readiness to adapt and prepare for implementation, but a limitation of these studies is that they measure the CRM only once (Brackley et al., 2003; Ehlers et al., 2013b; Findholt, 2007; Frerichs et al., 2012; Han et al., 2015; Jones et al., 2012; Kesten et al., 2013; Lawsin et al., 2007; Plested et al., 1999; Plested et al., 2007). If the readiness level is repeated, it is easier to adjust the intervention after the identified level, which ensures the most efficient use of resources.
The CRM has been used in some studies to evaluate readiness changes from baseline interviews to follow-up interviews after approximately 2 years (Ehlers et al., 2013a; Ogilvie et al., 2008; Paltzer et al., 2013; Slater et al., 2005; Stallones, Gibbs-Long, Gabella, & Kakefuda, 2008). In most of the presented studies, the communities increased their readiness levels from denial to vague awareness or vague awareness to preplanning, but in the studies with follow-ups, it is unclear at what point this change occurred. Before the follow-up is conducted (after 24 months), the readiness level can increase or decrease, for example, increasing after 12 months and then decreasing shortly thereafter. For this reason, it is possible to record only the actual level that has been measured at a specific moment and not what has occurred between the measurements.
Sweden has had restrictive alcohol policies for many years. These restrictive policies include a government monopoly on the retail sale of alcohol, restrictions on the hours of operation of establishments that serve alcohol, a minimum age of 20 years to purchase alcohol, and high alcohol taxes. Sweden became a member of the European Union in 1995, and the membership changed the traditional political means of control over alcohol. Responsibility for regulation moved from the national level to the local level, and municipalities currently have a large responsibility for alcohol and drug prevention (Regeringens proposition 2000/01:20, 2000; Regeringens proposition 2005/06:30, 2005). Municipalities are important in this process (Babor, Caetano, Casswell, & Edwards, 2010). Policies that regulate alcohol access address certain topics, such as the duration of sales, the location of sales, and the number of alcohol outlets in a municipality. An additional policy may alter the drinking context. Alcohol consumption in Sweden increased after Sweden’s entry into the European Union, and it has decreased slightly in recent years. The average level of consumption was estimated to be approximately 8 liters per adult citizen per year in 1996. After 1996, the consumption increased continuously until 2004, when the consumption was 10 liters of pure alcohol per adult citizen per year. After 2004, the consumption slowly decreased to a level of approximately 9 liters (The Swedish Council for Information on Alcohol and Other Drugs, 2009).
In light of these changes, the county administrative board in Stockholm County was commissioned by the National Institute of Public Health to work with the development of prevention measures for alcohol, narcotics, tobacco, and doping (ANTD) during the period from January 1, 2009, to December 31, 2010. Regarding alcohol prevention, the National Institute of Public Health focused on the following two issues: reducing the availability of alcohol for all ages and increasing the support given to parents to delay their children’s introduction to alcohol. Both issues are considered to be important factors in alcohol prevention (Babor et al., 2010, Foxcroft & Tsertsvadze 2012). The overall aim of this study was to focus on community readiness in relation to the topic of alcohol prevention in municipalities, with the objectives of reducing the availability of alcohol to all ages and strengthening the primary prevention support for parents to prevent alcohol use among their children. This study emphasizes the community readiness levels during this period; thus the results of the alcohol prevention efforts will not be reported. The specific aim in this study was to determine whether community readiness results change over time on a structural level.
Method
In this study, a community is defined as the set of actors who are involved in implementing the prevention program. There are different combinations of actors in different municipalities. Actors that may be involved in various combinations include different administrative units within the municipality, such as the police, church, and primary health care.
We have used an adaptation of the CRM to examine a community’s level of readiness for implementing a program to reduce the availability of alcohol for all ages and to increase the level of parental support. The CRM had never been used in Sweden, and the interview questions and rating scales (Plested et al., 2006) were translated from English to Swedish by an authorized translator (Behling & Law, 2000). The Swedish version was then translated back into English, and the two English versions were compared to ensure the validity of the translation. The Swedish version was then used in a pilot study to test comprehension and to practice the scoring of the interviews. The pilot study was conducted in a different county from the present study to ensure that no one in the community had previously heard the questions.
Selection of Communities
The county administrative board in Stockholm invited all 26 municipalities in the county to take part in the implementation, and it then selected the municipalities that were to participate, based on those that expressed an interest. These municipalities became the “communities” of the study. The inclusion criteria, which were determined by the National Institute of Public Health and the county administrative board, included having a project coordinator in the municipality, forming a sector alliance steering group, and taking part in meetings arranged by the National Institute of Public Health or the county administrative board. Moreover, the highest political board in the municipality must have approved an ANTD policy. Additional inclusion criteria were that the politicians and the civil servants must take part in the ANTD education that the county administrative board conducted and that the community must have surveyed the use of ANTD in the community.
Fourteen of the 26 communities expressed interest in participating in the study. Eight fulfilled the selection criteria, one of which withdrew after the first year. The final study contained seven communities.
It is recommended that a sample size of four to six key respondents per issue be used in each community with the CRM method (Plested et al., 2006). However, we chose nine key respondents for each issue and community due to the large sizes of the municipalities.
Key Respondents
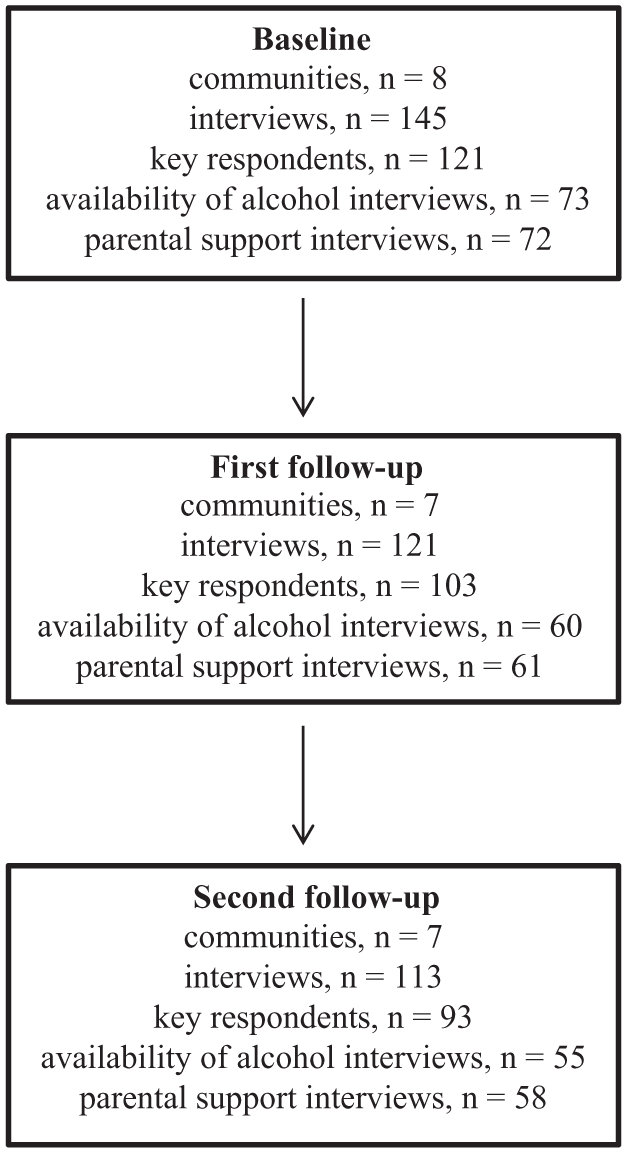
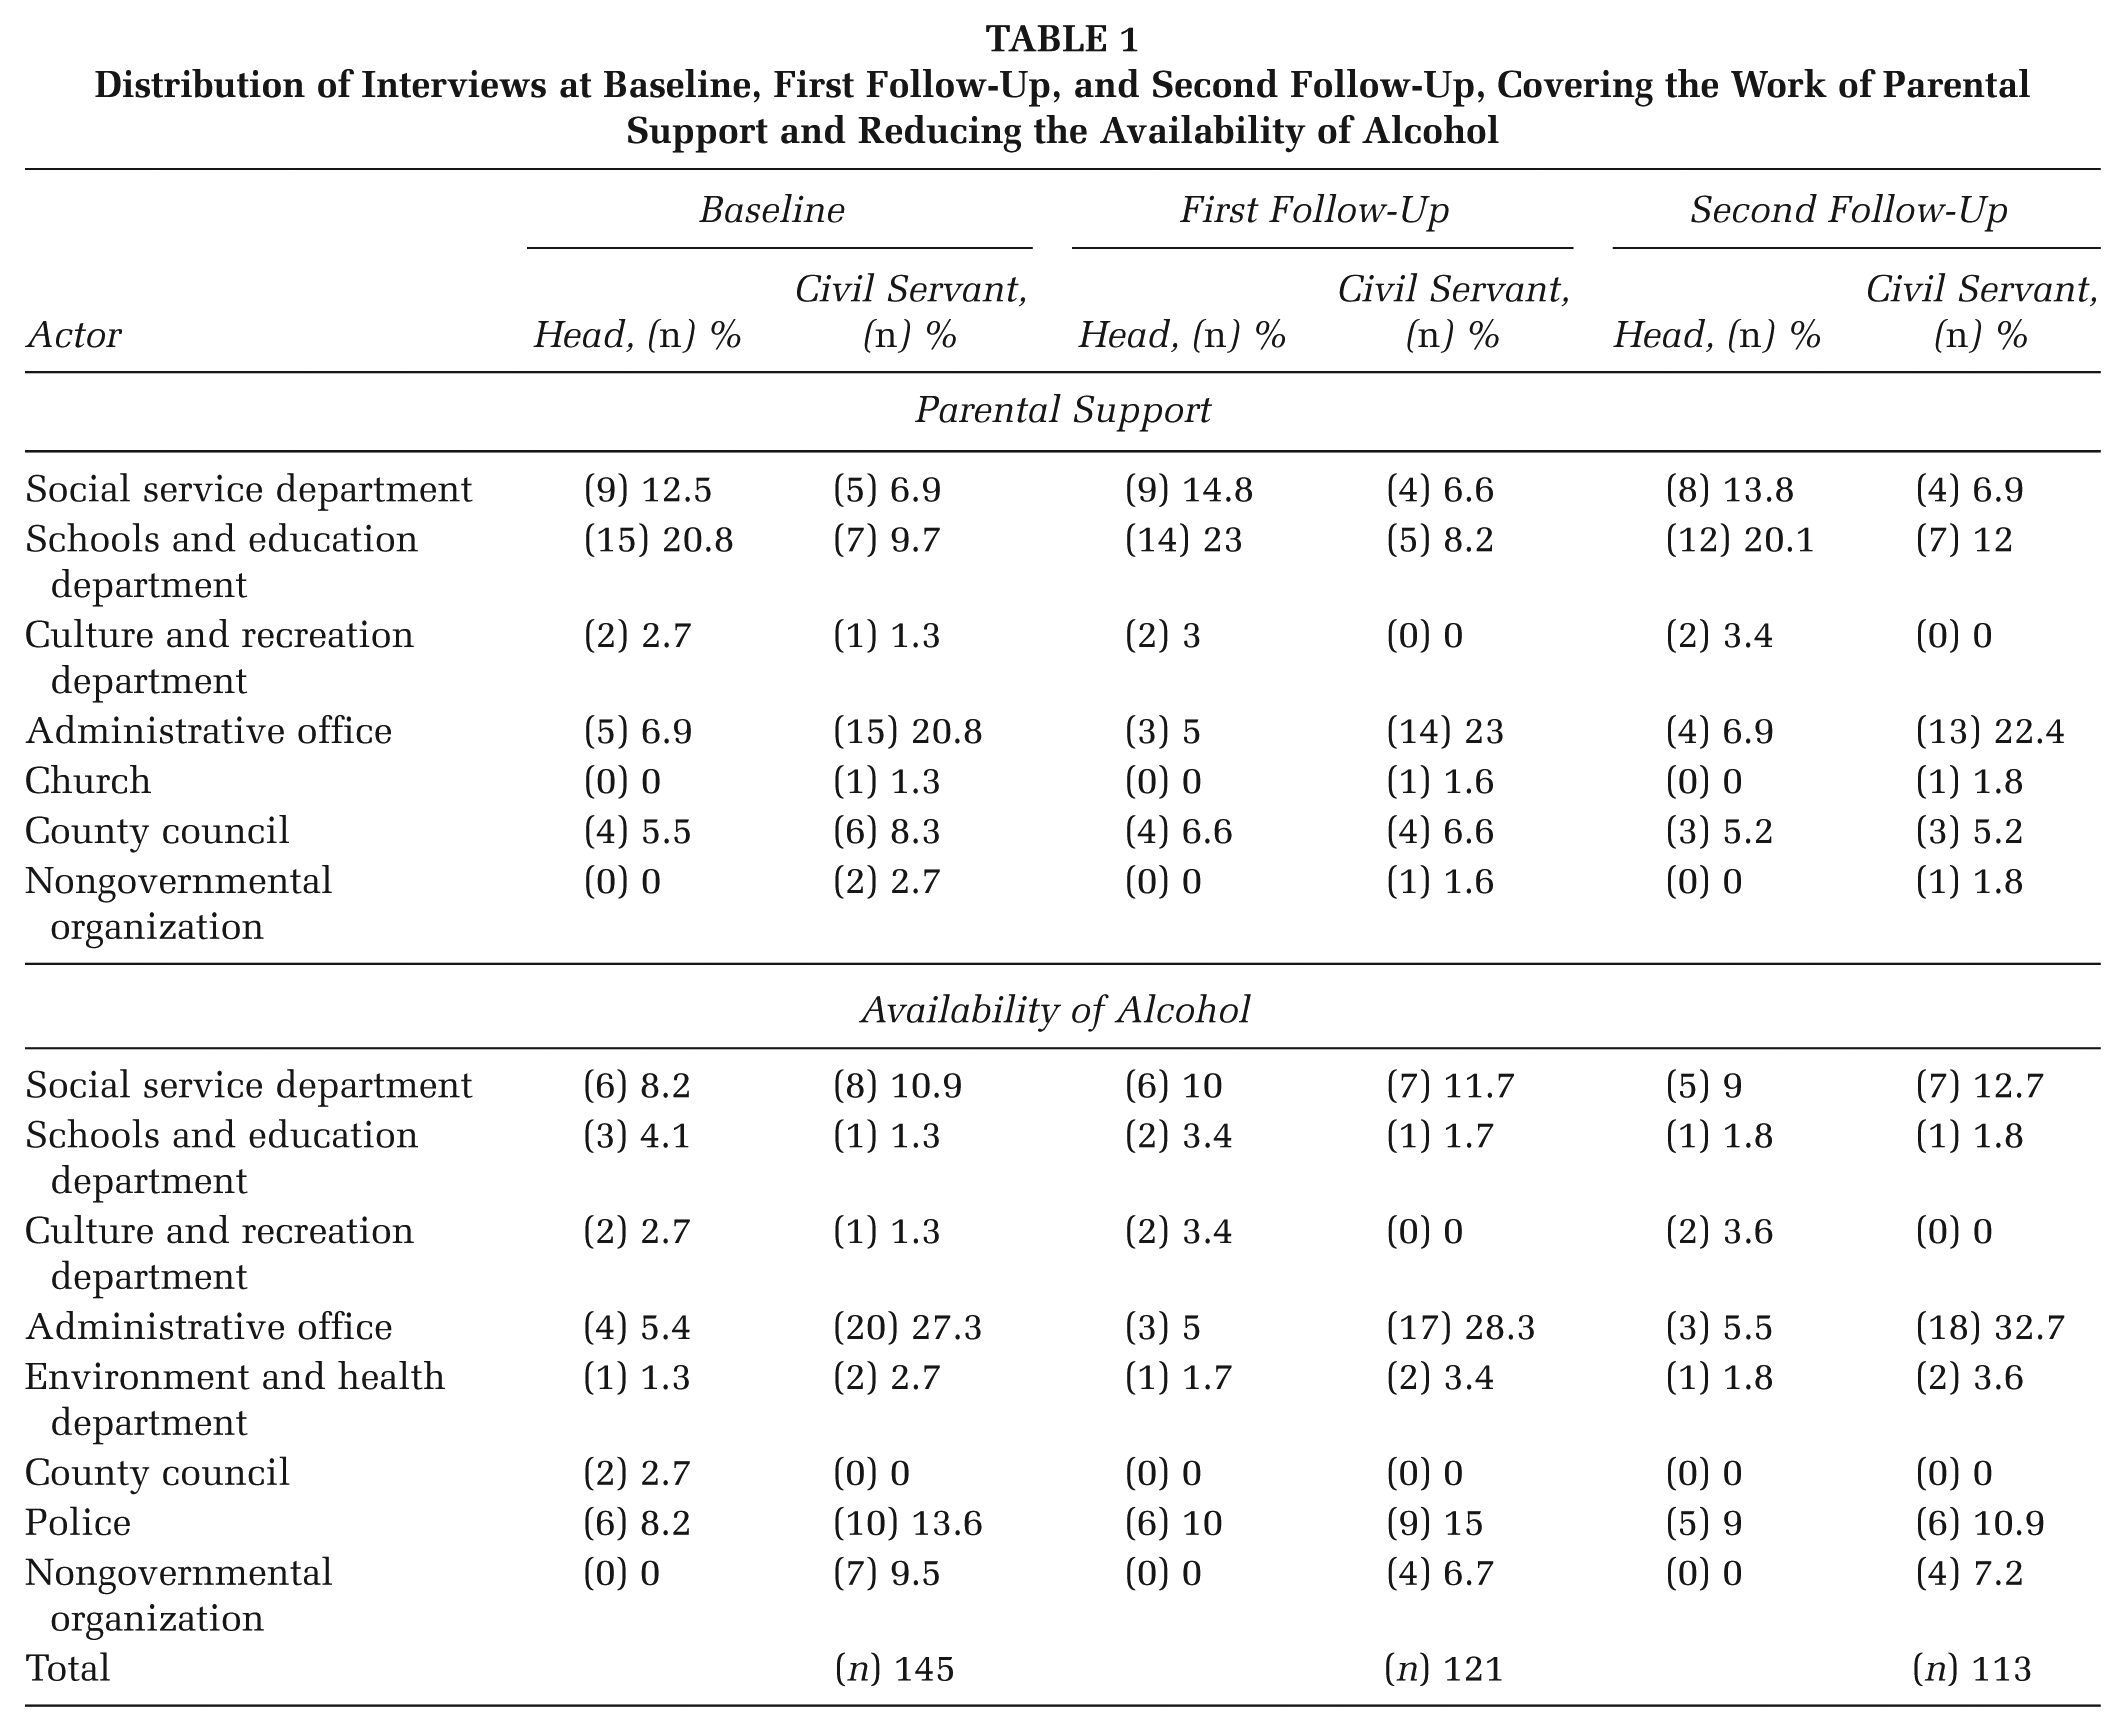
A total of 145 interviews were conducted at baseline with 121 key respondents (see Figure 1), including the eight local coordinators from the communities. A total of 121 interviews were conducted with 103 key respondents at the first follow-up (10 to 11 months after baseline), and 113 interviews were conducted with 93 key respondents at the second follow-up (20 to 22 months after baseline). The distributions of respondents from the communities are presented in Table 1, which illustrates that the attrition was not systematic. Some key respondents participated in both reduction of alcohol availability and parental support.
Distribution of Participants During Baseline, First Follow-Up, and Second Follow-Up
Distribution of Interviews at Baseline, First Follow-Up, and Second Follow-Up, Covering the Work of Parental Support and Reducing the Availability of Alcohol
Interviews
The baseline interviews were performed between November 2008 and February 2009. Initially, nine key respondents were identified in five communities by the local project coordinator. However, the range was from 8 to 10 key respondents in some communities, and one community had 9 respondents concerning parental support and 10 concerning alcohol reduction. The average interview duration was 30 minutes per issue. There are 36 questions in the CRM interview guide. If a question was clearly irrelevant for the issue, the question could be dropped unless it was in bold print. The 20 questions in bold print are essential for scoring. The questions are divided into six dimensions as follows: (1) A: community efforts, (2) B: knowledge of efforts, (3) C: leadership, (4) D: community climate, (5) E: knowledge about the issue, and (6) F: resources for prevention efforts. In this study, 23 questions were used. The first follow-up interviews were performed between September 2009 and December 2009. The second follow-up interviews were performed between August 2010 and November 2010. The study was approved by the regional ethical board.
Procedure
All interviews were conducted by telephone and performed by an interviewer and an assistant interviewer, and all interviews were recorded. The scores were determined immediately after each interview using the CRM anchored rating scales (Plested et al., 2006). Any discrepancies in scoring between the interviewer and the assistant interviewer were discussed. The recorded interviews were sometimes used to reach a consensus in scoring. The combined scores were used to compute the total community readiness score and to calculate the community readiness score per dimension. The interviewer and the assistant interviewer remained the same during the entire study. Rater agreement between the interviewer and the assistant ranged from r = .62 to r = .87, irrespective of attrition. Reliability over time was assessed by the interviewer performing new ratings of 15 randomly selected baseline interviews after 4 years, with correlations ranging from r = .57 to r = 1.00.
Analysis of Community Readiness
The readiness level of a community for each dimension was calculated from the results of each key person. The average readiness level for all key persons in the community was then calculated for each dimension. The overall readiness level for the community was then calculated from all dimensions. The score was always rounded down to the nearest integer (Plested et al., 2006).
Feedback
The results for each of the seven communities were presented to the local project coordinator and to a representative from the county administrative board in Stockholm after each measurement period. The results from both issues (i.e., parental support and reduction of alcohol availability) were reported in the same session. Each feedback session started with a short summary of the CRM. The total score and the differences between the dimensions were presented and discussed, and the general goals and strategies appropriate for each stage of the CRM were described in line with the descriptions from Oetting et al. (2001) and Plested et al. (2006). These goals and strategies provide examples of activities that will help increase the readiness level in the community. The average duration of the feedback session was 60 minutes.
Statistical Analyses
All quantitative analyses were performed using SPSS statistical software. Paired t test calculations were performed for the means from the interviews in each community and for each topic. The results presented are derived from the key respondents who were interviewed on all three occasions. To determine whether the loss of the key respondents who dropped off at the first and second follow-ups affected the result, paired t tests were calculated. However, no significant changes in the results occurred. The significance level was set at 5%. Calculations were performed for overall community readiness and change in readiness dimensions.
Results
The level of readiness for both parental support and reduction of availability (Table 2) changed significantly between baseline and the first follow-up. A change was observed for the overall readiness score in each dimension. The overall readiness score changed by one step, moving from the preplanning step to the preparation step. Dimension B, knowledge of efforts, changed by one step in both parental support and reduction of availability. Reduction of availability (Table 2) changed by two steps from vague awareness to preparation for Dimensions C, leadership; and E, knowledge about the issue. Dimension A, community efforts, remained in the initiation step, whereas Dimension F, resources for prevention efforts, remained in the preparation step for reduction of availability.
Paired t Test on Aggregated Community Readiness Results for Alcohol Prevention With Focus on Reducing the Availability of Alcohol and Parental Support: Baseline and First Follow-Up
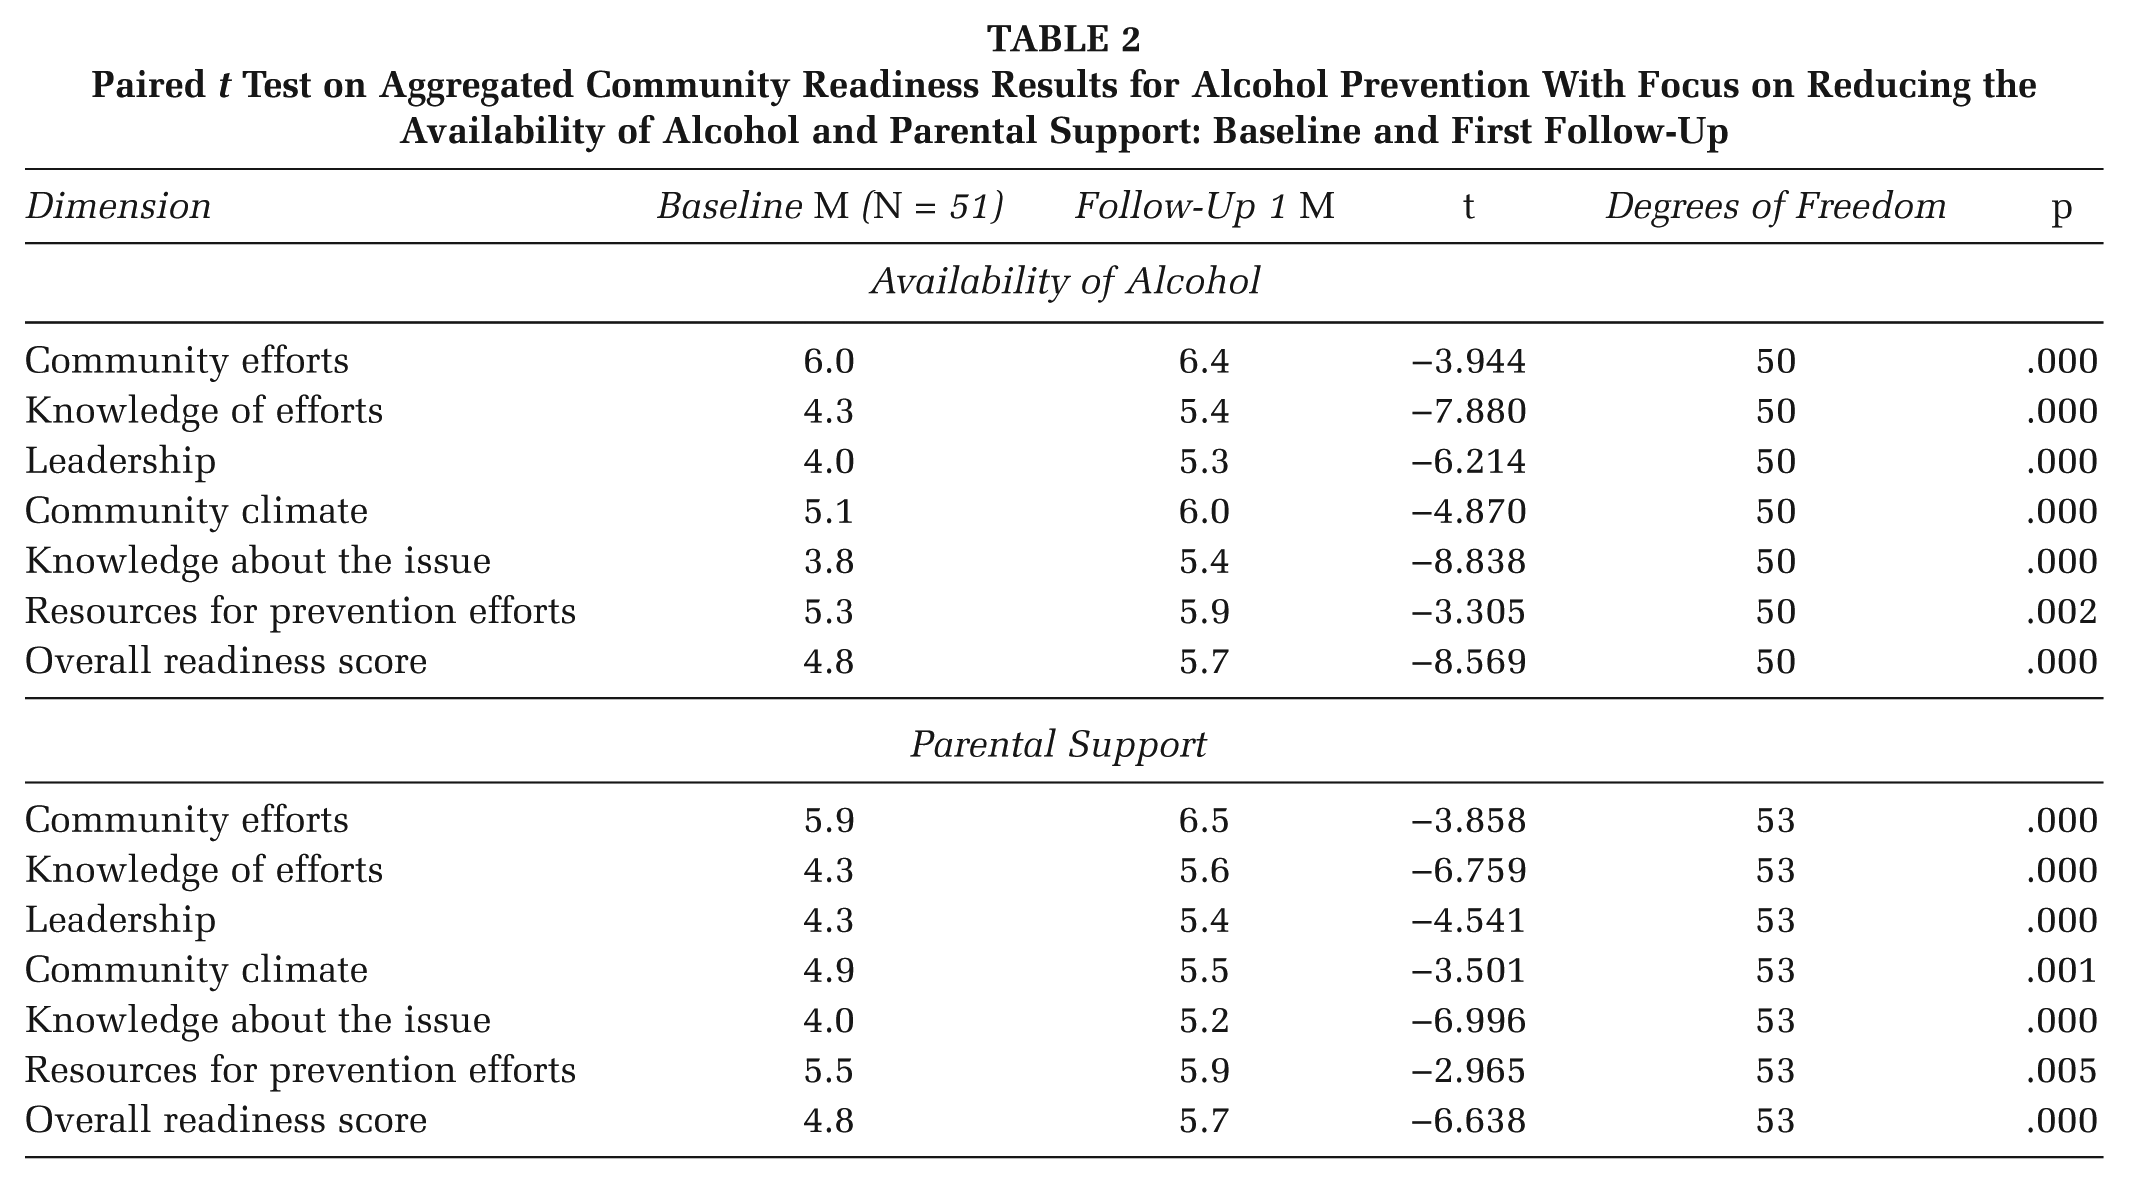
Table 2 shows that Dimension A, community efforts, changed one step from preparation to initiation with respect to parental support. Dimensions B, knowledge of the efforts; C, leadership; D, community climate; and E, knowledge about the issue, changed by one step from preplanning to preparation. Dimension F, resources for prevention efforts, remained at the preparation level.
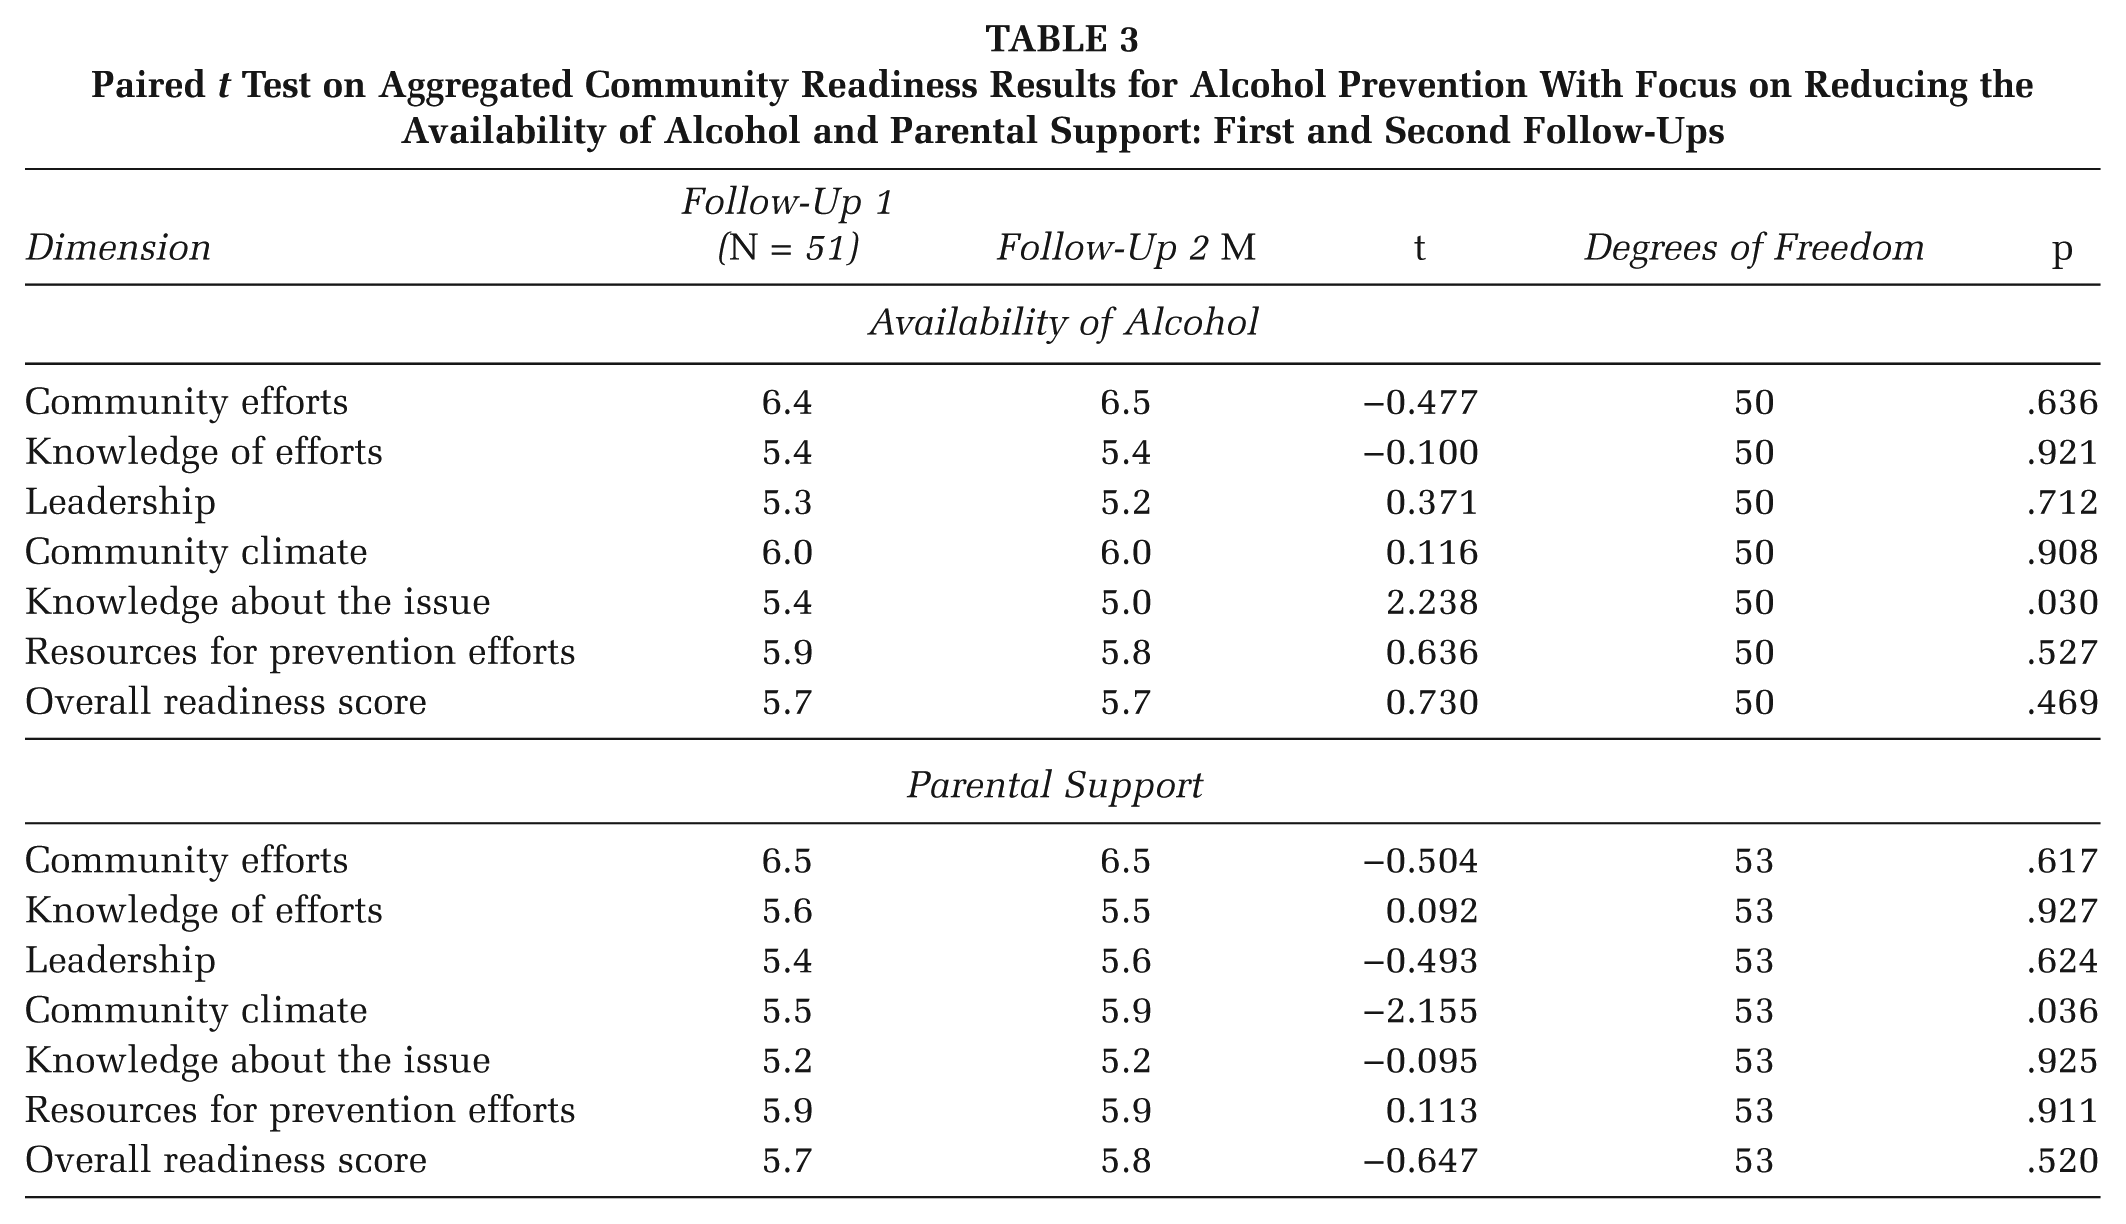
There were no significant changes in overall readiness between the first and second follow-ups (Table 3). Activity remained at the preparation level. One dimension, E: knowledge about the issue, for the reduction of availability, changed significantly (Table 3). This dimension moved to a lower step, but it remained at the preparation level.
Paired t Test on Aggregated Community Readiness Results for Alcohol Prevention With Focus on Reducing the Availability of Alcohol and Parental Support: First and Second Follow-Ups
Discussion
An important part of planning and evaluating an implementation is to identify a community’s readiness level. After the readiness level is identified, it is easier to plan and select relevant intervention strategies to ensure that the processes proceed in the fastest time line and most resource-efficient manner. In this study, the readiness level was measured for the following two issues that proceeded in parallel: parental support and reduction of availability. After the results were obtained, intervention strategies could be adapted. The process, in both issues, could also be followed over time and evaluated to determine whether it persisted in the desired direction. If the process had stagnated, in either of the two issues, the CRM ensured that the community was aware of the problem and had the opportunity to adopt interventions to restart the process. At an individual level, the actors in the community had to increase the level of stages of change for those who were involved in the work, according to the transtheoretical model (DiClemente & Prochaska, 1982). In addition, it was important to consider the diffusion of innovation model to help identify the level of adoption in the community in order to inform the choice of appropriate interventions to continue the process (Rogers, 2003). By using the CRM, the entire process can be made more efficient.
We have conducted three CRM measurements over a period of 22 months. Previous studies have presented results from only one or two measurements, separated by 24 months (Brackley et al., 2003; Ehlers et al., 2013a, 2013b; Findholt, 2007; Frerichs et al., 2012; Han et al., 2015; Jones et al., 2012; Kesten et al., 2013; Lawsin et al., 2007; Ogilvie et al., 2008; Paltzer et al., 2013; Plested et al., 1999; Plested et al., 2007; Slater et al., 2005; Stallones et al., 2008). The readiness level in the studies of two measurements changed from vague awareness to preplanning. As mentioned in the introduction, these studies declared only two measurements, one at baseline and one after 24 months. The levels of readiness between the baseline and the follow-up are unknown. The level of readiness could have increased or decreased in total or in the different dimensions several times during the 24-month period. It would have been much more interesting to have supplementary measurements during the 24-month period to be able to follow how the readiness level changed in the community. Ideally, it is better to conduct several measurements within a short time frame. This method will provide a better foundation for the decision-making process.
In this study, the readiness level of parental support and the reduction of availability changed from preplanning to preparation after 10 to 11 months and remained at this level during the subsequent 10-month period. The change in readiness, both in parental support and reduction of availability, stagnates after the first follow-up. There are several explanations for this stagnation. There was a large employee turnover in some of the communities, which may explain the stagnation. The introduction of many new people into the development work slows down the work because the new staff members must become familiar with the implementation of the project. The organizational system in one community had been completely renewed some years previously, and this new system was not fully functional, which made it difficult to work with implementation in that community. The leadership changed between the first and the second follow-ups in one community because the steering group disbanded itself. This result occurred because the steering group believed that the work had been performed so well that the steering group was no longer needed. In another community, one key person, who worked with issuing licenses to sell alcohol, left the community. Therefore, the work associated with reducing the availability of alcohol was put on hold until a new employee was recruited. The above reasons explain the stagnation of the overall readiness score in the communities.
This study is the first to analyze two different issues, reduction of availability and increase in parental support. Note that reduction in availability of alcohol and the increase in parental support are at the same level of readiness, although the key respondents and actors in the communities who worked with the two subjects did not greatly overlap.
Most communities in previous studies were at the vague awareness level, with some in the preplanning level (Brackley et al., 2003; Findholt, 2007; Lawsin et al., 2007; Plested et al., 1999; Plested et al., 2007). The baseline results from our study showed that most communities were at the preplanning level on the overall readiness score. The higher baseline overall readiness scores in this study may result from the well-established public health work related to alcohol that has been conducted in Sweden over the past decade. The diffusion of the topic of alcohol was near or had even reached critical mass and had become self-sustaining. None of the previously mentioned studies examined alcohol prevention, and none described the results from two different issues (i.e., reduction of availability and increase of parental support).
The coordinators gathered the key respondents to share the results of the feedback in most communities. Thus, the key respondents increased their stages of change and became important actors in the diffusion of information. The key respondents became more aware of the nature and identity of their part of the topic and tried to share this information with others in their organization. This process had a positive effect because Dimension B, knowledge of efforts, showed significant changes from baseline to the first follow-up. One of the strengths of the model is the translation of the research findings directly into practice in the ongoing intervention from the CRM goals and general strategies with specific suggestions about the interventions.
Note that the highest scores were for the Dimensions A, existing community efforts; and F, resources related to the issue. The subject of alcohol is high on the political agenda in Sweden, which may explain this result (Regeringens proposition 2000/01:20, 2000; Regeringens proposition 2005/06:30, 2005). National and regional actors distribute different models and methods to the municipalities to help them in their work with both parental support and the reduction of availability of alcohol, which explains the high values scored by dimension A. In Sweden, municipalities can apply to the government for financial support for alcohol-related projects, which explains the high value scored by Dimension F. By offering a variety of methods and models, as well as financial support, a positive impact may be achieved. However, this support does not necessarily mean that the total readiness level of the organization will reach the same high scoring as in Dimensions A and F. The Dimensions B to E, which relate to the essence of the organization, must be equally addressed to ensure an increase in readiness level.
One dimension that changed between the baseline and the first follow-up was C, leadership, most likely because this condition was imposed by the National Institute of Public Health, and the county administrative board that the community had to form a sector alliance steering group. One criticism of this condition is the fact that a community is then “pushed” to form a sector alliance steering group, even though they are not at the right level of readiness. To have formed only a sector alliance steering group will bring the organization to only Level 5 preparation on an anchored rating scale. One could argue that a condition also ought to include that the steering group should at least be active at Level 6 initiation on the anchored rating scale (Plested et al., 2006).
We made a deliberate methodological choice that the same interviewer and assistant interviewer would conduct the interviews throughout the study. This process ensures that the interviews and evaluations were performed in a similar manner as much as possible. It is possible that this process caused bias in the results if the interviewers subconsciously tended to give a higher assessment during the subsequent round of interviews. We believe that the benefit outweighed this risk, given that the scoring was designed with clear boundaries between the various points.
One limitation of the CRM as a method is the lack of reported validated studies. A weakness in this study could be that there was no randomization of the participant communities and no control group. It was not feasible to include a control group because the spillover effect was impossible to control because the alcohol prevention managers in Sweden communicate on a regular basis and compare experiences. However, randomization may be regarded as unsuitable in a “community-based” study. Another possible limitation is that the community in this study is represented by key informants who answer for the actors in the community and not the citizens, who may have another readiness for the included issues. Another limitation of the CRM is that numbers are used to assess different levels of readiness. Thus, qualitative data are quantified, which must be noted when interpreting the results. Furthermore, the results presented here do not allow us to determine the exact timing and nature of the change in readiness level, but we can conclude that it occurred during the first 11 months.
We conclude that the change in readiness level occurs in less than a year in communities in which the initial level is vague awareness (Level 3). The readiness then changes to initiation (Level 6). Further studies are required to examine readiness levels over time and the exact timing of changes. However, in practice, it is valuable to know the readiness level of the community as part of a comprehensive approach to planning, implementing, and following up health promotion interventions.