



Abstract
Individuals with disabilities experience greater rates of cardiovascular disease than individuals without disabilities. This increase can be attributed to decreased levels of physical activity, poor eating habits, and increased levels of diabetes, smoking, and obesity. Individuals with disabilities are often excluded from surveillance, treatment, and prevention efforts. Consequently, there is little known about their participation rates in health promotion and disease prevention programs. The aims of this investigation are (1) to examine time trends in cardiovascular disease and risk factors over a 10-year period by disability status and (2) to assess the inclusiveness of health promotion programs in Delaware. The percentage of individuals with disabilities increased from 18% in 2001 to 28% in 2011. Individuals with disabilities had higher rates of cardiovascular disease (t = 80.45; degrees of freedom [df] = 198; p < .0001) and obesity (body mass index > 30 kg/m2) than individuals without disabilities (t = 33.0; df = 198; p < .0001). They also reported less physical activity (t = 44.21; df = 198; p < .0001) and worse diet quality (t = 4.70; df = 198; p < .0001). There was a consistent lack of information about inclusion and participation of individuals with disabilities in health promotion programs. Making adaptations within cardiovascular disease prevention programs in Delaware is imperative to improving the health of individuals with disabilities. Ensuring cardiovascular disease programs are accessible and provide disability-specific trained staff will reduce barriers to participation so that all individuals can benefit.
Introduction
Cardiovascular disease (CVD), including atherosclerosis, heart attacks, strokes, heart failure, arrhythmia, and heart valve problems, is the leading cause of death in the United States, accounting for 25% of adult deaths yearly while costing Americans $100 billion annually (Centers for Disease Control and Prevention [CDC], 2015). Although CVD is the leading cause of death among all adults in the United States, it disproportionately affects individuals with disabilities (CDC, 2014b; Hollar & Lewis, 2015).
The World Health Organization (WHO; 2014a) defines disability as “an umbrella term, covering impairments, activity limitations, and participation restrictions.” Individuals with physical disabilities experience 4 times more CVD than individuals without disabilities, and individuals with cognitive limitations experience 2½ times more CVD compared to individuals without cognitive limitations (Reichard & Stolzle, 2011). The increases in CVD among adults with disabilities can be attributed to several factors, including decreased levels of physical activity, poor eating habits, and increased rates of diabetes, smoking, and obesity (CDC, 2014b; Ptomey, Goetz, Lee, Donnelly, & Sullivan, 2013). Given the growth in the number of people with disabilities worldwide (WHO, 2014b), it is imperative that we increase surveillance efforts to track the rate of CVD within this population, identify risk factors for CVD, and develop and implement effective interventions.
Cardiovascular Disease and Its Risk Factors
In addition to the increased risk of CVD experienced by individuals with disabilities when compared to those without disabilities, they are at an increased risk of diabetes, high blood pressure, and high cholesterol, all of which are known risk factors for CVD (Hollar & Lewis, 2015; Reichard & Stolzle, 2011). Known modifiable factors such as physical inactivity, poor diet, and obesity have also been found to be more prevalent among individuals with disabilities (Centers for Disease Control and Prevention, 2014b; Ptomey et al., 2013; J. H. Rimmer, Rowland, & Yamaki, 2007).
Several studies have documented greater levels of physical inactivity among individuals with disabilities compared to individuals without disabilities (Martinson, O’Connor, & Pronk, 2001; J. H. Rimmer et al., 2007), with individuals with disabilities twice as likely to be physically inactive compared to individuals without disabilities (22% vs. 10%, respectively). In addition to adults, youth with disabilities often do not participate in competitive sports and recreational games with their peers, either because of limitations or due to community restrictions, making it difficult for them to reach the recommend daily amount of physical activity (J. A. Rimmer & Rowland, 2008).
Poor dietary habits are also evident among individuals with disabilities, although research on overall dietary quality is limited. To date, focus has been placed on the dietary needs of individuals that are specific to their particular condition, rather than overall dietary quality (J. H. Rimmer et al., 2007). Individuals may have nutritional concerns that represent a by-product of the challenges faced by people with disabilities and their families. These may include eating due to increased stress or feelings of isolation and parents offering their children unhealthy options to compensate for perceived inadequacies in their parenting or the child’s life (Reinehr, Dobe, Winkel, Schaefer, & Hoffmann, 2010).
Poor diet and physical inactivity have led to an increased risk of obesity, an important risk factor for CVD, among individuals with disabilities (Reichard & Stolzle, 2011; Reinehr et al., 2010; J. H. Rimmer et al., 2007). According to the CDC (2014a), 36% of adults with disabilities are obese with a body mass index (BMI) of at least 30, compared to 23% of adults without disabilities. Also, the average BMI among adults who are obese and have a physical disability or cognitive limitation is significantly higher than the average BMI for those who are obese and do not have a disability (Reichard & Stolzle, 2011). Obesity rates for children with disabilities are also 38% higher than for children without disabilities (CDC, 2014a). Studies have shown that cardiovascular risk factors are more common in obese children with disabilities than in children with disabilities whose weight was normal (Reinehr et al., 2010).
Given the increased risk of CVD, as well as the increased prevalence of many of the risk factors for CVD among individuals with disabilities, CVD prevention programs are needed that target these high-risk individuals. Fortunately, many effective programs exist within communities, but individuals with disabilities have limited accessibility and face barriers to participation.
Cardiovascular Disease Programs
Although individuals with disabilities benefit from CVD prevention programs (Froehlich-Grobe & White, 2004; Kilmer, Wright, & Aitkens, 2005; Olney et al., 2006; Robinson-Whelen et al., 2006), they are less likely to use these programs than those without disabilities (Kroll, 2003). The lack of participation in CVD prevention programs can be understood from a social-ecological theoretical framework (Bronfenbrenner, 1979). Social-ecological theory posits that risk for disease comes about from complex interactions among individuals, communities, and environments (Burke, Joseph, Parick, & Barker, 2009). The social-ecological model can be used to pull together multilevel determinants of health behaviors where these multilevel influences may also include significant environmental variables and social factors (Sallis, Owen, & Fisher, 2008). This model may also include some of the social determinants of health that include other factors that emphasize social and economic opportunities that may affect health. These determinates of health include factors such as resources and supports in one’s home, neighborhood, and community; access to safe water, food, and air; and the nature of social interactions within their communities (WHO, 2012). For individuals with disabilities, functional limitations may initially be experienced from the physical, sensory, intellectual, or psychological variations underlying the disability of the individual. But these individuals are placed at continued risk for disease due to the lack of support within their communities and environmental barriers that exist within societies that fail to create inclusive surroundings (Devereux, Bullock, Gibb, & Himler, 2015). From a social-ecological model perspective, these interactions among the individual, a noninclusive community, and an isolating environment lead to poor health behaviors, limited health promotion activities, and increased risk for disease and ultimately premature mortality (Stokols, 1996).
One of the most critical social determinants of health is poverty (WHO, 2012). Poverty can result in material deprivation resulting in limited access to food, housing, sanitation, and clean water, as well as unemployment and low income. Taken together, poverty is one of the strongest risk factors for morbidity and mortality. The impact of poverty on morbidity and mortality is most evident among population subgroups including women, children, race/ethnic minorities, and individuals with disabilities. Poverty is a barrier for participation in health promotion activities for all individuals but especially those with disabilities.
Studies have attempted to identify additional social barriers to participation and have called for the need to provide health promotion programs that are more inclusive of individuals with disabilities (Froehlich-Grobe & White, 2004; Robinson-Whelen et al., 2006). Programs that are not specifically tailored to individuals with disabilities may have barriers, making it hard for full participation of this diverse population. Some of these barriers include physical barriers, such as not having ramps or parking spaces, inaccessible equipment, or unavailable transportation, or personal barriers, such as the belief that health educators and providers are not educated in disability-specific knowledge (Hwang et al., 2009; Kroll, 2003). Those programs targeting a reduction in CVD risk with low dropout rates have primarily been home-based programs (Froehlich-Grobe & White, 2004; Kilmer et al., 2005; Olney et al., 2006). Although home-based programs may eliminate many of the barriers individuals with disabilities typically face, they also increase social isolation and do not provide the social support networks necessary for the sustainability of positive behaviors.
Programs have been developed that specifically target individuals with disabilities. For example, Yes U Can USA (2014) provides support for individuals with disabilities to increase access to health and physical activity opportunities. Trained staff provide programs that include activities such as swimming, yoga, and healthy eating. The Yes U Can program offers individuals with disabilities the oppurtinity to participate in CVD prevention programs and eliminates the many barriers associated with participation (Yes U Can USA, 2014).
However, limited evidence exists on the effectiveness of CVD risk reduction for individuals with disabilities who participate in programs that target the general population. These programs are thought to be more advantageous because they take an inclusive approach rather than target a specific group of individuals with disabilities. Ewing, McDermott, Thomas-Koger, Whitner, and Pierce (2004) found that a CVD prevention program was more successful among typically developing participants (i.e., those without a disability); however, the program was able to show positive results for participants with cognitive disabilities as well. Although the participants with disabilities did not produce results as high as the typically developing participants, they did show improvements in the CVD risk while participating in a program that was not specifically tailored to their disability (Ewing et al., 2004). This is critical because it documents the positive impact that generic prevention programs have for individuals with disabilities and may provide a model for inclusion.
Even with a high prevalence of CVD, individuals with disabilities are often excluded from surveillance, treatment, and prevention efforts (WHO, 2014b). Consequently, there is little known about the participation rates of individuals with disabilities in CVD prevention programs. Therefore, the aims of the present study are twofold: (1) to examine time trends in CVD and its risk factors over a 10-year period comparing those with and without disabilities and (2) to assess the inclusiveness of health promotion programs and activities in the state of Delaware.
Method
Time Trends in CVD Risk Factors
Data from the Delaware Behavioral Risk Factor Surveillance Survey (BRFSS), an epidemiological surveillance system established by the CDC to monitor the health behaviors of adults, across the nation, were used to meet Aim 1 of the current investigation. The BRFSS contains approximately 18 to 22 mandatory sections and 5 to 10 optional sections, depending on the year of data collection. It is designed to assess health risk behaviors among the adult population, including disability status, health status, health care access, physical activity, dietary behaviors, oral health, disabilities, and tobacco use. The Delaware BRFSS includes a random sample of adults residing in Delaware who had a land phone line. In 2011, Delaware BRFSS methods expanded to include cellphone and online follow-up surveys. Data collected after 2011 were not included in the current analysis since the changing methodology might have affected the comparability of the sample over time (CDC, 2011). Over 10 years (2001-2011), the Delaware BRFSS has obtained information on approximately 45,000 adults in the state of Delaware with an average response rate of 46%. These adults include males and females of various ethnic and diverse backgrounds. This study examined a 10-year period by using data collected at six different time points (2001, 2003, 2005, 2007, 2009, 2011).
Several questions from the Delaware BRFSS were used to determine disability status, heart disease, physical activity, nutrition, and overweight/obesity (Table 1). Any adaptations to variables over time are indicated in Table 1. Time trends in the variables obtained using the Delaware BRFSS data between the years 2001 and 2011 were then examined.
Definitions of Variables Used From the BRFSS to Examine Trends in Cardiovascular Disease and Cardiovascular Disease Risk Factors for Individuals With and Without Disabilities
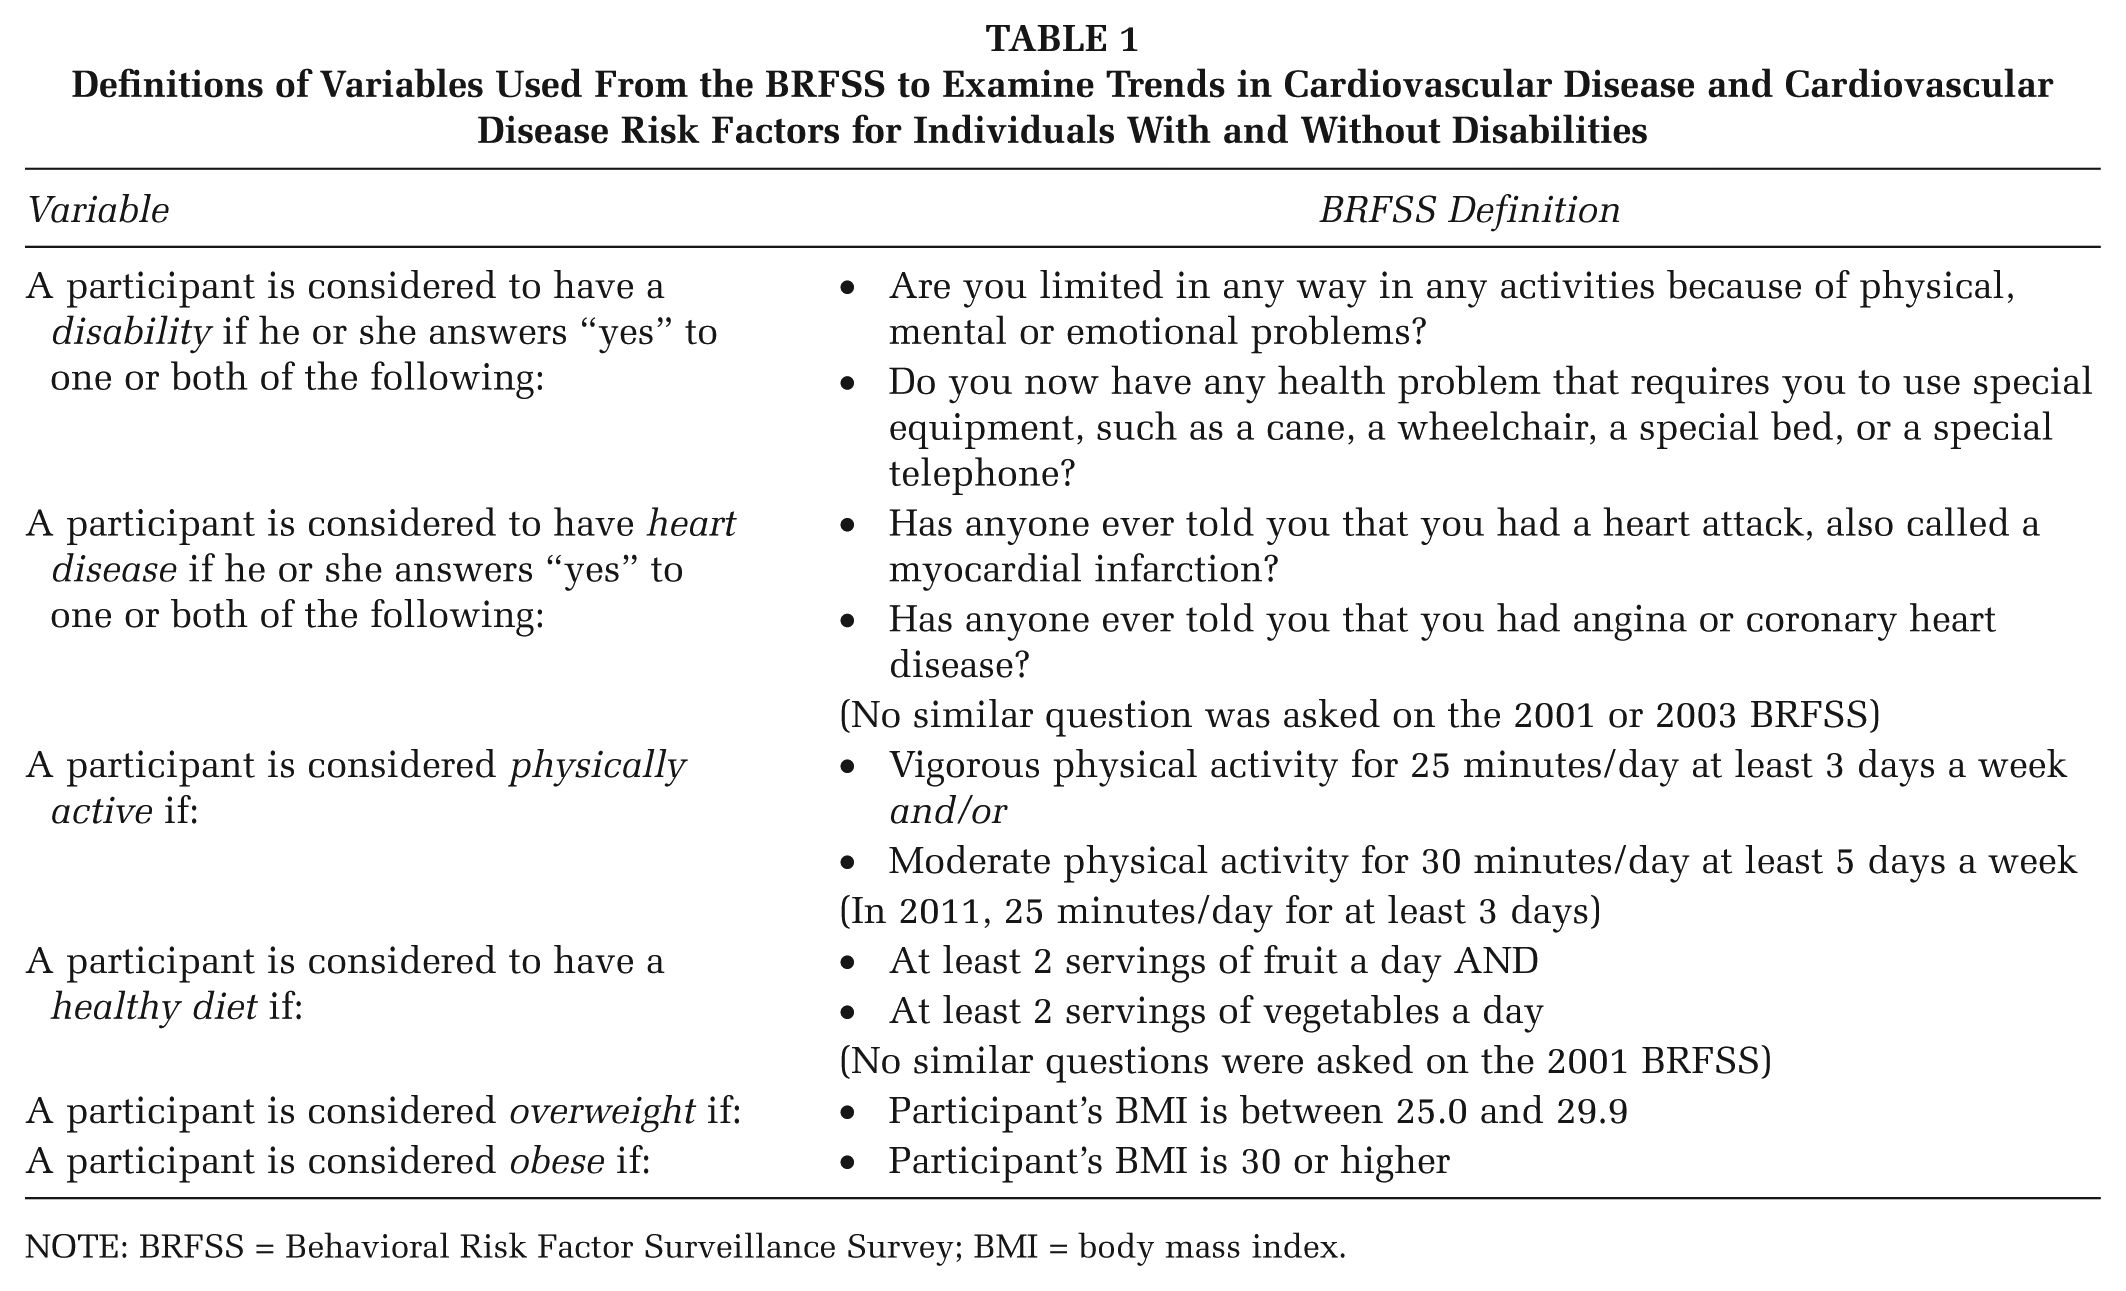
NOTE: BRFSS = Behavioral Risk Factor Surveillance Survey; BMI = body mass index.
Assessment of Health Promotion Programs and Activities in the State of Delaware
Health promotion programs that targeted CVD or CVD risk factors were identified using two different mechanisms. First, 121 community programs including community groups, nonprofit organizations, school-based health centers, medical centers, academic institutions, and foundations were identified through a comprehensive phone book and Internet search. In addition to these community programs, surveys were sent to the 12 divisions within the Delaware Department of Health and Social Services asking Division leaders to identify those programs that target CVD or CVD risk factors. Thirty-eight additional programs were identified through this mechanism. A survey was then sent to all 159 state-funded (N = 38) and non–state-funded (N = 121) programs.
Key informant interviews were conducted prior to the development of the survey instrument that was distributed to a variety of health promotion programs. These surveys were part of a State of Delaware Environmental Scan of Health Promotion Programs. The survey consisted of 20 questions, which included 6 contact information questions, 10 program-specific questions, 3 disability-specific questions, and 1 policy/initiative question. Sample program question is “Which geographical areas in the state of Delaware does the program cover? New Castle County, Kent County, or Sussex County.” Sample disability questions included “How many people with disabilities does the program reach each year? If this is a new program, please list how many people with disabilities the program has reached since its inception,” “What are the major barriers encountered in identifying the number of people with disabilities that are reached by the program? Discuss all you can think of (e.g., financial, physical, communication, etc.),” and “What, if any, challenges would individuals with disabilities face if/when they participate in the program?” It was an electronic survey, and all of the questions were open-ended to allow for a wide range of possible answers given the lack of information available on the inclusive status of health promotion programs in Delaware. All of the surveys were administered between April and June 2013. Of the 38 state-funded programs, 28 completed the survey (74%), whereas 67 (55%) community programs completed the survey for a total participation rate of 60% (95/159). The surveys were conducted via Qualtrics, and all data were entered into an SPSS file for frequency analysis.
Data Analysis
Data analysis for this study was performed using SPSS statistical software, Version 22. Patterns and missing data were identified before running tests on the collected data to examine variance in the response among sets of questions. Normality tests were conducted to examine the distribution of each variable. Descriptive statistics were computed for demographic variables, including age and gender, as well as disability status, BMI, CVD, physical activity, and nutrition. Prevalence rates over time were used to determine trends between disabilities and CVD risk factors throughout the time points of the BRFSS (2001-2011). Cross-tabulations, chi-square tests, and t tests were conducted to compare CVD, physical activity, nutrition, and BMI for individuals with and without disabilities. Significance level were set at p < .05 for all statistical tests.
Results
Time Trends in CVD and CVD Risk Factors
For the BRFSS data, a total of 24,777 participants were included in the analysis, with ages ranging from 18 to 99 years. The mean age in 2001 was 47.61 (SD = 17.54) years, steadily increasing to 54.53 (SD = 18.22) years by 2011. The percentage of individuals limited in any activities due to physical, emotional, or mental problems was 21.07% (SD = 3.25%), and the percentage of individuals who required use of special equipment was 8.45% (SD = 1.94%). The overall percentage of all individuals with disabilities (limited activity and/or special equipment) was 23.08% (SD = 3.66%). The percentage of individuals with disabilities each year is shown in Figure 1. When time trends were investigated, the overall trend over time was not statistically significant, yet there was a gradual increase in the percentage of individuals with disabilities over the 10-year time period, increasing from 18% in 2001 to 28% in 2011.

Percentage of Individuals With Disabilities in Delaware Over a 10-Year Time Period
Cardiovascular Disease
Individuals with disabilities reported significantly more CVD than individuals without disabilities (t = 80.45; degrees of freedom [df] = 198; p < .0001). The percentage of individuals with disabilities who had CVD (19.08%; SD = 1.55%) was significantly larger than individuals without disabilities, (6.05%; SD = 0.47%). No CVD data were collected on the 2001 or 2003 Delaware BRFSS; however, statistical significance was found within every other individual year (Figure 2).
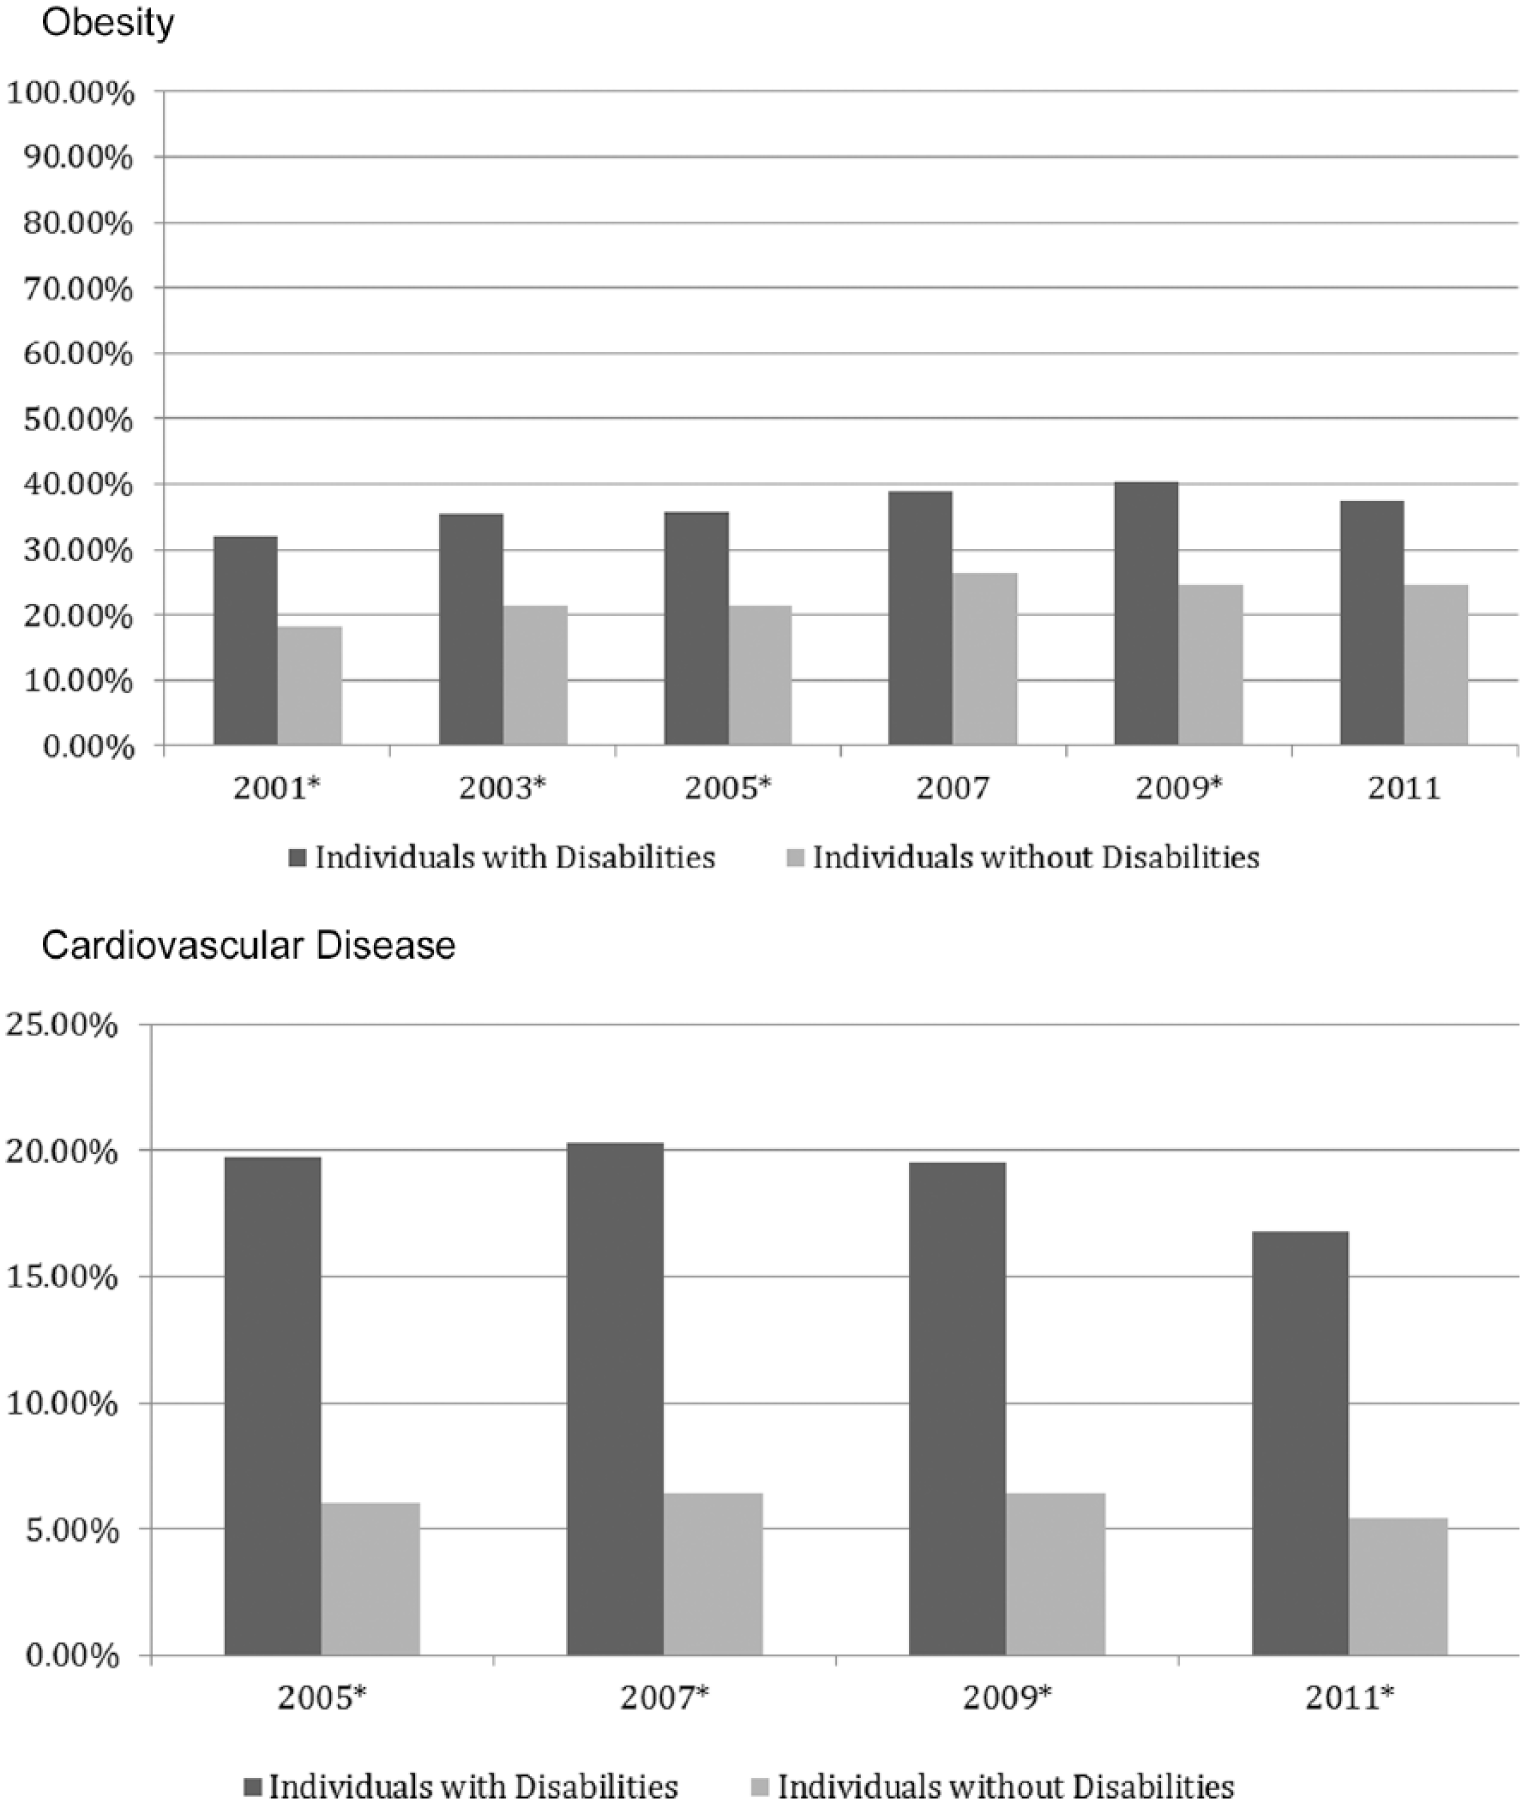
Percentage of Individuals With and Without Disabilities in Terms of Chronic Disease
Overweight and Obesity
Individuals with disabilities were found to be significantly more obese (BMI > 30 kg/m2) than individuals without disabilities (t = 33.0; df = 198; p < .0001). The percentage of individuals with disabilities who were obese (BMI > 30) was 37% (SD = 2.9%), compared to individuals without disabilities (23%; SD = 3.0%). When looking at individual years, individuals with disabilities were significantly more obese than individuals without disabilities in 2001, 2003, 2005, and 2009. There was also a steady increase of obesity for individuals with disabilities throughout the years, with a slight decrease in 2011 (Figure 2).
Physical Activity
Individuals with disabilities reported significantly less physical activity than their nondisabled counterparts (t = 44.21; df = 198; p < .0001). This difference was consistent within each individual year, with the exception of 2009. Physical activity requirements for adults were defined as 25 minutes of vigorous activity per day for 3 days a week and/or 30 minutes a day of moderate activity for 5 days a week in years 2001 to 2009, and for year 2011, it was 25 minutes of activity per day for 3 days a week (Garber et al., 2011). The percentage of individuals with disabilities meeting this requirement for physical activity was 29.30% (SD = 1.57%), compared to individuals without disabilities (43.05%; SD = 2.75%; see Figure 3).
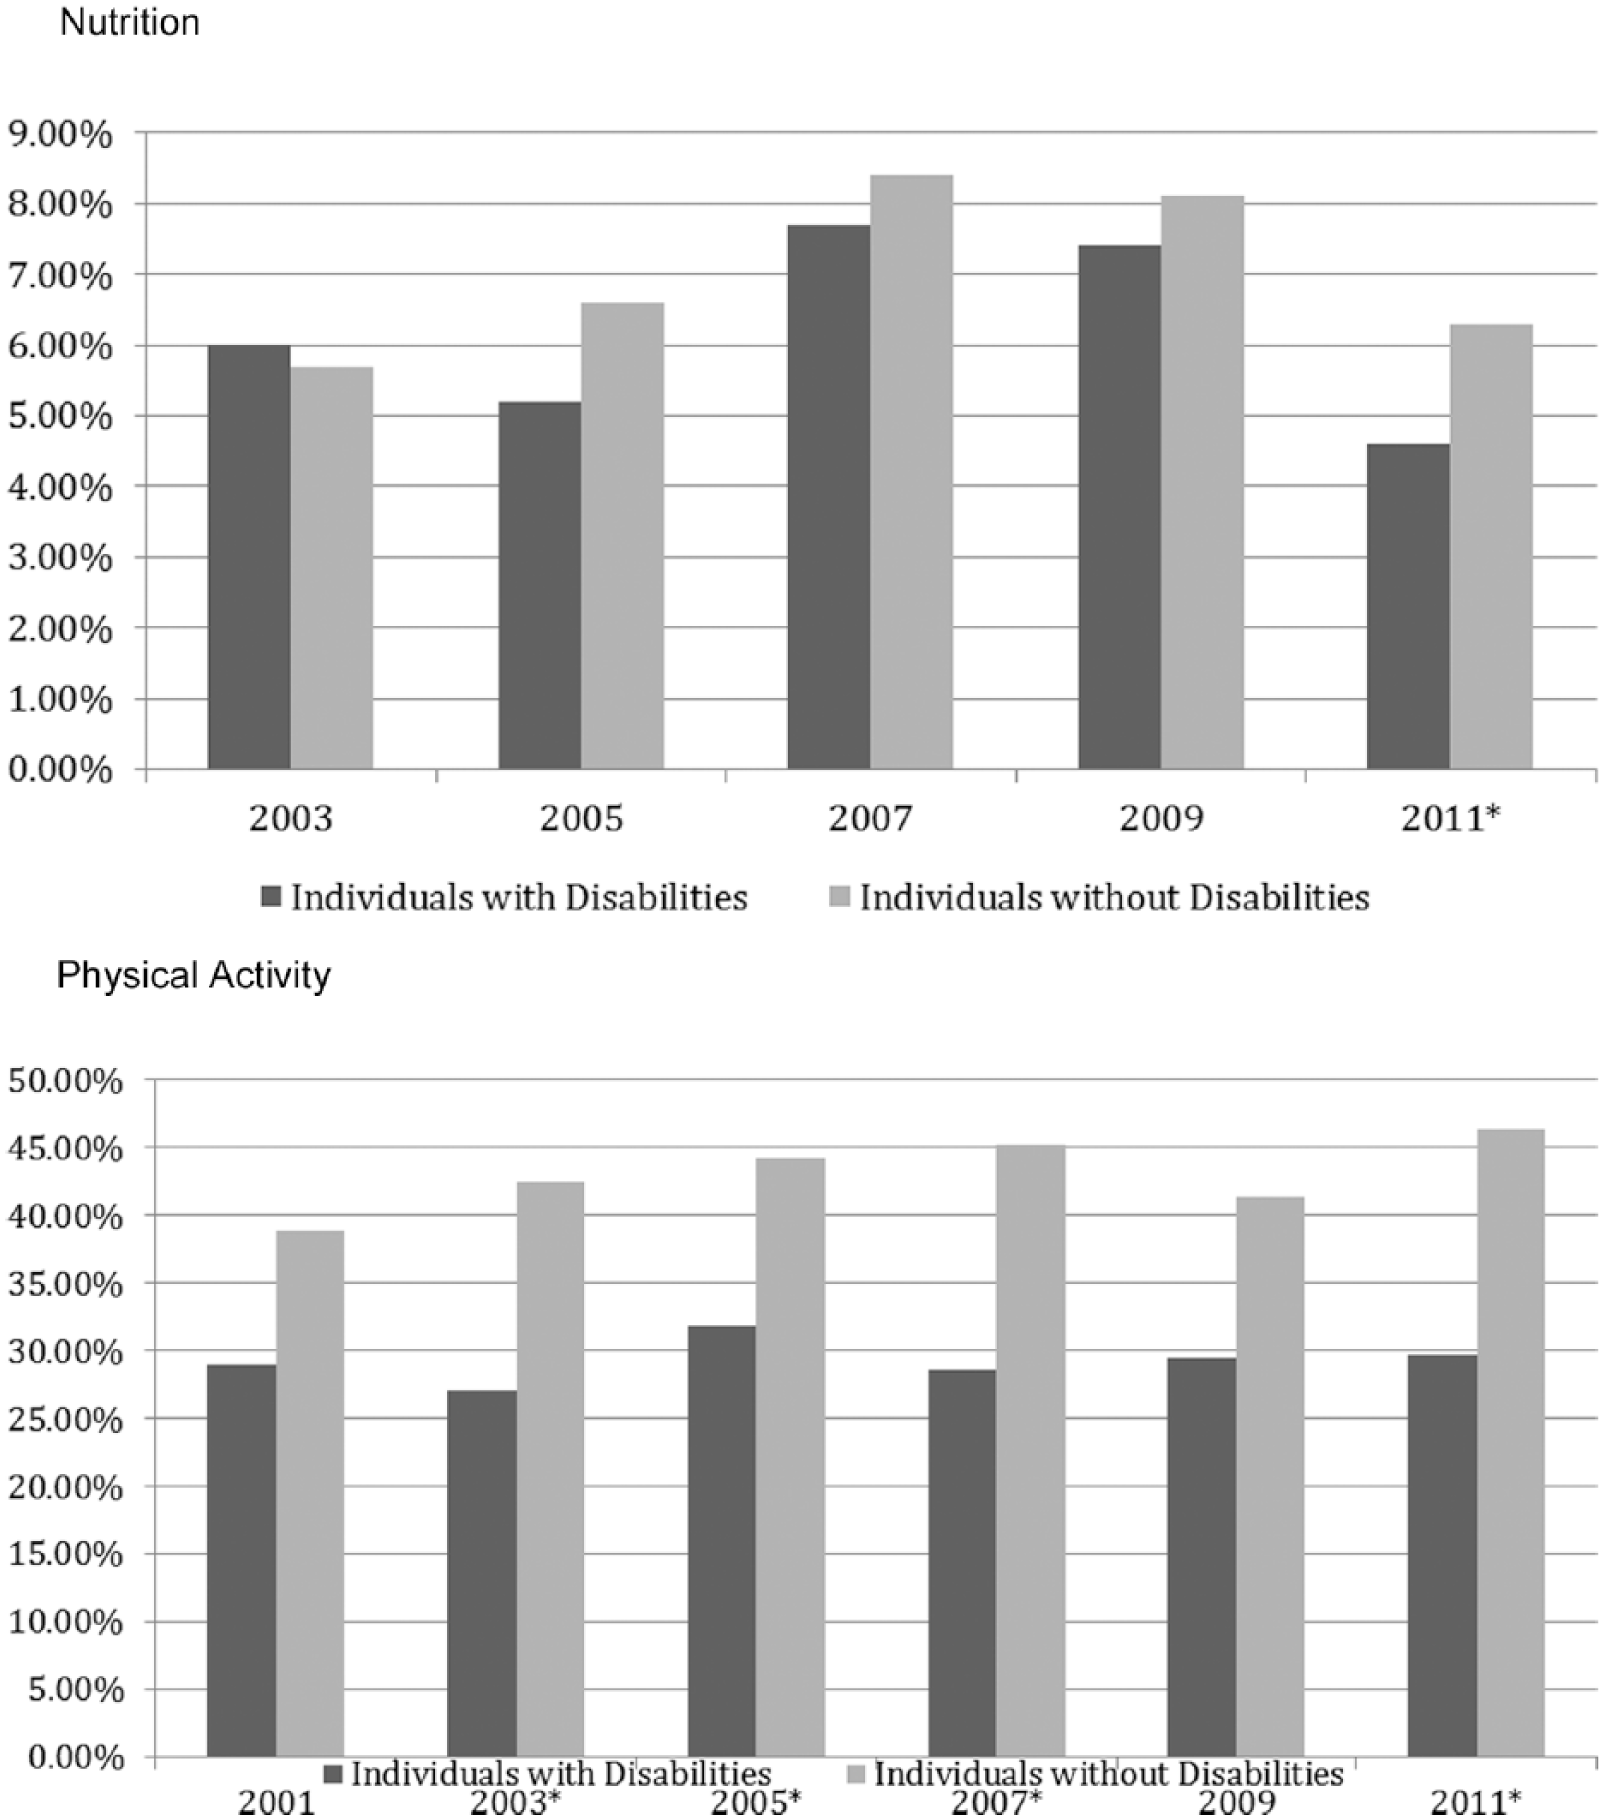
Percentage of Individuals With and Without Disabilities in Terms of Lifestyle Behaviors
Nutrition
Similarly to physical activity, individuals with disabilities were found to have a significantly worse diet quality than individuals without disabilities (t = 4.70; df = 198; p < .0001). Recommended nutrition requirements were two servings of vegetables per day and two servings of fruit per day (U.S. Department of Agriculture & U.S. Department of Health & Human Services, 2010). The percentage of individuals with disabilities who met the recommended requirements for nutrition was 6.18% (SD = 1.35%), compared to individuals without disabilities (7.02%; SD = 1.17%). When looking at individual years, 2011 was the only year where individuals with disabilities reported worse diets than individuals without disabilities. No nutrition information was collected on the 2001 Delaware BRFSS. Overall, very few participants in both groups met the recommended requirements for nutrition (Figure 3).
Health Promotion Program Assessment Surveys
All state-funded programs and 27% (18/67) of non–state-funded programs indicated that they served the entire state of Delaware. The reach for all the programs ranged from 20 to 400,000 people. The target demographics for the programs were adults, older adults, youth and adolescents, women and youth, adults with diabetes, adults with intellectual/developmental disabilities, or a mix of all demographics. Most programs either did not charge a fee for participation or had insurance and/or state and federal funds to cover participation.
The majority (74%; 70/95) of programs were not able to identify how many individuals with disabilities were currently using these programs. The major challenges identified in determining how many individuals with disabilities were using the program included not being required to track these data, lack of resources available to collect these data, and anonymity and Health Insurance Portability and Accountability Act regulations around collecting these data.
When asked about the possible barriers individuals with disabilities might face in using the programs, many CVD prevention program managers in the state of Delaware were unaware of any barriers to participation. Those that did identify possible barriers state that there were a lack of resources to accommodate variations in ability, physical barriers to participation, lack of staff knowledge, poor communication skills, lack of trained professionals, insurance issues, lack of family supports, and unavailability of respite care.
Finally, concerns about accessibility and inclusion of people with disabilities that were identified from the programs included transportation issues for people with disabilities in accessing programs, concern about individuals with cognitive disabilities being able to respond to program structures, and physical barriers that may exist at program sites.
Discussion
The examination of time trends in CVD and its subsequent risk factors for people with and without disabilities in Delaware displayed some alarming differences. Individuals with disabilities were significantly more likely to have CVD, be less physically active, have a worse diet, and be obese than their nondisabled counterpart. Over time, the increased prevalence remained significantly higher for individuals with disabilities.
Either individuals with disabilities are not participating in health promotion programs or these programs are not having the intended effect on this population. There was a lack of disability-specific health promotion programs documented in the state of Delaware. To reap the benefits of the many CVD reduction health promotion programs, people with disabilities must be reached and included in these programs. Either a specific program can be developed that is tailored to the needs of those with disabilities or programs can be modified to be inclusive. Programs that have been specifically designed or adapted for those with disabilities have shown success in reducing disease risk factors and promoting healthy behaviors (Froehlich-Grobe & White, 2004; Robinson-Whelen et al., 2006). Without adaptations to existing programs, individuals with disabilities will face significant challenges in participation and thus will have lower improvements in positive health behaviors over time (Ewing et al., 2004).
Barriers to Participation and Recommendations
Although individuals with disabilities have a right for equal opportunity to participate in all programs (Lollar, 2002), they typically find that programs designed for individuals without disabilities pose many barriers. Some of these barriers include physical barriers such as not having ramps or parking spaces, inaccessible equipment, or unavailable transportation (Kroll, 2003). Another main barrier that many individuals with disabilities face is the belief that health educators and providers are not educated in disability-specific knowledge (Hwang et al., 2009). Furthermore, without the confidence that accommodations can successfully be made, it is difficult for many individuals with disabilities to not just attend but also fully participate in these programs efficaciously. Within the context of a social-ecological model, these barriers may negatively affect regular physical activity participation at each level: individual, neighborhood, community, and society.
One recommendation for Delaware programs would be to ensure they are following the Americans With Disabilities Act (ADA) guidelines (http://www.ada.gov/2010ADAstandards_index.htm) to prevent barriers to participation. For example, the guidelines in the ADA document how physical barriers to participation can be reduced by changes such as having accessible parking spaces and ramp and doorway sizes. If the buildings and areas in which the programs are conducted are ADA-compliant, individuals with disabilities might be more likely to participate in these programs, especially if the availability of these services and facilities is communicated to individuals.
Second, programs should have staff members who are trained in providing appropriate accommodations for participants since not having staff members with specialized training was a barrier to participation for many individuals with disabilities. These staff members could then provide accessibility accommodations, education to other staff members, and one-on-one assistance to individuals with disabilities, when needed.
Making accommodations within CVD prevention programs in Delaware is imperative to improving the health of individuals with disabilities. By ensuring that programs are ADA-compliant and provide disability-specific trained staff, CVD programs begin to address barriers to participation for those with disabilities so that all individuals can benefit from these programs. When facilitators of physical activity for those with disabilities are implemented across society, community, neighborhood, and individual levels, physical activity programs may be easier to access.
There are examples of successful programs that have both been specifically designed for individual with disabilities or have adapted their program to be inclusive of individuals with disabilities. For example, the CVD prevention program Yes U Can is specifically designed for individuals with disabilities (Yes U Can USA, 2014) and provides support for individuals with disabilities to increase inclusion and access to health and physical activity opportunities. Trained staff can provide programs that include activities such as swimming, yoga, and healthy eating. The Yes U Can program offers individuals with disabilities the ability to participate in CVD prevention programs and eliminates the many barriers associated with participation (Yes U Can USA, 2014). On the other hand, the YMCA of Delaware provides programs for all individuals. They have recently committed to providing adapted physical activity equipment and training staff to work with individuals with physical disabilities to become a more inclusive community-based program (YMCA, 2015).
The development of health promotion programs to improve the health of individuals with disabilities can best be understood through a social-ecological theoretical framework. There is an interdependency between the physical and social environments on an individual’s health and well-being. This interdependency is even more critical for individuals with disabilities given the existing barriers that arise due to the functional limitations of their underlying disability (Stokols, 1996). Programs such as the one that is offered by the YMCA of Delaware take a multidisciplinary approach to provide inclusive access within a community setting targeting improvement of health and well-being for all people (YMCA, 2015). It is imperative that these programs also include strong, longitudinal evaluation components to assess their impact on individuals with disabilities within the community.
Limitations and Future Research
This study was subject to several limitations. First, the BRFSS is a self-reported questionnaire, so there is the possibility of misclassification. However, it is unlikely that those with a disability would be more or less likely to under- or overreport their disease status and risk profile. Although BRFSS data has been inexistence since 1984, its advantage of strong surveillance may overshadow the lack of in-depth questions pertaining to nutrition and physical activity. These are more complex behaviors than can be accurately assessed via a single item self-response. Within the BRFSS, disability is also defined in very broad terms, and it is not possible to examine trends by specific disabilities. In 2013, the BRFSS actually included more detailed measures of functional types of disability, including mobility, cognitive, vision, self-care, and independent living. Future studies should examine health disparities by specific type of disability. In addition, time trends were documented by examining a series of cross-sectional data (the BRFSS) over time. This gives population trends, but it is unable to track an individual over time to obtain a measure of risk. Since six different time points were used on the BRFSS data, some of the questions were changed or eliminated, which altered the variable definitions slightly.
Last, since we were looking at statewide data, other factors could have determined how effective, or ineffective, the CVD prevention programs were. Examining differences in outcomes by sex, race/ethnicity, or socioeconomic status, which are important social determinants of health that might influence the efficacy of CVD prevention programs, is critical to gain a more nuanced understanding of the barriers individuals with disabilities face in accessing health promotion programs. Recent evidence using the BRFSS data has indicated that the increased rate of smoking and obesity found among individuals with disabilities is compounded by disparities associated with race, ethnicity, and socioeconomic factors. This is critical information for designing health promotion programs that target high-risk subgroups, inclusive of those individuals with disabilities (Courtney-Long, Romano, Carroll, & Fox, 2016).
Conclusions
The current study documented significant disparities in CVD and its subsequent risk factors over time for adults with disabilities. It is imperative to continue to monitor this population to identify continuing trends in health disparities. Effective surveillance programs should mandate that disability be included as a factor within all analyses, provide information about the association between disability status with health and health behaviors, and continue to monitor and track long-term health outcomes and health promotion program participation within populations by disability status (Krahn, Walker, & Correa-De-Araujo, 2015).
Individuals with disabilities face many challenges to participation in health promotion programs that target CVD. All health promotion programs, both community-based and those funded through the Department of Health and Social Services, should conduct a self-assessment to determine if their programs reach this high-risk population. Additionally, staff training should occur on a regular basis so that they are knowledgeable as to how to work with individuals with a wide spectrum of disabilities. With the appropriate resources, individuals with disabilities can participate in health promotion programs that will subsequently lead to healthier lifestyles and work toward reducing health disparities.
Footnotes
Mia A. Papas is now at the Christiana Care Health System.