



Abstract
Objectives
To describe outcomes of a 4-year physical activity (PA) and nutrition intervention (2013–2017) in Dove Springs, a low-income urban community in Texas.
Method
Go! Austin/Vamos! Austin is a place-based intervention targeting the built and social environments of PA and nutrition. Baseline and follow-up measures related to PA and nutrition were obtained from 357 parent–child dyads (final n = 236) in the intervention community and a control community. A three-level dose of exposure measure was created to indicate the amount of exposure to intervention activities across the 4 years. Pre–post changes in key outcomes by level of exposure and contrasts across “high exposure” and “no exposure” categories were obtained using repeated-measures regression, adjusting for important confounders.
Results
“High exposure” adult participants showed consistently more favorable changes than “no exposure” participants across a variety of indicators, including positive perceptions and utilization of community PA resources, amount of moderate PA, utilization of retail outlets offering fresh produce, and measures of healthy eating. Few improvements were seen in child-level outcomes.
Conclusions
Community interventions can successfully improve health-promoting behaviors provided they ensure sufficient dose of exposure.
Background
One of the most persistent public health challenges of our time is developing ways to meaningfully impact the obesity epidemic. Community-based interventions, with their ability to impact determinants at multiple levels and their greater population reach, offer a logical approach to address this challenge (Smedley & Amaro, 2016). Over the past two decades, a number of community-based interventions have attempted to intervene in obesity and related behaviors (Anderson et al., 2018; Bolton et al., 2017; Cheadle et al., 2018; Economos et al., 2013; Glasson et al., 2013). While the specificity of these interventions makes it difficult to draw generalizations, it is evident that higher dose strategies (Cheadle et al., 2018) and program characteristics that facilitate participant engagement and structural sustainability of the intervention (Economos et al., 2013; Glasson et al., 2013; Kozica et al., 2016) are important factors in the success of these interventions.
In 2012, a community wide, place-based multicomponent obesity initiative, Go! Austin/Vamos! Austin (GAVA) launched in the Dove Springs area of Austin, Texas, a predominantly Hispanic neighborhood that is in the bottom 10% of all zip codes in Texas when classified by income. With funding from the Michael and Susan Dell Foundation, GAVA targeted multiple spheres of influence on diet and physical activity (PA) among adults and children in Dove Springs, with a particular focus on environmental influences. Heeding the lessons from previous interventions, GAVA was intentionally designed as a coalition-based approach that sought to engage and mobilize community resources and build institutions that could sustain high doses of intervention efforts over long durations (Hussaini et al., 2018; McLeroy et al., 2003). The evaluation of GAVA ran concurrent with the first 5 years of the intervention with the goal of identifying best practice intervention strategies and propagating multilevel evaluation approach. The work described here demonstrates that community-based health promotion interventions grounded in empirical research and methods have the potential to be effective and scalable.
Dove Springs, with a population of 43,500, had a notably deficient built environment and infrastructure for PA and healthy eating at the start of the GAVA intervention. Public parks and recreation facilities were available, but lacked basic amenities such as functioning playscapes, water fountains, park benches, and safety features including lighting in and around parks. Several of the local elementary and middle schools did not have tracks, courts or playfields. Traffic safety was an overriding issue, further limiting opportunities for PA. The food environment in Dove Springs skewed markedly toward unhealthy foods. Access to full-service groceries was limited; on the contrary, data showed that most residents were located within a 10-minute walk of one or more unhealthy food outlets, including fast-food establishments, convenience stores, and bakeries (McCray et al., 2010).
Purpose
In response to the needs of the Dove Springs community, GAVA sought to harness and improve existing built and social environments by increasing access to, and accessibility of, environmental assets, such as parks and healthy food retail outlets, and to couple these with demand-building strategies in order to influence healthy behavior changes. Four sectors of activity were designated as targets for action: community food, community PA, school, and early childhood. At a later point, safety was formalized as an additional sector. Organizational partners, that is, local agencies with experience in programming addressing one or more of these sectors, served as content experts. Community capacity was built by engaging a large, community-wide coalition and creating local-level resident and school-led teams. To date, 47 teams have been organized in microneighborhoods (geoteams), or around specific sectors and related activities and resources. Over 3,300 individuals have been involved with the coalition in some capacity, and network linkages have been created with 287 organizations.
Teams and networks developed through the GAVA initiative directed their efforts toward improvement or creation of “community assets,” that is, physical or social infrastructure elements related to the five sectors. Over 90 assets in the Dove Springs community have been developed or improved in some capacity. Programming around PA assets started earlier, and has been more widespread, than programming around nutrition assets. Examples of activities related to improvement of PA assets include parks beautification, safety enhancements (lighting, playground improvements), and installation of drinking water stations. Additionally, an increased number and variety of PA programs were offered at public venues, including youth sports clubs, and yoga and Zumba classes for adults. Nutrition programming started more recently (in late 2016), in part because of the lack of existing assets at the start of the study, and is still evolving. The primary nutrition asset improvement strategy in Dove Springs is the introduction of healthy food options (primarily fresh fruit and vegetables [F&V]) at corner stores and expanding the range of healthy food retail options, such as school and community farm stands. Other nutrition-related activities include school gardens, and working with local organizations to provide cooking and other nutrition education classes.
Method
Evaluation Design and Measures
A 4-year evaluation study for the GAVA program was carried out independently by the University of Texas Health Science Center School of Public Health. The centerpiece of the evaluation study was a 4-year cohort of parent–child dyads from Dove Springs assembled in 2013, with a parallel cohort in a control community. The evaluation results reported in this article are focused on outcomes related to two sectors: PA and healthy eating. The survey methodology and brief descriptions of measures relevant to this article are described below (greater detail on each of the measures is available elsewhere; van den Berg et al., 2019).
The Cohort Survey
A cohort-control study was assembled, with parallel cohorts of parent–child dyads recruited from the Dove Springs area and from a control area comprising socioeconomically and demographically similar communities drawn from adjacent zip codes. Only parents (or primary guardians) of incoming kindergarten children in elementary schools in the Dove Springs area were eligible for inclusion in the study. Consenting parents were asked to fill out surveys relating to their demographics, their perceptions regarding PA and food retail resources in the community, and both their and their child’s PA and healthy-eating behaviors. In addition, anthropometric measures were obtained from the parent and child. These surveys were administered annually to cohort participants during the period 2013 to 2017, for a total of five surveys, including the baseline.
Outcome Measures
Perceptions of PA and food environments
A number of questions in the cohort survey sought to obtain respondents’ perceptions of availability and quality of PA facilities and PA programs in the community, as these are necessary to guide future interventions (Gustafson et al., 2018). With regard to the food environment, questions focused on utilization of local food retail outlets and perceptions of healthy food availability in the community. Most of these measures were qualitative ordinal measures and were collapsed to binary measures in analysis to facilitate comparison across time points and study conditions.
Health behaviors related to PA and diet
Behavioral measures of interest for parents included simple measures of moderate and vigorous PA in the past week, and several measures of daily (typical) F&V consumption. For children, parent responses to questions regarding children’s outdoor play and consumption of healthy/unhealthy foods were used as measures of diet and PA behaviors. Additional behavioral questions related to utilization of PA resources were asked.
Body mass index
Objective height and weight data were obtained using stadiometers for both parents and children and used to compute body mass index scores or percentiles in order to categorize respondents as normal weight, overweight, or obese.
Dose of Exposure
Measuring exposure to the GAVA intervention proved challenging. Because of the high degree of residential mobility and the length of the period covered by this evaluation, a substantial proportion of residents who were present in Dove Springs or in the control community in 2013 were no longer residing at that location after 4 years (2017); indeed, a small proportion of control community residents had moved into Dove Springs by 2017. Second, as mentioned earlier, the public elementary schools in the Dove Springs area emerged as a significant setting for asset improvement and program delivery. Again, over the period covered by this evaluation, a number of children moved to charter schools that did not offer GAVA programming. To account for mobility in and out of the GAVA community and schools, we created a “dose of community exposure” measure, which took values of 0 to 5 depending on the number of years the respondent reported residing in Dove Springs between 2013 and 2017, and a “dose of school exposure,” which was assigned a value of 0 to 5 depending on the number of years the child attended one of the five elementary schools that carried GAVA programming. 1 These two measures were added to create a single “dose of exposure” scale that ranged from 0 to 10; this was further divided into three categories to distinguish different levels of exposure from No exposure through Medium exposure to High exposure.
Demographic Measures
Demographic measures were obtained via the cohort survey for purposes of sample description as well as for use as confounders in statistical analysis. Key demographic measures include the following: age and sex of both parent and child; socioeconomic measures such as income, food insecurity, and receipt of government benefits; ethnicity, language spoken at home, and household size. Detailed response categories were created to reflect the full distribution of these measures in the community, but for the purpose of these analyses, response categories were combined into larger groups as described in the Results section.
Most measures utilized in the cohort survey and other instruments in this evaluation were adapted from other validated surveys; however, several measures were created specifically to obtain data on endpoints that were important to the GAVA implementation team. Testing was conducted for surveys prior to field administration, to ensure that questions were culturally and socioeconomically sensitive and were within the comprehension level of all potential respondents. Both Spanish and English versions of surveys were available to respondents. Procedures conducted for this evaluation were approved by the University of Texas Health Science Center’s Institutional Review Board (HSC-SPH-13-0108) and the appropriate school district review boards.
Statistical Analysis Methods
Frequency distributions of key demographic characteristics were obtained for both the cohort and the control samples at baseline, and compared via chi-square statistics to examine distributional differences across the two conditions. Because of spatial and temporal variability in program initiation and intensity across the 4 years since the implementation of GAVA, it was decided that the only meaningful pre–post comparison for the entire community would be from baseline to Year 4 (i.e., from 2013 to 2017), as this period would allow for sufficient asset development across the entire Dove Springs community. For pre–post comparison of key behavioral and perceptual outcomes, contrasts across the highest and lowest categories of the three-level exposure variable (i.e., No exposure and High exposure) were obtained via repeated-measures regression models implemented in a hierarchical linear model framework, and adjusted for a number of sociodemographic measures, including age, marital status, food insecurity, receipt of free/reduced-price lunch at school, parent educational status, language, ethnicity, and number of children (as a measure of family size). Hierarchical linear models were used because they can accommodate varying numbers of observations per person, including different times of entry. All models included a time × treatment interaction, where time represented year of data collection, and was modeled linearly, and treatment was a three-level exposure variable, specified as a categorical measure. The criterion for retaining confounders was a p value of <.20 in a regression adjusting only for that confounder. Separate models were run for each PA-related outcome and each nutrition-related outcome. Finally, changes in weight status in the GAVA and control communities were assessed with similar models. The threshold for statistical significance was set at a p value ≤.05.
Results
At baseline, in 2013, 150 participants were recruited from the Dove Springs community, and 163 from the control community. In the first year following baseline data collection, 50 additional participants were recruited (25 each in the Dove Springs and control community) to maintain sample size. Year-to-year attrition rates were comparable across control and GAVA cohorts. In all, 357 participants were recruited, and 236 were followed through the final follow-up data collection (2017). In the control community, 68% (128 of 188 recruited) of participants provided data in the final year, while in the Dove Springs community, 61% (108 of 175 recruited) remained in the final year.
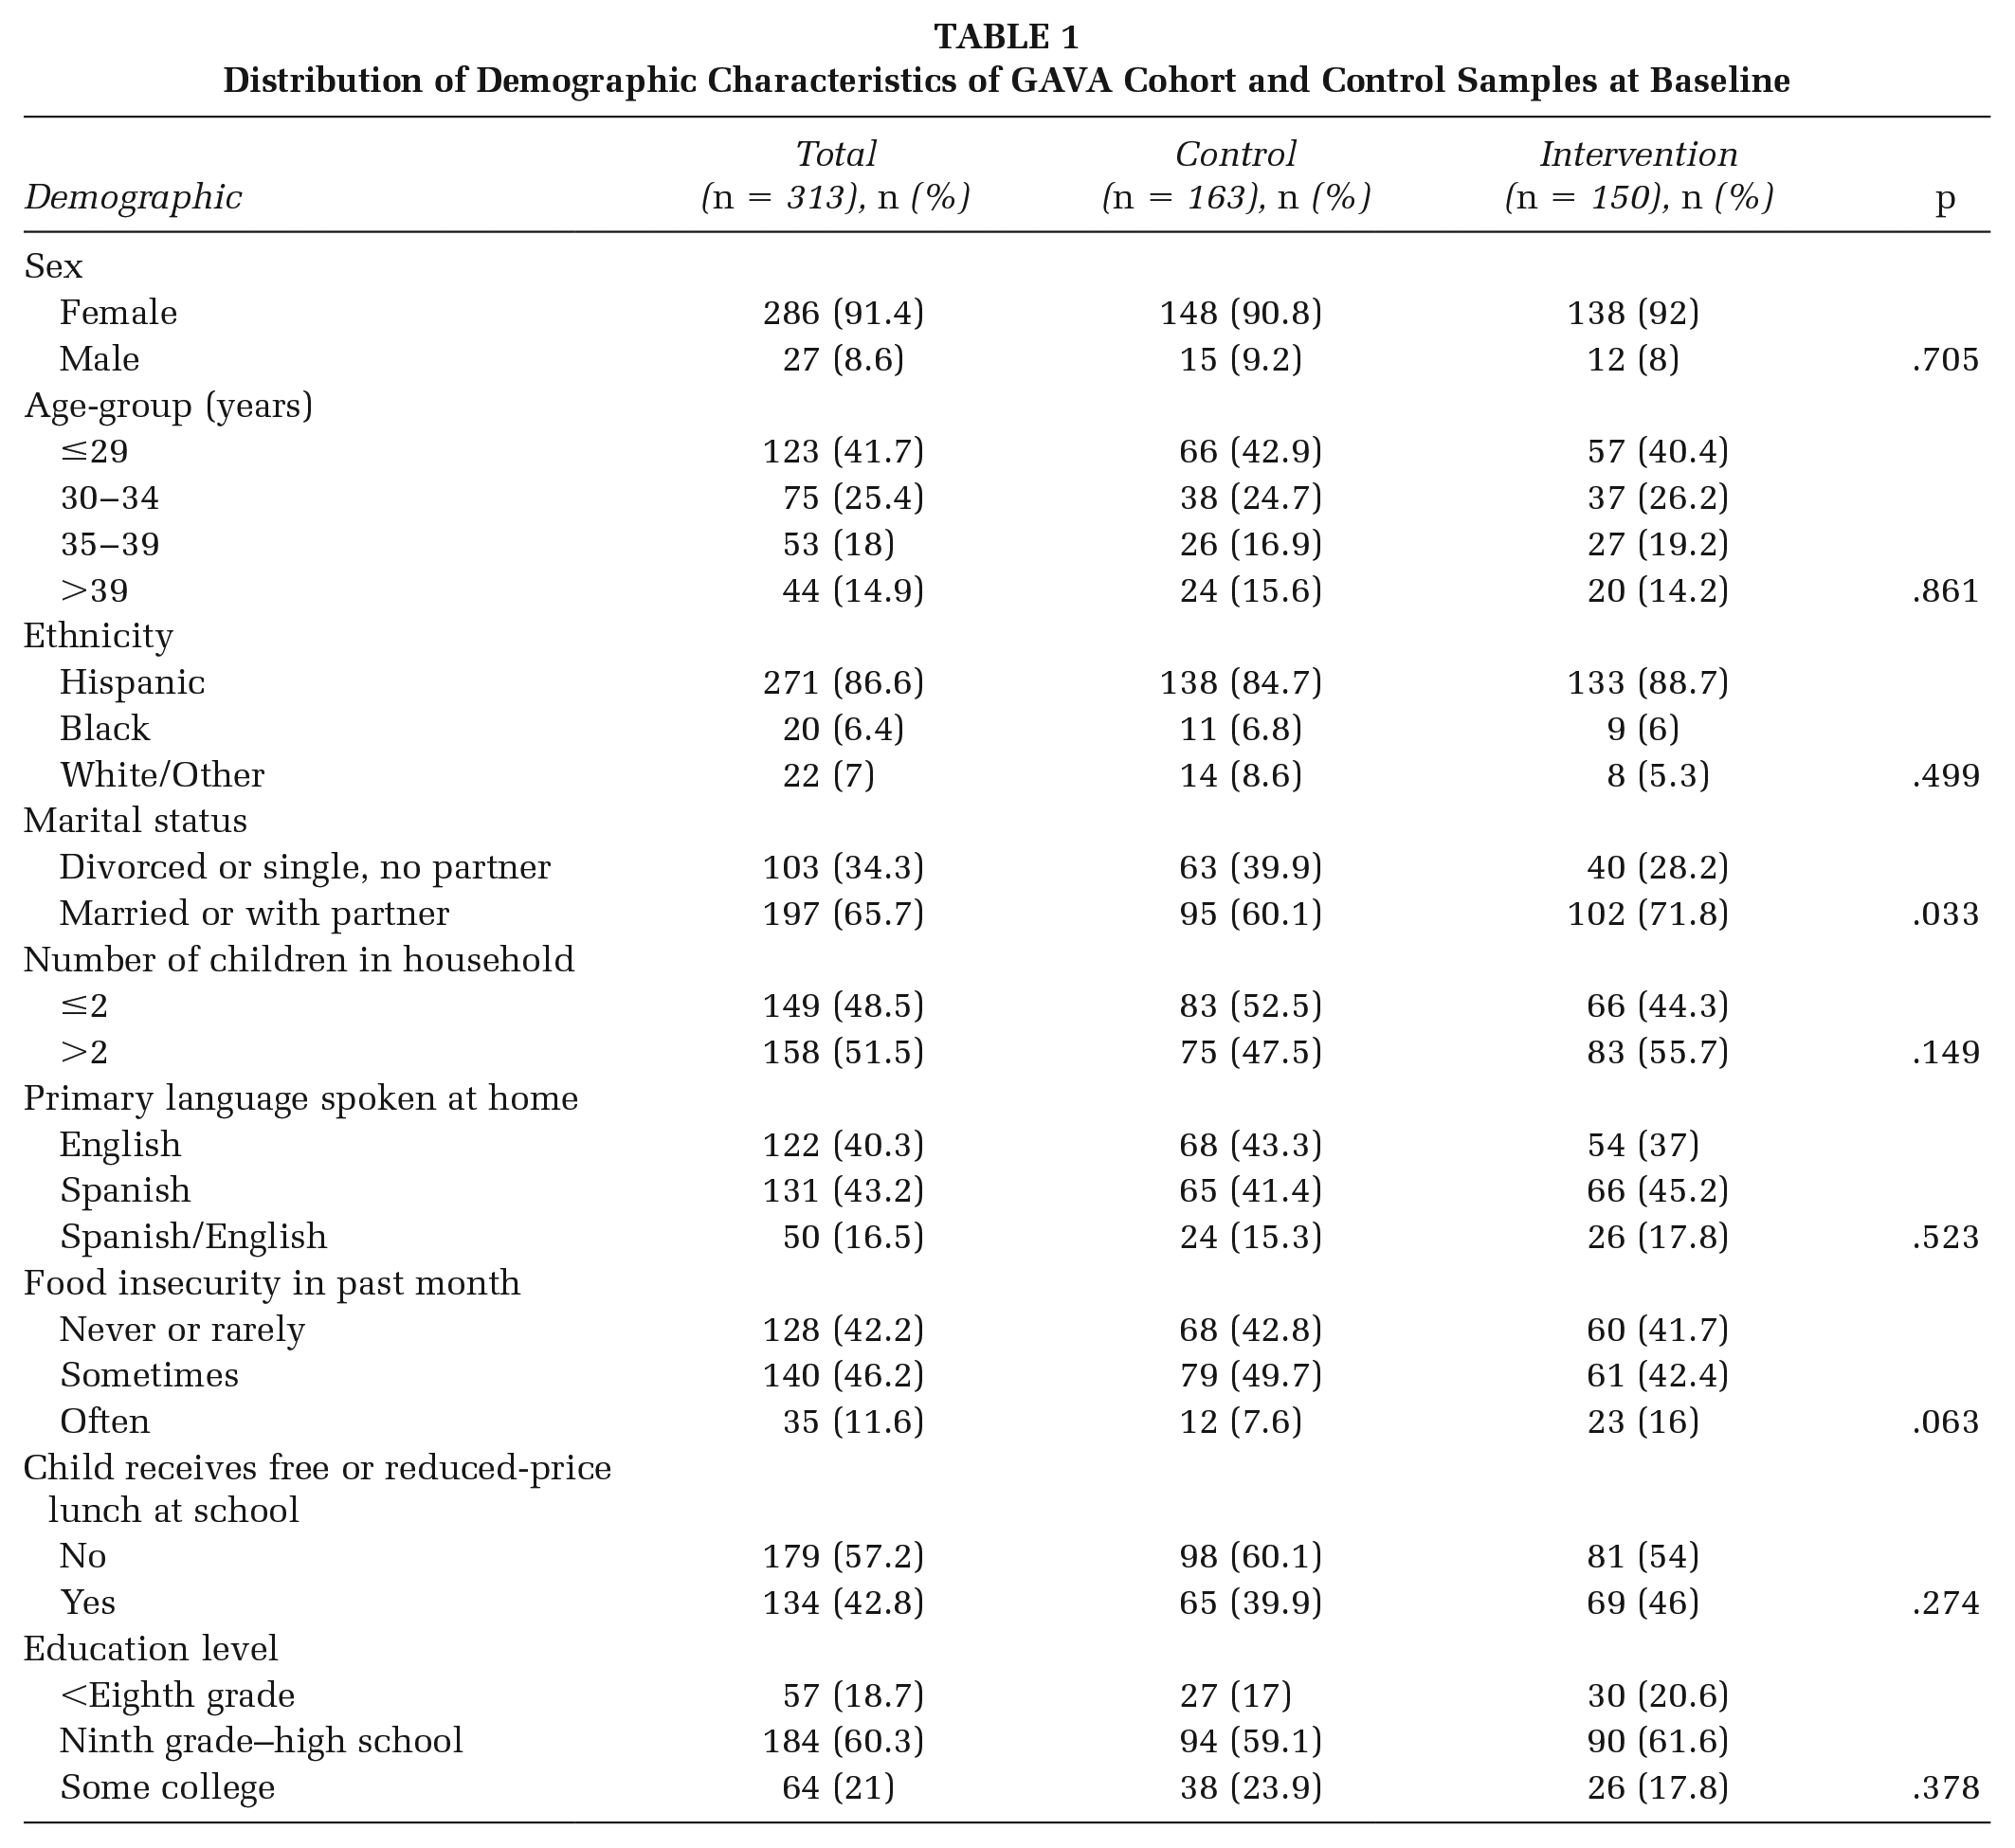
Demographic characteristics of Dove Springs and control cohort sample participants at baseline (in 2013) are described in Table 1. Approximately 42% of the mostly female sample was less than 30 years of age, and two thirds were less than 35 years of age. Over 85% of the sample was Hispanic, and 40% spoke primarily Spanish at home. About two thirds of the participants lived with a partner or spouse, with larger proportions in the Dove Springs. Approximately half the sample had two or fewer kids in their household. Just over 10% of participants reported experiencing some degree of food insecurity in the prior month, and two in five of the children obtained free or reduced-price lunch at school. Over three quarters of the sample had no college education. On most of the socioeconomic indicators examined (food insecurity, receipt of free/reduced-price lunch, parent education), the control cohort had a somewhat poorer profile than the Dove Springs cohort; however, the two communities were statistically comparable.
Distribution of Demographic Characteristics of GAVA Cohort and Control Samples at Baseline
From the point of view of the GAVA project, changes in residents’ perceptions and utilization of PA and nutrition assets over the 4-year period from 2013 to 2017 (pre–post changes) are the most important intermediate outcomes. Table 2 presents model estimates of pre–post changes in perceptions and utilization of community PA resources, in the No exposure and High exposure group, respectively (hereafter referred to as Unexposed and GAVA-exposed group, respectively), as well as the net change in the GAVA-exposed group (relative to the Unexposed group) for each outcome, that is, a measure of effect size. Across most measures, the GAVA-exposed group showed substantially increased positive perceptions of neighborhood PA facilities and programming. There was a 20% or greater pre–post decline in the percent of GAVA-exposed participants that reported no drinking water facilities at public PA facilities, or no PA programs, significantly higher than pre–post changes in the Unexposed groups. There were also significant decreases (>15%) in the percent of GAVA-exposed participants that reported quality issues with PA programs and facilities. Changes in these measures were consistently smaller, and nonsignificant in the Unexposed group. The GAVA-exposed group showed changes in the wrong direction on just one of the PA perception metrics, that is, whether it was safe for teens to bike or walk in the neighborhood. Measures of utilization of PA resources for the most part did not show an intervention effect, except for significantly greater utilization of parks for PA in the GAVA-exposed group. Pre–post changes in the group with “Medium exposure” (data not shown) are for the most part intermediate between the Unexposed and GAVA-exposed group.
Percent Point Changes in Perceptions and Utilization of Community Physical Activity Facilities and Resources
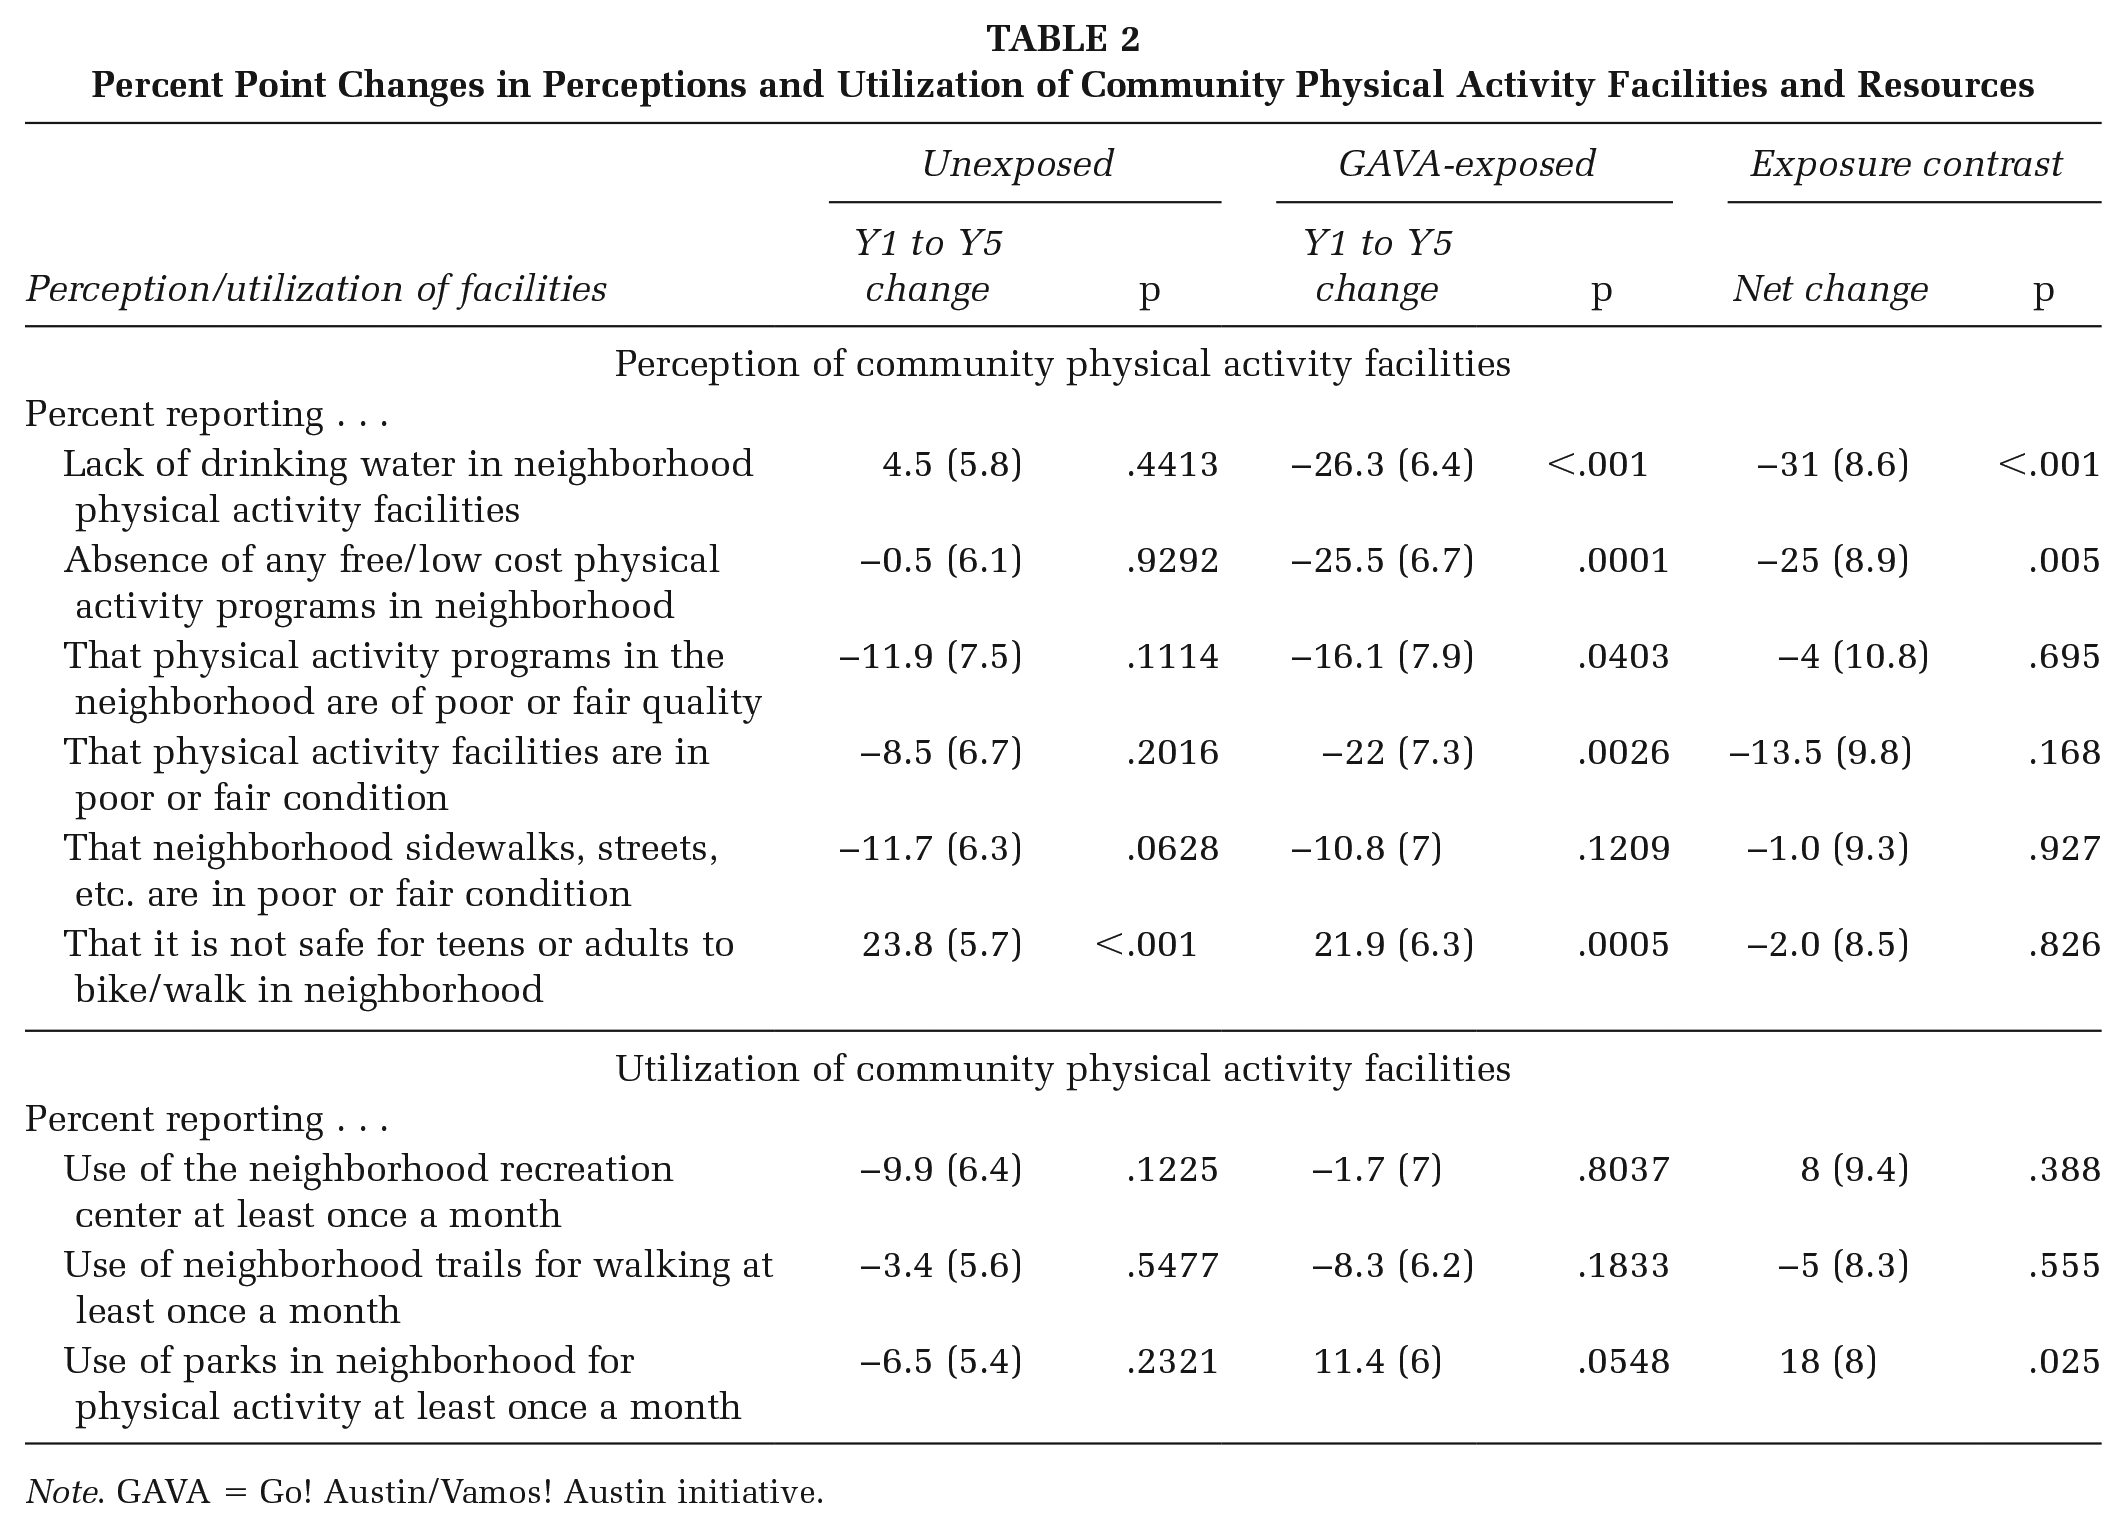
Note. GAVA = Go! Austin/Vamos! Austin initiative.
Pre–post changes in utilization and perception of community nutrition resources across the Unexposed and GAVA-exposed group are presented in Table 3. Utilization of community nutrition resources, particularly the use of corner stores and other smaller food retail outlets for obtaining F&V increased significantly in the GAVA-exposed group, with no corresponding increase in the Unexposed group. Attendance at gardening classes too, showed higher increases in the GAVA-exposed group compared to the Unexposed group. Changes in nutrition perceptions—specifically, perceptions regarding the quality, selection and cost of F&V—are in the opposite direction to what was expected, with significantly larger unfavorable changes in the GAVA-exposed group relative to the Unexposed group.
Percent Point Changes in Perceptions and Utilization of Community Nutrition Offerings and Resources
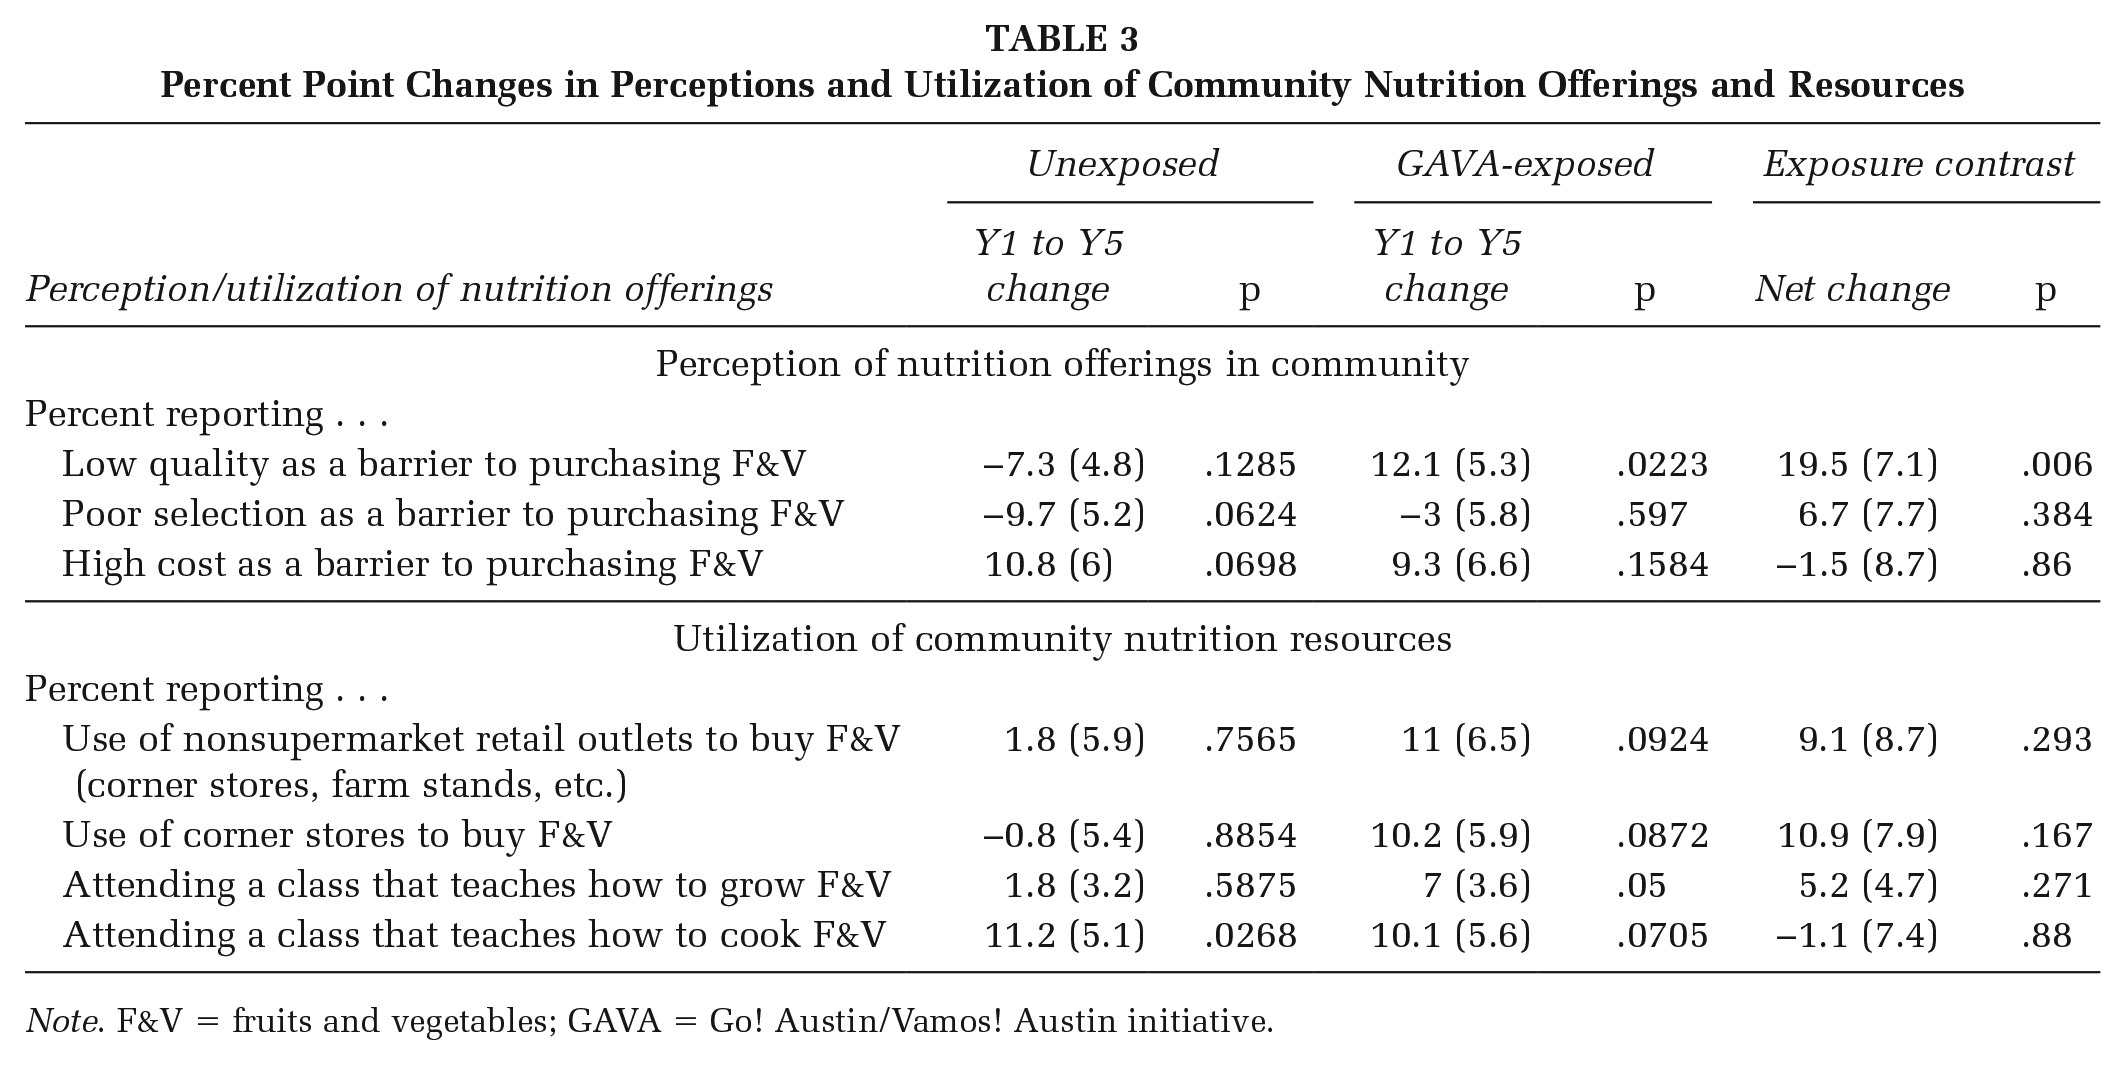
Note. F&V = fruits and vegetables; GAVA = Go! Austin/Vamos! Austin initiative.
Table 4 shows changes in selected behaviors related to PA and nutrition. Data show pre- and post-values of each behavior in the Unexposed and GAVA-exposed groups, respectively. Statistically, the contrast between these two groups was not significant for any of the variables, however, across most of the variables, favorable changes (indicated by a “+” in the last column) were larger in the GAVA-exposed groups. In terms of PA, the percent of GAVA-exposed participants that participated in at least some moderate PA on most days of the week doubled, from 15% to 30% (a statistically significant increase). There were no favorable changes in children’s PA behaviors. Changes were seen across a variety of adult nutrition–related behaviors. Among exposed residents, there were (a) substantial increases in the percent consuming one or more cup of vegetables per day (64% to 76%); (b) increases in the score for home availability of F&V, and reductions in the score for home availability of unhealthy foods; and (c) Increases in the Healthy Eating Index score, to an extent that was not seen in the Unexposed group. Changes in nutrition parenting behaviors in the GAVA-exposed group were smaller, but still exceeded those seen in the Unexposed group.
Changes in Individual-Level Behaviors and Outcomes Related to Nutrition and Physical Activity

Note. GAVA = Go! Austin/Vamos! Austin initiative; PA = physical activity; F&V = fruit and vegetables; FMNV = foods of minimal nutritional value; SSB = sugar-sweetened beverage.
The GAVA intervention was focused on improving opportunities and access to resources supporting healthier nutrition and PA and did not directly aim to reduce weight. Nevertheless, there is some evidence that 4-year weight gains in the GAVA-exposed cohort have been smaller than those observed in the Unexposed cohort (data not shown). Differences across treatment groups in pre–post changes in percent obese among adults across two exposure categories (Low exposure: 0–5, High exposure: 6–10) were estimated via regression. The Low-exposure group experienced a 7% point increase in the prevalence of obesity (p = .01), while the High exposure group experienced a nonsignificant 3% increase in the prevalence of obesity (p value for contrast = .08). Increases in percent obese among children were large, and comparable across both the high- and low-exposure group for different specifications of exposure, suggesting no intervention effect.
Discussion
Evaluating community-based interventions is notoriously challenging (Karacabeyli et al., 2018). Unlike clinical interventions, impacts are likely to be diluted in community interventions (Heerman et al., 2018), making detection of significant effects difficult (Elbel et al., 2016). Contagion to neighboring communities is unavoidable, and threats from secular changes that compete with the intervention and impact the wider community are ever-present in long-term interventions. The GAVA intervention occurs in a rapidly changing community subject to notable population movement and faces each of these problems. Despite these challenges, the 4-year evaluation results presented here show surprisingly robust impacts of the intervention across a variety of indicators, specifically (a) large increases in positive perceptions and utilization of community PA resources, as well as increases in moderate PA among adults; (b) large increases in use of alternative retail outlets offering fresh produce, and some increase in healthy eating; and finally (c) some evidence of a slowdown in body mass index increases. Few improvements were seen in child-level outcomes, however. Children in both the GAVA and control cohorts showed large increases in obesity, no particular increases in healthy nutrition behaviors, and large decreases in PA.
These results appear to be consistent with an intervention effect, with consistently greater magnitude of favorable changes among GAVA-exposed participants than among unexposed participants. Results also align with intervention activities, such as improvement of parks and provision of PA programming, provision of drinking water fountains, and social marketing of increased F&V offerings at corner stores. Finally, the results across outcomes are internally consistent. The increase in moderate, but not vigorous PA, would be expected to result from increased use of parks for PA. Increases in consumption and home availability of healthy foods could reasonably be attributed to greater utilization of healthy food retail outlets. The lack of changes in child-level outcomes are likely due to the absence of a home-based component targeting parenting behaviors. A review of the literature on interventions that successfully addressed child obesity and PA shows that they generally utilize more intensive strategies, such as family-based strategies (Anderson et al., 2015; Sacher et al., 2010), as well as parent outreach and education intended to alter the home environment (Economos et al., 2013; Folta et al., 2013).
Limitations
Notably, positive effects were identified despite a number of weaknesses of the study. The questions utilized in the survey were developed de novo for the project and for the study population and are weak in many cases. The exposure measure could be more sensitive if it involved more dimensions such as domain and effectiveness of strategy (Wang et al., 2018), but that was outside the scope of this study. Use of a 4-year pre–post interval allowed time for effects to be expressed; however, some fading of effects of early interventions could have occurred over this period. Despite these weaknesses, several strengths of the study design lend plausibility to the results. Utilizing a relatively large cohort allowed us to examine within-person changes, the use of a control community strengthens inferences about intervention effects, and the evaluation of a large range of related outcome measures allows confidence in the robustness of results. These strategies set the GAVA evaluation apart from several community-based interventions that rely on cross-sectional series, synthetic cohorts constructed through propensity scores, and a limited range of outcomes to evaluate intervention effects (Liao et al., 2016; Millar et al., 2011).
Implications for Practice
Results from the GAVA intervention provide convincing evidence that it is possible to bring about improvements in health-promoting behaviors of low-income populations through community interventions that successfully mobilize the efforts of residents and local institutions. A key public health implication of our findings is that ensuring a sustained and high dose of exposure is necessary to the success of community-based interventions. While changes were primarily observed among adults, not among children, community interventions targeting outcomes among children may need to enhance their activities in other ways, such as through greater emphasis on family-based programs.
Footnotes
Authors’ Note:
The implementation of the Go! Austin/Vamos! (GAVA) initiative involved a great number of individuals, and we are grateful for all the leaders and community residents who made this initiative successful. However, we would like to specifically thank Carmen Llanes Pulido for her excellent leadership of the GAVA project. In addition, we would like to thank all the families who have participated in the GAVA evaluation by completing yearly surveys and measurement. This study was funded by the Michael and Susan Dell Foundation. Additional support was provided by the St. David’s Foundation and the Michael & Susan Dell Center for Healthy Living at the University of Texas Health Science Center at Houston, School of Public Health in Austin.
