



Abstract
The aim of our study was to evaluate a statewide obesity prevention program, designed to improve two social determinants of health (access to healthy foods and opportunities for physical activity) by changing worksite policies, systems, and environments. We used data on social determinants of health to identify priority communities and funded 25 contractors to recruit and engage worksites in those communities. We employed a pre/post quasi-experimental design and used the Centers for Disease Control and Prevention’s Worksite Health ScoreCard to assess implementation of nutrition and physical activity strategies. Contractors collaborated with partners to conduct pre- and postassessments at 313 worksites. Worksites were successful at implementing all except one strategy; implementation doubled for eight strategies and tripled for three. We used weighted scores to incorporate strength of the evidence-base and level of impact into our analysis; increases in strategy implementation were statistically significant in worksites that provided places to purchase food and beverages and in those that did not. Our study revealed several important recommendations for practice. Use available data to prioritize communities experiencing health disparities and identify PSE change strategies to increase access to nutritious foods and physical activity opportunities. Engage with reputable community-based partners from different sectors when designing and implementing programs. Use standardized tools, such as the Worksite Health ScoreCard, to evaluate public health initiatives.
Keywords
Background
Obesity is a common, serious, and costly disease (Centers for Disease Control and Prevention [CDC], 2021). It increases the risk of a range of chronic diseases in adults, including heart disease, type 2 diabetes, and some cancers (Lauby-Secretan et al., 2016; National Heart, Lung, and Blood Institute, 1998; National Institute of Diabetes and Digestive and Kidney Disease, 2018; Zhang et al., 2019). Major risk factors are physical inactivity and poor nutrition (CDC, 2021), individual behaviors that are heavily influenced by the social, economic, and physical conditions in the communities where people live, work, and play (Prevention Institute, 2015). These conditions, the social determinants of health (SDOH), can either support or hinder our ability to live healthy lives (CDC, 2021). SDOH are grouped into five key areas, as shown in Figure 1 (U.S. Department of Health and Human Services, Office of Disease Prevention and Health Promotion, 2021). Two important SDOH are access to nutritious foods and opportunities for physical activity. Differences in access contribute to health disparities in obesity rates and other related chronic diseases among different racial, ethnic, and socioeconomic groups. Removing systemic and unfair barriers to practicing healthy behaviors can reduce disparities (CDC, 2022). One approach is to change policies, systems, and environments (PSEs) so they support increased access to healthy foods and physical activity in places where people spend a lot of their time (e.g., worksites).

Social Determinants of Health
Worksites are practical for PSE change strategies because so many Americans have jobs (U.S. Bureau of Labor Statistics, 2022) and spend almost 8 hours per day at workplaces (U.S. Department of Labor, Bureau of Labor Statistics, 2020). The Community Preventive Services Task Force (CPSTF) recommends worksite programs intended to improve diet and/or physical activity behaviors based on strong evidence of their effectiveness. Programs should include at least one approach from each of these intervention types: (a) informational and educational, (b) behavioral and social and (c) policy and environmental strategies (CPSTF, 2022). Despite the strong evidence-base and benefits to employee health outcomes, research has shown that employers need assistance identifying, assessing, and implementing appropriate evidence-based interventions (Goetzel & Ozminkowski, 2008; Hannon et al., 2012; Harris et al., 2014; cited in Cluff et al., 2018).
In response to this need, CDC developed the Worksite Health ScoreCard (HSC) as a valid and reliable tool (mean question concurrence rate of 77%; Roemer et al., 2013) to help worksites determine if their current PSEs are supportive of employee health (Lang et al., 2020). More than 2,800 worksites in 48 states have used the HSC (Lang et al., 2020), in some cases to assess worksite strategy implementation (Cluff et al., 2018; Lang et al., 2017; Safeer et al., 2018). Despite extensive use of the HSC across U.S. worksites, to our knowledge, there are no published studies using it to evaluate a statewide obesity program’s implementation across multiple worksites in communities experiencing health disparities.
Aims
The primary aim of our study was to use the HSC to evaluate implementation of a statewide obesity prevention program in worksites. The following questions guided the evaluation: What were the characteristics of worksites recruited to participate in the program? Were the worksites located in communities experiencing health disparities? Were the evidence-based physical activity and nutrition PSE change strategies implemented at these worksites? Which of these strategies were most common when Creating Healthy Schools and Communities (CHSC) began and ended? For which strategies did implementation change the most over time? Were the changes in strategy implementation statistically significant? For each evidence and impact category, which strategies were most commonly implemented during the CHSC timeframe? Answers to these questions will help other public health practitioners identify communities experiencing health disparities and leverage current CDC recommendations to identify, assess, and improve the PSEs at worksites.
Methods
We used a pre/post quasi-experimental design to determine if the CHSC program contributed to improvements in nutrition and physical activity PSEs at worksites in communities experiencing health disparities in New York State (NYS). While CHSC was a 5-year (2015-2020), coordinated, multi-sector effort to increase access to healthy food and opportunities for physical activity, to reduce major risk factors of obesity, diabetes, and other chronic diseases in communities and schools, the focus of this article is on its worksite component only. More information about the CHSC program has been published elsewhere (Boehm et al., 2020; Calise et al., 2020).
The NYS Department of Health (DOH) used publicly available data on SDOH to identify priority communities for the CHSC program. For most of New York City, school districts and their associated neighborhoods were prioritized if the minority population was greater than 40% and the percent of student population eligible for free and reduced lunch was above the city-wide median. For the rest of NYS, DOH prioritized school districts and associated communities with minority populations greater than 40%. DOH also prioritized districts and communities above the statewide median for percentage of district populations living poverty, population over 18 years with less than a high school education, student population eligible for free and reduced lunch, and school district’s students with obesity.
To identify worksites for the CHSC program, DOH funded community-based contractors to recruit and engage worksites in priority communities. DOH employed a competitive bid process to select 25 experienced contractors, including county health departments, rural health networks, Board of Cooperative Extension Services, Cornell Cooperative Extension, community organizations, and academic institutions. To determine which strategies to implement at each worksite, contractors collaborated with site-level partners to conduct HSC assessments from 2015 to 2020.
Instrument
The HSC was created in 2012 and updated in 2014 to include 125 yes/no questions across 16 core topic areas (e.g., tobacco control, nutrition, physical activity, and lactation support) that assessed whether a strategy is in place at a worksite (Lang et al., 2020). Each strategy was assigned a weighted score based on an expert panel’s assessment of the item’s evidence-base and impact-level (CDC, 2019). Evidence-base scores ranged from 1 to 4 (weak to strong) and impact-level scores ranged from 1 to 3 (small to large). These scores were combined into a final weighted point value of 1 (good), 2 (better), or 3 (best). Because the CHSC program focused on nutrition and physical activity, only those topic areas were used for this evaluation project, which included 20 strategies (Items 29–41 and 48–54). Items 55 and 56 were omitted because they did not align with CHSC program goals. The entire HSC is available on CDC’s public website: https://www.cdc.gov/dhdsp/pubs/docs/hsc_manual.pdf.
Procedures
CHSC contractors used the HSC to assess the degree to which nutrition and physical activity strategies were implemented at 411 worksites. They collaborated with small teams of site-level partners to: conduct preassessments, decide which strategies to focus on, implement these strategies, and conduct postassessments. The average amount of time between pre and postassessments was 24 months. Before collecting data, CHSC contractors attended a 1-hour virtual training. They were instructed to answer “no” to HSC items that were not applicable. Contractors used paper and pencil to collect HSC data and then submitted those data to DOH via SurveyMonkey®. Each contractor collected an average of 16.44 preassessments (range 1–48) and 12.52 postassessments (range 0–48).
Data Analysis
We computed frequencies for worksite industry type, size, urban-rural status, and location. We also computed frequencies separately for worksites with and without places to purchase food and beverages (based on the answer to question #29, “Does your worksite provide places to purchase food and beverages?”). We obtained industry type, size, and address from the NYS Department of Labor (2021) online Business Directory. We used the “county” field to assign an urban-rural category based on the National Center for Health Statistics’ classification scheme (Ingram & Franco, 2014). We used the “city” field to determine if worksites were in the identified priority communities. We did not assess the impact of worksite characteristics on strategy implementation.
Worksite responses to preassessment items indicated which physical activity and nutrition strategies were already implemented when CHSC began. We calculated the number and percent of worksites that responded “yes” on the postassessment to determine which strategies were implemented when CHSC ended. We compared the number and percentage of worksites implementing strategies at pre and post to describe change over time (% change= difference between “n” at pre and “n” at post ÷ “n” at pre × 100). Our analysis of nutrition items excluded worksites that did not provide places to purchase food and beverages (Questions 30–35).
We used CDC’s weighted point values to calculate mean scores for pre- and postassessments. Then, we compared mean scores for the following: each item, all nutrition items combined, all physical activity items combined, and all combined nutrition and physical activity items. We used standard deviations and paired t-tests to determine statistical significance (p < .05) of observed changes. These analyses were conducted separately for sites with and without places to purchase food and beverages. The impact of contractor on mean scores was not examined.
We conducted additional analyses on worksites where strategies were not already implemented when the program began to increase our understanding of the impact of CHSC. For this subgroup, the number and percent of worksites that responded “yes” and “no” to each question on the postassessment were calculated. For each evidence and impact category, averages and ranges were calculated and compared.
Data were cleaned and analyzed using SAS (version 9.4) statistical software (SAS Institute Inc., Cary, North Carolina).
Results
When CHSC participation began, 411 worksites completed preassessments. Of these, 313 (76%) also completed postassessments when their participation in CHSC ended. We included only these 313 worksites in the analysis.
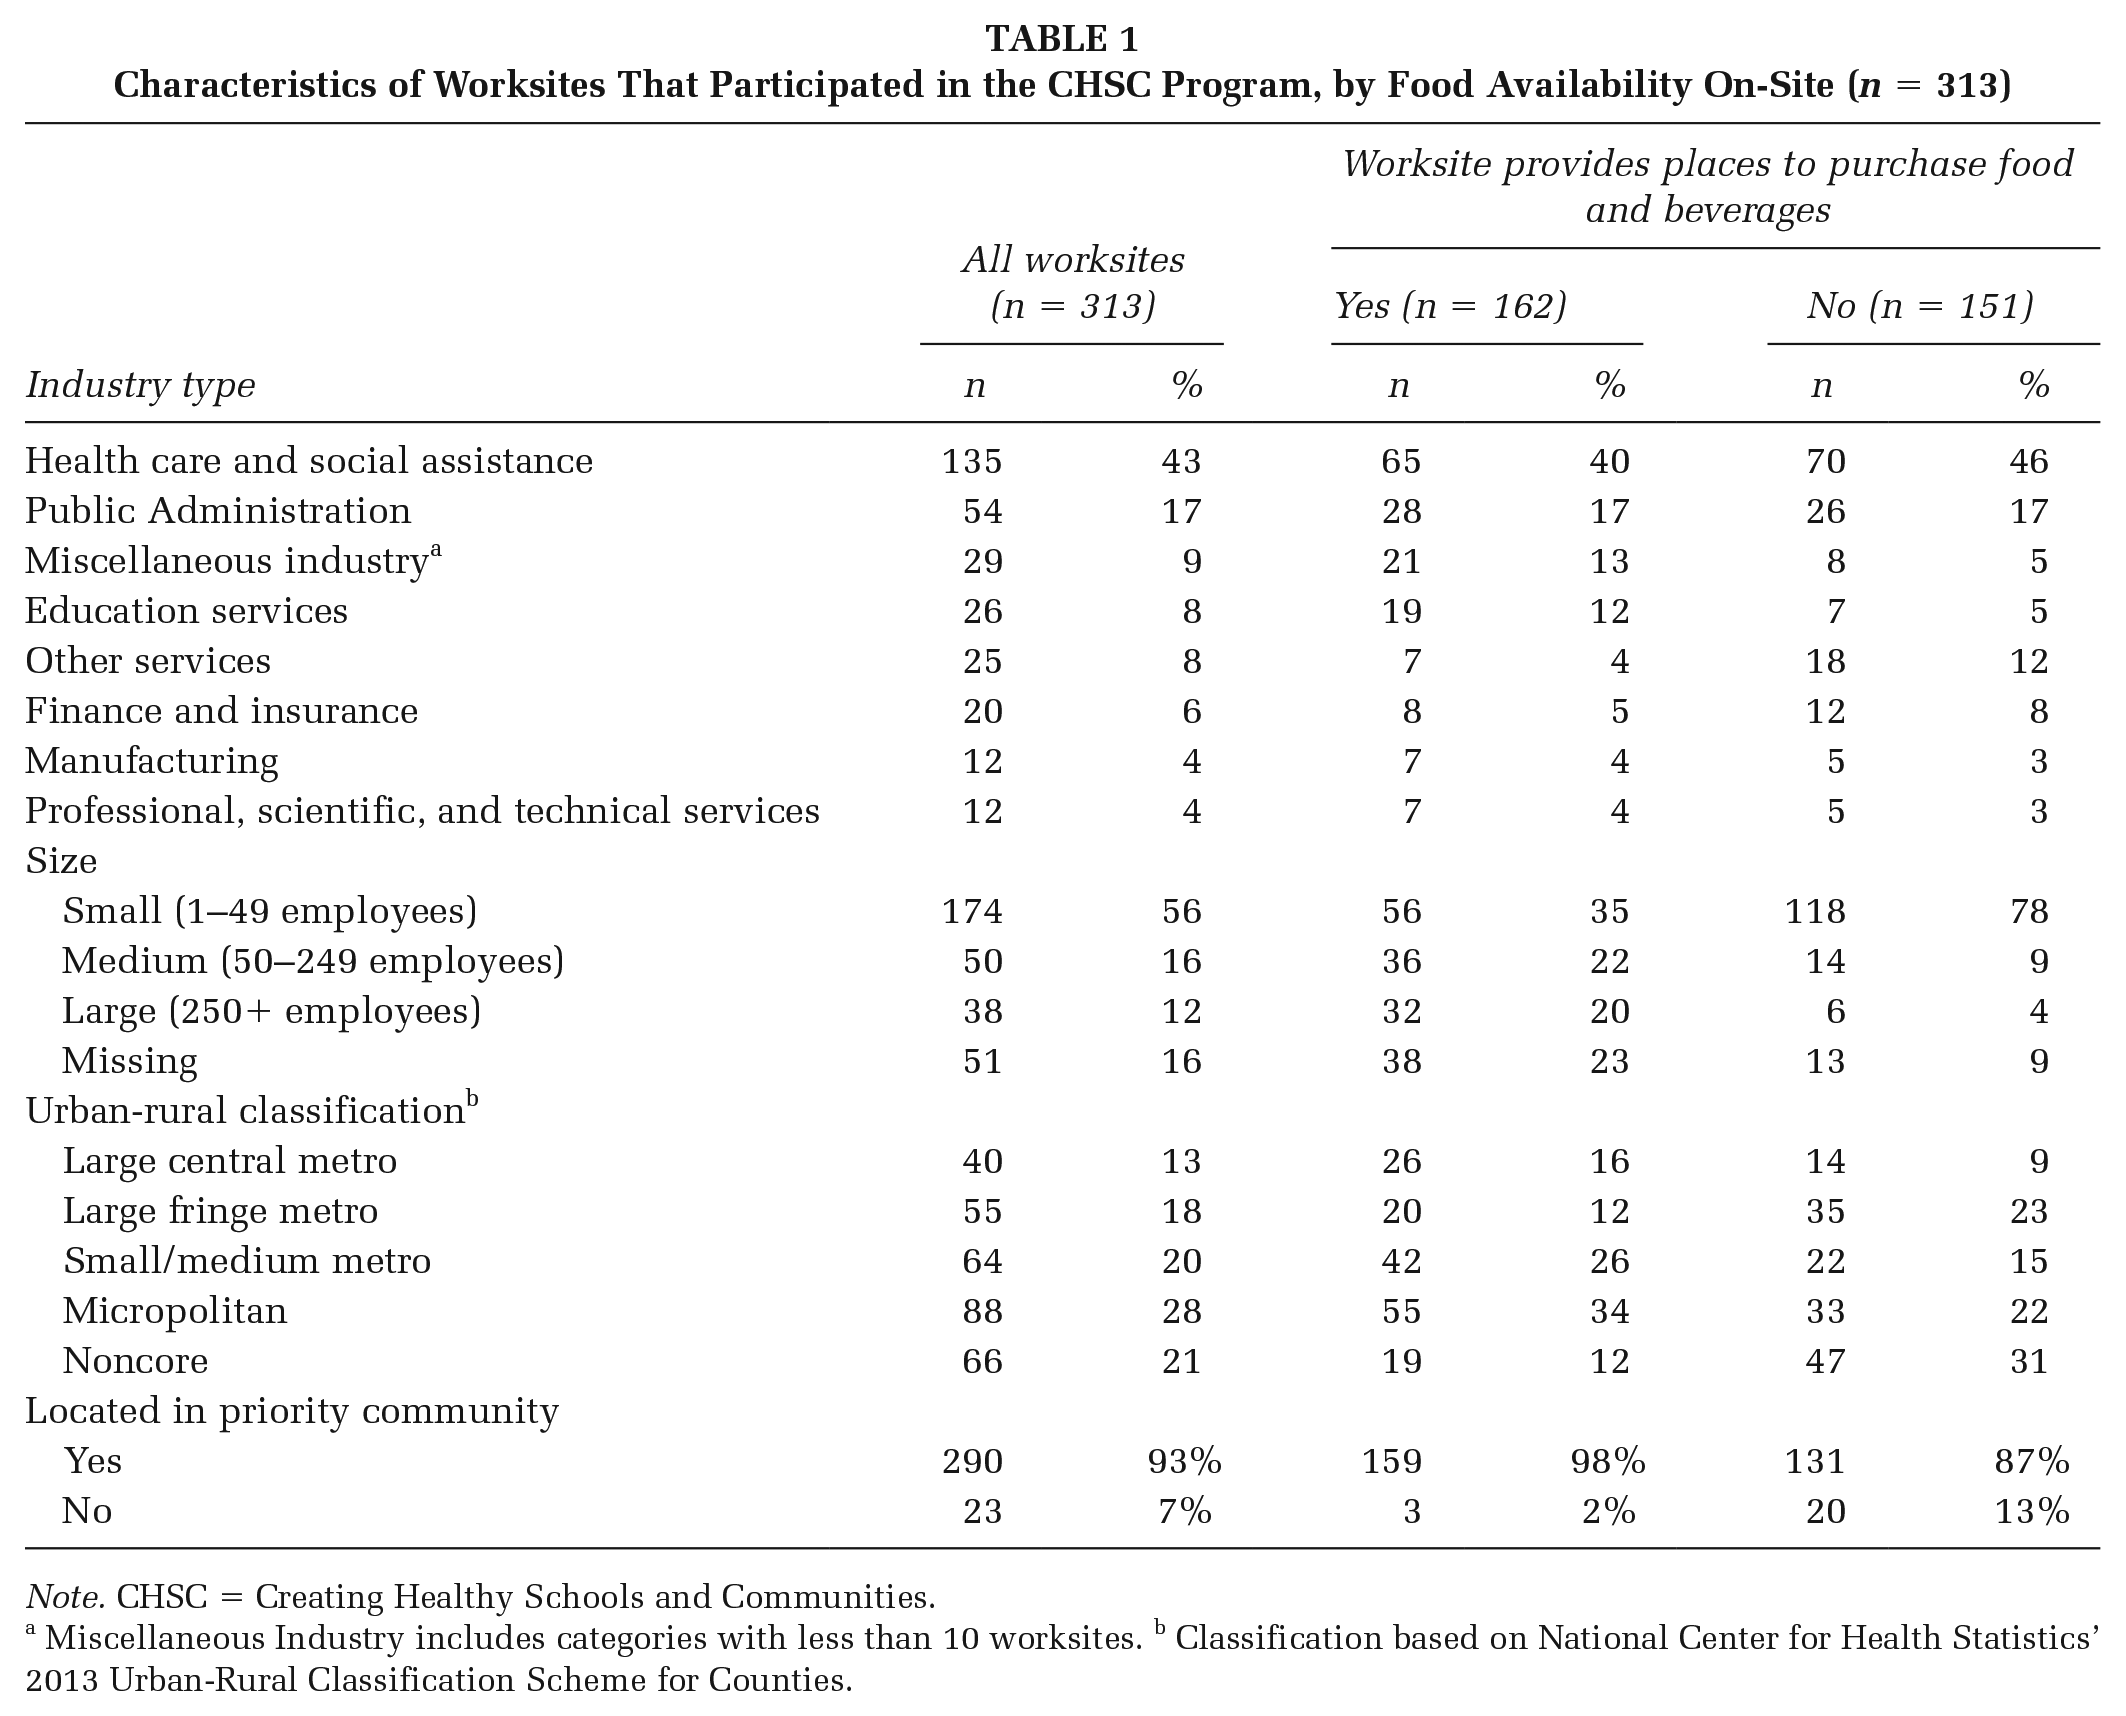
Table 1 presents characteristics of 313 worksites that participated in the CHSC program. The most common industry types were health care and social assistance (43%) and public administration (17%). Regarding size, over half (56%) of the worksites were categorized as small (1–49 employees), 16% were medium (50–249 employees), 12% were large (250+ employees), and 16% were unknown. As for urban-rural classification, 51% of worksites were in metro areas while 49% were in more rural counties. Finally, 93% of worksites were in a priority community.
Characteristics of Worksites That Participated in the CHSC Program, by Food Availability On-Site (n = 313)
Note. CHSC = Creating Healthy Schools and Communities.
Miscellaneous Industry includes categories with less than 10 worksites. b Classification based on National Center for Health Statistics’ 2013 Urban-Rural Classification Scheme for Counties.
Table 1 also compares worksites that did (n = 162) and did not (n = 151) provide places to purchase food and beverages. For both groups, the most common industry types were health care and social assistance and public administration. Worksites with food were much less likely to be small (35%), slightly more likely to be in an urban county (54%), and more likely to be in a priority community (98%).
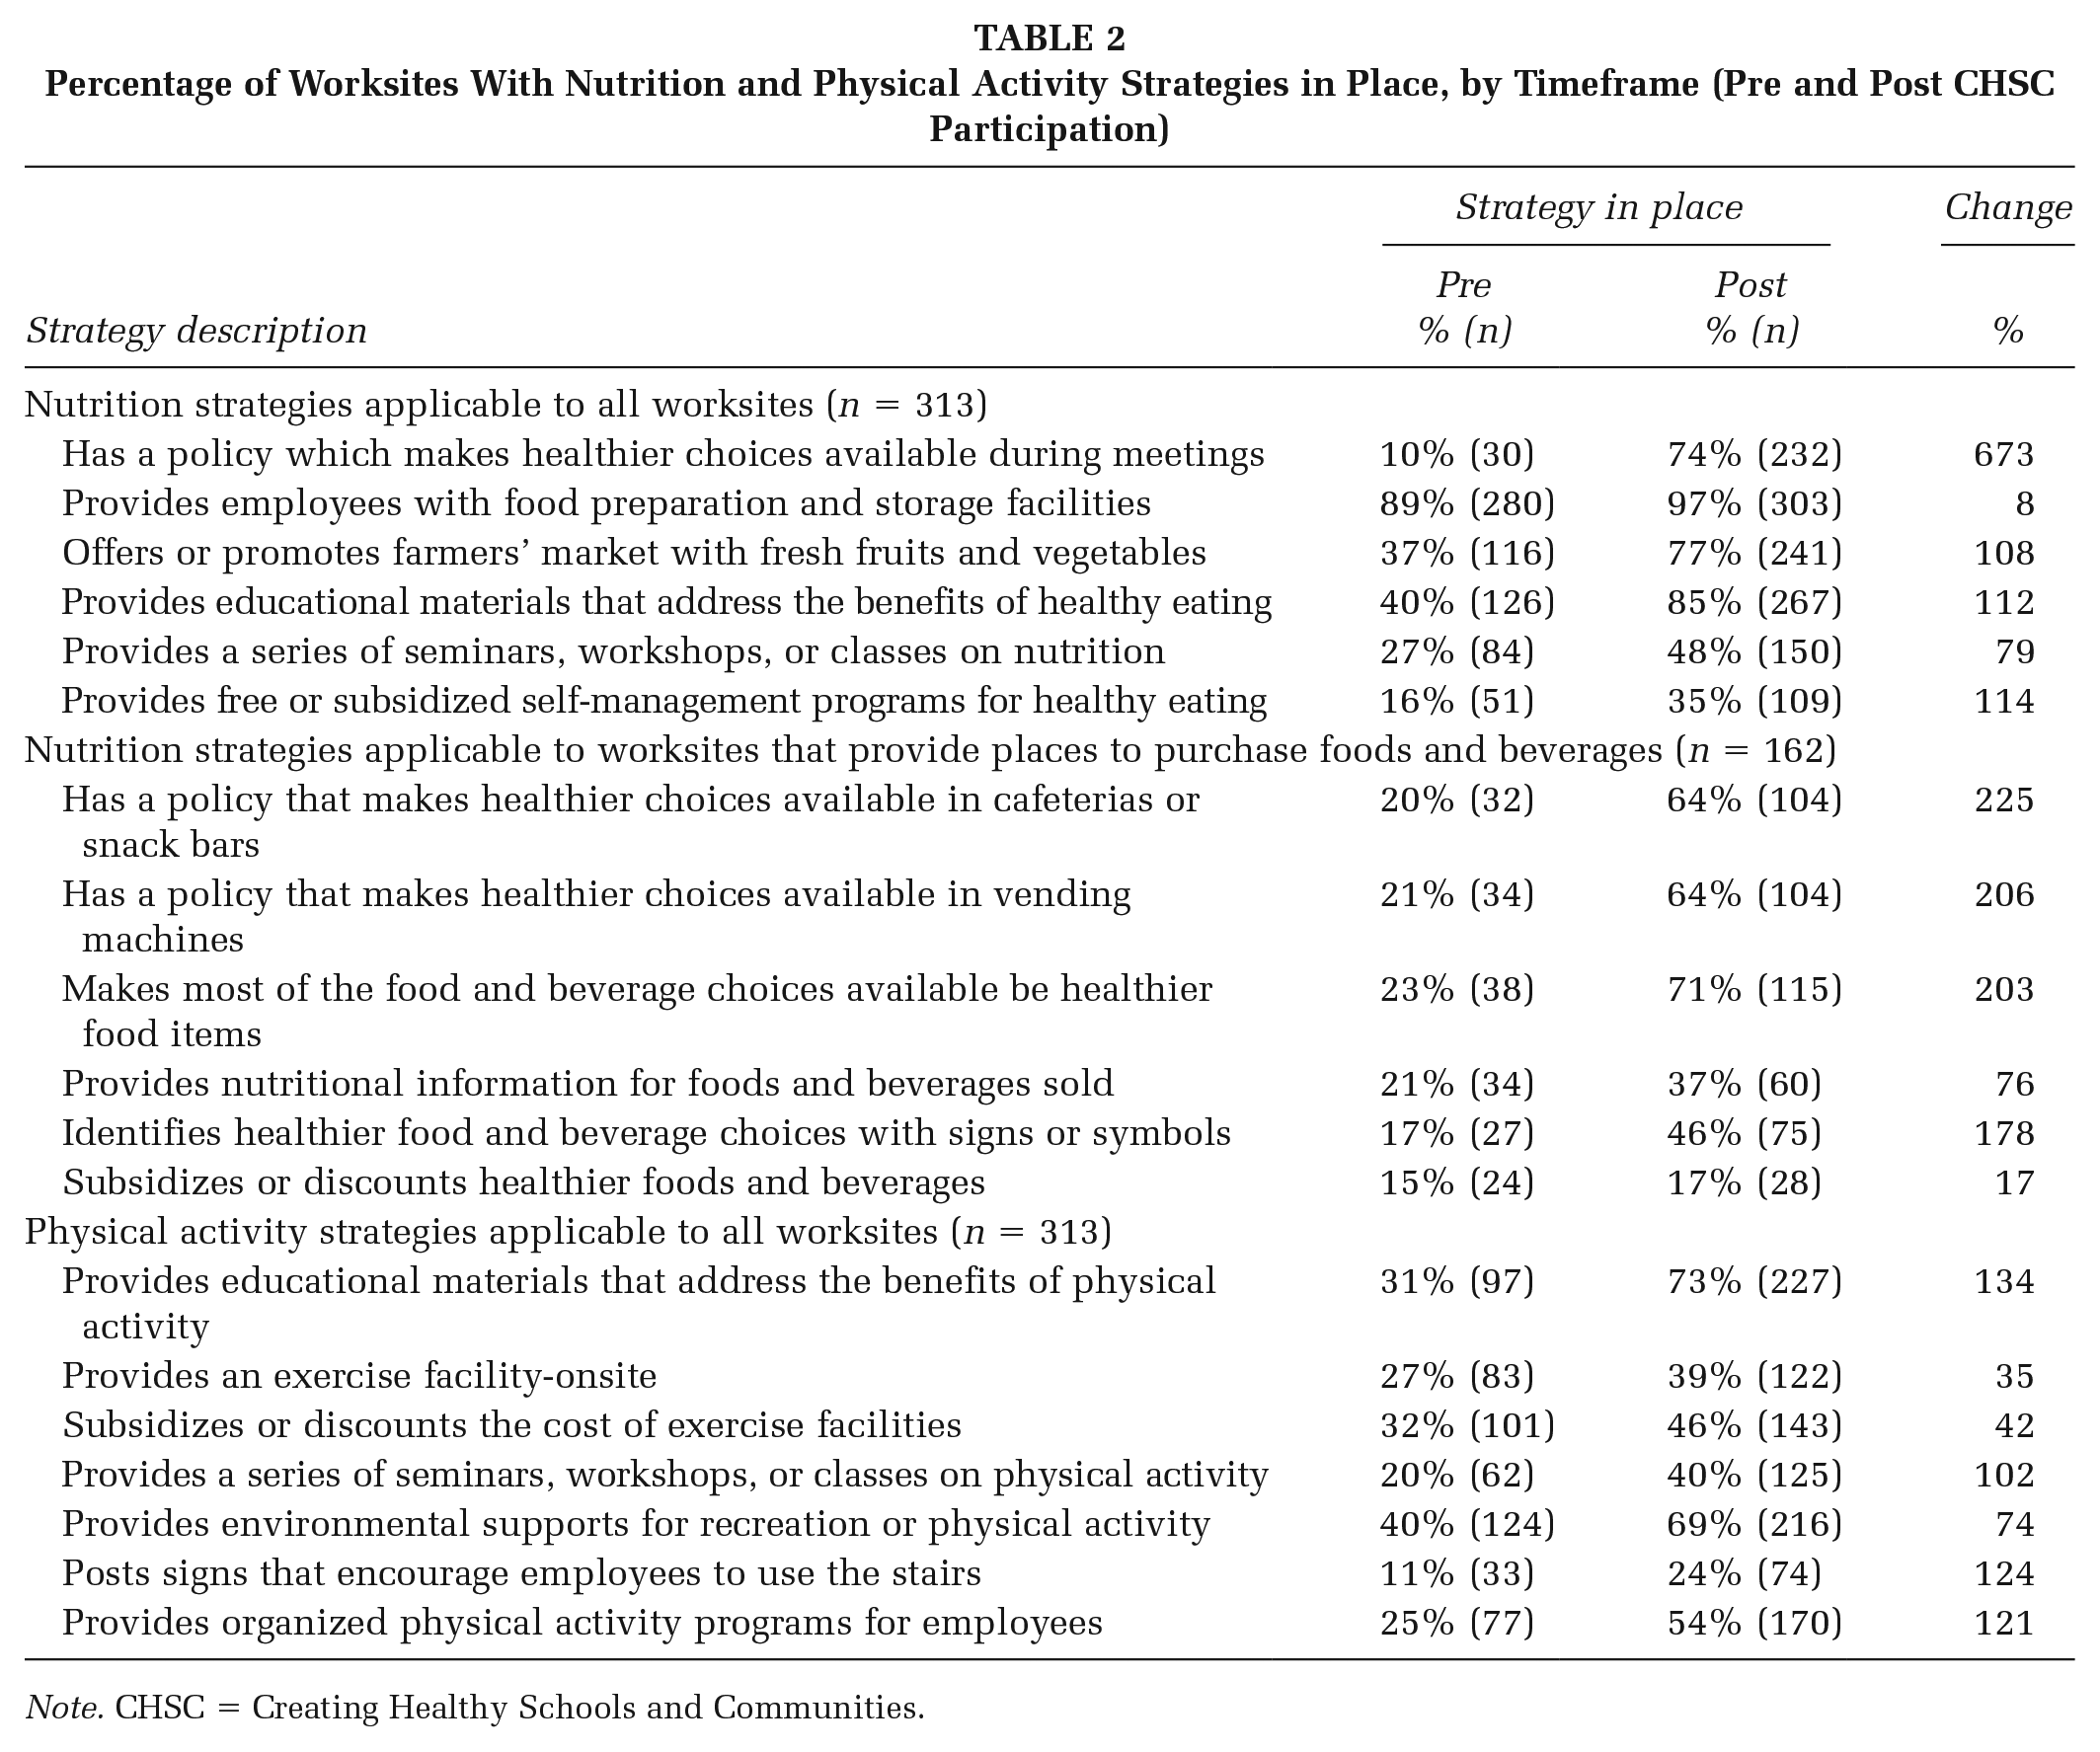
Table 2 displays worksite implementation of each nutrition and physical activity strategy from beginning to end of CHSC participation. Strategy items follow their order of appearance in the assessment tool. Most worksites provided employees with food preparation and storage facilities (89% at pre, 97% at post). Other common strategies were providing educational materials (40% at pre, 85% at post) and offering or promoting farmers’ markets (37% at pre, 77% at post). Less common strategies were subsidizing self-management programs (16% at pre, 35% at post) and providing nutrition workshops (27% at pre, 48% at post). Healthy meeting policies were less common when CHSC began (10%) and more common when CHSC ended (74%).
Percentage of Worksites With Nutrition and Physical Activity Strategies in Place, by Timeframe (Pre and Post CHSC Participation)
Note. CHSC = Creating Healthy Schools and Communities.
Assessment results for worksites that provided places to purchase foods and beverages are also displayed. Common strategies included policies for cafeterias/snack bars (20% at pre, 64% at post), policies for vending machines (21% at pre, 64% at post), and making most of the choices available be healthier foods (23% at pre, 71% at post). The least common strategy was discounting healthier foods and beverages (15% at pre, 17% at post).
Many worksites provided environmental supports for physical activity (40% at pre, 69% at post). Other common strategies were providing educational materials (31% at pre, 73% at post), discounting exercise facilities (32% at pre, 46% at post), and providing organized physical activity programs (25% at pre, 54% at post). The least common strategy was posting signs to encourage employee stair use (11% at pre, 24% at post).
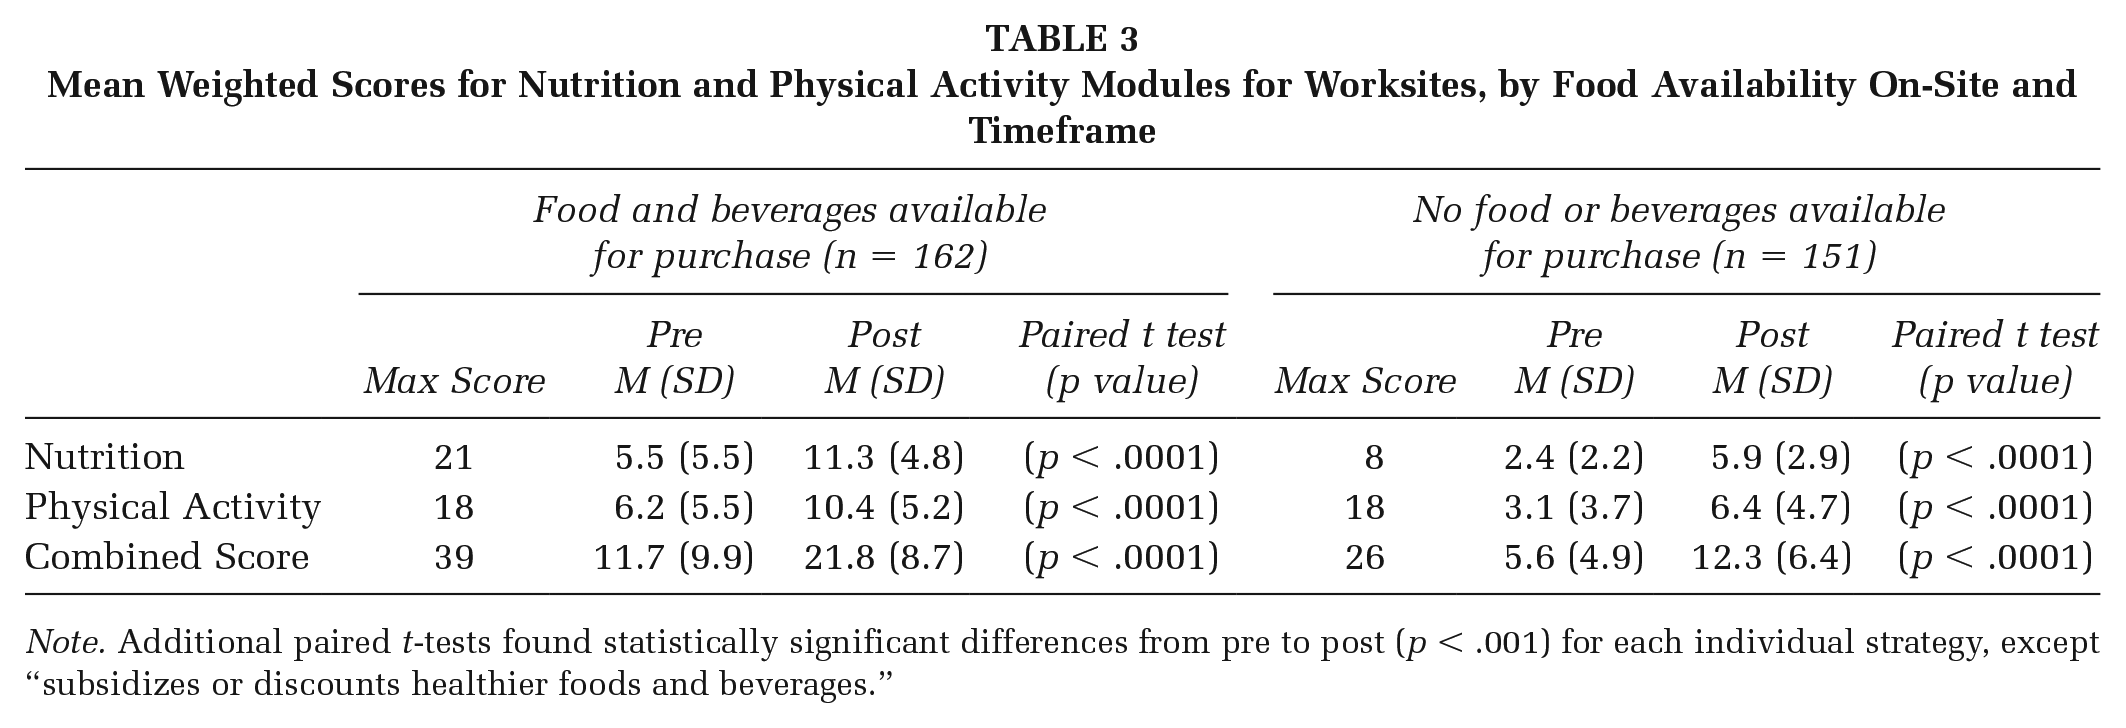
Table 3 displays the mean scores for all combined: nutrition items, physical activity items, and physical activity plus nutrition items. Among worksites where food and beverage were available for purchase, nutrition scores increased from 5.5 at pre to 11.3 at post (p < .0001), physical activity scores increased from 6.2 to 10.4 (p < .0001), and combined scores increased from 11.7 to 21.8 (p < .0001). Among worksites where food and beverage were not available for purchase, nutrition scores increased from 2.4 at pre to 5.9 at post (p < .0001), physical activity scores increased from 3.1 to 6.4 (p < .0001), and combined scores increased from 5.6 to 12.3 (p < .0001). Scores at sites with food were all higher than scores at sites without food, even for the physical activity category. Additional paired t-tests found statistically significant differences from pre to post (p < .001) for each individual strategy, except “discounts healthier foods and beverages.”
Mean Weighted Scores for Nutrition and Physical Activity Modules for Worksites, by Food Availability On-Site and Timeframe
Note. Additional paired t-tests found statistically significant differences from pre to post (p < .001) for each individual strategy, except “subsidizes or discounts healthier foods and beverages.”
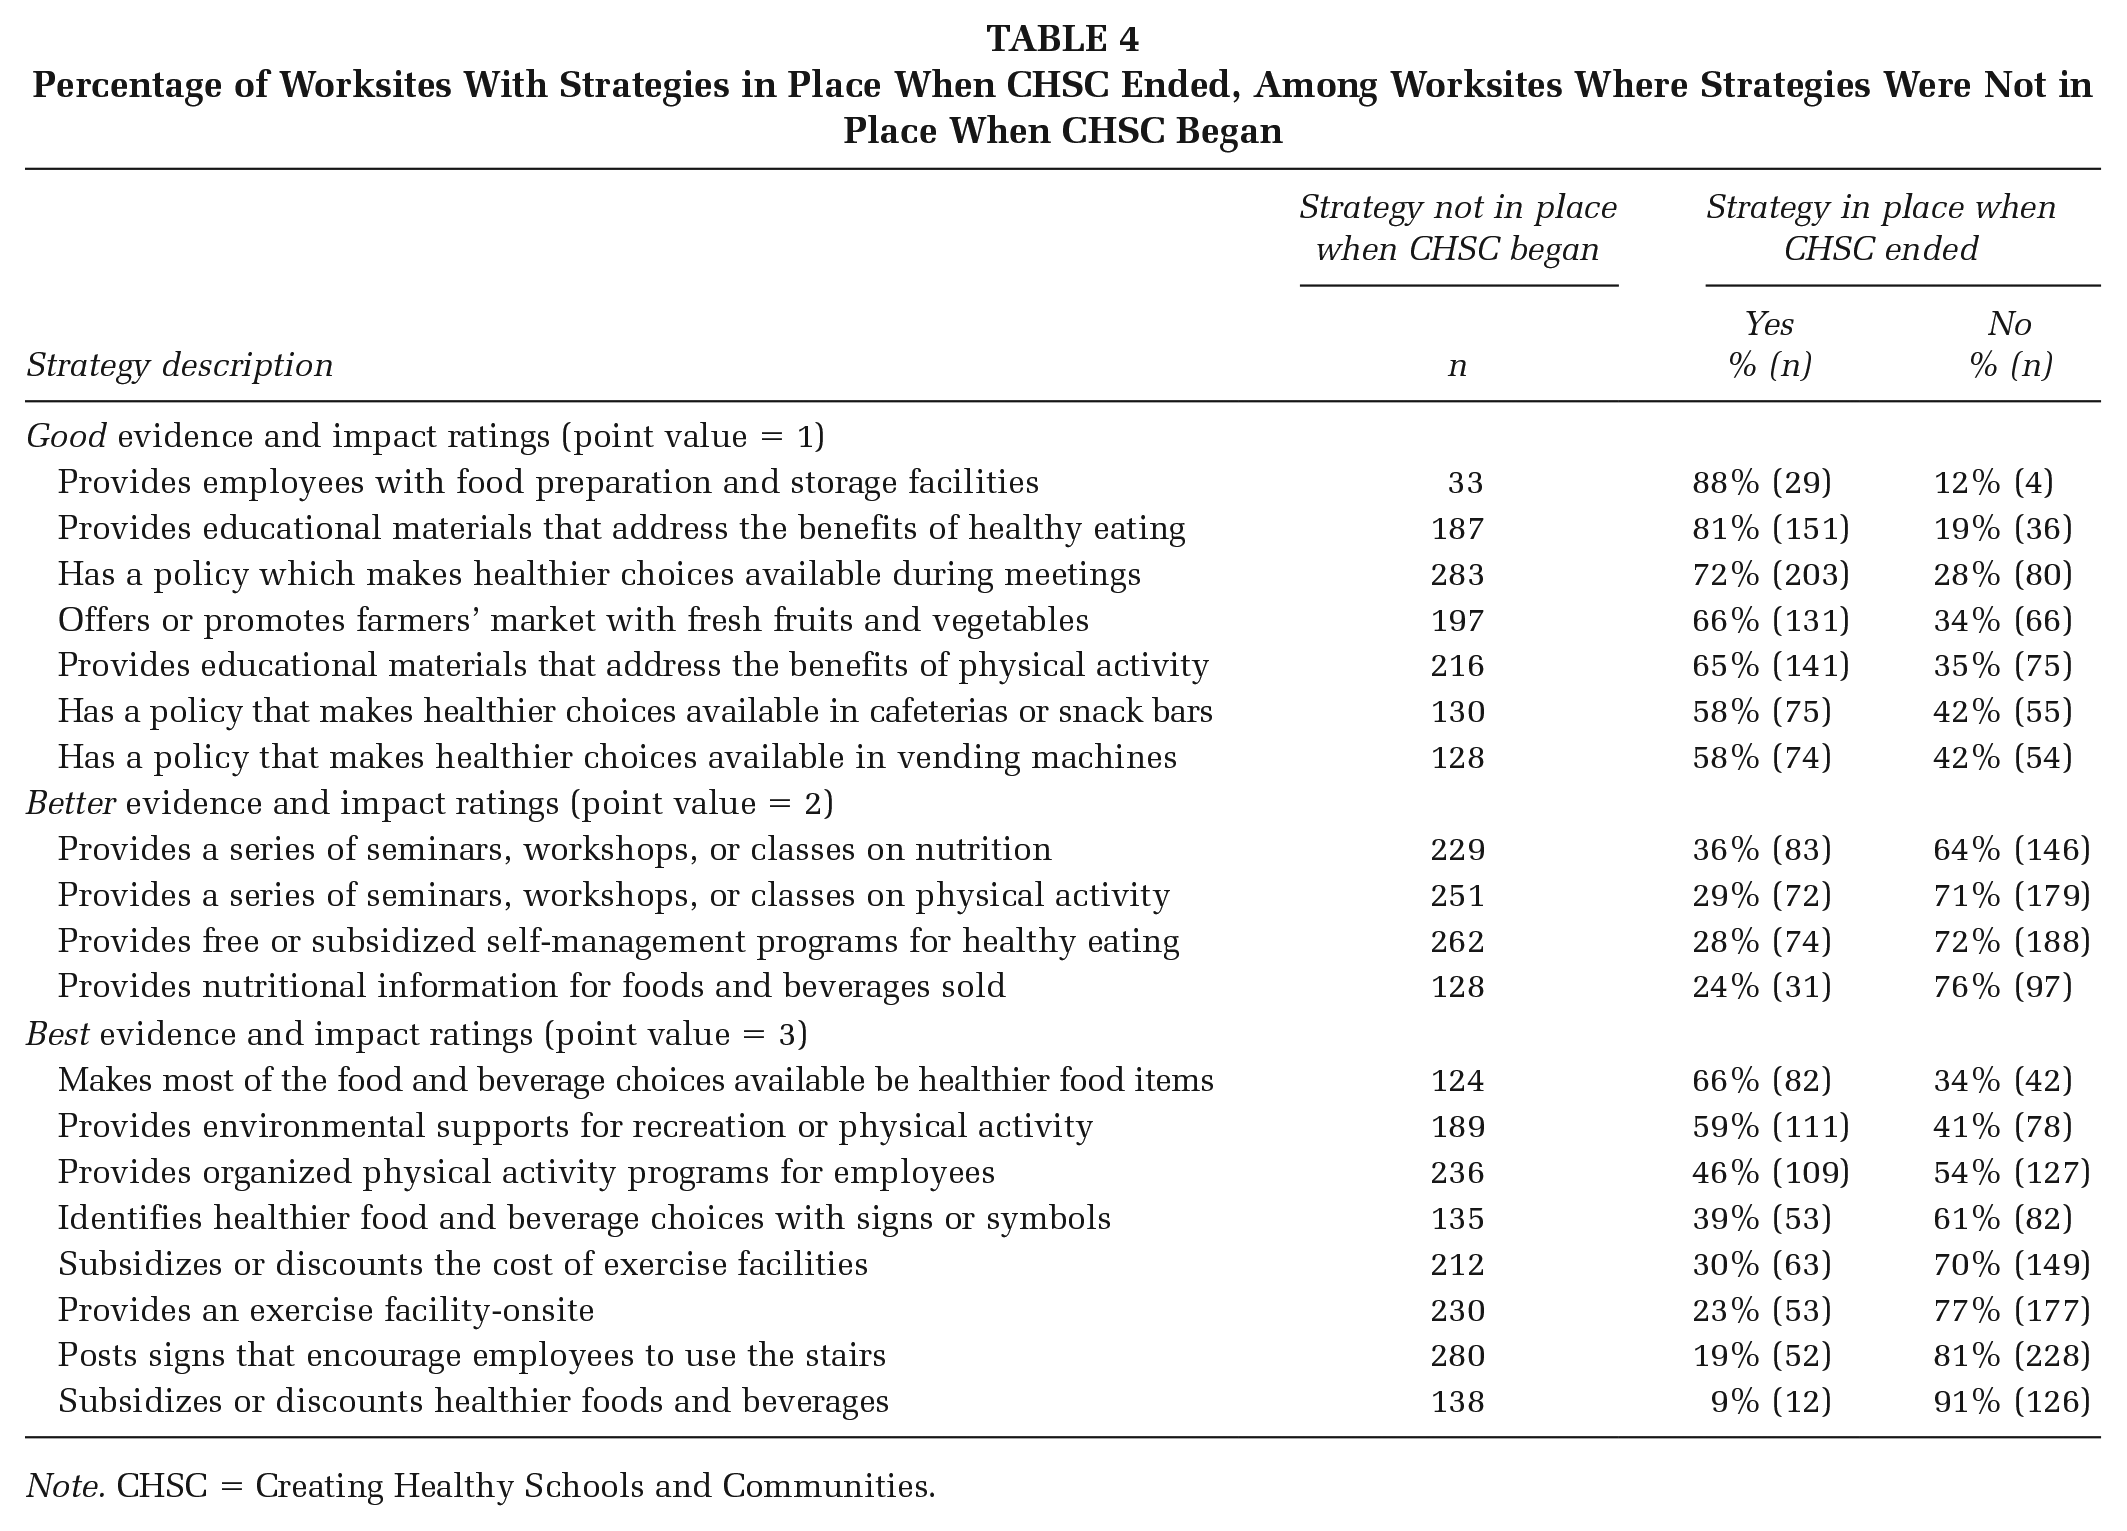
Table 4 reports the number and percent of worksites with strategies in place when their CHSC participation ended, among worksites where strategies were not in place when their CHSC participation began. Strategy items are grouped by weighted point values and presented in order of percent reporting strategies in place when CHSC ended (highest to lowest). Results for items with good evidence and impact ratings demonstrate food preparation and storage facilities (88%), educational materials (81%), and healthy meeting policies (72%) were achieved the most often. For this category, the average percentage of worksites with strategies in place when CHSC ended was 70% (range 58%–88%). Among items with better ratings, nutrition workshops (36%) were achieved the most often; the average percentage of worksites with strategies in place when CHSC ended was 29% (range 24%–36%). Among items with best ratings, making most choices be healthier (66%), providing environmental supports for physical activity (59%), and providing organized physical activity programs (46%) were achieved the most often. The average percentage of worksites with strategies in place when CHSC ended was 36% (range 9%–66%). Across all categories, seven strategies with a good rating and four strategies with a best rating were achieved the most often.
Percentage of Worksites With Strategies in Place When CHSC Ended, Among Worksites Where Strategies Were Not in Place When CHSC Began
Note. CHSC = Creating Healthy Schools and Communities.
Discussion
Strengths
Our study demonstrates that public health practitioners can use data on SDOH to identify priority communities, and that diverse worksites located in these communities can implement evidence-based PSE change strategies to increase access to nutritious foods and physical activity opportunities. Major strengths of our study include the large sample size, the evaluation of the statewide effort using a valid and reliable tool, clearly demonstrated improvements in the PSE change strategies and several practical recommendations that we can offer to public health practitioners.
Participating worksites represented a wide range of industry types, sizes, locations, and food service opportunities. About half of the worksites were small, located in rural counties, and/or did not provide places to purchase food or beverages. Smaller worksites tend to score lower on the HSC (Meador et al., 2016; Roemer et al., 2019); rural counties tend to have higher obesity rates (Lundeen et al., 2018); and worksites without food are unable to implement many of the recommended strategies. Worksites with barriers to implementation were well-represented in the study sample.
For CHSC, DOH used data on SDOH to identify communities lacking access to nutritious foods and physical activity opportunities. Ninety-three percent of the worksites that contractors recruited were in priority communities. This is important because it shows that the program was, in fact, able to reach worksites in the intended communities and that these worksites were able to implement many PSE changes. Voluntary programs can be particularly difficult to implement in priority communities, but this study demonstrates the feasibility of this approach.
Participating worksites were successful at implementing all except one of the evidence-based PSE change strategies (Item 35 discounts healthier foods and beverages). During the study timeframe, implementation doubled for eight strategies (Item 38 promotes a farmers’ market; Item 39 provides educational materials on healthy eating; Item 41 provides free/subsidized self-management programs for healthy eating; Item 34 identifies healthier choices with signs or symbols; Item 53 provides educational materials on physical activity; Item 54 provides classes on physical activity; Item 51 posts signs that encourage use of stairs; and Item 52 provides physical activity programs). Implementation tripled for three strategies (Item 30 policy for healthy cafeterias and snack bars; Item 31 policy for healthy vending; and Item 32 offering mostly healthy food and beverage items). When we used weighted scores to incorporate strength of evidence-base and level of impact into our analysis, we found significant increases in strategy implementation in both worksites that provided places to purchase food and beverages and worksites that did not. This was true for all combinations of nutrition and physical activity strategies and for all except one individual strategy (discounts healthier foods and beverages).
Overall, “having healthy meeting policies” increased the most while “discounting healthier items,” and “providing food preparation and storage facilities” increased the least. Our findings are consistent with other research works (Meador et al., 2016; Roemer et al., 2019; Safeer et al., 2018), which adds to the evidence-base that some strategies are more feasible to implement than others.
We examined the seven strategies with good evidence and impact ratings. All were implemented in more than half of the worksites during the CHSC program timeframe (approximately 2 years). Overall, strategies with good ratings were achieved more often than better and best rated strategies. Starting with these “low hanging fruit” strategies may help build trust, enthusiasm, and momentum for bigger wins with more challenging strategies.
We also examined eight strategies with the best evidence-base and highest impact ratings. For nutrition, making most choices available be healthier items and identifying healthier choices with signs or symbols were both relatively easy to achieve during the study timeframe. For physical activity, providing environmental supports and providing organized programs were both relatively easy to achieve. Worksites looking to prioritize their efforts should focus on these four “big bang for your buck” strategies, especially if they are only able to work on implementing one or two strategies. However, consistent with other studies (Meador et al., 2016; Roemer et al., 2019; Safeer et al., 2018) providing discounts on healthier foods and beverages had a high rating but was very difficult to achieve. This challenging strategy may not be a good starting point for worksites.
Overall, our findings suggest that strategies with higher HSC ratings may be harder to achieve and require more resources. Use of the evidence/impact rating may help offer worksites practical clues into the difficulty of implementing a variety of evidence-based strategies. Future research should also explore what type of resources would assist worksites in overcoming barriers to their implementation.
Limitations
Our study had a few important limitations. We relied on a convenience sample of worksites that chose to participate in CHSC and those that completed both a pre- and postassessment (76% of sites), which limits the generalizability of our findings. HSC data were collected from worksites by self-report which introduced respondent bias and threats to internal validity. Still, we present a real-world situation that other public health practitioners will likely face when implementing and evaluating public health programs that focus on influencing SDOH in priority communities.
We also employed a pre-/posttest design without a control group and did not control for worksite characteristics or contractor traits. These factors limit our ability to conclude that the improvements made between pre and post are attributable to the CHSC program. However, the consistent statistical significance of the findings suggests they may be related to program participation. Future research could include a control group and control for other factors that might influence outcomes.
Finally, our study focused on making changes to PSEs but did not examine individual behavior of employees. Research by Lang et al. (2017) and Gutermuth et al. (2018) found that several of the HSC strategies were significantly associated with improvements in employee behavior. In fact, all the HSC strategies have been reviewed by a panel of industry experts and determined to have sufficient levels of scientific evidence and impact on intended health behaviors. Future research should take a closer look at the association between PSE change strategies and individual behavior change.
Implications for Practice
Despite these limitations, our study revealed several important recommendations for public health practice:
Use available data to prioritize communities experiencing disparities in the prevalence of obesity and identify PSE change strategies that address the SDOH responsible for these disparities.
Engage with reputable community-based partners from different sectors when designing and implementing public health initiatives.
Use standardized tools, such as the HSC, to evaluate worksite wellness programs. Pretest results can be used to identify strengths and areas for improvement, posttest results can be used to assess improvements, and pre-/postcomparison results can be used to identify “low hanging fruit” and “big bang for your buck” strategies. Use these findings to promote appropriate PSE change strategies at future implementation sites and consider broadening the scope of PSE change to incorporate more venues beyond worksites, especially considering the COVID-19 pandemic and the trend toward more employees working from home.
By following these recommendations, public health practitioners can help address the SDOH that contribute to disparities in prevalence of obesity and other chronic diseases.
Footnotes
Authors’ Note:
This research was supported by a cooperative agreement with the U.S. Centers for Disease Control and Prevention (CDC DP18-1807). The findings and conclusions are those of the authors and do not necessarily represent the official position of the CDC. The authors acknowledge the grantees of the New York State Department of Health Creating Healthy Schools and Communities 2015-2020 initiative for collecting the worksite data used in this research and specially thank MJ Pattison for overseeing the data collection before her retirement from the New York State Department of Health in July 2020. The authors also appreciate the generous support from Danielle Brittain, PhD, and David Brown, PhD, for serving as writing coaches during authors’ participation in the Spring 2021 Virtual Writing Workshop and CDC’s TARDIS team for their assistance in reviewing the manuscript.
Supplement Note:
This article is part of the Health Promotion Practice supplement, “Public Health Practice in the Field.” The purpose of the supplement is to showcase innovative, community-centered, public health actions of SPAN, REACH, and HOP programs to advance nutrition and physical activity among priority populations in various settings. The Society for Public Health Education is grateful to the Centers for Disease Control and Prevention, Division of Nutrition, Physical Activity, and Obesity for providing support for the issue. The entire supplement issue is available open access at  .
.