
Abstract
Data collection procedures using adapted Curriculum-Based Assessment (CBA) and Curriculum-Based Measurement (CBM) were developed for deaf and hard of hearing students. Results from statistical analyses through linear regression indicated that reading fluency scores using CBA and CBM materials adapted for deaf and hard of hearing students significantly predicted total reading standard scores from the Group Reading Assessment and Diagnostic Evaluation or GRADE across a 10-year (2005–2008 and 2012–2014) time span. The purpose of the present article is to review these procedures and significant results, which help to provide a foundation to demonstrate the utility of curriculum-based approaches with deaf and hard of hearing students.
Introduction
Educational professionals have many choices when selecting and employing assessment techniques. Over the past four decades, different curriculum-based techniques have evolved as supplements to traditional norm-referenced, standardized assessments. Techniques such as Curriculum-Based Assessment (CBA) and Curriculum-Based Measurement (CBM) are cited in the literature as assessments that utilize curricular material to gather data about student performance.
CBA
CBA can be defined as an assessment process that supports the planning of instruction, especially in gathering useful data for determining what to teach and how to teach it (Gickling & Havertape, 1981). CBA is used to determine the instructional needs of a student based on ongoing performance within course content to deliver instruction (Gickling, Shane, & Croskery, 1989).
Gickling and colleagues (Gravois, Gickling, & Rosenfield, 2011) have stated that CBA has as its goal the gathering of assessment data for the purpose of explicitly guiding instruction and creating “the type of optimum learning conditions that are consistent with the effective teaching literature” (Gickling et al., 1989 p. 344). Therefore, the first focus of CBA is on using assessment for the purpose of ensuring high-quality instructional practices, after which student progress can be effectively monitored, charted, and evaluated.
Instructional Match
As a pioneer in describing and researching the concept of instructional match, Gickling has provided a succinct review of the literature that assists in operationalizing what has now become a generally accepted and cited concept (Gickling & Havertape, 1981). The concept of instructional match refers to the existence of appropriate challenge between the variables that influence learning, that is, the student, instruction, and the learning task. Creating the match remains the ultimate outcome if learning is to occur. Organizing instructional objectives and curricula materials requires an accurate assessment of the student’s prior knowledge and entry skills and then strategic alignment of the instructional objectives along with the demands of the tasks. Central to this alignment is the systematic and careful introduction of appropriate challenge with regard to the instruction and task demands, that is, challenge that is not too difficult or too easy.
Challenge represents the point at which the curricula tasks and instructional objectives demand new and varied learning from the student. Appropriate challenge represents the point at which the new and varied learning is not so difficult as to create frustration or so easy as to elicit boredom (Poehner, 2011; Rosenfield, Gravois, & Silva, 2014; Treptow, 2006). The accurate assessment of a student’s prior knowledge is the foundation for determining appropriate challenge. Prior knowledge refers to the skills and experiences that a student possesses and reflects the content skills and mental schemas the student uses to connect new learning to existing knowledge (Shanahan, Fisher, & Frey, 2012).
CBA in Reading
Challenge is contextual and is related to the type of instruction or tasks that are being presented to the student at a point in time. When the central focus is for students to read connected text, appropriate challenge is considered the point where students can accurately pronounce and identify the meaning of 93% to 97% of the vocabulary by sight without having to decode (Cramer & Rosenfield, 2008). When the tasks involve the practice of discrete skills (e.g., learning letters, sounds, sight words, math facts), research has found that, if teachers manage the amount of challenge at a general ratio of approximately 80% known content to 20% unknown content, students are consistently able to increase the retention needed to demonstrate elevated levels of performance (MacQuarrie, Tucker, Burns, & Hartman, 2002).
In reading, instructional-level conditions are determined by the percentage of known words and unknown words in a passage and can be calculated by the educational professional to determine whether a student can read a passage comfortably to enhance comprehension (i.e., 93%–97% known). The next step in CBA is to conduct an assessment of reading to analyze the student’s reading and oral responding under instructional-level reading conditions (Gravois & Gickling, 2008). Read Naturally (readnaturally.com) is an example of a commercially available CBA oral reading fluency program that can be used for this type of analysis and contains benchmarks from Hasbrouck and Tindal (2006).
CBM
CBM can be defined as a set of validated brief tests used by special education and general education teachers to evaluate the impact of their instructional programs (Deno, 1985, 1986; L. S. Fuchs, Fuchs, & Powell, 2004; L. S. Fuchs & Deno, 1991). CBM evaluates the basic skills of reading, math computation, spelling, and written expression (Deno, 1985, 1986, 1989; Shinn, 1989, 1998).
CBM in Reading
CBM oral reading fluency is measured by first having a student read randomly selected, equal difficulty-level passages for 1 min each, and then scoring the number of correctly read words and errors per minute. CBM oral reading fluency’s sensitivity to instructional effects makes it particularly appropriate for evaluating oral reading fluency interventions. Comparisons can be made to determine whether there is a discrepancy between the current level of performance and the expected level of performance before and after intervention in preassessment and postassessment design. Preassessment and postassessment allow educational professionals to evaluate the degree to which the student is catching up to peers. Commercially available CBM oral reading fluency materials on websites like DIBELS (dibels.uoregon.edu) and AIMSweb (aimsweb.com) also contain benchmarks that can be used for this type of decision making.
CBM as a Type of CBA
Educational professionals are expected to know about and use a variety of measurement and assessment tools. Assessment techniques considered CBA include informal reading inventories (IRI’s), end-of-unit mastery tests, analysis of homework samples, precision teaching, and a variety of locally made tests that measure what students are learning. More information on these techniques can be obtained by reviewing Tindal (1993). Broadly defined, CBA is the process of collecting information about skills taught in a curriculum or expected to be mastered in standards. However, as there are many ways to accomplish this goal, it is necessary to find certain attributes in a process if it is to be classified as CBA. These include use of a behavioral paradigm, direct and precise measurement, alignment with the students’ learning outcomes or with standards, repeatable measurement, measurement that is sensitive to change, high content validity, and high fidelity of implementation (Shapiro, 2010).
Within this definition of CBA, CBM is one type of CBA and typically refers to a set of procedures used to measure student performance in the areas of reading, math, and written expression (Hosp, Hosp, & Howell, 2007). These procedures provide useful and technically adequate directions for creating, administering, and scoring measures that have themselves been well researched and shown to be direct, precise, repeatable, sensitive to learning, and aligned with standards as well as the conditions of instruction (Deno, 2003).
Advantages of Curriculum-Based Approaches
Elliott and Fuchs (1997) place the use of individual achievement tests into a larger context of assessment for making decisions about special education eligibility and discuss curriculum-based approaches as supplements to conventional achievement tests. As a supplement to standardized achievement tests, the curriculum-based model focuses on direct measurement of academic skills and behaviors in the student’s curriculum of instruction. Validity may be improved in some instances if there is direct measurement of the academic behavior of concern. Therefore, determining a student’s reading difficulty would involve evaluating the interaction of the reading text and the student’s responses, which is usually a measurement of oral reading.
In the same 1997 study, Elliott and Fuchs state that curriculum-based approaches require students to construct, instead of selecting, responses and to show a range of skills on an individual assessment. More applicable to a treatment validity approach to eligibility, curriculum-based approaches relate closely to the classroom curriculum. Therefore, they may have the capacity to make recommendations for instructional planning directly and effectively.
Finally, in their 1997 study, Elliott and Fuchs report that curriculum-based approaches emphasize administration and scoring efficiency in order for assessments to occur on a routine basis, and, for purposes of treatment validity, frequent assessment is beneficial for the measurement of learning over time. Curriculum-based approaches offer a validated set of administration and scoring procedures for indexing academic competence and growth, and, by measuring the acquisition of basic skills, professionals may add to the richness of the data available for instructional program decision making. Professionals can identify whether and, if so, when an instructional program adaptation is required in a child’s instructional program. They can also monitor student growth in terms of skills acquisition.
Curriculum-Based Approaches for Deaf/Hard of Hearing Students
Allinder and Eccarius (1999), in an earlier study, explored the validity and reliability of CBM reading procedures for progress monitoring purposes with students who are deaf or hard of hearing and who use manually coded English. Results from the Allinder and Eccarius (1999) study indicated that interjudge and alternative form reliability was very acceptable; however, Pearson product–moment correlations between the CBM procedures (e.g., reading passages via signing, identifying idea units, and words retold) and a standardized reading test that was normed with students who were deaf or hard of hearing were lower than expected. Rose and McAnally (2008) published an additional, more recent study indicating that CBM maze passages using AIMSweb (aimsweb.com) for reading comprehension could be successfully used with students who are deaf or hard of hearing. The same 2008 study revealed that DIBELS (dibels.uoregon.edu) was a valid and reliable CBM procedure to use with students who are deaf or hard of hearing for oral reading fluency of letter naming and word identification, and that the Test of Silent Contextual Reading Fluency or TOSCRF (Hammill, Wiederholt, & Allen, 2006) was a valid and reliable measure with deaf and hard of hearing students.
Subsequent to these results, a variety of deaf and hard of hearing programs and schools for the deaf have been collecting standardized test data on reading development once or twice a year, but have also been collecting more frequent, weekly or biweekly progress monitoring data to more sensitively guide instruction, which parallels a curriculum-based approach. This appears to be a useful component for assessment of deaf/hard of hearing students because of the emphasis on literacy and the lack of standardized instruments developed for deaf/hard of hearing students, recently discussed in Gibbons and Miller (2013). Lederberg, Schick, and Spencer (2012) have also recently explored the ongoing challenges in literacy development among deaf/hard of hearing students, indicating that too many students are not attaining reading skills at the same level as their hearing peers, in part because of gaps in prior knowledge due to language delays. In relation to the concept of instructional match discussed previously, accurate assessment of those gaps in prior knowledge is important in determining the appropriate level of challenge in new learning (Shanahan et al., 2012).
At the same time, Cawthon (2013), Luckner (2013), Gibbons and Miller (2013), Luckner and Bowen (2010), and Moores (2008) have all discussed potential benefits of curriculum-based approaches and progress monitoring for deaf/hard of hearing students to improve literacy, and the goal of the present article is to further provide a foundation to demonstrate the potential benefits.
The single best measure of oral reading fluency is the number of correctly read words per minute as operationalized by CBM (Deno, 1989). This operational definition is limited to accurate and fluent text reading. To date, no other attempt to operationalize or measure the construct of oral reading fluency has had the same level of success achieved with the CBM measure. One of its most important characteristics is its sensitivity to instructional effects over time, which may be the reason why it is given such prominence in response to intervention (RTI).
CBA and CBM provide the foundation for the RTI system of using assessment data to make instructional decisions for students using a problem-solving approach as described in the RTI literature (Barnes & Harlacher, 2008; Batsche et al., 2006; D. Fuchs, Fuchs, & Vaughn, 2008). RTI may be a constructive model to use with students who are deaf or hard of hearing, as research with a variety of other populations (e.g., typical hearing students, students with learning disabilities, students who are English language learners) has reported positive outcomes (D. Fuchs et al., 2008; Gersten et al., 2008). Furthermore, Burns, Appleton, and Stehouwer (2005) conducted a meta-analytic review of RTI models implemented in schools and reported a strong positive impact on student learning.
Lancaster-Lebanon Intermediate Unit 13 (IU 13) Deaf/Hard of Hearing Program Literacy Committee
The IU 13 is a public education service agency providing special education services to students with educational disabilities. There are 29 Intermediate Units throughout the state of Pennsylvania in the United States providing services including, but not limited to, emotional support, learning support, life skills support, multiple disabilities support, autism support, vision support, and deaf/hard of hearing support. IU 13 provides services to students in Lancaster and Lebanon counties across 22 school districts in south central Pennsylvania. The IU 13 Deaf/Hard of Hearing Program provides services to approximately 75 to 80 students (identified primarily as deaf or hard of hearing) in mainstream and small group Total Communication (which use sign language and spoken English) classes. The Literacy Committee of the IU 13 Deaf/Hard of Hearing Program was developed over 15 years ago to study, modify/adapt if needed, pilot, and adopt different literacy assessments and interventions potentially useful for deaf/hard of hearing students in the Deaf/Hard of Hearing Program and subsequently increase reading and writing achievement performance, which has been noted as a challenge per previous discussion and also by the U.S. Government Accountability Office (2011). The Literacy Committee has consisted primarily of teachers of the deaf/hard of hearing and school psychologists with expertise in deaf/hard of hearing assessment and intervention. Over the past 15 years, the Literacy Committee has developed data collection procedures using modifications and adaptations of CBA and CBM materials for students in the Deaf/Hard of Hearing Program. The author of the current study, a school psychologist and professor of school psychology, has assisted in researching and adapting/modifying assessments and interventions for the Literacy Committee and Deaf/Hard of Hearing Program, and completed statistical analyses regarding assessment and intervention efficacy.
Deaf/Hard of Hearing Program Literacy Tool Box
The Literacy Committee developed a Literacy Tool Box for all of the teachers in the Deaf/Hard of Hearing Program to act as an assessment and intervention guide for, not only annual or semiannual assessments, but for more frequent, sensitive assessments intended to monitor progress on the students’ Individualized Education Programs (IEPs) and guide instruction. Monitoring of progress to guide instruction parallels an RTI approach, which was noted as a constructive model to use with deaf/hard of hearing students in Luckner and Pierce (2013). This collection of assessments and interventions combines formal and informal procedures for a comprehensive assessment and instructional package.
Statistical Analyses From the Literacy Assessment Form (LAF)
One important piece of required documentation in the Deaf/Hard of Hearing Program is an LAF completed by the classroom or itinerant teacher. This form includes assessment data from all assessments gathered annually or semiannually by the teacher, including standardized as well as curriculum-based scores. Because both CBM/CBA scores and total reading standard scores from the Group Reading Assessment and Diagnostic Evaluation or GRADE (Williams, 2001) are required on the LAF, the Literacy Committee decided to do statistical analyses of semiannual and annual curriculum-based and standardized test data from the LAF which was collected by teachers in the Deaf/Hard of Hearing Program. Total reading standard scores from the GRADE are required on the LAF because the Literacy Committee decided they provided the most comprehensive reading scores, combining word reading, word meaning, and sentence/passage comprehension subtest scores from the test. The GRADE is the only standardized reading test given to all students K to 12 in the Deaf/Hard of Hearing Program due to the ease and flexibility of group administration, with two equivalent forms available. The GRADE was chosen for the Deaf/Hard of Hearing Program after extensive review of different academic assessments by the Literacy Committee, and recommendations from Pennsylvania state level reading specialist consultants endorsing the GRADE as a valid and reliable measure. A hypothesis formulated by the Literacy Committee included that the Deaf/Hard of Hearing Program’s adapted CBA and CBM materials would be significant predictors of total reading standard scores from the GRADE.
Prior statistical analyses across a 4-year time frame (2005–2008) were presented at the peer-reviewed 2011 National Association of School Psychologists (NASP) annual conference (Miller, 2011). Since the prior statistical analyses, data collection using modifications and adaptations of CBA materials (Read Naturally Probes from readnaturally.com) has continued from 2012 to 2014, with further statistical analyses completed and presented in this article. The purpose of the present article is to review procedures and significant results to further assist in demonstrating utility of curriculum-based approaches with deaf and hard of hearing students.
Method
Participants and Data Collection Procedures
Required LAF scores, specifically CBA/CBM and GRADE scores, were documented after individualized and group assessment completed by the teachers of the deaf/hard of hearing and were reviewed for students in the Deaf/Hard of Hearing Program ranging from Grade 1 through Grade 12. Statistics from 2005–2006 were based on data from 25 students (eight elementary, five middle, nine high school, and three itinerant) in the Deaf/Hard of Hearing Program, while 2006–2008 statistics were based on 33 students (15 elementary, five middle, 10 high school, and three itinerant) in the Deaf/Hard of Hearing Program, and 2012–2014 statistics were based on 17 students (nine elementary, two middle, and six itinerant) in the Deaf/Hard of Hearing Program. Approximately 70% of students in the specialized Total Communication (which use sign language and spoken English) classrooms are classified as having severe/profound hearing loss, and approximately 30% have mild/moderate hearing loss.
Adapted CBA Procedures Using Read Naturally Probes
2005–2006 LAF data included CBM scores using AIMSweb (aimsweb.com); however, the Literacy Committee recommended the Deaf/Hard of Hearing Program to begin using Read Naturally Probes (readnaturally.com) in the fall of 2006 due to the advantage of Read Naturally having questions available after each passage to emphasize reading comprehension. The Deaf/Hard of Hearing Program procedures followed general Read Naturally guidelines beginning in 2006. However, more specific Deaf/Hard of Hearing Program adaptations were also developed in 2006 for the students due to the diversity in their learning and language profiles. General Read Naturally guidelines are provided below, with instructional level and word reading adaptations in italics:
Guidelines for Determining the Student’s Reading Level include the following:
Materials: Read Naturally Probes and a timer.
Assessment frequency includes a pretest in the fall and a posttest in the spring.
The teacher follows the procedure outlined in “Guidelines for Testing Reading Fluency” and gives the student the reading fluency test. Before scoring fluency, the teacher determines if the probe is on the student’s instructional level.
Instructional level is measured using the following equation: The number of words read correctly divided by the number of words attempted (Example: If the student made six errors and attempted 86 words, the number of words read correctly is 80/86 or 93%).
The student’s Independent Reading Level is considered to be 97% to 100%, the student’s Instructional Reading Level is 90% to 96%, and the student’s Frustration Reading Level is below 90%.
The teacher should report the student’s instructional reading levels on the LAFs that are turned in to the supervisor.
Weekly reading fluency tests will proceed with the probe level determined by the procedure outlined above.
The student will continue to use the determined level of probe until he masters a fluency benchmark, or reads the entire passage in less than a minute.
If the student reads the given probe with 97% to 100% accuracy, test the student with the next level probe.
If the student reads the given probe with less than 90% accuracy, test the student with a probe that is on the next level “down.”
If the student is not able to read the lowest level (level 1.0) Read Naturally Probe with 90% to 96% accuracy, continue using the 1.0 level probe for the purpose of progress monitoring the student’s reading fluency, but select easier texts for instruction and guided reading.
In this case, on the LAF that reports student progress to the supervisor, it will be necessary to write not only the words correct per minute (wcpm) at this 1.0 level, but also write the accuracy percentage under “reading level” as the student is NOT able to use a 1.0 text for instructional level (Example: If the student attempted 25 words, but only read 5 correctly in 1 min, write: wcpm = 5, with a reading level of 1.0 at 20% (5 divided by 25 = 20%).
Factors in Selecting the Correct Reading Probe Level include the following:
The teacher selects a probe that is on the student’s instructional reading level, which means that the student should be able to correctly identify 90% to 96% of the words attempted (see Guidelines for Determining the Student’s Reading Level).
The student should not be able to finish reading all of the words on the probe within the 1-min testing session.
If the student finishes before 1 min is up, select the next level probe.
If the student achieves mastery of a reading fluency benchmark for one reading level, go to the next level (Read Naturally Reading Fluency Benchmarks are from Hasbrouck & Tindal, 2006).
Guidelines for Testing Reading Fluency include the following:
Materials: Read Naturally Probe at student’s instructional reading level and a timer.
Assessment frequency includes a pretest in the fall and a posttest in the spring.
The classroom teacher should also use this procedure once weekly for progress monitoring, while itinerant teachers should monitor 2 times per month.
A baseline is obtained through the following: Three probes within a 2-week period, with picking the median (middle) score as a baseline fluency rate.
The procedure includes the following: The teacher and the student sit across from each other. The teacher has a probe in front of her or him and hands the student a copy of the same probe, instructing the student to keep it face down while receiving the directions.
The teacher gives the student these instructions: “Read aloud. You can sign only, voice only, or sign and voice. Do your best, not your fastest, reading. You will be timed. Ready? Begin.” (The student turns over the paper and begins reading.)
The teacher does not start the stopwatch until the student says or signs the first word.
As the student reads (using voice and/or signs), the teacher follows along on her examiner’s probe marking each word read incorrectly with a slash mark /.
If the student hesitates for 3 s, the teacher marks it as an error and tells the student the word. If the student finger spells a word, it is circled.
At the end of the 1 min, the teacher says, “STOP” and uses a bracket to mark on the examiner probe the last word the student read.
If the student finger spelled any words during the test, the teacher points to those words on the student’s probe and asks the student to tell her or him what the words mean. If the student can explain what the word means, and there is no sign for the word, it is counted as correct.
Scoring is as follows: Reading fluency is calculated by first determining the total number of words attempted within 1 min.
Subtract from that number the total number of words the student said/signed incorrectly.
This equation will give you the total words correct per minute (Example: 86 words attempted in 1 min minus 5 errors equals 81 words correct per minute).
Additional Notes on Marking Errors include the following:
Inserted or extra words are not counted as errors, following Read Naturally procedures.
Finger spelled words are counted as correct if the child can define or explain the word and there is no sign for the word.
If a student signs one of the conceptually accurate signs for a word, the student gets credit for that word.
Students using American Sign Language (ASL) bridges to sign English phrases get credit for each word in the phrase. Students who sign word for word English are not penalized for neglecting to sign an ASL bridge.
Omissions (other than within ASL bridge phrases) are counted as errors, again following Read Naturally procedures.
However, if a student consistently makes the same pronunciation error due to a speech impairment, the student should not be penalized for words containing that sound.
Data Analysis Procedures
A linear regression method was utilized to identify whether CBA and CBM scores significantly predicted total reading standard scores on the GRADE. Linear regression was performed for the dependent variable (total reading standard scores on the GRADE) using the independent variable (CBA and CBM scores). Correlations were also computed between the CBA/CBM scores and the GRADE scores.
Results
Fall 2005–2006 CBM Results
Outcomes Data for CBM in 2005–2006 included fall and spring Reading Fluency Words Correct Per Minute Data using AIMSweb (aimsweb.com) Probes in predominantly Total Communication specialized classrooms (22 students) and to a lesser extent general education programs (three students) with itinerant support from teachers certified in deaf education (see Table 1).
Fall 2005–2006 CBM Results.

The results from fall 2005–2006 CBM scores indicated that the adapted CBM measures significantly predicted total reading standard scores on the GRADE, which was expected and statistically significant at the .05 level. The predictor variable of CBM scores achieved a Multiple R of .502 and accounted for 25% of the variance in the criterion variable of GRADE scores.
Fall 2006–2008 CBA Results
Outcomes Data for CBA in 2006–2008 included fall and spring Reading Fluency Words Correct Per Minute Data using Read Naturally (readnaturally.com) Probes in predominantly Total Communication specialized classrooms (30 students) and to a lesser extent general education programs (three students) with itinerant support from teachers certified in deaf education (see Table 2).
Fall 2006–2008 CBA Results.
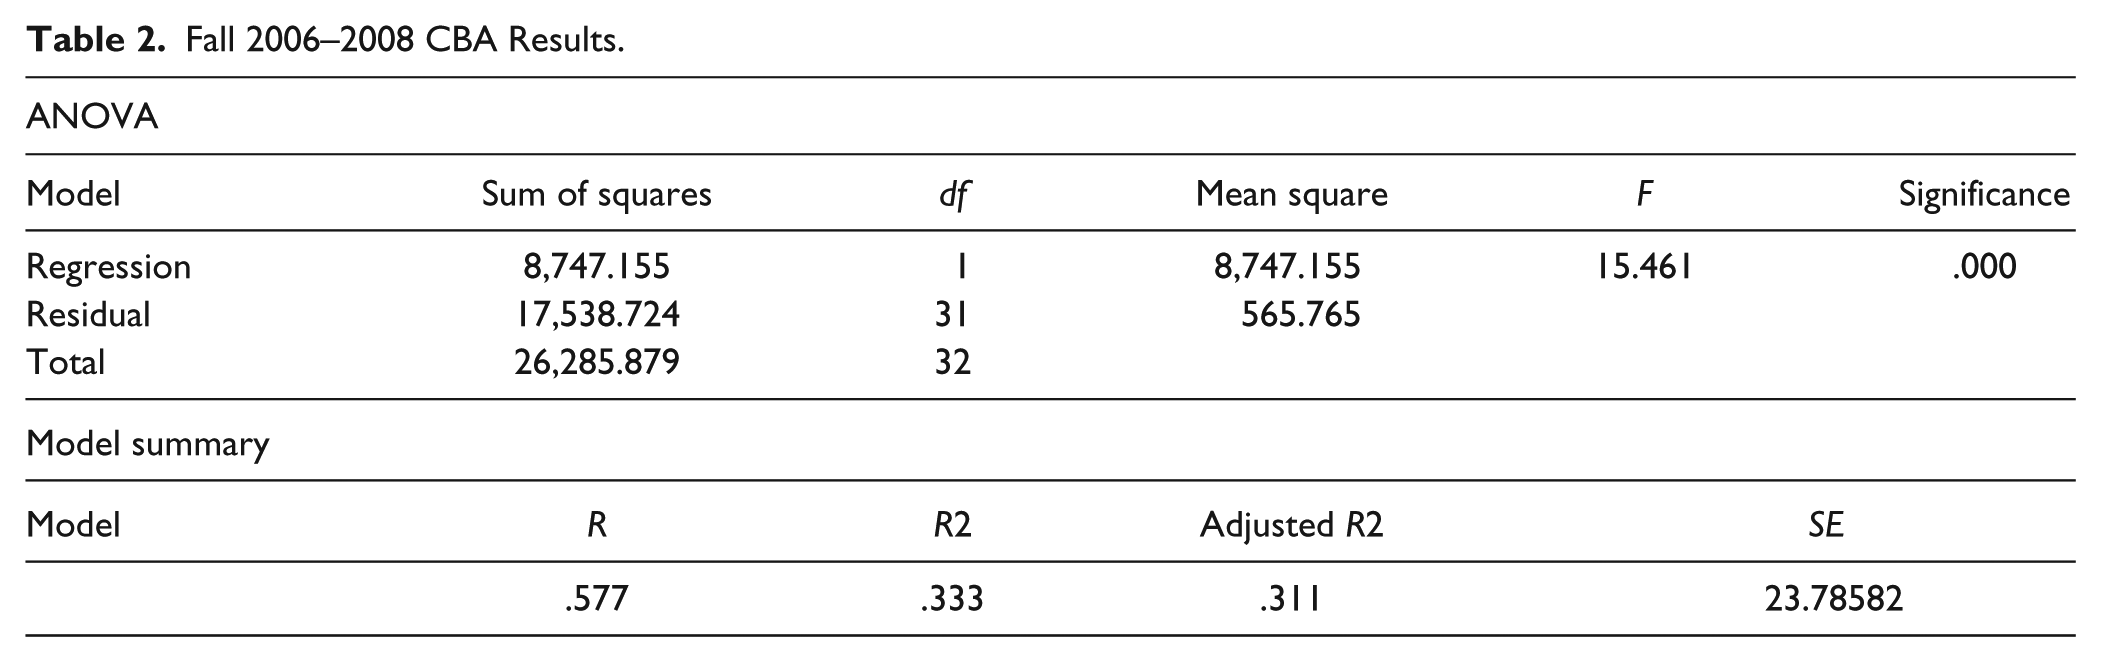
The results from fall 2006–2008 CBA scores indicated that the adapted CBA measures significantly predicted total reading standard scores on the GRADE, which was expected and statistically significant at the .01 level. The predictor variable of CBA scores achieved a Multiple R of .577 and accounted for 33% of the variance in the criterion variable of GRADE scores.
Spring 2006–2008 CBA Results
Outcomes Data for CBA in 2006–2008 included fall and spring Reading Fluency Words Correct Per Minute Data using Read Naturally (readnaturally.com) Probes in predominantly Total Communication specialized classrooms (30 students) and to a lesser extent general education programs (three students) with itinerant support from teachers certified in deaf education (see Table 3).
Spring 2006–2008 CBA Results.
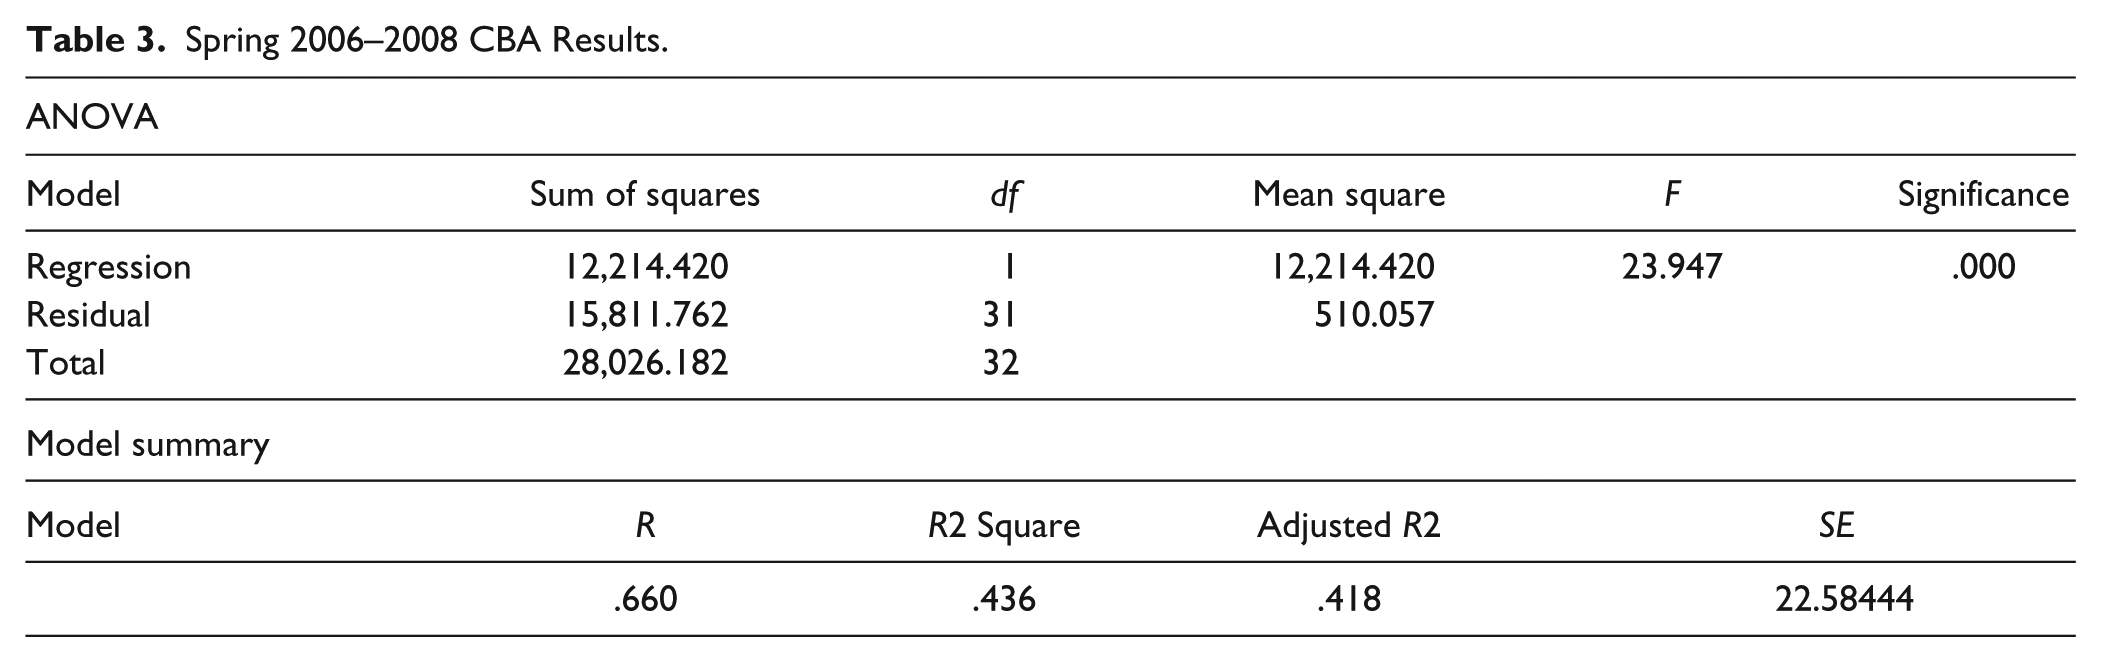
The results from Spring 2006–2008 CBA scores indicated that the adapted CBA measures significantly predicted total reading standard scores on the GRADE, which was expected and statistically significant at the .01 level. The predictor variable of CBA scores achieved a Multiple R of .660 and accounted for 44% of the variance in the criterion variable of GRADE scores.
2012–2014 CBA Results
Outcomes Data for CBA in 2012–2014 included Reading Fluency Words Correct Per Minute Data calculated for annual student IEPs using Read Naturally (readnaturally.com) Probes in predominantly Total Communication specialized classrooms (11 students) and to a lesser extent general education programs (six students) with itinerant support from teachers certified in deaf education (see Table 4).
2012–2014 CBA Results.
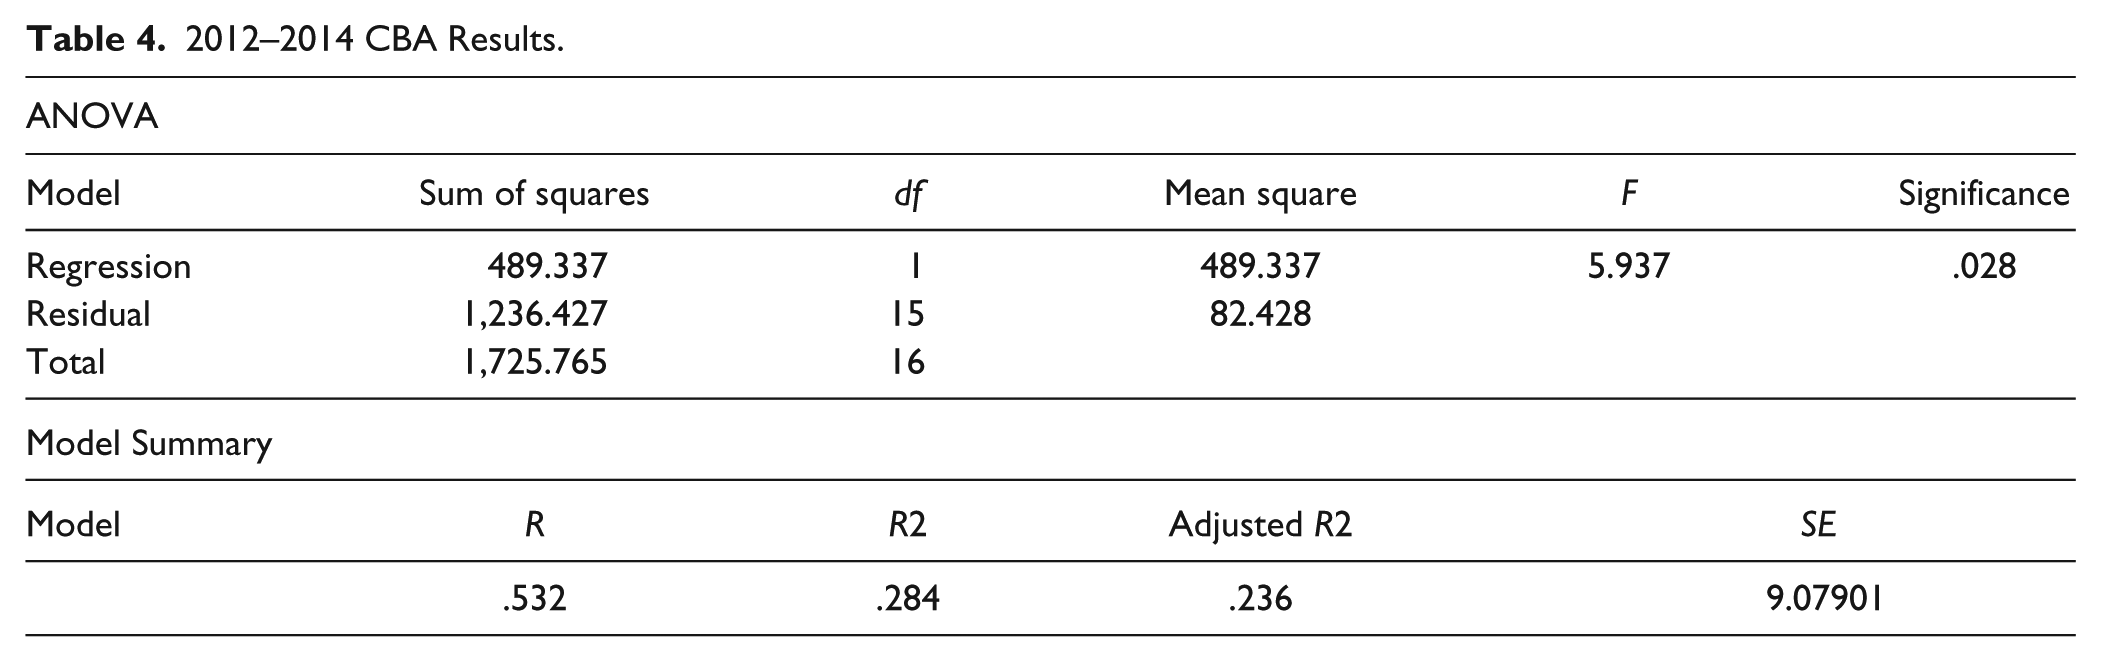
The results from the 2012–2014 CBA scores indicated that the adapted CBA measures significantly predicted total reading standard scores on the GRADE, which was expected and statistically significant at the .05 level. The predictor variable of CBA scores achieved a Multiple R of .532 and accounted for 28% of the variance in the criterion variable of GRADE scores.
Discussion
As expected, results from the statistical analyses through linear regression indicated that reading fluency scores using CBA and CBM materials adapted for deaf and hard of hearing students significantly predicted total reading standard scores from the Group Reading Assessment and Diagnostic Evaluation or GRADE (Williams, 2001) across a 10-year (2005–2008 and 2012–2014) time span. Reading fluency scores explained from 25% to 44% of the variance in GRADE total reading standard scores across this time span, which was statistically significant from the fall 2005–2006 CBM scores, fall 2006–2008 CBA scores, spring 2006–2008 CBA scores, and 2012–2014 CBA scores (p < .05).
As reported in Gibbons and Miller (2013), school psychologists reported a number of general challenges in assessing deaf and hard of hearing students, including an inadequate number of norm-referenced measures that may be administered in combination to demonstrate concordance of results. In the study, school psychologists ranged from having no experience with CBA/CBM to being completely familiar with the approach. School psychologists with familiarity considered information obtained through CBA/CBM to be extremely valuable for progress monitoring, identifying areas of academic need, informing IEP goal development, preventing learning problems, and reducing the number of referrals for comprehensive evaluations. However, concerns about the practical use of CBA/CBM included encountering resistance from teachers and school administrators.
To address concerns regarding CBA/CBM, school psychologists interviewed in Gibbons and Miller (2013) recommended using efficient measures for brief, frequent progress monitoring that result in less time spent testing students and do not overlap with, or duplicate, the results of other measures. In addition, participants in Gibbons and Miller (2013) recommended that the school psychologist assume more initial responsibility for material development and plan implementation (by modeling and providing resources and assistance), and gradually reduce involvement over time.
Results from the present article provide more support for the recommendations from Gibbons and Miller (2013). However, further research is needed to determine whether curriculum-based approaches could provide accurate, continual progress monitoring for deaf and hard of hearing students receiving regular curriculum instruction as a supplement to annual or semiannual standardized testing. Results including positive correlations and statistically significant predictive validity with one standardized achievement measure from the present article are encouraging. However, resources such as time and personnel allocation for this type of assessment could be limitations in the future, with schools perhaps using a collaborative teaming approach advocated by Luckner and Pierce (2013) to share resources and insure adequate assessment is completed. In addition, examining how curriculum-based approaches correlate with and predict other standardized achievement measures is needed, as well as examining correlations and predictive validity between measures other than words correct per minute within curriculum-based approaches and scores other than total reading scores on standardized achievement tests.
Footnotes
Acknowledgements
The author would like to acknowledge the Lancaster-Lebanon Intermediate Unit 13 Deaf/Hard of Hearing Program Literacy Committee, especially Teresa Fleming, for sharing their extensive expertise in the development of this publication.
Declaration of Conflicting Interests
The author(s) declared no potential conflicts of interest with respect to the research, authorship, and/or publication of this article.
Funding
The author(s) received no financial support for the research, authorship, and/or publication of this article.