
Abstract
Mixed method designs are often used in scale development to generate potential items and enhance face validity. Less frequently, mixed method designs are used to examine other aspects of validity. As part of a larger evaluation in the Lao People’s Democratic Republic, we developed a scale to assess household self-reported changes in access to livelihood assets following a mine action program. In this article, we detail the process of assessing measurement validity using mixed methods. The qualitative method of evaluation was based on an analysis of in-depth interviews with key informants. The quantitative evaluation relied on data collected from the scale administration (N = 271) evaluated using Rasch measurement. The article offers an example to researchers interested in using mixed methods to assess validity in measurement development. It contributes to the growing literature on using mixed method designs to evaluate the properties of scales and to the methodological work on the measurement of access to livelihood assets.
Background
There is a large body of literature related to procedures in the development, validation, and revision of quantitative instruments. Often researchers developing quantitative instruments employ a mixed methods design combining qualitative and quantitative methods (Coates et al. 2006; Creswell 2009; Frongillo and Nanama 2006; Greene 2007; Luyt 2012; Onwuegbuzie et al. 2010; Tashakkori and Teddlie 2003; Teddlie and Tashakkori 2009). A common design is a sequential mixed methods design in which the results of the qualitative component are used to inform questions and scale items for a quantitative survey (Creswell 2009; Onwuegbuzie et al. 2010; Teddlie and Tashakkori 2009). Frequently, having developed and administered scale items, quantitative data are used to assess the psychometric properties of the instrument (Onwuegbuzie et al. 2010). A still developing methodology is the use of mixed methods throughout the scale development process, including measurement validation and revision (Luyt 2012; Onwuegbuzie et al. 2010).
This article uses an example from a mine action program that removes post-conflict landmine and unexploded ordnance (UXO; e.g., unexploded bombs, cluster munitions) for humanitarian rather than military purposes, in the Lao People’s Democratic Republic (PDR) to detail assessing measurement validity of access to a livelihood assets scale using mixed methods. Validity evidence was derived from qualitative in-depth interviews and quantitative questionnaire data analyzed using Rasch measurement (Rasch 1960). The article contributes to the growing literature on mixed method designs to evaluate the properties of scales and the methodological work on the measurement of livelihood assets.
The overall question we sought to address was to what extent the mine action program contributed to increasing household access to livelihood assets. Due to the absence of baseline data and a validated outcome measure, one of our first tasks was to develop a self-reported measure of change in access to livelihood assets following landmine/UXO clearance. Access to livelihood assets is socially constructed, based not just on availability but also people’s ability to access assets making objective measures alone inadequate (Bebbington 1999; Ellis 2000; Frongillo and Nanama 2006; van Dijk 2011). Proxy measures such as consumption and expenditure are commonly used but provide only partial information; more recently, attention has turned to developing scales that measure access to assets (Harttgen and Klasen 2012; Hulme and McKay 2005; Moser and Felton 2007; Webb et al. 2006).
Researchers developing livelihood asset scales or indices suggest various methods and techniques to construct such instruments including using qualitative methods to identify scale items (Harttgen and Klasen 2012; Hulme and McKay 2005; Moser and Felton 2007; Webb et al. 2006). Factor analysis and its variants are widely used to obtain quantitative validity evidence (Hulme and McKay 2005; McKay and Ansoms 2010). In this article, similar to approaches to measuring access to food security (Coates et al. 2006), we offer an example of developing an access to livelihood asset scale using qualitative data and Rasch (1960) measurement.
Research Design
The setting for this research was Paksong district, a highly UXO contaminated district in southern Lao PDR. The district was purposively chosen based on level of contamination, two linguistic groups (Lao-Tai, Mon-Khmer), and the presence of different mine action operators.
The theoretical basis for the evaluation was the livelihoods approach (Ashley and Carney 1999; Ellis 2000). We followed Ellis (2000) in our operationalization of livelihood assets as follows:
Human (knowledge, ability to work, and good health).
Natural resource stocks (land, forest, natural water sources).
Financial (savings, credit, remittances, pensions).
Social resources and networks (familial and community networks, networks outside of one’s immediate community).
Physical (basic infrastructure such as roads and communication networks).
Two reference groups were established at the outset of this project. One was composed of five representatives from different mine action organizations; the other was composed of local representatives. The reference groups provided feedback related to overall research design, scale items, and analysis. This initial phase of instrument development was a sequential mixed methods design and involved identifying and piloting items. This phase was undertaken in early 2009 and has been reported elsewhere (Durham et al. 2010, 2011). This article reports on the next stage of development; it was undertaken in June 2010 when we administered and validated the instrument.
Briefly, in selecting items for the quantitative instrument, we first reviewed the livelihoods literature and consulted with the reference groups to define the different livelihood assets we intended to use in the instrument. Qualitative interview data were analyzed using thematic analysis guided by the livelihoods literature and the definitions we had developed for each of the classes of assets. Through analysis of the qualitative data, we identified items under each of the livelihood assets as described by participants. Candidate items were then circulated to the reference groups to see to what extent they felt the items: (1) related to the relevant livelihoods assets; (2) covered the range of likely changes to livelihood assets; (3) were appropriately worded for the target population; and (4) were likely to be understood across the ethno-linguistic groups of the target population.
The questionnaire was piloted with feedback from the enumerators and respondents about the wording of the items. Feedback was used to modify wording of the items, then the final scale was translated and back translated by independent translators and checked with the local reference group. In the stage of the research we report on here, the instrument was administered (N = 359) and validity assessed using Rasch (1960) measurement supported by insights from qualitative data.
Rasch Measurement
In Rasch (1960) measurement, data collected from items for a scale such as a Likert scale are tested against the expectations of the Rasch measurement model. The principles underlying the Rasch model are a trait is quantitative and measurable; the underlying or latent trait is unidimensional; measurement is related to the individual, not to population distribution; and the criterion for successful measurement is in meeting a priori requirement, and not based on assumptions about distribution. The strength of Rasch model is its emphasis on the requirements for fundamental measurement: The data must fit the Rasch model and the test items and individuals must conform to the model before claims about the presence of a latent trait can be considered valid. Hence, items should be comparable independent of individuals, and a comparison of individuals should be independent of items measured.
For a good fitting model, respondents with high levels of the trait being measured would consistently endorse high scoring responses to each of the items; respondents with low levels of the trait would endorse low scoring responses. This is indicated by an ordered set of response thresholds for each of the items (Pallant and Tennant 2007). Threshold refers to the point between two response categories where either response is equally probable. A common source of item misfit to the model is respondents’ inconsistent use of these response options, resulting in disordered thresholds (Pallant and Tennant 2007). This can result from having too many response options or if the labeling of options is potentially confusing or open to misinterpretation.
We selected Rasch (1960) measurement rather than other techniques such as exploratory and confirmatory factor analysis because as well as testing for unidimensionality, we wanted to use the access to livelihood assets scale with two different ethno-linguistic groups. Ideally, demographic characteristics should not affect the response. Where such factors affect the response, even after controlling the score of the variable being measured, an item is said to have differential item functioning (DIF; Pallant and Tennant 2007). Rasch measurement allows researchers to test for DIF (Hobart and Cano 2009; Pallant and Tennant 2007). Where an item has DIF respondents with similar levels on the construct being measured (e.g., access to social assets) but belong to different populations, respondents have a different probability of responding to an item. Such items are a threat to instrument validity where the intent is to measure levels of the construct of people from different populations because their scores may indicate a variety of attributes other than those the scale is intended to measure (Thissen et al. 1993).
It is particularly important to test for DIF where the intent is make meaningful comparisons across different population groups (Coates et al. 2006). An estimate of the internal consistency of the scale is available, based on the Person Separation Index (PSI) where the estimates on the logit scale for each person are used to calculate reliability. The PSI is interpreted in a similar way to Cronbach’s α with PSI = .7 or higher considered adequate (Pallant and Tennant 2007).
We were also concerned that some items might be too easy or too difficult to endorse depending on context, that we might encounter ceiling effects, and that given livelihoods can be diverse, a “not applicable” option was also required. The Rasch (1960) model provided a sophisticated mathematical approach addressing these methodological aspects associated with measurement validation by testing the data against the expectations of the Rasch measurement model (Hobart and Cano 2009; Pallant and Tennant 2007). Further, where the data fit the model, a linear transformation of the raw ordinal score is obtained, allowing valid parametric approaches given appropriate distributions. In addition, by ordering households along a continuum the interval scales produced by fitting the data to a Rasch model makes it possible to determine the distance between two intervals allowing a more precise measurement of change (Webb et al. 2006).
Methods
Sample
The qualitative component used purposive sampling of households who had received UXO clearance (n = 33). The sample aimed to account for diversity and included households with different levels of perceived program impact, land use, and wealth. To avoid overburdening respondents, a parallel sampling strategy was used with different individuals included in each component but from the same population of interest (Creswell 2009). In addition, key informants including program and local government staff, including staff from the District Agriculture and Forestry Office and the Labour and Social Welfare Office were selected (n = 11).
The quantitative sample was selected using a two-stage probability according to size, cluster sampling method with 30 clusters selected (Oyeyemi et al. 2010). In each cluster, using the mine action database, a list of households who had received UXO clearance was prepared, then households within each cluster were selected using systematic random sampling. The total number of people interviewed was 359; 88 respondents were excluded from the analysis, as they reported not being aware of any clearance activity in their village. The final number of people included in the analysis was 271 (female n = 165; male n = 106). All respondents were 18 years of age or over.
Data Collection
The lead researcher (Durham) and a local researcher conducted in-depth interviews with participants in the preferred language of the respondents, using a semistructured interview schedule guided by the livelihoods approach. Durham and the coresearcher were also participant observers. Throughout the fieldwork, they observed, recorded, and made notes of the socioeconomic status of the villages, the environment, post-clearance land use, and household conditions, including relative level of wealth and patterns of responses.
Trained enumerators administered the self-report livelihood asset scale in face-to-face interviews. This was partly due to concerns about respondent literacy levels and familiarity with questionnaires. It was also a way of gaining some understanding of any items that posed difficulty for respondents either conceptually, or due to choice of wording. Durham and the coresearcher provided training and closely monitored data collection. All questionnaires were checked for completeness and consistency during the fieldwork. Before each interview, the interviewer explained the research objectives and methods, and verbal consent was obtained.
Measures
Sociodemographic variables of the participants included sex, age, education, occupation, household size, and ethnicity as well as type, area, and pre- and post-clearance land use. The access to livelihood asset scale was divided into four subscales based on the four classes of livelihood assets of interest (social, physical, finance, human, and natural). The total scale consisted of 44 items. Each item consisted of a stem and a four-point forced response Likert-type format with respondents asked to rate how much change had been observed from “a lot worse than before” to “much improved.” A four-point forced choice scale (e.g., “a lot worse,” “worse,” “better,” and “much better”) has been found to be most appropriate in contexts of low educational attainment (Samman 2007). A “not applicable” option was also included.
Data Analysis
Qualitative data were transcribed in the language of the interview, checked against the transcripts, and translated into English. Durham and the coresearcher analyzed the qualitative data using thematic analysis with the livelihoods framework as a guide. This is commonly used qualitative method to identify, report, and analyze data (Miles and Huberman 1994; Patton 2002).
Quantitative data were analyzed using IBM SPSS 19, and 5% of the data entry was randomly checked by an independent researcher. Analysis of the scale data proceeded in two main stages. The first was an inspection of each individual item. The purpose of this was to identify those items with 20% “not applicable” response rates and to examine each response category for pattern and spread of responses across the response categories. Where responses of “not applicable” exceeded 20%, the item was highlighted for further qualitative exploration. The scale data were then prepared for Rasch (1960) analysis using RUMM2030 software (Andrich et al. 2010).
Data Analysis Using the Rasch Model
The data were analyzed using standard Rasch (1960) measurement protocols as outlined by Pallant and Tennant (2007). The partial credit model, the default in RUMM2030 was used. Likelihood ratio tests for all scales were significant, supporting use of a partial credit model (Ramp et al. 2009; Shea et al. 2009; Tennant and Conaghan 2007).
The Rasch (1960) analysis produced three overall fit statistics, which were inspected to determine overall fit to the model. The statistical significance of the item–trait interaction was assessed using the χ2 statistic. A significant χ2 score suggested the hierarchical ordering of items varied across the trait, compromising the property of invariance. Bonferroni corrections were applied to the chi-square p value, to take account of multiple testing, by dividing the number of items by .05 (Bland and Altman 1995). The two other fit statistics were the individual and item person fit statistics provided as residuals and a χ2 statistic.
The response scale was assessed for appropriateness by inspecting items for “disordered thresholds.” Internal consistency was assessed based on the PSI. Items were also examined through response residuals and inspection of the p value with Bonferroni correction (Bland and Altman 1995) and for DIF based on ethno-linguistic group. The residual correlation matrix was inspected for evidence of local dependency, with a correlation residual of more than .3 indicating local dependency. Local dependency occurs when the response to one item is dependent on the response to another item (Pallant and Tennant 2007).
The Rasch (1960) model assumes unidimensionality, but the RUMM2030 software allows for further testing of dimensionality using principal component analysis (PCA) techniques. Factor loadings on the first component were used to determine two subsets of items—those that showed the most difference to one another. Paired t-tests were used to test the significance of the difference between two estimates of the same person (the logit of person endorsement of items) derived from the two subtests. Where the number of significant cases was above 5%, a 95% confidence interval around this estimate was obtained (Henson et al. 2010). Further validity evidence for the final solutions was provided through qualitative feedback from the two reference groups and the literature.
Results
Demographics Profile of Respondents
Respondents were either Lao-Tai (N = 165) or Mon Khmer (N = 106). Of our respondents, 94% (N = 249) reported that their main occupation was farming. Ninety-three percent (N = 253) of households were male headed. In 91% of households (N = 247), at least one adult had completed primary school.
Descriptive Analysis
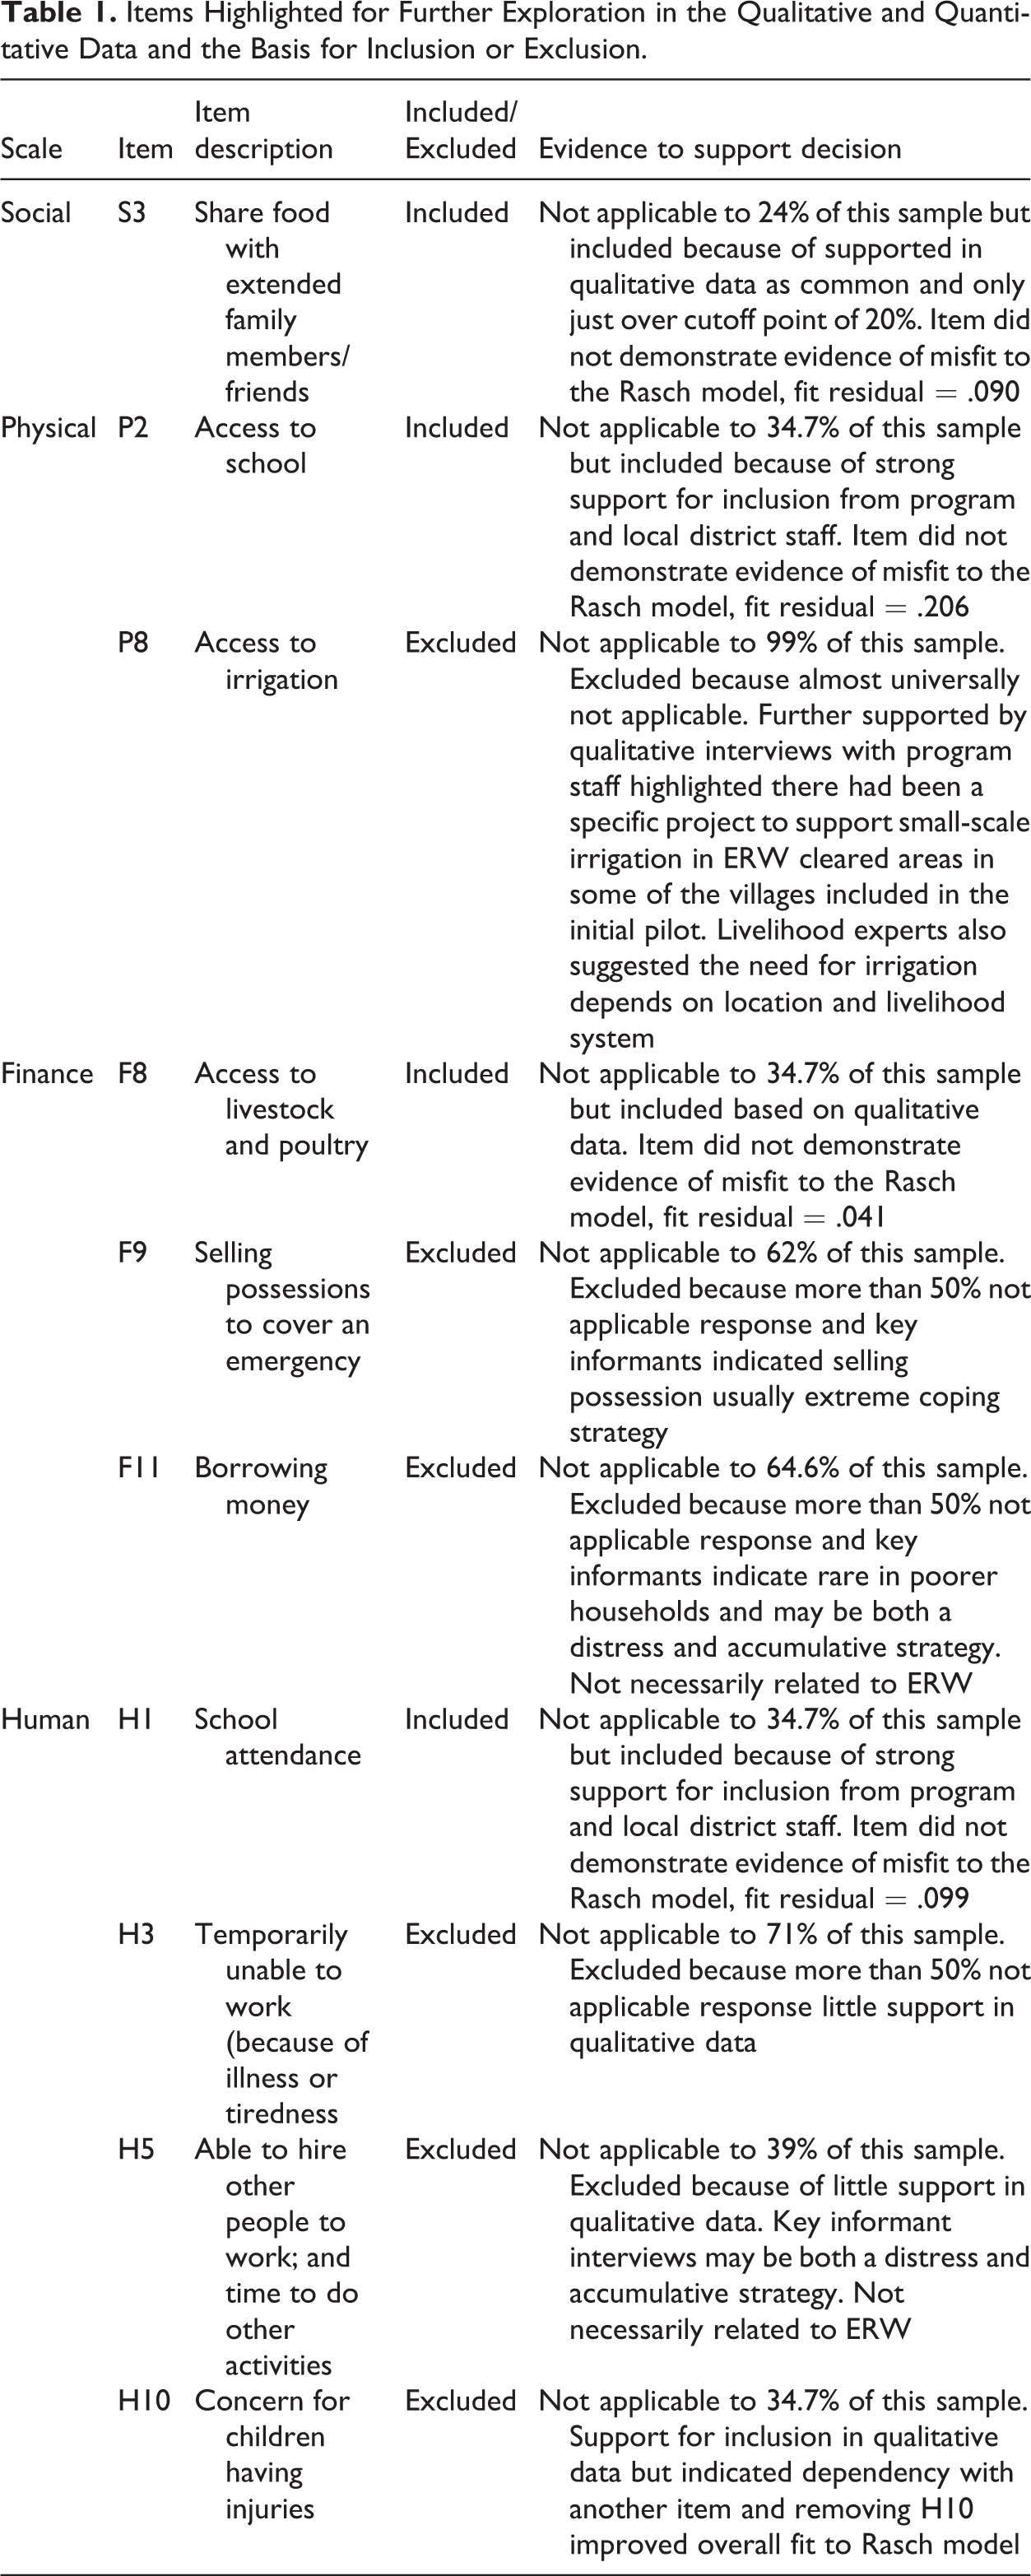
The initial item analysis using SPSS identified that responses for most items were predominantly skewed to the positive side of the scale. Ten items (S3, P2, P8, F8, F9, F11, H1, H3, H5, and H10) had a “not applicable” response rate of over 20%. Table 1 shows these 10 items and whether the items were retained or excluded from the Rasch (1960) measurement and the basis for the decision. Only 3 items were related to natural resources E1 (much land without UXO for growing crops): E2 (community land without UXO) and E3 (access to water for farming/gardening); these were excluded from the Rasch analysis because of a lack of variance in the responses and the small number of items. The scale data were then prepared for Rasch analysis using RUMM2030 software (Andrich et al. 2010).
Items Highlighted for Further Exploration in the Qualitative and Quantitative Data and the Basis for Inclusion or Exclusion.
Social Subscale
Exploration of item S3 (sharing food) in the qualitative data suggested this was a common theme, particularly where decontaminated land was used for staple or cash crops, vegetables, or fruit trees. The following quote from the qualitative data expresses a common sentiment and helps exemplify this: “More food means we can share with others and it is easier for us participate in social activities/ceremonies [usually everyone participates in contributing to the food for festivals and other social events].”
Concepts such as being together, sharing, and partying were often seen in the qualitative interviews as being core of what it is to be part of village life and experience “the good life.” The local reference group also felt that sharing food represented a behavior that was characteristic of household livelihood well-being. Access to other assets (e.g., an access road or a drinking water source in the village) were other examples of how people accumulated other assets, such as more vegetables that they could share. On the basis of the qualitative data and the response rate, which was only slightly over 20%, a decision was made to retain the item pending further exploration using Rasch (1960) analysis.
Physical Subscale
Access to school (P2) were common reasons given for UXO clearance, and program and district staff felt this was an important item to retain. Further analysis of the qualitative data, however, revealed that most schools were primary level. One explanation for the low response rate was the number of households without primary school-aged children.
Access to irrigation (P8) was found to be a factor specific to post-ERW clearance intervention in one particular location. Further checking with program staff and key informants from the district confirmed this. In addition, the qualitative data from program recipients suggested that almost all of the farming relied on rain-fed water systems. This qualitative evidence revealed the possible reason for this result and, given its low applicability across the program as a whole, it was not included.
Finance Subscale
There was little evidence in the qualitative component from program beneficiaries to support items F9 (selling possessions) and F11 (borrowing money). The qualitative evidence suggested that in times of stress, households, especially poorer ones, would typically adjust their livelihood strategy rather than go into debt. For example, one person may go to work outside the village, or the household may substitute rice (the staple) with tubers until the next harvest. This was supported in interviews with program and district staff. These interviews also noted that selling possessions and borrowing money may be due to negative pressures or may be positive strategies used to accumulate other assets. Based on the qualitative evidence and the very low response rate, these items were not retained for Rasch (1960) analysis.
Item F8 (access to livestock and poultry) was included because the qualitative data suggested it was common practice, and respondents reported investing in livestock as an important form of saving. This was also supported by the program staff and sector experts. At this stage, the item was noted for possible deletion but included in the Rasch (1960) measurement.
Human Subscale
Limited support was found for items H3 (temporarily unable to work) and H5 (able to hire others). Qualitative interviews with program and district staff suggested that in a rural setting such as this, selling labor could be both a positive and a negative livelihood activity. Further, the ability to sell or hire labor is dependent on access to markets and the availability of itinerant workers, which the qualitative data suggested may be more relevant to one particular area. For these reasons, these items were not retained for further analysis The item H1 (school attendance) was retained, as this was often referred to in the qualitative data and found strong support among program staff and sector experts.
Rasch Analysis
Social Subscale
All eight of the initial items were retained and entered into RUMM2030. The overall model fit statistics were nonsignificant (χ2 = 31.57, df = 24, p = .13). Two items showed disordered thresholds as shown in Figure 1.

Threshold map for social scale showing disordered thresholds for items S4 and S8.
One person showed a fit residual of 2.65. Deleting this case resolved one of the disordered thresholds and improved overall model fit (χ2 = 24.35, df = 24, p = .44). Additional support for unidimensionality came from t-tests performed on the person estimates identified from PCA. Given good overall fit to the model, the scoring structure was retained.
Physical Subscale
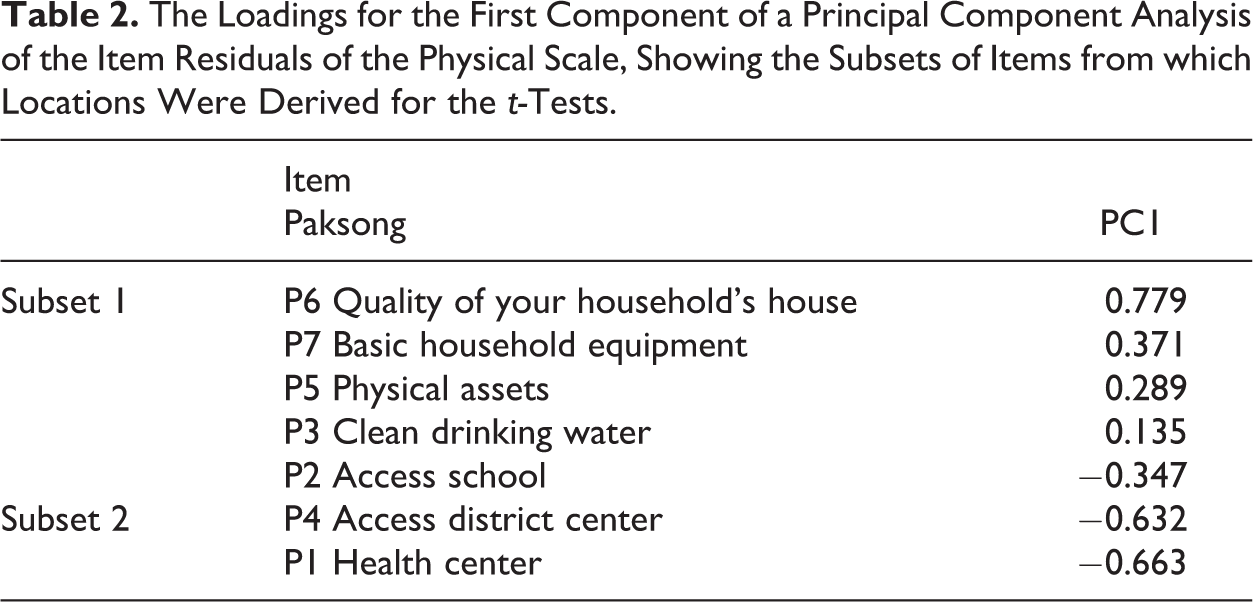
After deleting P8, the remaining 7 items were entered into RUMM2030. The subscale revealed a good fit to the Rasch (1960) model (χ2 = 20.49, df = 21, p = .49) and no misfitting items. There was further support for the unidimensionality based on independent t-tests comparing person estimates from the two subtests (Table 2) identified using PCA. Five items showed disordered thresholds but given the good overall fit, the original scoring was retained.
The Loadings for the First Component of a Principal Component Analysis of the Item Residuals of the Physical Scale, Showing the Subsets of Items from which Locations Were Derived for the t-Tests.
Finance Subscale
Based on the descriptive and qualitative analysis, 9 items were subjected to Rasch (1960) measurement. A good fit to the model was observed (χ2 = 55.99, df = 36, p = 0.01 with Bonferroni correction 0.5/9 = 0.005). PCA of the residuals of the remaining 9 items and independent t-tests on the two most contrasting item subsets supported unidimensionality. Three items showed disordered thresholds, but given the good overall fit the original scoring was retained.
Human Subscale
Ten items were entered for Rasch (1960) analysis. The subscale initially showed poor fit to the model (χ2 = 46.61, df = 20, p ≤ .001). Deleting one person with a fit residual of 2.93 improved overall fit, but still did not meet model expectations fit (χ2 = 42.54, df = 20, p = .002). Two items H10 (concern for children having injuries) and H8 (concern for adults in your household having injuries) indicated local dependency (residual correlation = .48). One item (H10) was deleted, as this had the fewest responses. This improved overall model-fit (χ2 = 27.12, df = 18, p = .07) and unidimensionality was supported by PCA and t-tests.
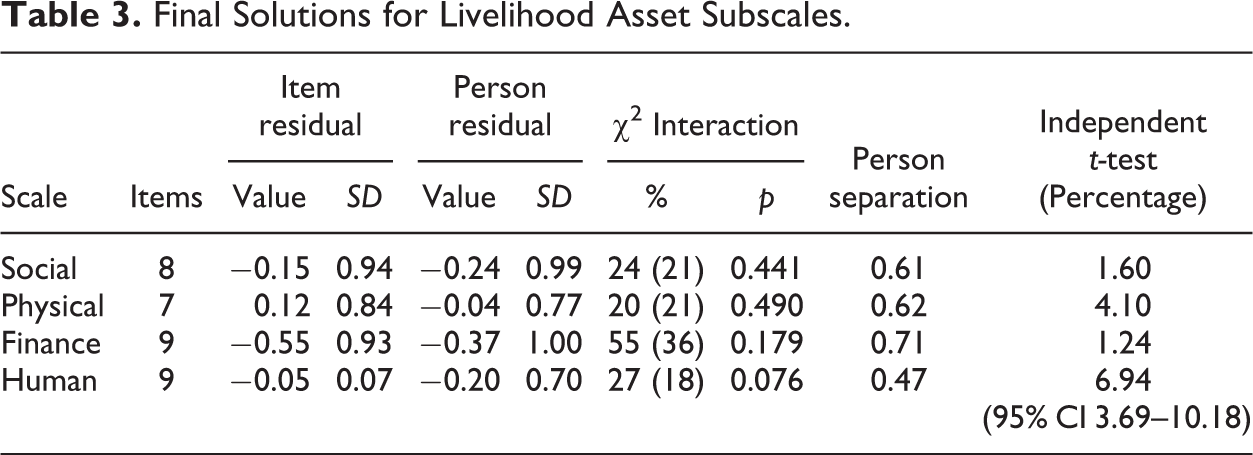
In each of the sub scales, there was no evidence of DIF for ethno-linguistic group. Table 3 shows the final solutions and fit statistics.
Final Solutions for Livelihood Asset Subscales.
Discussion
This article has provided an example of how mixed methods can be used to strengthen validity claims for quantitative instruments. In the example discussed here, we used Rasch (1960) measurement and qualitative data derived from in-depth interviews. Challenges associated with developing measures of complex and important concepts before they are clarified are discussed in Webb et al. (2006) in relation to food insecurity. Evaluation of this livelihood asset scale focused on measuring access to livelihood assets using both qualitative and quantitative approaches to measurement and use of the Rasch model to obtain fundamental measurement.
Initially, five classes of livelihood assets were selected from the livelihood literature (Ashley and Carney 1999; Ellis 2000) and specific items were derived from interviews with program staff, sector experts, and local representatives. Qualitative information was gathered through interviews and observation. This was used to provide interpretive and explanatory local cultural information about access or lack of access to livelihood assets and contributed to decision making about whether to retain or delete items. Only four classes of livelihood assets were included in the final scale. Natural assets were excluded due to a lack of variance in the responses.
In total, 10 items were identified as having above the required “not applicable” response rate. Of these, four were retained for the Rasch (1960) analysis based on the qualitative data. The final solutions fit the Rasch model further supporting retention of these items. The explanation for some items having a high “not applicable” response rate may be due to the initial qualitative work and piloting being undertaken in one district. The purposive method of sampling used in the first stage of the scale development may also have contributed by producing a nonrepresentative sample. This suggests the need for qualitative research to have wide geographical reach if the intent is to develop universally applicable items. A similar finding was reported by Coates et al. (2006).
A number of items showed disordered thresholds, demonstrating inconsistent use of the response categories. The category frequencies for each item showed a skewed distribution, with responses at the positive end of the response scale. This may be because the tool was administered post-intervention and is almost certainly the explanation for lack of variance in the items related to the natural assets. Further, observation and qualitative interviews with respondents also suggested that the decontamination of land attracted development projects and increased access to other assets, explaining the skewed distribution.
To conclude, the article has provided an example of combining qualitative methods with Rasch (1960) measurement to assess construct validity in quantitative instruments. The use of qualitative inquiry helped explain issues of variability and provided a more accurate accounting of contextual factors and basis for interpreting “not applicable” response rates. Both the qualitative and the quantitative findings supported the operationalization of the livelihood assets and the premise that mine action supported access to livelihood assets. If this had not been the case, theoretical reconsideration would have been required including revisiting the initial instrument development (Luyt 2012). In our example, having reviewed items using both qualitative and quantitative data, the data demonstrated fit with the Rasch model. Applying and documenting the use of mixed method designs in instrument development can enhance validity when the results converge. If, on the other hand, the data sets diverge, the qualitative can help explain why and point to further areas of research.
Footnotes
Authors’ Note
Curtin University of Technology (Perth, Western Australia) Human Research Ethics Committee and the National Regulatory Authority of the Unexploded Ordnance (UXO) sector in the Lao PDR approved the research. Permission for the study was also obtained from the relevant provincial, district, and village authorities.
Declaration of Conflicting Interests
The author(s) declared no potential conflicts of interest with respect to the research, authorship, and/or publication of this article.
Funding
The author(s) received no financial support for the research, authorship, and/or publication of this article.